
Abstract
The goal of this work was to quantify the in vivo transport and binding parameters of [F-18]fallypride and the D2/D3 receptor density (B′max) in both the striatal (putamen, caudate, ventral striatum) and extrastriatal regions (thalamus, amygdala, cerebellum, temporal and frontal cortices) of the rhesus monkey brain. Multiple-injection PET experimental protocols with injections of radiolabeled and unlabeled doses of fallypride were used to estimate the K1, k2, kon/VR, koff and B′max kinetic parameters. The experimental design was chosen using the D-optimal criterion to maximize the precision of the estimated binding parameters for the various brain regions. There was a significant range in B′max for the putamen (27pmol/mL), caudate (23pmol/mL), ventral striatum (14pmol/mL), thalamus (1.8pmol/mL) and amygdala (0.9pmol/mL). Significant receptor binding was also found in the cortical regions. Knowledge of these in vivo rate constants serves as a necessary step in using [F-18]fallypride PET to measure D2/D3 receptor density and drug occupancy in clinical research applications. We believe the precise parameter estimates derived from these complicated experimental protocols are necessary for proper application of drug occupancy and clinical research studies with [F-18]fallypride, which often rely on the validity of assumptions regarding the model parameters.
There is continued interest in studying the D2/D3 dopamine system of the brain as applied to neurological and psychiatric illnesses. With the introduction of greater affinity, higher D2/D3 receptor-selective PET radioligands, it is now possible to study receptor binding outside the D2/D3 receptor dense striatal regions, in less dopamine receptor-rich areas such as the thalamus, amygdala and cortex (Halldin et al., 1995; Kessler et al., 1993a; Mukherjee et al., 1995). For example, there may be clinical value in measuring regional selectivity of antipsychotic drugs for the D2/D3 receptor site (Farde et al., 1997; Mukherjee et al., 2001; Pilowsky et al., 1997).
[F-18]Fallypride was developed to measure D2/D3 dopamine receptor binding in both the striatal and extrastriatal regions of the brain (Mukherjee et al., 1999; Mukherjee et al., 2002). Preliminary work in characterizing the in vivo kinetic rate constants in nonhuman primates revealed very rapid specific binding to the receptor sites, particularly in the striatum (Christian et al., 2000). As is the case for most single bolus injection PET protocols, it was not possible to separate out the processes of radiotracer delivery and specific ligand-receptor binding. Thus, our previous work was limited to the measurement of an index of receptor binding, such as binding potential (Mintun et al., 1984).
Initial work on designing PET experiments to separately measure the available receptor density, B′max, and the association (kon) and dissociation (koff) rate constants required several injections of radiolabeled and unlabeled ligand (Delforge et al., 1990). These multiple-injection protocols effectively decouple B′max and kon by significantly altering the number of available receptor sites during the course of the experiment. Such multiple-injection PET studies have been implemented to measure B′max of D2 dopamine receptors (Delforge et al., 1991), dopamine transporters (Morris et al., 1996), endogenous ligand concentration (Delforge et al., 2001) and benzodiazepine receptors (Millet et al., 1995) in the brain as well as several receptor systems in the heart (Delforge et al., 1993; Muzic et al., 2000). The experimental complexity of multiple-injection protocols coupled with the administration of pharmacological doses of drug, frequently limits these studies to animal models. However, determination of the kinetic rate constants plays an important role in validating simplified experimental protocols more appropriate for clinical research in humans.
The goal of this work was to design and implement a multiple-injection protocol to i) directly measure the in vivo rate constants of fallypride and ii) to obtain a measurement of the in vivo D2/D3 dopamine receptor density, B′max. It is not possible to measure B′max in all brain regions (ranging 0 ∼ 50 pmol/mL) from a single multiple-injection experiment because protocols are optimized for a narrow receptor density range. A special emphasis was placed on characterization of the thalamic region, which has been implicated in dopamine related diseases such as schizophrenia and substance abuse.
MATERIALS AND METHODS
Chemical Synthesis of [F-18] and [F-19] Fallypride
The production of [F-18]fallypride, ((S)-N-[(1-allyl-2-pyrrolidinyl)methyl]-5-(3′-18F-fluoropropyl)-2,3-dimethoxybenzamide) was carried out using previously reported methods (Mukherjee et al., 1999) with modifications to improve the radiochemical yield (Shi et al., 2002). The average specific activity of [F-18]fallypride was 2800 Ci/mmol at the time of the first injection of the PET experiment. For the partial saturation injections, unlabeled fallypride was co-injected with the [F-18] radiolabeled species. The “cold” fallypride (M.W.=365) was synthesized using natural fluorine ([F-19]) according to published methods (Mukherjee et al., 1995). Prior to injection for the PET experiment, the appropriate amount of fallypride was withdrawn from the stock solution (2μg/μl dissolved in acetonitrile). The solvent was evaporated by bubbling with N2, and the fallypride reconstituted in sterile saline and mixed with the [F-18]fallypride (total volume = 3mL sterile saline) prior to injection.
Optimization of Experimental Design
The compartmental model employed for this work is shown in Fig. 1. The state equations for describing the kinetics of the parameters follow the notation previously described for multiple injection studies (Delforge et al., 1990; Muzic et al., 2000) with the parameter definitions given in Table 1. For an experiment with i injections, the equations are given as:
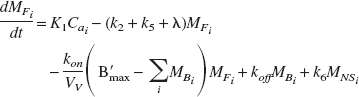
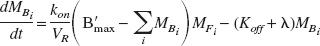
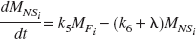
The measured PET signal is a weighted sum of the free (MFi), nonspecifically bound (MNSi) and specifically bound (MBi) compartments as described by:
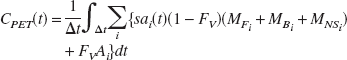
for all of the i injections each with a unique specific activity (i.e. ratio of radioactivity to total mass of ligand) decaying with a half life of the flourine-18 radiolabel. The specific activity term, sai, converts the ligand concentrations to units of PET signal (nCi/mL) resulting in both terms of the integrand having the same units, scaled by their respective volume fractions (Fv is fixed to 0.04 in all regions). It should be noted that if only unlabeled ligand is injected (i.e. sai= 0), there will be significant ligand in the corresponding compartments (free, bound and nonspecific), however, these species will not contribute to the PET signal.
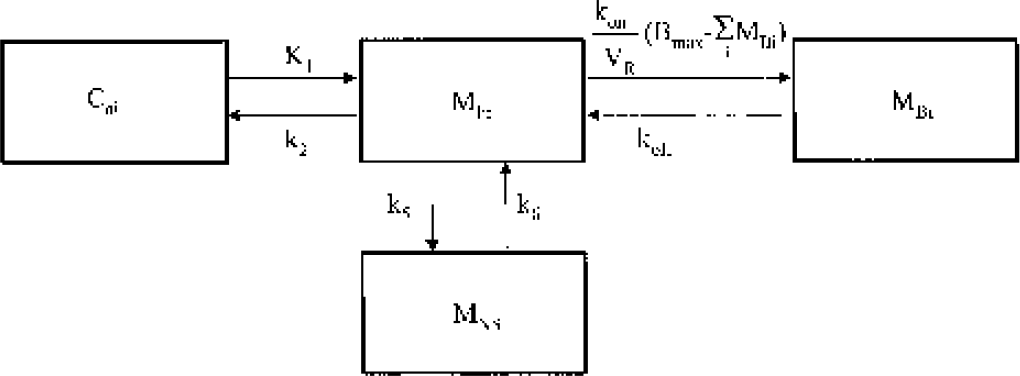
The three tissue compartmental model used for the analysis of the fallypride kinetics. The model accounts for the kinetics of both the radiolabeled and unlabeled fallypride. The radiolabeled (i.e. PET signal) component of the model is obtained by multiplying each compartmental concentration by the time-dependent specific activity, sai.
List of symbols
In order to accurately identify each of the kinetic parameters it is necessary to significantly occupy the receptor sites, thus lowering the available receptors, B′max −∑MBi, to various levels during the study. Under equilibrium conditions, the percent occupancy of the receptor sites is independent of receptor density B′max, as given by:
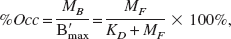
which depends only on the free ligand concentration and equilibrium dissociation constant, KD. Equation (5) suggests that the percent occupancy is constant in all regions of brain, independent of receptor density. This is not the case for single injection PET studies because the ligand is not at equilibrium in all regions at the same time. The time needed to reach equilibrium between free and bound species is dependent on a balance between the (apparent first order) forward and reverse binding rate constants (k3 and k4). Since we assume that the true rate constants kon and koff are constant across all regions, the regional variation in time to equilibrium is dependent primarily on B′max (recall k3 = kon/VR ∗ B′max). For this reason, multiple injection times and ligand concentrations are needed for optimal measurement of B′max in each brain region.
The optimal experimental design was found using the D-optimal criterion (DiStefano 1979). This procedure minimizes the confidence region of the parameter estimates, which maximizes parameter precision. The determinant of the Hessian matrix (H) is inversely proportional to the volume of the indifference region and D-optimality is achieved by maximizing the determinant of the Hessian matrix, det (H), where the Hessian can be approximated by:

J represents the sensitivity matrix defined ∂CPET/∂pi, for the parameters pi (= [K1 k2 kon/VR koff B′max k5 k6]) and W represents the diagonal weighting matrix (uniform weights were used for initial optimizations). To focus the optimization on maximizing the precision of the specific binding terms, a reduced Hessian (HR) was used for the maximization. It was partitioned to include only the koff, B′max and kon/VR terms (following Muzic et al., 1996). Furthermore, because there is a large difference in the scale of the parameters, the sensitivity matrix was normalized as follows:

The preliminary experimental design considered a three-injection protocol with injection times of t1, t2 and t3 for a single scanning PET procedure. The t1 term is defined as the start of the first injection and is therefore fixed to t1= 0. Each [F-18]fallypride injection has respective specific activity of [sa1, sa2, sa3]. Therefore the goal of the optimization is to find optimal design variables [t2 t3 sa1 sa2 sa3] that maximize the det(HR).
The nominal values for the model parameters were based on our initial in vivo PET experiments (Christian et al., 2000) and literature values of similar compounds (Delforge et al., 1999). Because a wide range of D2/D3 receptor densities exist in the brain, three separate optimizations were performed for regions with high (e.g. striatum), medium (e.g. thalamus) and low (e.g. cortical areas) B′max values.
PET Scans
A total of three healthy male rhesus monkeys (macaca mulatta) were scanned for the PET studies. The experimental procedures were approved by Wright State University Institutional Animal Care and Use Committee (IACUC). Prior to the PET scan procedure, the animals were initially anesthetized with ketamine and maintained on 0.5 − 1.5% isoflurane. Either atropine (0.04 mg/kg) or glycopyrolate (0.01 mg/kg) were administered to reduce respiratory secretions. The animals were positioned supine in the PET scanner with the head placed in the gantry parallel with the canthomeatal plane. Venous and arterial catheters were placed for injection of the ligand and sampling of arterial blood, respectively.
PET experiments were conducted with an ECAT EXACT HR + PET scanner (Brix et al., 1997) with the inter-plane detector septa retracted (3D mode). Following a 5-minute transmission scan, the dynamic acquisition was initiated with the bolus injection (infused over 30 seconds) of ligand and data acquired until the subsequent injection. The data were acquired with initially short frame durations (1 minute) for injections with rapidly changing ligand kinetics and increasing up to 5 minutes during periods of slower changes in PET signal. A total of 42–58 frames were typically acquired for each PET experiment and the study durations were as long as 3.5 hours.
The raw data were corrected for randoms, deadtime, scatter, attenuation and scanner normalization. The data was reconstructed using an OSEM algorithm (3 iterations, 16 subsets) into 63 transaxial slices (128×128 matrix size) with pixel sizes of 1.7×1.7×2.4 mm. Part of the objective of this work was to measure the kinetic parameters of fallypride in the D2/D3 receptor-sparse regions of the cerebral cortex and cerebellum. For these regions, the radiotracer uptake (and hence the overall PET signal) is quite small relative to the striatal regions. As a result, the measurements made in these regions may be more vulnerable to errors introduced by possible biases in the scatter correction algorithm. A neck-shield (based on the design of Thompson et al., 2001) was used for several of the studies to minimize the effects of the out of field-of-view scatter. Similarly, in these regions a comparison of reconstructed data using filtered back projection was made to test possible biases introduced with the OSEM algorithm (Boellaard et al., 2001). The parameter estimates from these two datasets did not differ significantly (data not shown), so the OSEM algorithm was found to be appropriate for our specific application.
Determination of the Input Function
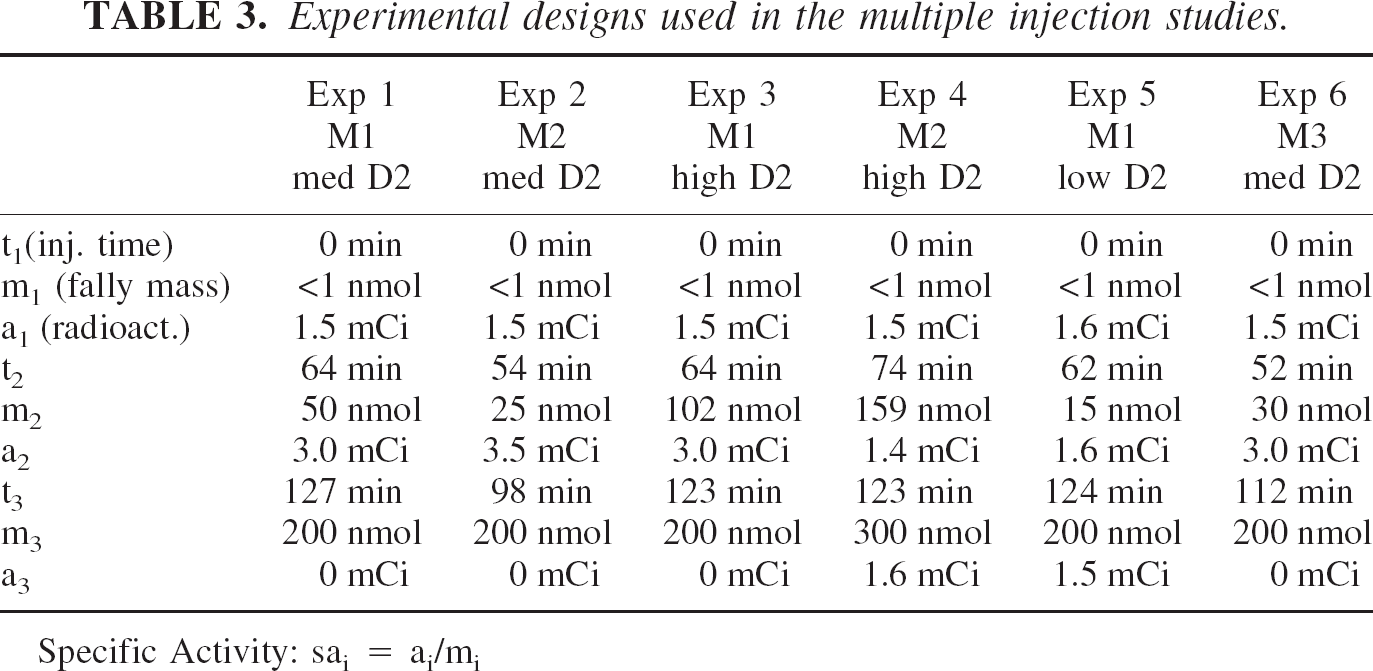
Arterial plasma samples were collected to measure the time course of ligand concentration presented to the tissue. A 20-gauge arterial catheter was placed in the femoral artery for the collection of blood samples. Arterial blood samples were drawn throughout the entire course of the experiment; every 10–15 seconds for the first several minutes following injection and decreasing in frequency until the end of the study (total of 40–50 per experiment). The measurements of the native, hydrophilic and lipophilic metabolite fractions of [F-18]fallypride were carried out according to previously reported methods (Christian et al., 2000). In brief, the lipophilic components (consisting of native fallypride and lipophilic metabolites) were separated from the hydrophilic metabolites via ethyl acetate (EtAc) extraction. The fractional composition of lipophilic metabolites was then determined using thin layer chromatography. Several steps of data processing were needed isolate the natural fallypride arterial plasma curve, used to solve the model equations, from the metabolites.
The concentration of native fallypride in arterial plasma is needed to serve as the input function for calculating the parameter estimates. Though not included with the input function, the concentration of radiolabeled metabolites (all species) is needed as a component of the whole blood radioactivity (Ai). The model equations were solved by treating each injection of fallypride, with its own unique specific activity, independently. The measurement of each plasma sample contains radioactivity from each previous injection, so additional data processing was needed to obtain separate input functions for each of the injections. Consider that from each arterial blood sample, three measurements are made: Cnat(t), Chydro(t) and Clipo(t) representing the plasma concentration of native fallypride, hydrophilic metabolites and lipophilic metabolites, respectively. For the native fraction in a three-injection experiment, the measured concentration (Cnat(t)) is a sum of:

corresponding to each injection. The separation of each input function is outlined in Table 2.
Definitions of the fallypride input functions
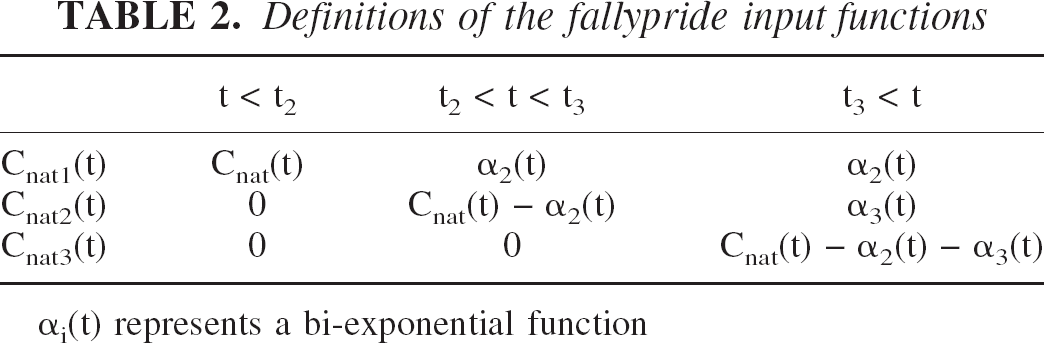
αi(t) represents a bi-exponential function
The extrapolated plasma curves, α2(t) and α3(t), were expressed as bi-exponential functions (αi(t) =aie−bit +cie−dit). The parameters for α2(t) were determined by fitting the data prior to the time of the second injection (t2), then the data were extrapolated out to the end of the study. The parameters for α3(t) were determined by fitting the measured data following the second injection after it is stripped of α2(t). This identical strategy was used for the time course of the hydrophilic (Chydro(t)) and lipophilic (Clipo(t)) measured metabolites.
The time course of the concentration of unlabeled fallypride, in pmol/mL, was obtained by: Cai = Cnati/sai, for each of the three injections. The Cai functions were then used as the input functions for solving the model and estimating the parameters.
Data Analysis
The dynamic PET images were first summed over different time frames to enhance visualization for the regions of putamen, caudate, ventral striatum, thalamus, cerebellum, frontal cortex and temporal cortex. Time-activity curves (TACs) were generated by placing multiple circular regions of interest (ROIs) on the summed images. For the cortical regions, the placement of the ROIs was made on a coregistered T1-weighted MRI to ensure accurate placement. The data were then generated by applying the ROIs to the PET time series for the three injections. To accurately piece together the data from the multiple injections it was necessary to remove the radioactive decay correction factor from all of the data.
Both the experimental design optimization and the parameter estimation were performed using COMKAT software (Muzic and Cornelius 2001). The COMKAT software requires the model be implemented as three distinct compartmental systems (MFi, MBi, MNSi), one for each unique input function, CAi. The kinetic rate constants K1, k2, kon/VR, koff, B′max, k5, k6 were estimated from the compartmental systems. The effects of the nonspecific binding terms (k5, k6) were examined by testing model configurations both with and without this compartment. Though only a single optimized experiment was needed for the parameter identification in each region, for both of the monkeys (M1 and M2) the parameters were simultaneously estimated from all the experiments on each monkey to increase parameter precision. For example, a total of 11 parameters for each region were estimated for M1; K1exp1, k2exp1, K1exp2, k2exp2, K1exp3, k2exp3, kon/VR, koff, B′max, k5. The multiple K1 and k2 parameters were used to account for blood flow changes between the separate experiments (experiments #1, #2, #3).
To examine the effects of the lipophilic metabolites in the arterial plasma, parameter estimates were calculated and compared using three different input functions; 1) the lipophilic metabolites, Clipo, were included with native fallypride and treated as a single input, 2) Clipo were assumed to enter the free space but not bind (2 separate input functions with unique transport constants, K1 and k2), and 3) the Clipo were assumed not to cross the blood brain barrier. In all cases the hydrophilic metabolites were removed from the input function and remained only in the whole blood term, Ai.
The parameter estimation was performed using a modified version of the Levenberg-Marquardt algorithm within the COMKAT environment applying weights defined as the reciprocal of the variance of the measured PET concentration (w = Δt/CPET) (Mazoyer et al., 1986). All of the parameter estimates were constrained to be non-negative. Multiple runs of the parameter estimation were executed with different initial guesses and the estimates with the smallest sum of squares are reported in the results. The precision (approximated as standard deviation) of the parameter estimates was calculated from the diagonal elements of the covariance matrix (cov), according to:
RESULTS
Experimental Design
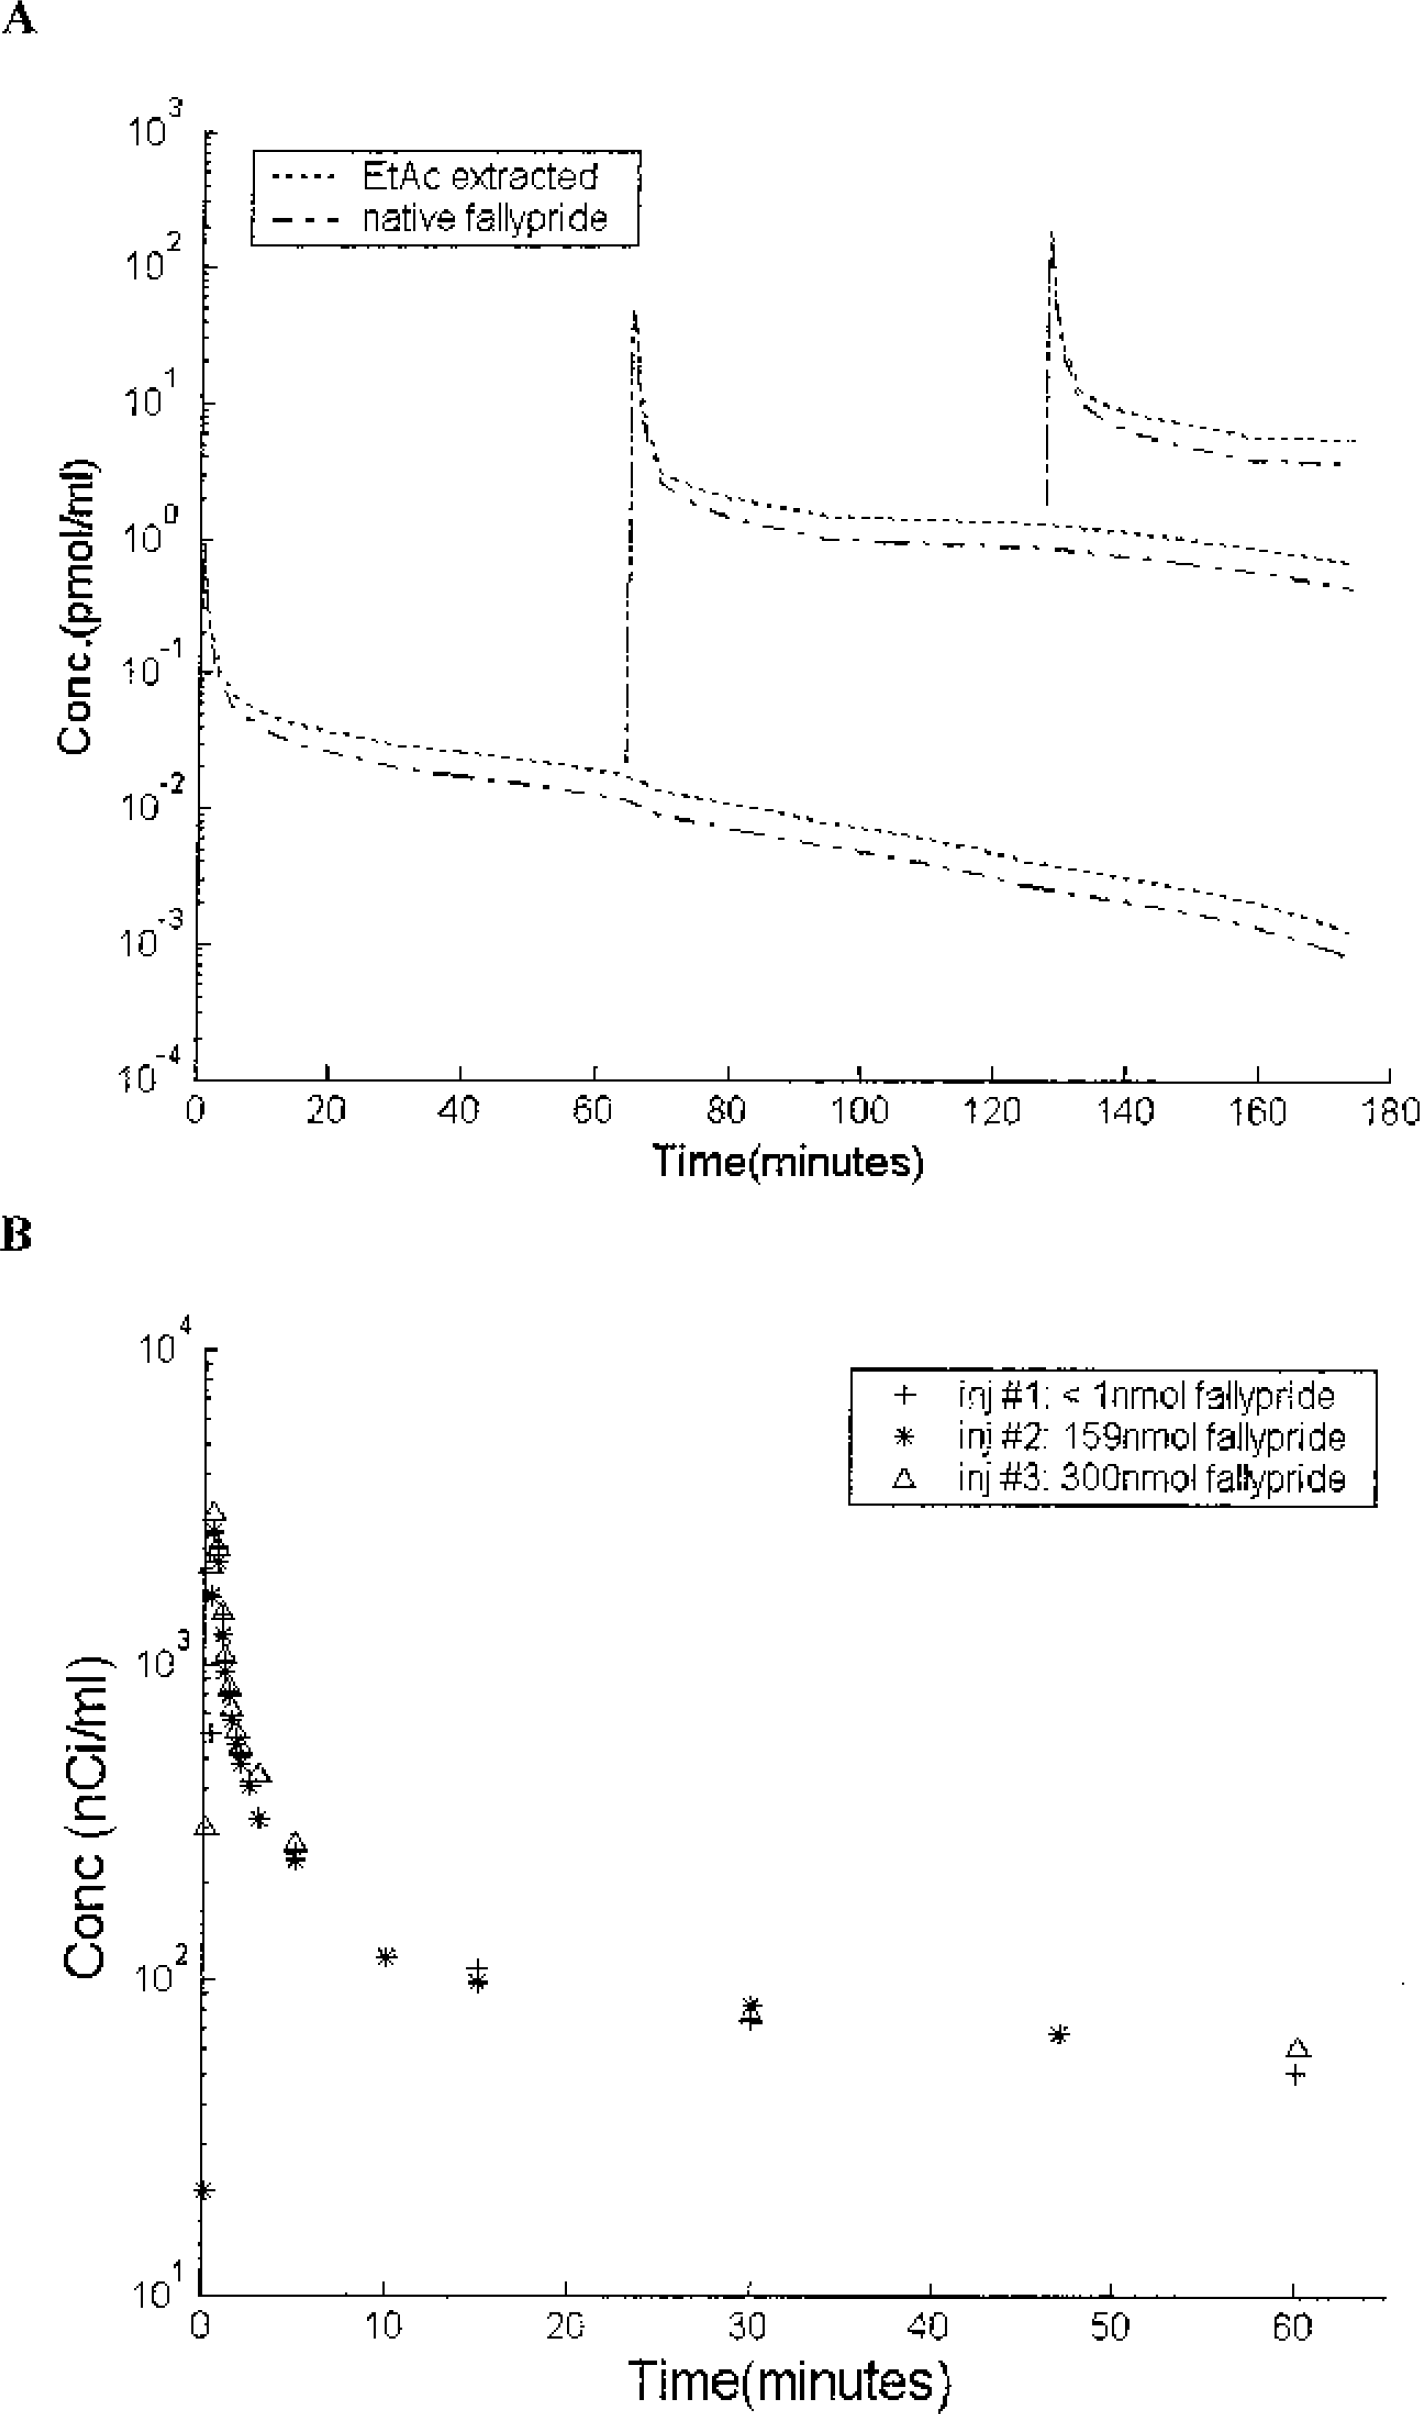
The experimental protocols for each PET experiment, including the times of injection, and the amount of radiolabeled and unlabeled ligand used at each time are given in Table 3. Estimates from early experiments were used as the “true” value design optimizations that produced the protocols used in later experiments.
Experimental designs used in the multiple injection studies.
Specific Activity: sai = ai/mi
Blood Kinetics
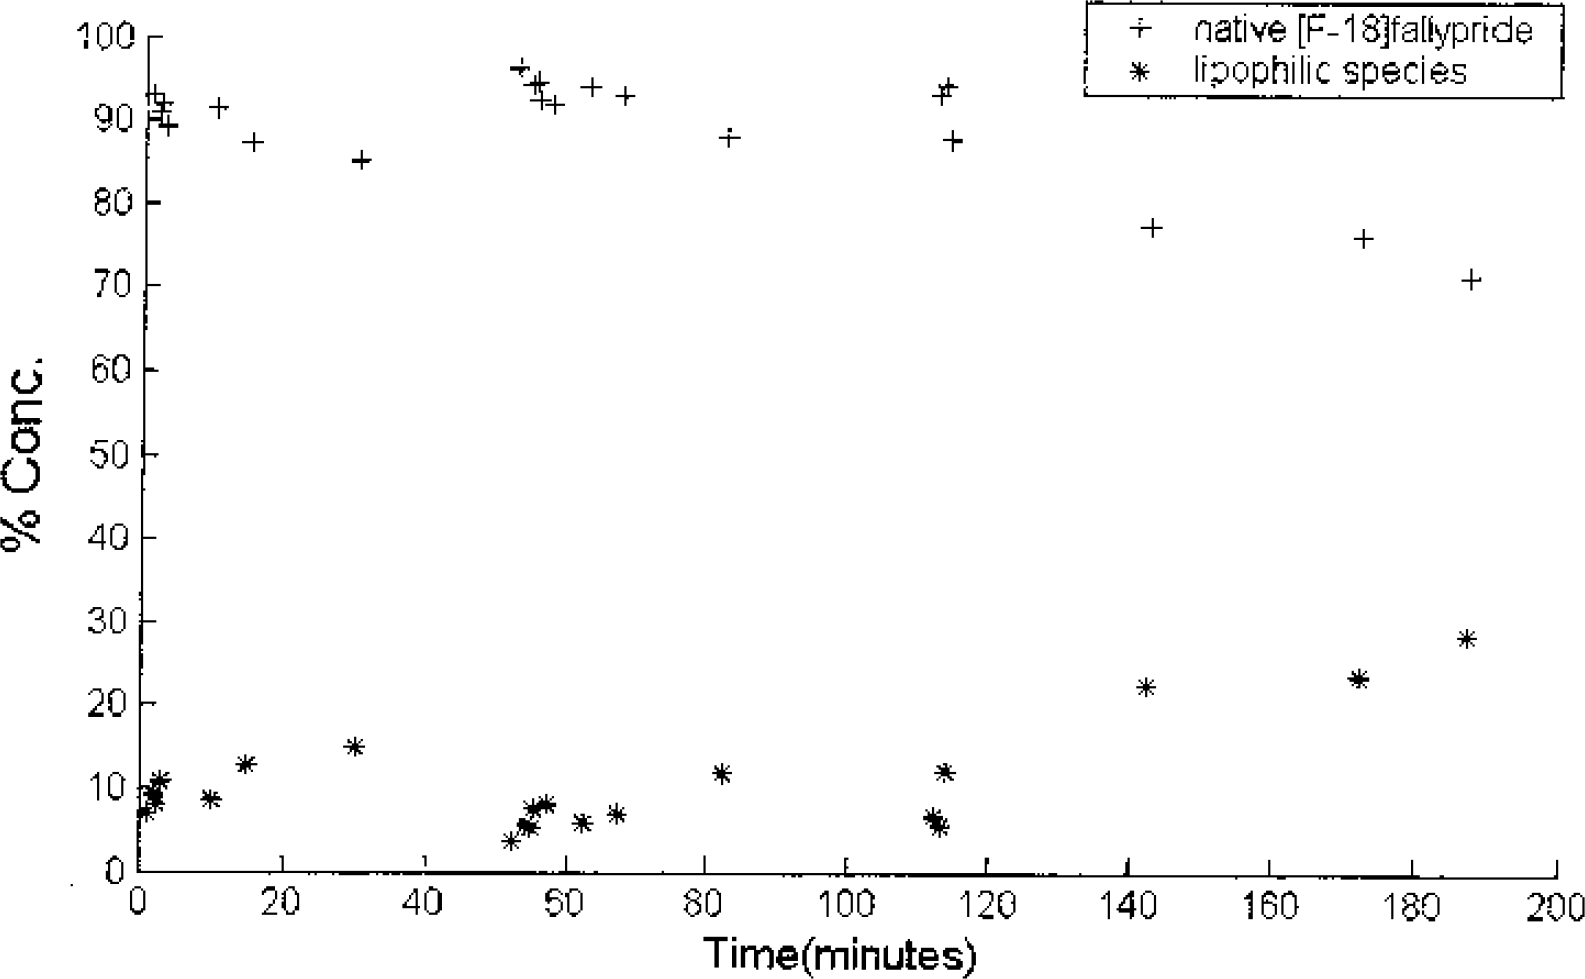
The fraction of lipophilic metabolites for one of the experiments is shown in Fig. 2. These data are then applied to the radio-assayed input function to derive the radiolabeled [F-18]fallypride curve which is then used to derive the resulting input function (scaled by sai) used for parameter estimation as seen in Fig. 3A Shown in Fig. 3B is a superposition of the radiolabeled input functions from one experiment. This curve is intended to illustrate the similarity in shape for the plasma time-course for the three injections. The curves are similar even though the specific activity of fallypride is dramatically different for each injection. Because of this consistency in plasma curve shape, the shape of the radiolabeled curves could be used to infer the shape of the unlabeled plasma ligand curves (i.e., injections given without radioligand).
The fractions of native fallypride and lipophilic species measured from the arterial blood for experiment 4. A small increase in the lipophilic fraction is seen toward the end of the experiment (at 140 minutes), but the total lipophilic portion (EtAc-extracted) is predominantly native fallypride.
(A) The fallypride input function used for the compartmental analysis (from experiment 4). These fallypride curves are inferred from the plasma measured radiolabeled curves and scaled with the known specific activities. (B) The three separate radiolabeled fallypride curves (the legend gives amount of unlabeled fallypride injected) from experiment 4 with the time scales shifted for visual comparison. The shapes of the three radiolabeled curves are nearly identical despite the large differences in fallypride concentration.
Tissue Kinetics
Medium and High D2/D3 Density Regions
The parameter estimates for the caudate, putamen and ventral striatum regions are given in Table 4. For monkey M1, the parameter estimates were obtained by simultaneously fitting the data to all three multiple-injection experiments (see Table 2) for each brain region separately. The K1 and k2 parameters were allowed to float for each experiment to account for differences in blood flow, but kon/VR, B′max and koff were forced to a single unknown value for the entire dataset. A similar strategy was used for the analysis of M2, with M3 values being estimated from the single experiment. A time-activity curve of the putamen (experiment 4) is shown in Fig. 4, along with the solved compartmental model. For these regions, it was found that compartments to explicitly account for non-specific binding were not needed for good fits of the data.
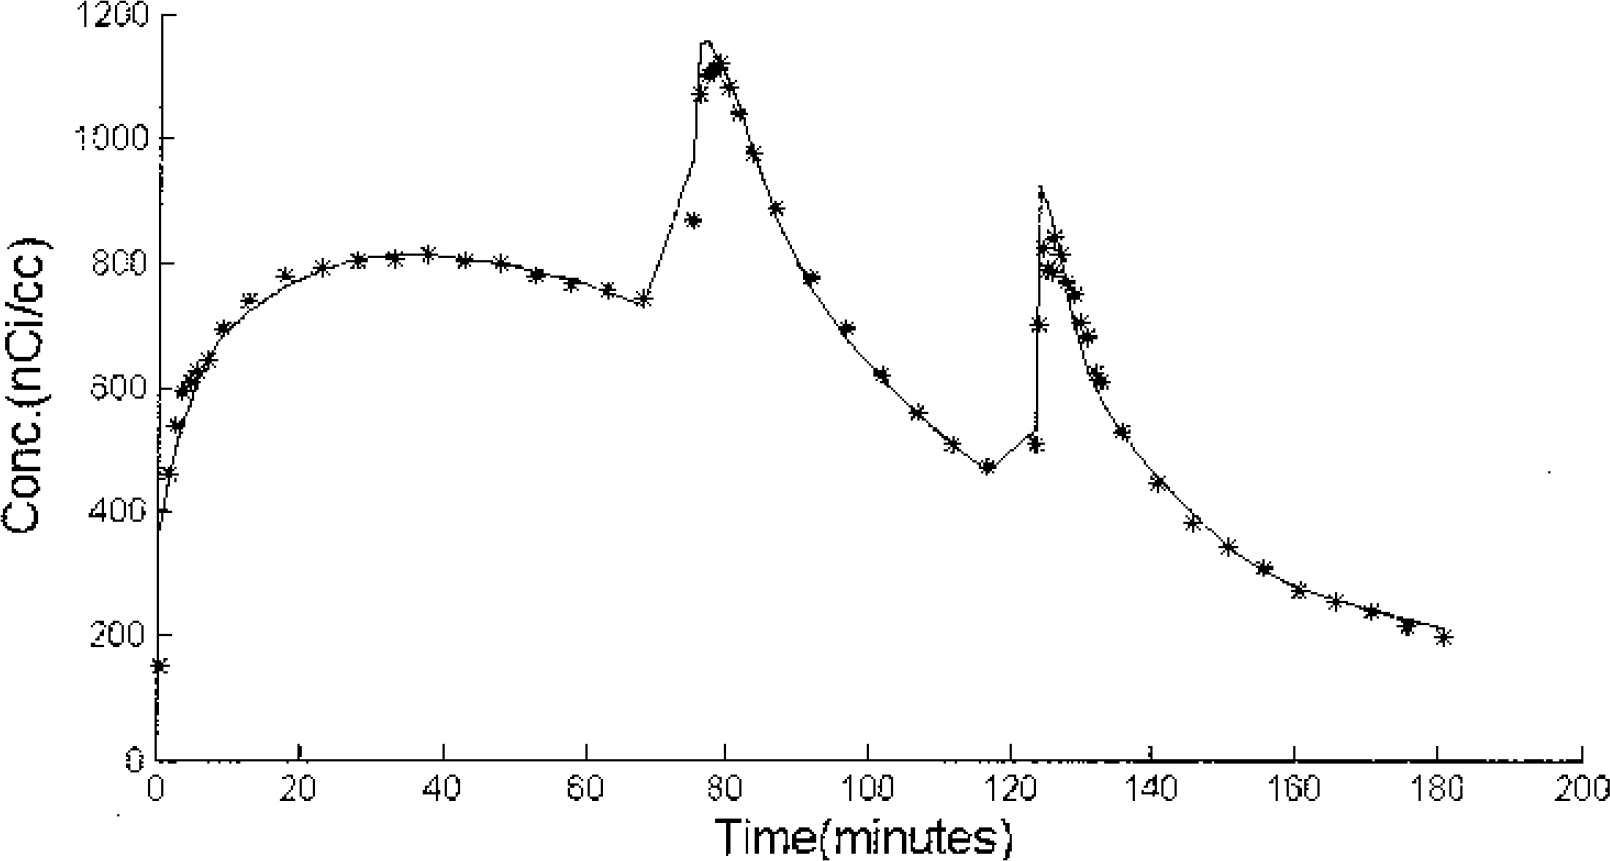
Putamen time-activity curves from experiment 4. The first injection was high specific activity [F-18]fallypride, the second injection was given at t=74 minutes with partial saturation (1.5 mCi, 159 nmoles of fallypride) and the last injection at t=123 minutes was a saturating dose of ligand (1.5mCi, 300 nmoles of fallypride). The solid line represents the compartmental model fit to the PET measured data (∗). The data shown was not corrected for radioactive decay.
Parameter estimates for the high and medium density D2/D3 receptor regions
Error estimates (sd) for B′max are given in parenthesis. For the other parameters, the error estimates do not exceed 8%. K1 and k2 were average values for the three experiments on M1, two experiments on M2 and single experiment on M3.
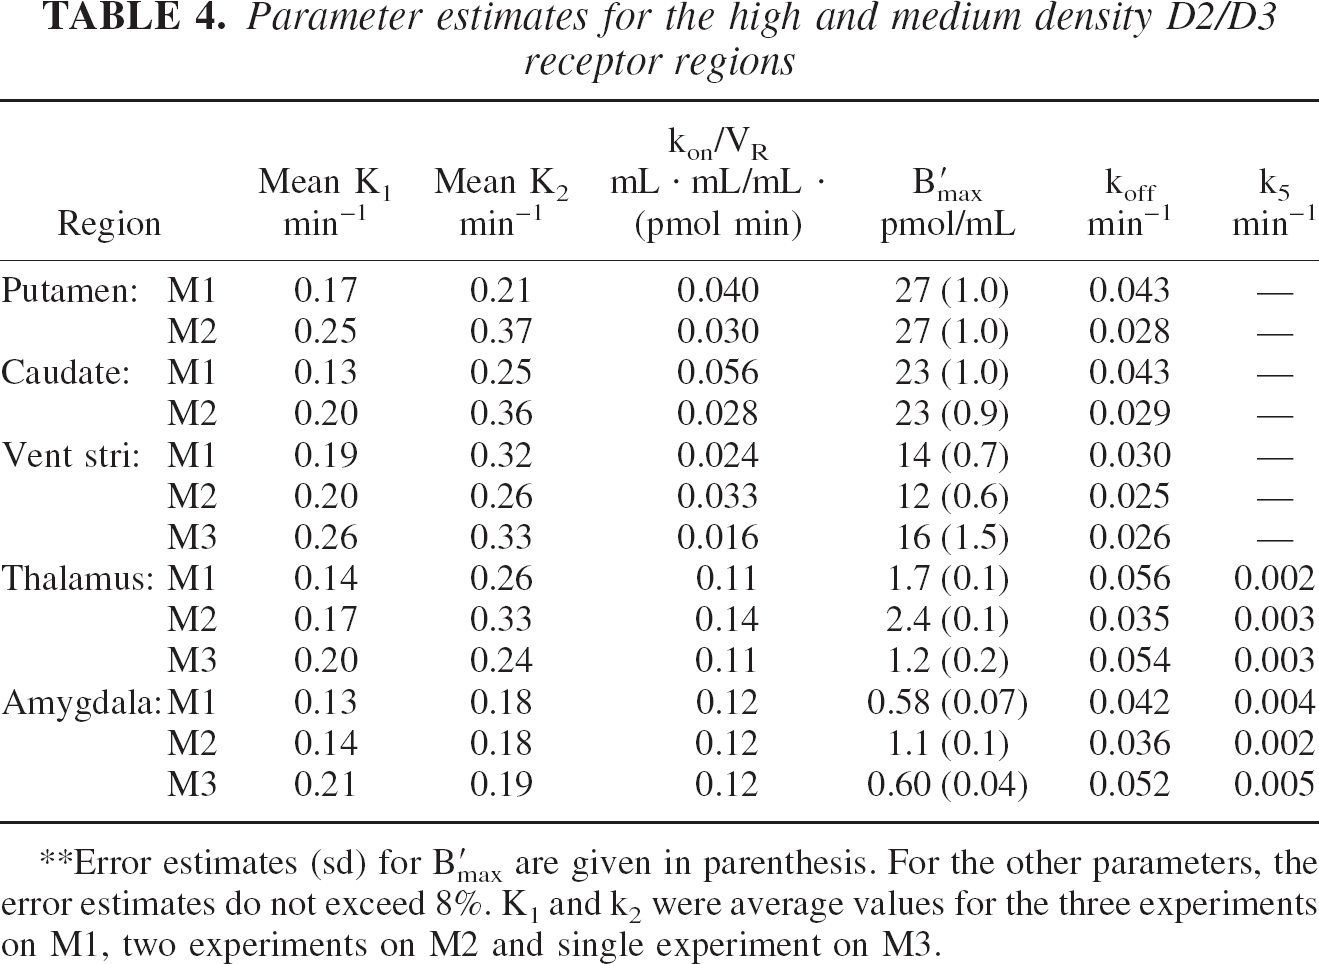
The time-activity curve for the thalamus of experiment 2 is shown in Fig. 5, with the parameter estimates for the thalamus and amygdala included in Table 4. The effect of the displacement injection (third injection) is readily identifiable from the PET curve when no radioligand is included. In these regions, it was found that the quality of the model fit was greatly improved (based on the Akaike information criteria (Akaike 1974)) with the inclusion of a single association term for nonspecific binding (k5). A significant increase in the kon/VR parameter is seen in the thalamus and amygdala when compared to the striatal regions.
The thalamus tissue time-activity curve from experiment 2. The first injection was high specific activity [F-18]fallypride(1.5 mCi). The second injection (t=54 minutes) was a partial saturation dose of [F-18]fallypride (3.5 mCi, 25 nmoles) for the thalamus and the last injection (t=98 minutes, indicated by the arrow) consisted of a saturating dose of unlabeled fallypride (200 nmoles) as evidenced by the displacement of the bound ligand. The solid line shows the compartmental fit with the estimated parameters obtained by fitting the data from experiments 2 and 4.
Low D2/D3 Receptor Density Regions
The time-activity curves for the temporal cortex and cerebellum are shown in Fig. 6. The data demonstrate that the temporal cortex yields a higher concentration of radioactivity when compared to the cerebellum for each of the injections, but the model suggests that this is because of differences in both specific binding and free space distribution (K1/k2) (see Table 5). Fig. 7 shows a superposition of the three temporal cortex curves by shifting the times of injection. In the temporal cortex, a significant change in shape of the curve can be seen between the first injection and the latter two. Because the specific binding was small relative to the free and nonspecifically bound ligand, it was not possible to get sufficient displacement and blocking of the receptors during the study to be able to decouple B′max and kon/VR and to estimate koff. Due to the large covariance between B′max and kon/VR parameters, the parameters are reported as the composite parameter k3 (B′max kon/VR) and the koff parameter was constrained to average values found in the other regions of the same monkey. The parameter estimates for these regions are given in Table 5.
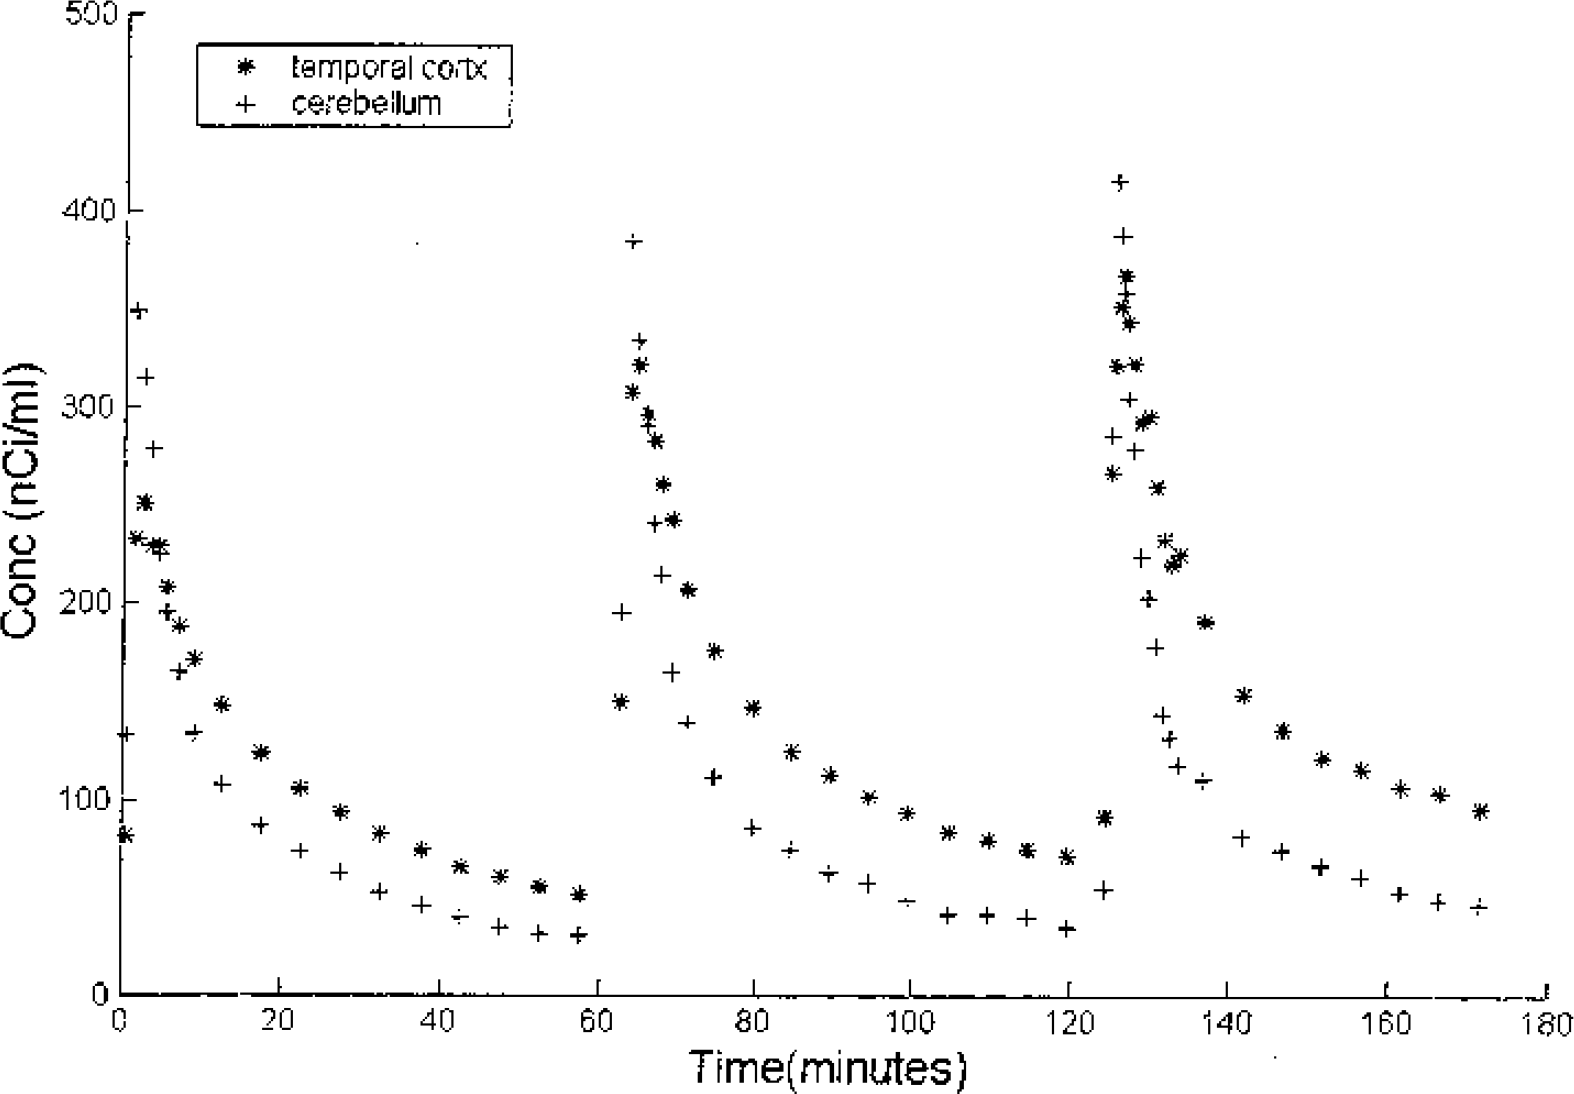
Time-activity curves of the cerebellum(+) and temporal cortex(∗) from experiment 5. Each of the three fallypride injections contained radiolabeled [F-18]fallypride (1.6 mCi, 1.6 mCi, 1.5 mCi, respectively) with differing amounts of unlabeled fallypride (<1nmoles, 15 nmoles, 200 nmoles respectively).
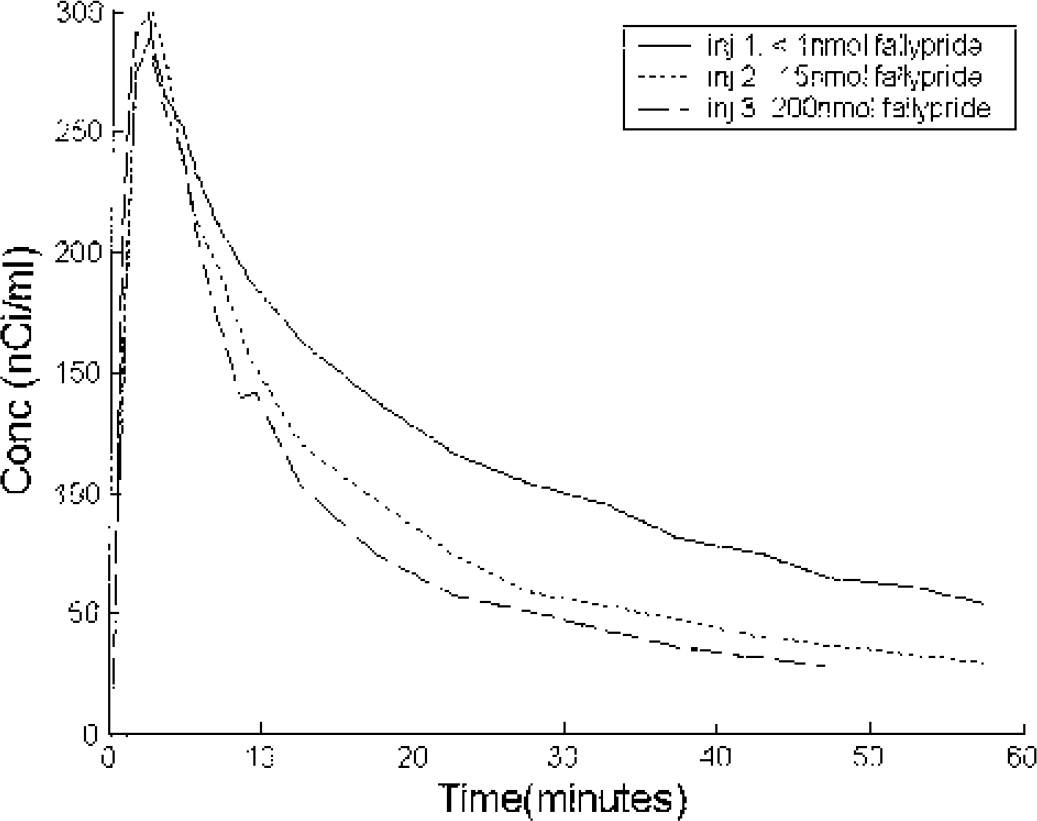
Time activity curves from the temporal cortex (see FIG. 6) with the injections separated and time shifted to show the data superimposed. The first injection was high specific activity [F-18]fallypride, with the second and third injections including 15nmol and 200nmol of unlabeled fallypride, respectively. The extrapolated signal from each curve was subtracted from the subsequent curves.
Parameter estimates for the low density D2/D3 receptor regions
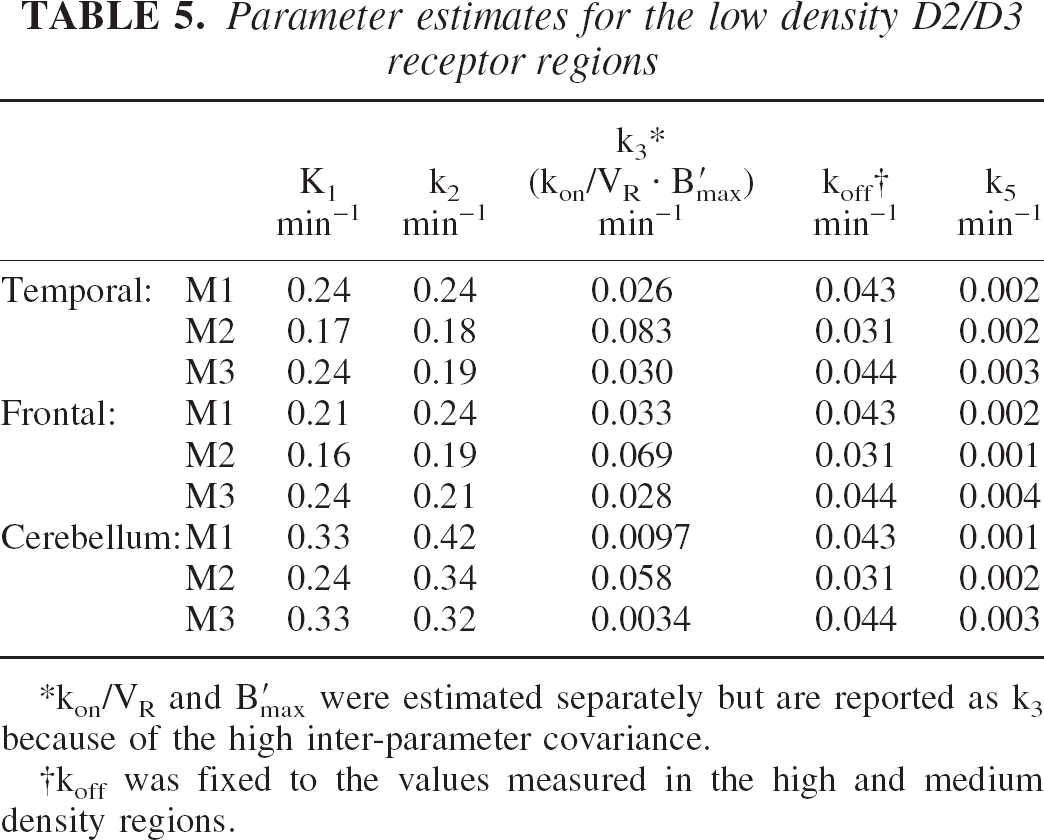
kon/VR and B′max were estimated separately but are reported as k3 because of the high inter-parameter covariance.
koff was fixed to the values measured in the high and medium density regions.
DISCUSSION
One primary motivation of this work was to determine the in vivo rate constants of [F-18]fallypride in the regions of the brain that have low densities of D2/D3 dopamine receptors, such as the thalamus and the cortical regions. The multiple-injection approach was used to decouple the transport terms (K1,k2) from the binding terms (kon/VR, koff, B′max) and to obtain separate measures of B′max and kon/VR where possible, rather than the composite parameter, k3.
Parameter estimation is challenging for PET experiments because of the difficulty in identifying all of the parameters. The det(H) is an index which is a function of experimental conditions (e.g., time of injection and specific activity) and one can optimize the experiment by maximizing this index (or minimizing -det(H)). The D-optimal criterion was applied to select the experimental design that provided the most precise measure of the parameters from a single, complicated imaging experiment.
Without using the D-optimal criterion, it is challenging to choose an intuitive experimental design that precisely measures all of the specific binding parameters. For example, consider a series of 2-injection protocols for optimizing the precision of each binding parameter independently. Using the thalamus parameters from M1, optimal design for the measurement of B′max would require a partial saturating dose (for injection #2) given at 60 minutes followed by a scanning duration of 160 minute. For kon/VR, optimal precision is achieved with partial saturation injection #2 given at 65 minutes followed by a 140 minutes scan. The optimal protocol for koff measurement would require a saturating dose of fallypride, without radioactivity, given 40 minutes after an initial high specific activity injection and measurement of the displacement for 2 hours. Simulations using these protocols (total of 6 separate injections) suggest the standard error (s.d.i/pi) on the parameter estimates are 6.4%, 6.9% and 7.8% for kon/VR, koff, B′max, respectively (data not shown). When considering an optimization of all parameters together from the 3-injection protocol used in experiment 1, the standard errors were 6.5%, 9.0%, 9.2% for kon/VR, koff, B′max, respectively, based on simulations with the same noise levels. This indicates that there is only a small sacrifice in parameter precision when going to a 3-injection protocol, but there is a large gain in experimental convenience (one 3-injection experiment vs. three 2-injection experiments).
The primary strength of det(H) was its ability to formulate the optimal selection of specific activity for the second injection, sa2, when targeting the different D2/D3 receptor density regions. For example, it was not possible to obtain parameter estimates for the high density regions such as the striatum from experiment 1, resulting in B′max estimates that were completely dependent on the initial values set in the search algorithm. The D-optimal criterion revealed that in the high D2/D3 density regions, a two- to three-fold increase in ligand was needed to allow identification of the parameters.
Use of the D-optimal criterion assumes that the in vivo rate constants are known. As a result of this assumption, the experimental design selected on the first pass can only be an “estimate” of the true optimal design, therefore a range of parameter values based on our preliminary data (Christian et al., 2000; Mukherjee et al., 1995) was used to provide a range of acceptable experimental protocols for the first few experiments. Subsequent experiments for each monkey were then designed incorporating the information obtained from the initial ones. The first experiments on each subject (experiments 1,2,6) were optimized for parameter identification in the medium D2/D3 receptor density regions. These experiments consisted of high specific activity [F-18]fallypride for the first injection, a partial saturating dose along with radioligand for the second injection and a saturating dose with no radioligand for the third injection. For the first experiment, B′max in the medium density regions was twice what we had assumed for the optimal design calculation. However, we incorporated the updated knowledge of B′max into subsequent simulations and experimental design calculations. The latter calculation specified for less mass with injection #2 than the original and the improved design yielded a modest improvement in the parameter precision.
Accurate measurement of koff was most sensitive to the data from the third injection. This can be seen in the Fig. 5, with the dissociation of the ligand from the receptor sites in the thalamus immediately following the saturating dose of fallypride. With koff determined from the first experiment on each animal, we chose to include radiolabeled fallypride with the third injection for experiments 4 and 5 in an effort to further decouple the ligand efflux (k2) from the specific binding (kon/VR, B′max).
In Vivo Parameters of [F-18]Fallypride
In the striatal regions, the specific binding is very rapid, as seen in the time activity curve of Fig. 4 following the first injection. The striatal regions displayed the highest D2/D3 receptor density, B′max, with approximately equal values in the putamen and caudate nucleus. The average of 25 ± 2 pmol/mL for the two monkeys is in close agreement with other reported values (Delforge et al., 1999). The B′max in the ventral striatum (weighted average 13 ± 0.3 pmol/mL), gives the same interregional range as in vitro values (Kessler et al., 1993b) in humans. Some variability is seen across monkeys in the kon/VR parameter (mean of 0.032 ± 0.013 mL ∗ mL/ mL ∗ (pmol min)) for the putamen, caudate and ventral striatum, although this parameter is relatively constant across these regions within subject (see Table 4). The mean value for the dissociation rate constant averaged over the three monkeys is koff = 0.039 ± 0.008 min−1, translating into a clearance halftime of 18 minutes, in close agreement with previously reported values for fallypride (Mukherjee et al., 1995).
The regional distribution of [F-18]fallypride binding in the nonhuman primate brain was found to be in close agreement to that seen in humans (Mukherjee et al., 2002). This was found both in the striatum and the extrastriatal regions of the brain. The regions demonstrating the highest degree of binding outside the striatum were the thalamus, amygdala, and pituitary. The binding of [F-18]fallypride in the pituitary is extensive, however, we have chosen not to report kinetic parameters here because the pituitary is quite small in volume. In analyzing the data there was no correction applied for partial volume effects and as a result the PET measured radioligand distribution for the smaller brain structures will be incorrectly measured to some degree. The limited cross-sectional area of the pituitary is likely to have introduced excessive biases in our parameter estimates. Future analysis for this region will require partial volume correction.
The thalamus is a heterogeneous structure with multiple regions including the anterior, dorsomedial, ventral and pulvinar nuclei. In obtaining time-activity curves, we centered circular regions of interest over the peak intensity regions of the thalamus, spanning three transaxial planes (2.4mm plane thickness) in order to cover what is believed to be primarily the mediodorsal nuclei but is likely a combination of several nuclei. The measured receptor density in the thalamus displayed a large variation across monkeys, (mean B′max = 1.8 ± 0.6 pmol/mL), and is approximately an order of magnitude less than the striatal regions. A smaller variation was measured in the kon/VR parameter (mean of 0.12 ± 0.02). The large variation in B′max could be, in part, a reflection of its large correlation with kon/VR.
The frontal and temporal cortical regions displayed a significant amount of specific D2/D3 ligand binding, as seen in Fig. 7 for the temporal cortex. The specific binding parameters (kon/VR, koff, B′max) in these regions could not be uniquely identified. Only experiment (#5) was optimized for the cortical regions. As stated above, koff is most sensitive to the displacement phase of the curve. Therefore, the optimal protocol for measuring koff would be a saturating dose of ligand administered when the ratio of bound to free radioligand is maximum, i.e. following a high specific activity injection. However, giving this saturating dose of ligand results in losing the ability to separately estimate kon/VR and B′max. For the regions with higher D2/D3 receptor density (striatum and thalamus) there was still enough [F-18]fallypride in the bound state following the partial saturating injection to allow koff estimation with a saturating dose. In the cortical regions however, there was not enough ligand in the bound state following the partial saturation injection to identify koff. For this experiment (#5), it was decided that radioactive ligand would be included for the third injection to further decouple ligand efflux (k2) from ligand binding (kon/VR, koff, B′max) and set koff to a fixed value measured in the other brain regions. In implementing this experimental design, we found that kon/VR and B′max could not be decoupled (i.e., could not be uniquely identified) and so we report the product of both parameters as the composite parameter k3. As seen in Table 5, k3 was approximately the same in both frontal and temporal cortical regions. By fixing kon/VR to the same value as estimated in the other extrastriatal regions (thalamus and amygdala), it is possible to extract B′max according to the relationship, B′max = k3/ (kon/VR), for the temporal cortex (B′max = 0.36 ± 0.20), frontal cortex (B′max = 0.34 ± 0.13). In baboons, a six-fold difference has been reported in receptor density, B′max, between the temporal and frontal cortices, 1.9 pmol/mL vs. 0.32 pmol/mL, respectively (Delforge et al., 1999). Our inability to identify differences in receptor density (via k3) between the frontal and temporal cortices may be species related or obscured by the inability to separate kon/VR and B′max.
A large discrepancy is seen when comparing the in vivo KDVR (= VRkoff/kon) values between the striatal and extrastriatal regions (thalamus and amygdala). We assume that KD is constant across all regions and depends only on the stereochemical interaction between the ligand and the receptor site. The volume of interaction term, VR, was introduced to account for the gradients in ligand concentration existing in the free space, MF (Delforge et al., 1996) near the receptor. By assuming a uniform KD, the VR term can be estimated by the comparison of in vivo and in vitro KD values, with each region of the brain having a unique VR value dependent only on local ligand concentration heterogeneity. Averaging over the three monkeys in the putamen, caudate and ventral striatum yields KDVR ≈ 1nM, while in the thalamus and amygdala, KDVR ≈ 0.38nM.
How can one explain a larger VR in the striatum than in the thalamus or amygdala? In our case, we speculate that in the regions of high D2/D3 receptor density, fallypride has greater access to the unoccupied receptor sites. We would expect VR to be higher in the striatum than in the thalamus or amygdala. If we assume kon is independent of receptor density, then kon/VR will be higher in the thalamus and amygdala. A similar regional variation in VR was reported by Delforge and colleagues in the context of measuring flumazenil binding in the brain via PET (Delforge et al., 1995) and extended to establish a correlation between B′max and VR (or KDVR) (Delforge et al., 1996).
The ratio of the reaction volume (VR) is 2.6:1 when comparing the striatal to extrastriatal regions is similar to the range (2.4:1) reported for FLB 457 between the striatal (KD VR = 0.39nM) and extrastriatal (KD VR = 0.16nM) regions (Delforge et al., 1999). The reported in vitro value for fallypride is KD = 0.03nM (t = 25°C) (Mukherjee et al., 1995). For in vitro measurement of KD, substituted benzamides are known to have a large temperature dependence (Hall et al., 1988). This limits the accuracy of in vitro with in vivo KD correlations. Based on the lipophilicity of fallypride (logP(7.4) = 2.48) and FLB 457 (logP(7.4) = 1.89) (Loch et al., 1996) and using the relationship reported by (Delforge et al., 1996) (log VR = −0.36 + 0.48 log P), we can also estimate that VR for fallypride should be approximately 1.9 times greater than that of FLB 457. This estimate, taken together with in vitro KD values, suggests a fallypride KD VR value that is 2.9 (=1.9∗30pM/20pM) times greater than FLB 457, and in close agreement to the values reported here (striatum:1nM vs. 0.39nM, thalamus: 0.40nM vs. 0.13nM).
Kinetics of [F-18]Fallypride in Blood
One of the primary concerns when analyzing PET data that involves multiple injections of radiotracer with different specific activities, is the proper estimation of the input function of the unlabeled species (Morris et al., 1999). The shape of the curve for the unlabeled species is inferred from the radiolabeled measurements and small uncertainties in the measurement of the radiolabeled input function can propagate into large biases in binding parameter estimates. Fortunately, the relatively long half-life of the 18F label (109.8 minutes) offers a distinct advantage over shorter-lived isotopes such as 11C (t1/2 = 20.3 minutes) for accurately measuring the plasma concentration for the duration of these 3 hour experiments. Thus, we believe we have minimized the biases caused by uncertainties in the input function.
As previously reported, the metabolism of fallypride to hydrophilic species in the blood can be described by a bi-exponential function with a rapid (t1/2 = 3.9 minutes) and a slower (t1/2=224 minutes) rate, and a parent fraction of approximately 45% at 60 minutes (Christian et al., 2000). It was found that the presence of the unlabeled fallypride did not significantly change the rate of metabolism in the blood (see Fig. 3b). Due to its large presence, the measurement of hydrophilic metabolites is necessary when a measured plasma input function is used. This is a simple experimental procedure requiring one additional solvent extraction. However, the measurement of the lipophilic species is considerably more laborious, involving additional processing and time. The data shown in Fig. 2 demonstrate that non-parent lipophilic species comprise a small fraction of the measured plasma activity. Taken to the end of the experiment, the fraction does not exceed 30%. For these experiments, there was no significant difference in the kinetic parameter estimates, whether we use input functions that corrected for lipophilic species or not. The non-parent lipophilic species are believed to be inactive at the D2/D3 receptor site or bound to plasma proteins, so their presence should have the greatest effect on the non-specific binding parameters (k5 and k6) and minimal effect on the specific binding terms.
The Measurement of Nonspecific Binding
Nonspecific binding is often modeled in PET studies as a rapidly equilibrating process with respect to the radioligand delivery and specific binding processes. The nonspecific binding described in the compartmental model (equations 1–3) is considered to represent a slowly equilibrating component, which is kinetically distinct from the rapidly binding component described by f2 (Mintun et al., 1984). We have previously observed a slowly equilibrating process that required k5 and k6 for [11C]CFT in monkeys (Morris et al. 1996). Parameter estimates for k5 and k6 were not reported in the high-density regions (see Table 4). The inclusion of these terms into the compartmental model was not justified according to the Akaike information criteria (AIC). That is, k5 and k6 would have been unidentifiable. This does not discount the presence of nonspecific binding. Rather, it is likely that the dominance of the specifically bound ligand in the high affinity regions is obscuring the measurement of the nonspecific component. For high specific activity injections, it is estimated that specifically bound ligand represents 98% of the PET signal in the striatal regions at late times.
There is concern that the inclusion of the nonspecific compartment in the medium and low D2/D3 density regions may erroneously affect the measurement of the delivery (K1, k2) and binding parameters (kon/VR, koff, B′max). However, we found that k5 was not significantly correlated with any of the parameters. The correlation coefficient for k5 and the other parameters never exceeded 0.50. Also, we feel that the difference in kon/VR between the striatal and extrastriatal regions is not attributed to the presence of the k5 term in the model configuration. In the extrastriatal regions, removal of the nonspecific compartment from the model configuration (i.e., k5 = k6 = 0) and re-fits of the data indicated that there was no systematic change in kon/VR or any of the other parameters. Inclusion of the nonzero k5 term resulted in a significant improvement of the AIC in all the extrastriatal regions.
The lack of the reverse nonspecific binding term (i.e. k6 = 0), suggests that over an extended time, all of the unmetabolized ligand would become nonspecifically bound. Physiologically this is implausible. The unidentifiability of k6 suggests that we did not scan long enough for accurate measurement. Recall, the experiments were not optimally designed for measurement of the k5 and k6 terms. Such an experimental design would have involved an initial saturation of the receptor sites and a lengthy scan of the radioligand to track the course of the slower nonspecific components.
Implications for Use of Reference Region Methods of Analysis
Due to the experimental complexity of multiple-injection studies, it is often not feasible to conduct these studies in humans or even on a routine basis in animals. Instead, single-injection, high-specific-activity PET experiments are used to provide an estimate of a composite parameter such as apparent binding potential:
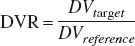
distribution volume;
or distribution volume ratio.
Reference region models are frequently used to eliminate the need for arterial blood samples (Cunningham et al., 1991; Logan et al., 1996). For such methods of analysis, one of the assumptions is that the free space distribution of ligand is constant across regions, (i.e., K1/k2 is constant). With this assumption satisfied, it is possible to estimate the receptor density index, BPapp. The data shown in Tables 4–5, suggest a significant degree of variability in the K1/k2 values regionally, with differences of as much as 40% within each monkey. For example in the thalamus, the average K1/k2 is 0.63, compare that to the cerebellum average of 0.84. This variation across regions is similar to measurements with FLB 457 (Delforge et al., 1999). Non-uniformity of K1/k2 across regions will still produce an index proportional to B′max, but an additional scaling factor will be implicitly included to account for (K1/k2)target/(K1/k2)cerebellum. From our small sample of three monkeys, it is not possible to determine if this difference is consistently higher or lower for a particular region (e.g., is K1/k2 greater in the cortical regions than in the striatum?). These results thus stress the value of the multiple injection PET technique for measuring and comparing receptor density, B′max, and avoid some of the biases inherent in receptor density indices such as BPapp, DV and DVR (Ichise et al., 2002; Slifstein and Laruelle 2000), particularly when comparing the receptor density across regions of the brain.
Another assumption of the reference region models is that a region exists with B′max ≈0. In the case of dopamine D2/D3 receptors, the cerebellum and occipital cortex are frequently used as reference regions. The cerebellum is known to have some regional variability in dopamine receptor density, for example the vermis is reported to have significant dopaminergic innervation (Melchitzky and Lewis 2000), however the cerebellar lobes are believed to have minimal levels of D2/D3 receptor sites. For moderate affinity radioligands such as [C-11]raclopride, lower levels of specific ligand binding are largely obscured by the predominance of free (and nonspecifically bound) ligand. Greater consideration must be given to this assumption when using higher affinity ligands (e.g., FLB 457) since significant specific D2/D3 binding has been reported in the cerebellum of the baboon as well as the occipital and frontal cortex (Delforge et al., 1999).
Two of the rhesus monkeys (M1 and M3) reported here displayed only very small specific D2/D3 binding in the cerebellum, while another (M2) revealed significant binding with measurements of k3 being approximately the same as the cortical regions. It was not possible to uniquely identify the B′max and kon/VR parameters in these regions. Only experiment (#5) was designed and implemented for parameter identification in the cortical regions. This experiment was conducted using monkey M1, which displayed only very low receptor binding. With the measured value of k3 = 0.0097 min−1 for the M1 cerebellum and assuming a 0.03–0.11 range for kon/VR based on the other brain regions, would suggest a B′max value of 0.09 to 0.3 pmol/mL. Simulations with parameter estimates from M1 indicate that the cerebellum D2/D3 receptor sites were almost completely occupied by the large amount of unlabeled fallypride delivered in the second injection. Although separating kon/VR from B′max requires examining the system at a super-physiological level of receptor occupancy, full occupancy also prevents complete parameter identification.
The measurable binding seen in the cerebellum for M2 raises concerns regarding the accuracy of using cerebellar regions in reference region methods for quantifying apparent receptor density or changes in receptor density due to drug occupancy. For example, consider the equation for calculating effective receptor occupancy of a drug based on pre- and post-drug PET scans (Fowler et al., 1998):
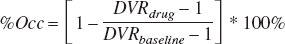
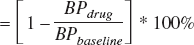
Using the definitions of BPapp and DVR, it can be shown that if significant specific binding is seen in the reference region, the calculation of the occupancy will be erroneously scaled by a term proportional to the reference region binding potential:
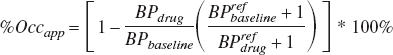
Thus as BPapp in the reference region at baseline, BPrefbaseline, approaches 0, the apparent occupancy, %Occapp, approaches the true occupancy. However, as BPref gets larger the apparent occupancy decreases. This effect is illustrated in Fig. 8, for increasing BPref values. For the case of M2, the baseline BPref of 1.9 was measured. A drug occupying 50% of the receptor sites in this monkey would erroneously measure receptor occupancy of 25%.
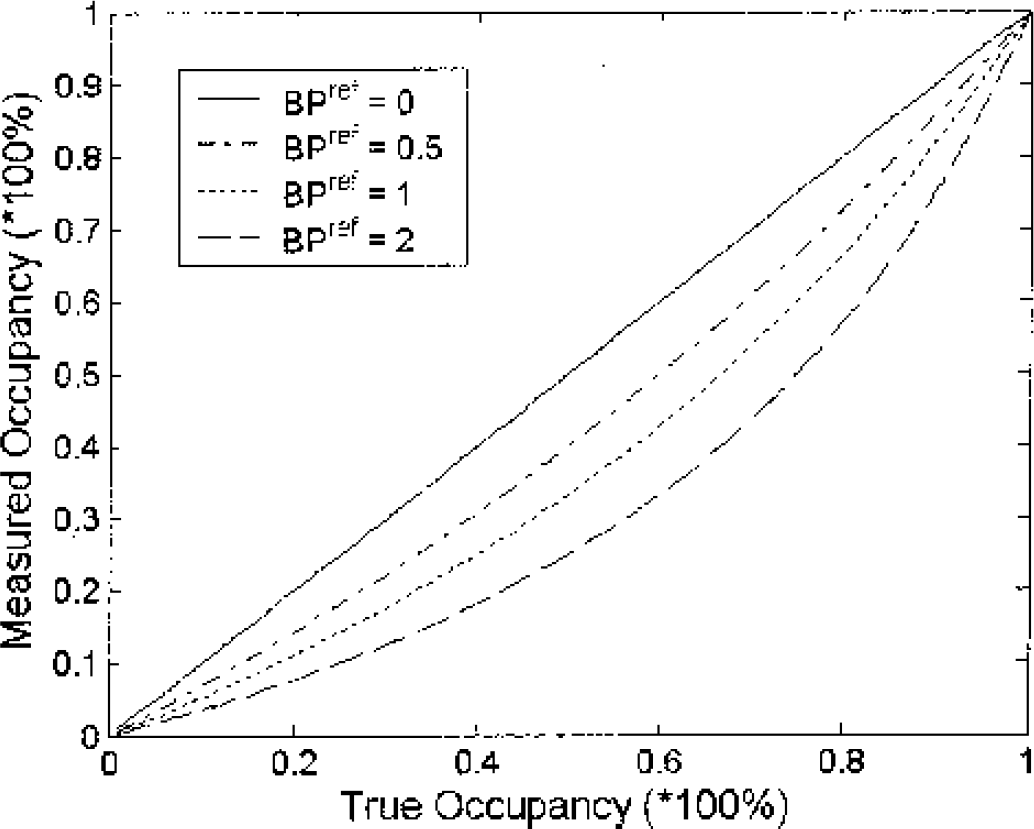
The effect of specific ligand binding in the reference region on the measured receptor occupancy. Curves are shown for varying baseline binding potentials in the reference region and the measured occupancy (%Occ) is calculated according to equation 10 given in the text.
Implications for Single Injection Studies and Methods of Analysis
In the striatal regions of the brain, a very rapid uptake of [F-18]fallypride is seen. As estimated by the model parameters, almost all (> 95%) of the measured PET signal emanates from the specifically bound space after the first 5 minutes of the scan. Fig. 9 displays the separate components of the measured PET signal in the putamen and thalamus from two different experiments. In the putamen, it can be seen that even after the final saturating injection of 200-nmol fallypride, the PET signal is still dominated by the bound radioligand. The fractional bound component continues to grow towards the end of the experiment because clearance of the ligand from the free space is more rapid than dissociation of ligand from the receptor (koff). The specifically bound ligand also dominates the measured PET signal in the thalamus. The increase in the fractional nonspecific component is due to the fact that no additional radioligand was injected for the third injection.
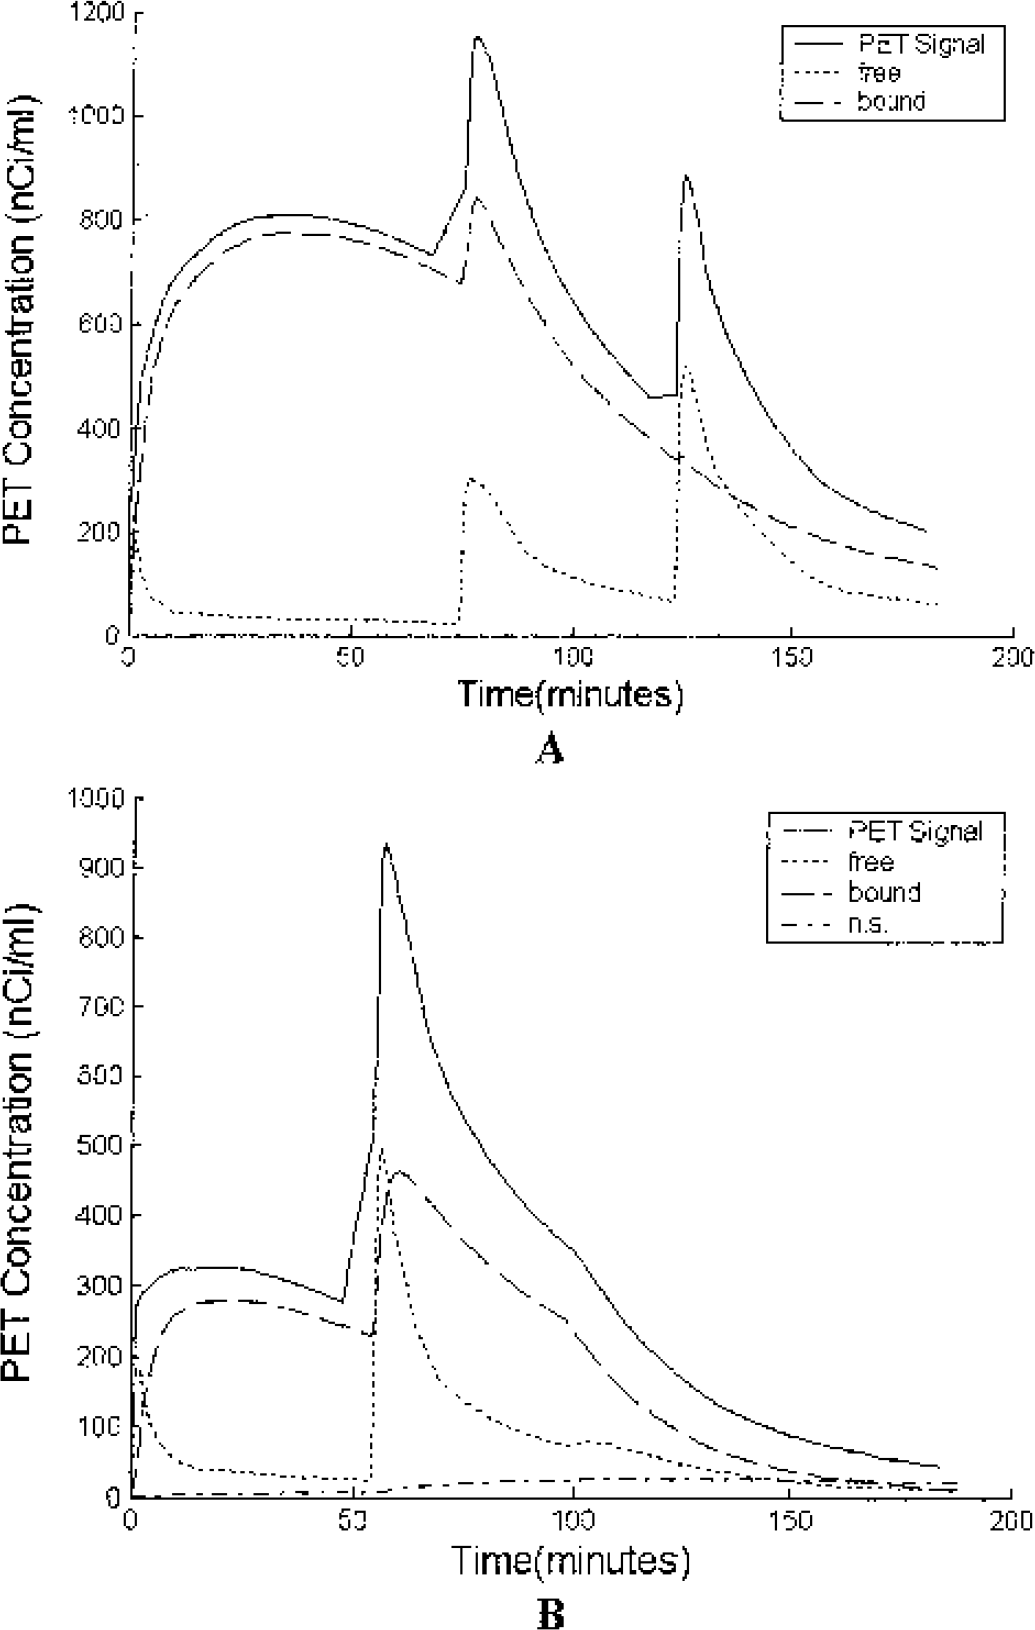
The compartmental components of the PET signal in the putamen (A) from experiment 4 and the thalamus (B) from experiment 2. The PET signal is almost entirely bound ligand for the high specific activity injection in the putamen and approximately 90% in the thalamus. The nonspecific component is so small, even on a fractional basis, that it could not be measured in the putamen and becomes significant in the thalamus only after the bound ligand is displaced.
Flow limited uptake can be a concern for ligands that bind rapidly, (large k3 = kon/VR ∗ B′max) coupled with low tissue extraction (small K1). For the flow limited case, small variations in radioligand uptake could be caused by changes in blood flow and not necessarily changes in receptor density and large biases would be realized if the measurements are made prior to equilibrium. This is of particular concern for drug challenge studies that are known to alter regional cerebral blood flow (Logan et al., 1994). Based on the estimated binding parameters of M2 in the putamen, transient equilibrium (MB/MF+NS = constant) is not seen until approximately 4 hours for a single injection PET experiment. Our earlier work has demonstrated that using the Logan DVR method, stable estimates of the distribution volume ratio can be achieved in 2 hours of scanning in the rhesus monkeys (Christian et al., 2000). This time is reduced to 90 minutes needed for receptor densities similar to that in the thalamus and 60 minutes in the cortical regions. PET scanning for shorter periods of time with [F-18]fallypride will likely introduce biases in receptor density measurements.
CONCLUSIONS
Multiple injection PET protocols were used to determine the in vivo rate constants of [F-18]fallypride and the D2/D3 dopamine receptor density in both the striatal and extrastriatal regions of the macaca mulatta brain. Knowledge of the specific binding rate constants will aid in designing optimal protocols for measuring subtle changes in D2/D3 receptor occupancy of receptor specific drugs or endogenous ligand (Muzic et al., 1996). The cerebellar lobes can be used as a reference region, however the extent of D2/D3 specific binding should be first investigated for each species. The longer half-life of the F-18 radiolabel permits the accurate measurement of receptor density in the striatal regions and the high affinity makes it suitable for the extrastriatal regions of the thalamus and cerebellar cortex.
Footnotes
Acknowledgments
The authors would like to thank Marilyn Brackney and Keri Kovacs for PET scanner operation, Dr. Harold Stills and the Wright State University LAR Staff for assistance with the nonhuman primates, Dr. Martin Satter for technical assistance, Dr. Sankha Chattopadhyay for the synthesis of unlabeled fallypride. We would like to acknowledge the Air Force Laboratory under Cooperative Agreement No. F33615-98-2-6002 for the use of the PET scanner. The assistance of Dr. Ray Muzic Jr. (Case Western Reserve University) with the COMKAT software is greatly appreciated.