
Abstract
This review gives an overview of the application of magnetic resonance imaging (MRI) in experimental models of brain disorders. MRI is a noninvasive and versatile imaging modality that allows longitudinal and three-dimensional assessment of tissue morphology, metabolism, physiology, and function. MRI can be sensitized to proton density, T1, T2, susceptibility contrast, magnetization transfer, diffusion, perfusion, and flow. The combination of different MRI approaches (e.g., diffusion-weighted MRI, perfusion MRI, functional MRI, cell-specific MRI, and molecular MRI) allows in vivo multiparametric assessment of the pathophysiology, recovery mechanisms, and treatment strategies in experimental models of stroke, brain tumors, multiple sclerosis, neurodegenerative diseases, traumatic brain injury, epilepsy, and other brain disorders. This report reviews established MRI methods as well as promising developments in MRI research that have advanced and continue to improve our understanding of neurologic diseases and that are believed to contribute to the development of recovery improving strategies.
Keywords
The introduction of neuroimaging modalities, such as computed tomography (CT), positron emission tomography (PET), single photon emission computed tomography (SPECT), and nuclear magnetic resonance (NMR) imaging, has revolutionized the ability to investigate brain anatomy and physiology in the normal and the diseased brain. Because of its noninvasive nature, its versatility, and its potential for imaging at relatively high spatial and temporal resolution, NMR, typically shortened to magnetic resonance (MR) in medical literature, has evolved into a well-established tool in biomedicine. MR imaging (MRI) techniques enable longitudinal and three-dimensional assessment of brain morphology, metabolism, physiology, and function. Its availability in clinical as well as preclinical settings allows direct bridging of findings in humans and animals, which is of particular interest for studies on brain diseases. Because comprehensive research on an acute, longitudinal, controllable, and reproducible basis is not to be realized in human patients, animal models of neurologic disorders remain essential for the thorough understanding of the mechanisms underlying brain tissue damage and the development of therapeutic strategies. In this review, we give an overview of the application of MRI in studies on experimental brain injury. First, a brief introduction to the principles of MR is given. The second and third sections review MRI methods to assess brain tissue and perfusion status, respectively. In the fourth section, the integration of MRI techniques to obtain diagnostic and prognostic information is discussed. The fifth section deals with current promising developments in MRI research on brain disorders. Finally, some concluding remarks are made.
INTRODUCTION TO MAGNETIC RESONANCE
The principles of MR techniques have been extensively described in a variety of textbooks and will only be briefly discussed. MR is based upon intrinsic magnetic properties of atomic nuclei with an odd number of protons and/or neutrons (e.g., 1H, 13C, and 31P). These nuclei possess nuclear spin (i.e., rotation about their axis), which gives rise to a magnetic dipole moment. When placed in a strong magnetic field B0, the total of nuclear magnetic moments generates a net magnetization (Mz) that is aligned parallel to the external magnetic field and precesses with the Larmor resonance frequency: ω = γB0, where γ is the gyromagnetic ratio of the nucleus.
Nuclear spins can be excited by delivering a radiofrequency (RF) pulse at frequency ω. When a RF pulse of appropriate duration and power is applied by a RF transmitter coil oriented perpendicular to B0, Mz will be flipped into the transverse (xy) plane. The resultant precessing transverse magnetization Mxy will induce an electrical signal, oscillating at frequency ω, in a RF receiver coil placed perpendicular to the direction of B0. This is the actual MR signal, also called free induction decay (FID). Directly after the application of the RF excitation pulse, all nuclear spins have equal phase, and a maximum signal is detected. Because of local interactions between individual spins, phase coherence will be lost, and Mxy will decrease. The time constant that describes the loss of transverse magnetization is the transverse relaxation time T2. In addition, a sample always experiences a certain degree of magnetic field inhomogeneity, resulting in a distribution of resonance frequencies. Consequently, the MR signal actually decreases more rapidly with a decay constant T2*. Finally, the recovery of Mz is described by the longitudinal relaxation time T1.
For the production of an in vivo MR spectrum or image, a sequence of RF pulses is usually combined with specific magnetic gradient pulses superimposed upon the large external field B0. The obtained MR signal is primarily dependent upon the nuclear spin density and the MR relaxation times. The MR signal often is a combination of oscillations from multiple nuclear spin systems of slightly differing resonance frequencies. By applying Fourier transformation, the time-domain data are converted into their equivalent frequency components, which gives rise to the MR spectrum. MR spectroscopy (MRS) allows the detection of various metabolites that can inform upon different biochemical processes in tissue. MRS, however, falls beyond the scope of this review. The application of MRS in brain studies has been excellently reviewed by Kauppinen and Williams (1994).
Magnetic resonance imaging (MRI) implies spatial encoding of the MR signal. In theory, all MR-detectable nuclei can be used for imaging. However, MRI generally refers to the representation of the spatial distribution of the 1H MR signal from water protons that are highly abundant in many mammalian tissues. Spatial encoding is achieved by magnetic field gradients that are superimposed upon the main magnetic field and applied along the x, y, and z coordinate axes. Different MRI methods can provide longitudinal information on the pathophysiology of different neurologic diseases in a noninvasive manner, as is outlined below.
MAGNETIC RESONANCE IMAGING OF TISSUE DAMAGE
A schematic overview of various MRI techniques and examples of their application to brain disease models are given in Fig. 1.
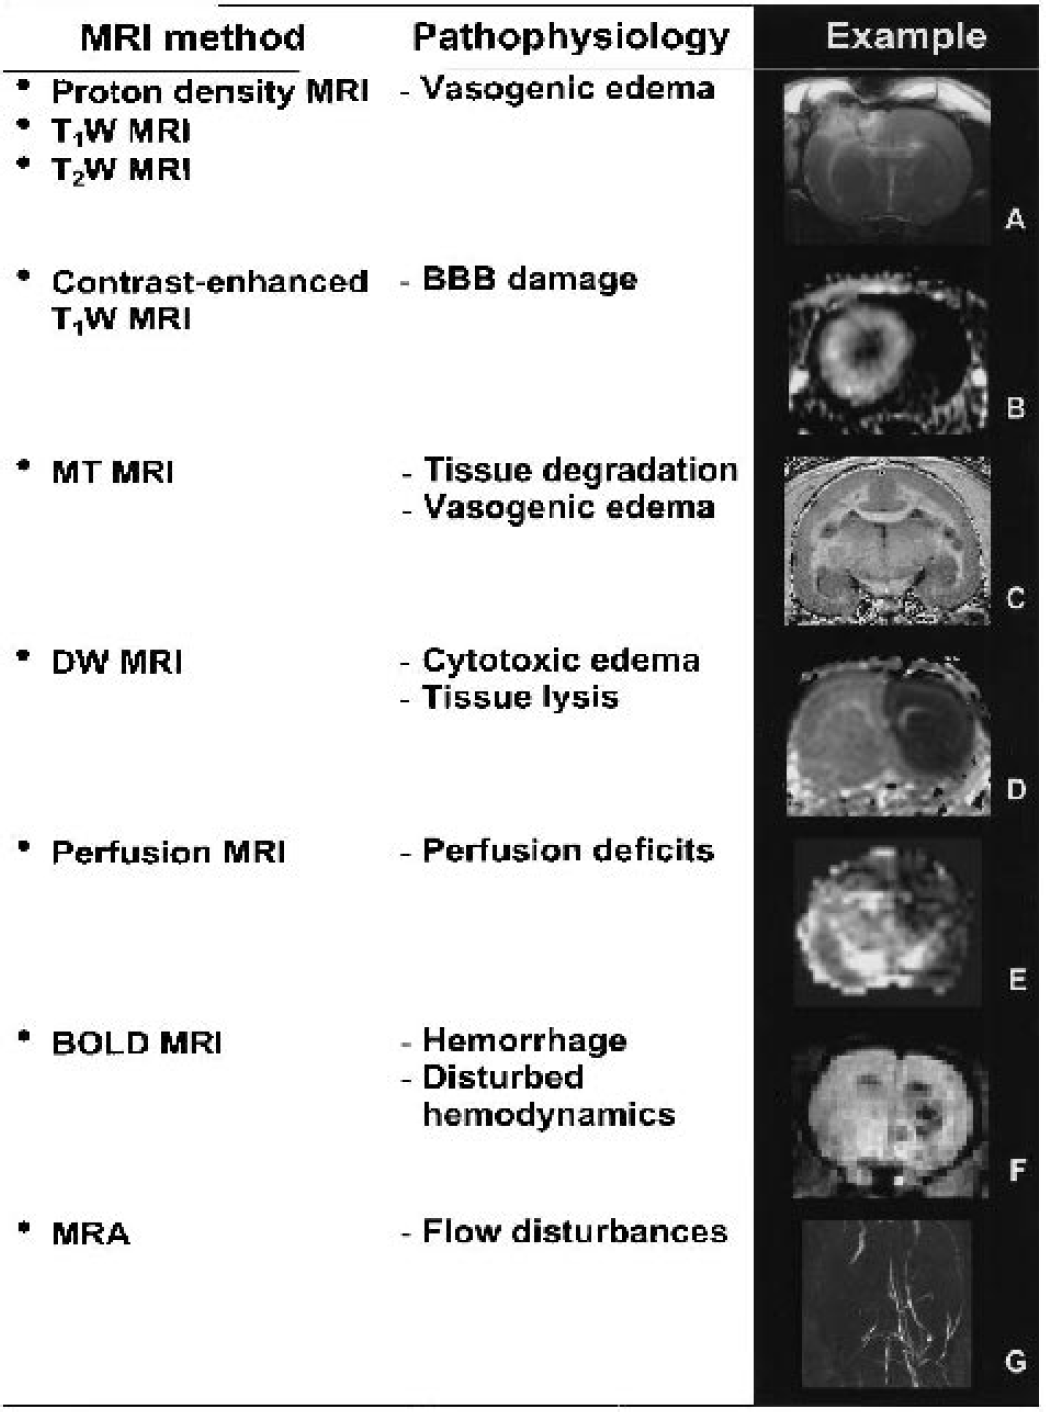
MRI methods, pathophysiologic conditions on which these techniques can provide information, and examples of their use in animal models of brain disorders. (A) T2W MR image at 24 hours after traumatic injury in rat brain. Courtesy of Dr. M.U. Schuhmann. (B) Gadolinium-enhanced T1W MR image of rat brain with intracerebral glioma. From Fonchy et al., Copyright (2001). Reprinted by permission of Wiley-Liss, Inc., a subsidiary of John Wiley & Sons, Inc. Courtesy of Drs. C. Rémy and B.P. van der Sanden. (C) MTR image of marmoset brain with EAE. Courtesy of Dr. E.L. Blezer. (D) ADCav map of neonatal rat brain at 15 minutes after intrastriatal NMDA injection. From Veldhuis et al. (2003). Reprinted with permission from Lippincott, Williams & Wilkins. Courtesy of Dr. W.B. Veldhuis. (E) CBV map calculated from DSC MRI at 90 minutes after unilateral hypoxia-ischemia in neonatal rabbit brain. From D'Arceuil et al., Copyright (1998). Reprinted by permission of Wiley-Liss, Inc., a subsidiary of John Wiley & Sons, Inc. Courtesy of Dr. H. D'Arceuil. (F) BOLD MR image of rat brain with intracerebral hemorrhage. From Neumann-Haefelin et al. (2001). Reprinted with permission from Lippincott, Williams & Wilkins. Courtesy of Drs. T. Neumann-Haefelin and M.E. Moseley. (G) MRA of rat brain at 1 hour after MCA occlusion. From Reese et al., Copyright (1999). Reprinted by permission of Wiley-Liss, Inc., a subsidiary of John Wiley & Sons, Inc. Courtesy of Dr. T. Reese.
Proton density and T1- and T2-weighted magnetic resonance imaging
Proton density MRI maps the density (or concentration) of water proton spins. The T1 and T2 of water proton spins are dependent upon the physicochemical state of tissue water. “Free” bulk water, such as that present in the cerebral ventricles, has high T1 and T2 values, whereas intracellular water, which interacts with macromolecules, has shorter T1 and T2 times. Many types of pathology, such as tumors, edema, and hemorrhage, are associated with changes in water content and relaxation rates. As a result, MRI techniques have become of enormous importance as diagnostic tools in both clinical and experimental studies.
The most popular pulse sequence in biomedical MRI research is the spin-echo sequence. A 90° RF pulse tips the longitudinal magnetization (Mz) to the transverse (xy) plane. After a time t, during which dephasing in the xy plane occurs, a 180° RF pulse is given. Consequently, the dephased magnetization components will refocus, resulting in an “echo” signal after time t. The echo signal is used for MR data acquisition. The time between the 90° RF pulse and the echo (i.e., 2t) is called the echo time (TE). The time between two successive 90° RF pulses is called the repetition time (TR). The resultant magnetization M can be described by: M = Mz((1 − exp(—TR/T1)) exp(—TE/T2). Clearly, the degree of weighting for proton density (which is proportional to Mz), T1, or T2 can be altered by adjusting the TR or TE values.
Proton density, T1-weighted (T1W), and T2-weighted (T2W) MRI are considered as conventional MRI methods in the assessment of neurologic disorders. During the starting years of biomedical applications of MRI, these techniques demonstrated their potential to detect cerebral lesions in animal models of stroke (Buonanno et al., 1982), traumatic brain injury (Bederson et al., 1986), brain tumors (Bederson et al., 1986), and multiple sclerosis (Stewart et al., 1985). An increase in proton density, as well as T1 and T2, in pathologic tissue is attributed to an increase in interstitial water associated with the development of vasogenic edema (see van Bruggen et al., 1994 and references therein) (Fig. 1). Kato et al. (1986) demonstrated in ischemic rat and gerbil brain that both T1 and T2 correlated well with tissue water content but that T2 changes were larger than T1 changes. Proton density, T1, and T2 increases around 5%, 30%, and 50%, respectively, have been found at 7 hours after experimental stroke in rats (Hoehn-Berlage et al., 1995). Also, in edematous tissue in experimental brain tumors, T2 changes are most pronounced; relative changes of approximately 10%, 35%, and 45% for proton density, T1, and T2, respectively, have been reported (Eis et al., 1995). Because of its superior sensitivity, T2W MRI has been extensively applied to delineate lesions in both clinical and experimental diagnostic studies. Several studies have demonstrated excellent correlations between T2W hyperintensities and tissue damage as determined by histologic examination (see van Bruggen et al., 1994).
Vasogenic edema typically develops during subacute and chronic stages. Correspondingly, proton density increase and prolongation of T1 and T2 are predominantly associated with late and irreversible damage. Nevertheless, early T1 and T2 changes of a few percent have been observed in the hyperacute stages of experimental cerebral ischemia (Calamante et al., 1999a). Hyperacute prolongation of T1 may be related to cessation of blood flow (Calamante et al., 1999a), whereas T2 reduction directly after cerebral ischemia is believed to be the result of tissue deoxygenation, which is further discussed later in this review.
Changes in the on-resonance T1 in the rotating frame, T1ρ, have also been shown to occur within minutes after cerebral ischemia (Gröhn et al., 1999). T1ρ is believed to probe water in association with macromolecules, and thus the increase in T1 may report on changes in the macromolecular components of the tissue.
Contrast-enhanced T1-weighted magnetic resonance imaging
T1W MRI can show strong tissue signal enhancement when combined with a paramagnetic contrast agent. Paramagnetic agents interact with nearby water protons via dipole-dipole connections, which affects relaxation times of the proton spins. The predominant effect is observed on T1 (i.e., T1 shortening). Gadolinium-based compounds such as dimegluminegadopentetate (Gd_DTPA) are most frequently applied as paramagnetic MR contrast agents. In normal brain tissue, extravasation of intravenously injected MR contrast agent is prevented by the blood-brain barrier (BBB). However, when the BBB is disrupted, contrast agents can leak out of the vasculature and accumulate in brain tissue, resulting in local signal enhancement in T1W MRI. The use of exogenous contrast agents to achieve T1W contrast has gained widespread use for the study of BBB integrity. Runge et al. (1985) were the first to demonstrate that the postcontrast signal intensity changes on T1W MR images correspond with local BBB breakdown.
A leaky BBB is a well-known feature in brain tumors (Fig. 1). Contrast-enhanced T1W MRI has been applied to delineate the presence and extent of brain tumors in experimental models and has shown excellent correlation with histologic measures (Whelan et al., 1987). Schmiedl et al. (1992) demonstrated that the dynamics of BBB permeability in a rat astrocytic glioma model can be assessed by sequentially measuring leakage of MR contrast agents of different sizes. BBB integrity and tumor perfusion are important factors in tumor therapy. Rapid T1W MRI in combination with intravenous injection of a relatively small MR contrast, such as Gd_DTPA, allows quantification of estimates of glioma microvascular permeability and fractional blood volume (Ostrowitzki et al., 1998), which has been successfully applied to monitor antiangiogenic therapy in a rat glioma model (Gossmann et al., 2002). Van der Sanden et al. (2000) applied dynamic Gd_DTPA-enhanced T1W MRI to assess the functional neovasculature in rat brain 9L-glioma. They demonstrated that the rate of Gd_DTPA accumulation in tumor tissue correlates with perfused microvessel density and vascular surface area.
Disruption of the BBB in stroke is the result of endothelial damage caused by permanent or transient ischemia. Consequently, T1W MRI after intravenous administration of a MR contrast agent will show signal intensity enhancement in the lesioned area (see van Bruggen et al., 1994). BBB damage may exacerbate vasogenic edema and has been associated with an increased risk of hemorrhagic transformation. With contrast-enhanced T1W MRI, it has been demonstrated that BBB damage acutely after reperfusion in a rat stroke model is predictive of T2 prolongation associated with vasogenic edema at subacute stages (Neumann-Haefelin et al., 2000). In another study, Gd_DTPA tissue enhancement was detected in areas with subsequent bleeding early after reperfusion in a rat stroke model (Knight et al., 1998).
Neuroinflammation plays a major role in the pathology of stroke, multiple sclerosis, brain trauma, and chronic neurodegenerative diseases and is considered to be an important mediator in the disruption of the BBB. This has been confirmed by a recent study by Blamire et al. (2000) who showed that intracerebral cytokine injection resulted in acute Gd_DTPA leakage through the BBB. In accordance, contrast-enhanced T1W MRI studies have demonstrated BBB damage after experimental allergic encephalomyelitis (EAE) (Hawkins et al., 1990), an autoimmune disorder that results in inflammation and demyelination in the brain, similar to multiple sclerosis. It is important to note that acute, active inflammatory lesions may be distinguished from chronic lesions by increased BBB permeability for Gd_DTPA (Karlik et al., 1993).
Contrast-enhanced T1W MRI has also been used to follow the evolution of rapid and transient BBB opening after experimental traumatic brain injury (Barzo et al., 1996) and experimental epilepsy (Roch et al., 2002).
Magnetization transfer imaging
Magnetization transfer (MT) effects are caused by chemical exchange or dipole-dipole interactions between protons from water and macromolecules. This phenomenon can be used as a MR contrast mechanism. The very broad MR signal from protons of macromolecules and immobile water can be suppressed by off-resonance, frequency-selective RF irradiation, which does not affect the narrow MR signal from mobile water molecules. Saturation of the immobile proton pool causes a reduction of the signal from the free water pool via chemical exchange and cross-relaxation. This MT effect informs on the ratio between free and bound proton pools [MT ratio (MTR) = (S0 − Ss)/S0, where Ss and S0 are the signal intensities with and without saturation, respectively], on the rate of magnetization exchange and on the magnetic properties of the immobilized proton pool.
MT imaging has been successfully applied in pathologies that alter the structural integrity of brain tissue, such as multiple sclerosis and other white matter disorders (see Brochet and Dousset, 1999, for a review) (Fig. 1). Reductions in MTR in demyelinating lesions (MTR decreased to 0.34 after 8 days, as compared with 0.48 to 0.51 in normal tissue) correlate with myelin and axon destruction (Dousset et al., 1995). Nevertheless, other pathologic features may also be involved in the MTR decrease. Prevention or reversal of MTR without accompanying recovery of myelin water content has been found after modulation of inflammation after EAE in guinea pig brain (Brochet and Dousset, 1999). MT imaging may play an important role as a surrogate marker of myelin repair because recovery of MTR has been shown to correspond with remyelination (Deloire-Grassin et al., 2000).
In experimental cerebral ischemia, a reduction in MTR may be related to breakdown of macromolecular tissue components and vasogenic edema-associated increase in free interstitial water (Ordidge et al., 1991). Ewing et al. (1999) reported a drop in the apparent forward transfer rate for magnetization between the free water proton pool and the immobile proton pool during the first 6 hours after middle cerebral artery (MCA) occlusion in rats. They concluded that this was predominantly caused by an increase in tissue water content and to lesser extent to degradation of macromolecular structures.
In other neurologic disease models, data on MT effects are sparse. MT contrast reductions have been reported in studies on experimental brain tumors (Quesson et al., 1997). In experimental traumatic brain injury, MT contrast was found to be significantly reduced in regions with diffuse axonal injury (Smith et al., 1995).
Diffusion-weighted magnetic resonance imaging
An attractive feature of MR is that it allows the measurement of incoherent (random) Brownian displacements, that is, self-diffusion, of MR-detectable molecules. DW MRI is sensitized to the microscopical translational motion of water in tissues, which is accomplished by incorporating strong magnetic gradient pulses in the RF pulse sequence (Le Bihan, 1988). Because DW MRI measures all incoherent motions inside a voxel, and motion in tissue is influenced by all kinds of factors such as local barriers (e.g., membranes), transport processes, and adsorption to macromolecules, in vivo DW MRI does not actually measure the intrinsic self-diffusion of water molecules. Therefore, one speaks of apparent diffusion, which is quantitatively expressed by the so-called apparent diffusion coefficient (ADC).
In recent years, this technique has proven to be a powerful extension of the capabilities to MRI because of its sensitivity to several cellular changes and tissue abnormalities and its potentials in detecting diseased regions at an earlier stage than conventional MRI methods. An increase of signal intensity on DW MR images of ischemic cat brain within approximately 15 minutes was first described by Moseley et al. (1990). In contrast, signal intensity increases on T2W MRI were not observed before 2 hours after MCA occlusion. The signal intensity increase on the DW MR images points toward a reduction in the ADC of brain tissue water. Moseley et al. (1990) attributed their observation of the ischemia-induced ADC reduction to an osmotically obliged shift of extracellular water to intracellular compartments that is the result of a disrupted ion homeostasis (i.e., cell swelling or cytotoxic edema). This hypothesis is supported by studies from Benveniste et al. (1992) who measured water ADC reductions after intracerebral injection of ouabain, glutamate, or N-methyl-D-aspartate (NMDA) in rats, all of which induce cytotoxic edema (Fig. 1). Verheul et al. (1994) and van der Toorn et al. (1996) found significant correlations between water ADC changes and reversible cell swelling-induced alterations in extracellular space volume in neonatal rat models of excitotoxicity and global ischemia, respectively. Despite the evident association of tissue water ADC reductions with the development of cytotoxic edema, the exact biophysical basis of the water ADC reduction remains incompletely solved. Probably the most straightforward theory is the altered contribution of intra- versus extracellular water diffusion. The tissue water ADC as measured by use of DW MRI is a composite of the intra- and extracellular water ADC. When cytotoxic edema develops, part of the water moves from the extracellular space where it assumably diffuses relatively freely to intracellular compartments with a high density of diffusional barriers and restrictions. Consequently, the overall tissue water ADC would decline. Measurements of extra- and intracellular diffusion parameters suggest that increases in extracellular and intracellular tortuosity are also likely to contribute to the tissue water ADC decrease (see reviews by Gass et al., 2001; Nicolay et al., 2001).
A reduction in the ADC of brain tissue water by approximately 30% to 40% after 10 to 15 minutes starts around 2 minutes after onset of ischemia (Davis et al., 1994). The rapid, strong ADC drop occurs during anoxic depolarization, although gradual ADC decreases may appear even earlier (de Crespigny et al., 1999). Passing ischemic tissue depolarizations in the ischemic border zone that are accompanied by massive ionic shifts and temporary cell swelling have been detected as waves of ADC transients by use of rapid DW MRI techniques (Hasegawa et al., 1995). These transient tissue disturbances contribute to the expansion of the lesion (Takano et al., 1996), and the ADC lesion volume and degree of ADC reduction have been shown to correlate with the total duration of tissue depolarization (Dijkhuizen et al., 1999).
The application of DW MRI has been extensively investigated in adult models of cerebral ischemia (Hoehn-Berlage, 1995; Hoehn et al., 2001). However, early ADC reductions have also been detected in other neurologic disease models, such as neonatal hypoxia-ischemia (Rumpel et al., 1997), traumatic brain injury (Hanstock et al., 1994), and subarachnoid hemorrhage (Busch et al., 1998).
In cerebral ischemia, a reduction in the tissue water ADC develops when tissue perfusion has decreased below a certain threshold; such as below 15 to 20 mL/100/min in a gerbil model of global cerebral ischemia (Busza et al., 1992) and below 35 mL/100g/min after focal ischemia in rat brain (Perez-Trepichio et al., 1995). The perfusion threshold for ADC changes has been shown to increase as a function of time of ischemia (Mancuso et al., 1995). Nevertheless, ADC reductions may also occur without concomitant ischemia or energy depletion. For example, the ADC changes that are induced by certain excitotoxins (Verheul et al., 1993) and seizures (Zhong et al., 1993) could be the result of chronic perturbation of ion homeostasis and consequent intracellular water accumulation and occur without severe changes in blood flow and tissue energy status. Cell swelling as a result of impaired ion homeostasis in itself may not be injurious and, in theory, is reversible. Treatment studies in a neonatal rat excitotoxicity model have demonstrated that lowered ADC values in cortex and striatum as a result of NMDA injection can completely renormalize after treatment with a NMDA-antagonist (Verheul et al., 1993). Importantly, these initially affected regions were free of signs of histologic damage at later stages.
An important question is whether DW MRI can provide prognostic information on the development of ischemic damage and whether it can differentiate between reversibly injured regions and irreversibly damaged tissue. Dardzinski et al. (1993) described that ADC values below 0.55 × 10⁻³ mm2/s in early focal ischemic rat brain predict tissue infarction. Nevertheless, the use of such an ADC threshold is not straightforward because its value may be time-dependent, most probably differs between specific brain regions, and would be influenced by other pathophysiologic conditions. A prolonged disruption of ion homeostasis initiates a variety of injurious processes that can ultimately lead to cell death. Thus ischemic tissue in which cytotoxic edema has existed for an extended period may have advanced into a state of irreversible damage. Under these conditions, normalization of the cellular volume by restoration of blood supply does not necessarily represent actual tissue recovery. Correspondingly, it has been demonstrated that an acute ischemia-induced reduction in brain tissue water diffusion can recover upon reperfusion but may be followed by a secondary decline (Zarow et al., 1995). Brain regions that exhibited a secondary ADC drop after transient cerebral ischemia manifested irreversible tissue damage at later stages (Dijkhuizen et al., 1998). Histologic examination during the phase of temporary recovery of the ADC revealed persistent neuronal shrinkage and astrocytic swelling (Li et al., 2002). Thus ADC normalization after spontaneous reperfusion or therapeutic intervention after an ischemic insult is not a good predictor of ultimate tissue recovery.
At subacute stages, the water ADC reduction becomes less pronounced. Jiang et al. (1993) showed that tissue water ADC levels had returned to preischemic levels at 2 to 3 days after onset of focal ischemia in rats. A subsequent increase in the diffusion of water above preischemic control values (up to 1.5 × 10⁻³ mm2/s) can be observed after 1 week (Verheul et al., 1992). The elevated ADC of tissue water is associated with cellular lysis (Pierpaoli et al., 1993). The loss of cellular barriers combined with the excessive accumulation of (more freely diffusing) edematous water would explain the high water ADC values. This implies that DW MRI may also inform on loss of tissue structure that occurs at more chronic stages. Indeed, DW MRI in chronic demyelinating disease models, such as EAE, demonstrated increased water diffusion in white matter areas (Heide et al., 1993). Similarly, white matter edema in hydrocephalic rat brain also exhibits an increased ADC (Braun et al., 1997). In addition, cystic, necrotic, and edematous tissue in and near brain tumors can be identified as areas with high ADC values (Eis et al., 1995).
DW MRI has also been examined as a tool to monitor responses to tumor therapy (see reviews by Kauppinen, 2002; Ross et al., 2002). Treatment-induced killing of tumor cells in a 9L brain glioma model, resulting in a decrease of cellular density in tumor tissue, is accompanied by an increase of the ADC (Chenevert et al., 1997). The elevated ADC may be explained by destruction of tumor cells, widening of the extracellular space, and a consequent increase in extracellular, relatively mobile water. At later time-points, the ADC subsequently decreased, supposedly because of cellular repopulation.
MAGNETIC RESONANCE IMAGING OF HEMODYNAMICS
Perfusion magnetic resonance imaging
A crucial parameter in many brain disorders is the tissue perfusion status. Estimation of regional perfusion levels can provide critical information on the development of tissue damage. Several MR techniques are able to measure brain hemodynamics (see reviews by Calamante et al., 1999b; Hossmann and Hoehn-Berlage, 1995). The most popular MR approaches to assess cerebral microcirculation are dynamic susceptibility contrast-enhanced (DSC) and steady state susceptibility contrast-enhanced MRI, which measure signal changes after intravascular injection of an exogenous contrast agent, and arterial spin labeling (ASL) techniques, which make use of endogenuos arterial water as a perfusion tracer.
The contrast agent-induced change in effective transverse relaxation rate (ΔR2(*)) as a function of time is defined as ΔR2(*)(t) = 1/ T2(*)(t) − 1/ T2(*)(0) = −ln(S(t)/S0)/TE, where S(t) is the signal intensity at time t after bolus injection, S0 is the precontrast signal intensity, and TE is the echo time in the pulse sequence. ΔR2(*) has been shown to be approximately linearly proportional to the concentration of contrast material in tissue c(t) (Rosen et al., 1990). From tracer kinetic theory and the central volume principle, it follows that cerebral blood volume (CBV), mean transit time (MTT), and cerebral blood flow (CBF) can be calculated from the tissue response curve, deconvolved with the arterial input function (see Rosen et al., 1990, and references therein). However, CBF quantification based upon DSC MRI data is complicated (Calamante et al., 1999b; Weisskoff et al., 1993). For example, selection, acquisition, and calculation of the correct arterial input function are not straightforward. Nevertheless, even without knowledge of the arterial input function, various semiquantitative parameters that inform on hemodynamics (e.g., bolus peak time, maximal ΔR2(*), relative CBV, and relative CBF index (CBFi)) can be measured (Calamante et al., 1999b).
DSC MRI has been used to study various animal models of ischemia. Loss of perfusion was demonstrated by Kucharczyk et al. (1991), who described absence of contrast agent passage on DSC MR images in a focal ischemic lesion in the cat. Multiple other studies on ischemia in adult (see Calamante et al., 1999b; Hossmann and Hoehn-Berlage, 1995) and neonatal animal models (D'Arceuil et al., 1998) have used DSC MRI to assess the pattern of perfusion deficits (Fig. 1). Spatial assessment of multiple hemodynamic parameters can identify brain regions in which microcirculation is preserved but compromised (Roberts et al., 1993). For example, a mismatch between relative CBFi and relative CBV could indicate compensatory vasodilatation, whereas a delayed bolus peak time in perifocal areas may reflect alternative routes of blood supply via collaterals. DSC MRI can also evaluate the hemodynamic consequences of induction of reperfusion (e.g., no reflow, hyperemia, or hypoperfusion) (Hamberg et al., 1993).
DSC MRI-based CBV mapping of 9L gliosarcomas in rats has recently been evaluated as a potential means of measuring tumor vascularity and angiogenesis (Pathak et al., 2001). It was shown that MRI-derived CBV correlated with histologically measured fractional volume of vessels.
ASL is completely noninvasive because it does not require intravascular bolus injection of MR contrast agent. In addition, it can be executed with short interscan times because prolonged washout time of previously injected contrast agent is not an issue. However, as compared with DSC MRI, ASL is currently hampered by low signal-to-noise ratios and relatively long scan times, and it does not allow measurement of multiple hemodynamic parameters. Nevertheless, ASL techniques have been applied with increasing frequency in animal models of neurologic disorders. Serial CBF measurements with continuous or pulsed ASL have been performed after acute cerebral ischemia in rats (Jiang et al., 1993), gerbils (Pell et al., 1999), and mice (van Dorsten et al., 1999). Forbes et al. (1997) applied ASL to measure CBF after experimental traumatic brain injury caused by controlled cortical impact. CBF values after 24 hours were significantly lower in the contusion zone as compared with the contralateral cortex (142 ± 73 versus 280 ± 64 mL/100g/min). In addition, ASL measurements revealed attenuated CO2 reactivity (i.e., CBF response to change in arterial CO2 pressure) in rats with traumatic brain injury. In rats with inoculated 9L glioma cells, ASL after approximately 2 weeks exhibited heterogeneous tumor blood flow (Silva et al., 2000). Blood flow was most severely diminished in the tumor core (approximately 25% of contralateral white matter blood flow), whereas moderate blood flow reductions were detected in the tumor periphery (approximately 60% of contralateral white matter blood flow).
Steady state susceptibility contrast-enhanced MRI has also been applied to measure brain tumor vascularization. Because gradient- and spin-echo steady state susceptibility contrast-enhanced MRI are sensitive to varying sizes of blood vessels, combining these approaches can provide information on growth and distribution of vessels in glioma models (Dennie et al., 1998). Calculation of ΔR2*/ΔR2 after injection of monocrystalline iron oxide nanocompounds (MION) allowed estimation of average vessel size in regions-of-interest, which was validated and calibrated with histologically measured mean vessel radius (Dennie et al., 1998). Two-dimensional maps of ΔR2*/ΔR2 demonstrated increased vessel size in tumors as compared with surrounding tissue, thereby informing on local differences in vascular morphology and angiogenesis.
Zaharchuk et al. (1998) have introduced a technique, CAPTIVE, that combines T1-based ASL and steady state susceptibility contrast-enhanced MRI, permitting continuous and simultaneous measurement of CBF and CBV, which was successfully applied in a transient focal cerebral ischemia model. The method makes use of a special intravascular contrast agent that has a long blood half-life and a high tissue:blood susceptibility difference to ΔR1 ratio. CAPTIVE offers the opportunity to assess dynamic changes in CBF and CBV quantitatively in steady state mode. By this means, the authors demonstrated a CBF-CBV mismatch during the first 20 minutes of focal ischemia in rat brain.
Blood oxygenation level-dependent magnetic resonance imaging
Blood oxygenation level-dependent (BOLD) MRI is based upon the magnetic property of blood, which is dependent upon the oxygenation state of hemoglobin (Ogawa et al., 1990). Deoxygenated hemoglobin is paramagnetic, whereas oxyhemoglobin is diamagnetic. Deoxygenation results in increased local magnetic susceptibility differences between intra- and extravascular compartments and thereby causes signal loss on T2W and T2*W MR images. This mechanism is essentially similar to T2(*)-shortening by exogenous contrast agents, be it that BOLD MRI makes use of an endogenous contrast agent (i.e., deoxyhemoglobin). The magnetic susceptibility changes caused by deoxyhemoglobin are much smaller than induced by exogenous strong paramagnetic contrast agents.
The sensitivity of BOLD MRI to the status of blood in tissue creates opportunities to assess hemodynamic factors in brain (patho)physiology. For example, deoxygenation of hemoglobin after hemorrhage allows detection of acute hematomas, which appear as clear hypointensities on spin-echo T2W and, in particular, on gradient-echo T2*W MR images (Gustafsson et al., 1999) (Fig. 1). Because BOLD MRI is sensitive to changes in the regional tissue oxygenation status, it can be used to monitor acute deoxygenation after induction of ischemia as well as reoxygenation after reperfusion. BOLD MR signal intensity drops by a few percent immediately upon onset of ischemia, and rises when reflow ensues. A transient overshoot in signal intensity to 5% above preischemic levels during reperfusion has been detected with a 2 T MR scanner (larger signal intensity changes are expected at higher magnetic field strengths), which may reflect postischemic luxury perfusion (de Crespigny et al., 1992). These hemodynamic responses indirectly report on local changes in perfusion and oxygen extraction fraction. For example, flow-compromised but metabolically active areas with increased oxygen extraction will display a reduction in BOLD signal (see Gröhn and Kauppinen, 2001). On that account, BOLD MRI may provide information on potentially salvageable “tissue-at-risk”. Still, the individual contributions of alterations in CBF, CBV, oxygen metabolism, and hematocrit to the MR signal intensity changes cannot be easily distinguished from BOLD MRI data. The acute T2(*) decline in ischemic brain is usually only temporary as the amount of deoxygenated hemoglobin declines (because of reduced oxygen extraction, reduced blood volume, or hemolysis) and vasogenic edema starts to develop (Roussel et al., 1995).
Vascular reactivity of brain tissue can be examined by combining BOLD MRI with a specific challenge. De Crespigny et al. (1993) modulated blood oxygenation levels in focal ischemic cat brain by temporary apnea and observed BOLD signal intensity changes only in perfused areas. A vasodilatory challenge, induced by injection of the vasodilator acetazolamide or by CO2 inhalation, led to increases in BOLD MR signal intensity of approximately 5% in normal tissue (at 2 T magnetic field strength), whereas no changes were observed in ischemic tissue, suggesting failure of autoregulatory response (Moseley et al., 1993; Ono et al., 1997). Early reperfused areas demonstrated recovery of vascular reserve capacity (Ono et al., 1997). In brain tumors, BOLD MRI can inform on tumor oxygenation and hemodynamics, thereby providing important information on tumor microvasculature. Mazurchuk et al. (1999) showed that hyperemia and hyperoxygenation, induced by acetazolamide injection in combination with 100% O2 inhalation, led to BOLD MR signal intensity increases of up to 25% (at 1.5 T) in viable rat brain tumor tissue with functioning microvessels, whereas necrotic regions hardly showed any BOLD changes. Because cerebrovascular reactivity is an important hemodynamic index in brain disease, BOLD MRI may provide tools to differentiate between irreversibly damaged areas and tissue in jeopardy.
BOLD MRI also forms the basis for functional MRI (fMRI). During neuronal activation in the brain, the local rise in cerebral metabolic rate results in an elevation of both oxygen demand and local CBF. However, the increase in oxygen supply exceeds the increase in oxygen consumption in the activated neuronal network. The consequent increase in local blood oxygenation leads to an increase of BOLD MR signal. Functional MRI allows noninvasive generation of functional brain activation maps with relatively high spatial and temporal resolution. BOLD fMRI and other fMRI methodologies, as well as their application in animal models are further discussed in a later section.
Magnetic resonance angiography
Macroscopic flow, for example through large vessels, can be measured with MR angiography (MRA). MRA techniques are based upon the differentiation between stationary and moving spins. This can be accomplished by repetitively applying RF pulses to saturate stationary tissue and enhance flow-related contrast. Alternatively, phase differences between stationary spins and spins moving along magnetic field gradients can also be used for flow quantification. MRA also provides a tool for visualizing large blood vessels, as well as flow directions, and is frequently applied to determine the degree of stenosis in patients. The relatively low in-plane spatial resolution has confined MRA predominantly to the study of large brain vessels in humans. Nevertheless, high-resolution MR angiograms (three-dimensional time-of-flight MRA) have been obtained in rats (Reese et al., 1999) and mice (Beckmann, 2000). Obstruction of blood flow through an occluded major cerebral artery can be clearly visualized with MRA (Reese et al., 1999) (Fig. 1). Moreover, it may provide additional information on the severity of thromboembolic stroke and the potential for recanalization and tissue recovery following thrombolytic treatment (Hilger et al., 2002).
DIAGNOSIS AND PROGNOSIS WITH MULTIPARAMETRIC MAGNETIC RESONANCE IMAGING
Noninvasive information on the location and size of a brain lesion and the degree of cerebral damage is essential for the diagnosis and prognosis of a neurologic disorder. Multiple MRI parameters can be examined in the same MR session; the combination of diverse MRI methods creates an excellent opportunity for a comprehensive diagnosis of brain injury and a thorough analysis of therapeutic intervention strategies. The combination of MRI measurements of tissue damage and hemodynamic disturbances may provide important anticipative information. In acute cerebral ischemia, for example, lesion volumes determined from DW MRI are usually smaller than the volumes of changed perfusion as determined from perfusion MRI (see Baird and Warach, 1998). At later stages, progression of infarction can occur into the region of abnormal perfusion. Thus a mismatch between the region of perfusion abnormality and the region of ADC reduction may be predictive of lesion enlargement. Other MR methods can be applied to obtain supplementary diagnostic information. Conventional T2W MRI in combination with ADC mapping can aid in the distinction between acute and chronic lesions. Assessment of the BBB integrity can be done with postcontrast T1W MRI, for example, after tracking of the first passage of the bolus of contrast agent with DSC MRI. MTC and BOLD MRI may provide supplementary data on tissue damage and hemodynamics, respectively. Macrovascular flow and large vessel patency can be measured with MRA. Finally, recently developed MRI approaches enable collection of supplementary information on tissue structure, neuronal activation, cell migration and gene expression (see below).
Magnetic resonance imaging in pharmaceutical research
MRI is an ideal method to evaluate treatment strategies in experimental models of neurologic disorders. The application of MRI in preclinical pharmaceutical research has been reviewed by Rudin et al. (1999).
The potential of multiparametric MRI as a tool to study therapeutic intervention is well illustrated in recent studies on thrombolytic therapy after embolic stroke. Thrombolysis with recombinant tissue plasminogen activator (rt-PA) is currently the only approved treatment strategy in acute ischemic stroke (The National Institute of Neurological Disorders and Stroke rt-PA Stroke Study Group, 1995). In an embolic stroke model, the combination of perfusion MRI and DW MRI has demonstrated that rt-PA administration within 1 hour after stroke improves perfusion and reduces ischemic tissue damage (Yenari et al., 1997) (Fig. 2A). Nevertheless, a serious complication is that rt-PA administration leads to increased risk of hemorrhagic transformation (The National Institute of Neurological Disorders and Stroke rt-PA Stroke Study Group, 1995), which has precluded treatment with rt-PA beyond the time window of 3 hours. Understanding the hazards and basis of bleeding may improve the efficacy of treatment with rt-PA. Recent studies in experimental stroke models suggest that MRI is able to identify regions destined to hemorrhagic transformation. With the use of postcontrast T1W MRI, enhanced leakage of the contrast agent Gd_DTPA, caused by BBB damage before rt-PA administration, was found in areas with subsequent hemorrhage after rt-PA treatment in a rat embolic stroke model (Dijkhuizen et al., 2001a) (Fig. 2B). Subsequently, steady state susceptibility contrast-enhanced MRI demonstrated that rt-PA treatment can exacerbate early ischemia-induced damage to microvascular barriers, thereby enhancing hemorrhagic transformation (Dijkhuizen et al., 2002) (Fig. 2C). Other MRI studies have implied the inverse of the apparent forward transfer rate for MT (Jiang et al., 2002) and ADC values below 0.55 × 10⁻³ mm2/s as prognostic factors of impending hemorrhage (Adami et al., 2002). These examples illustrate the potential of multiparametric MRI to provide both diagnostic and prognostic information before and after therapeutic intervention.
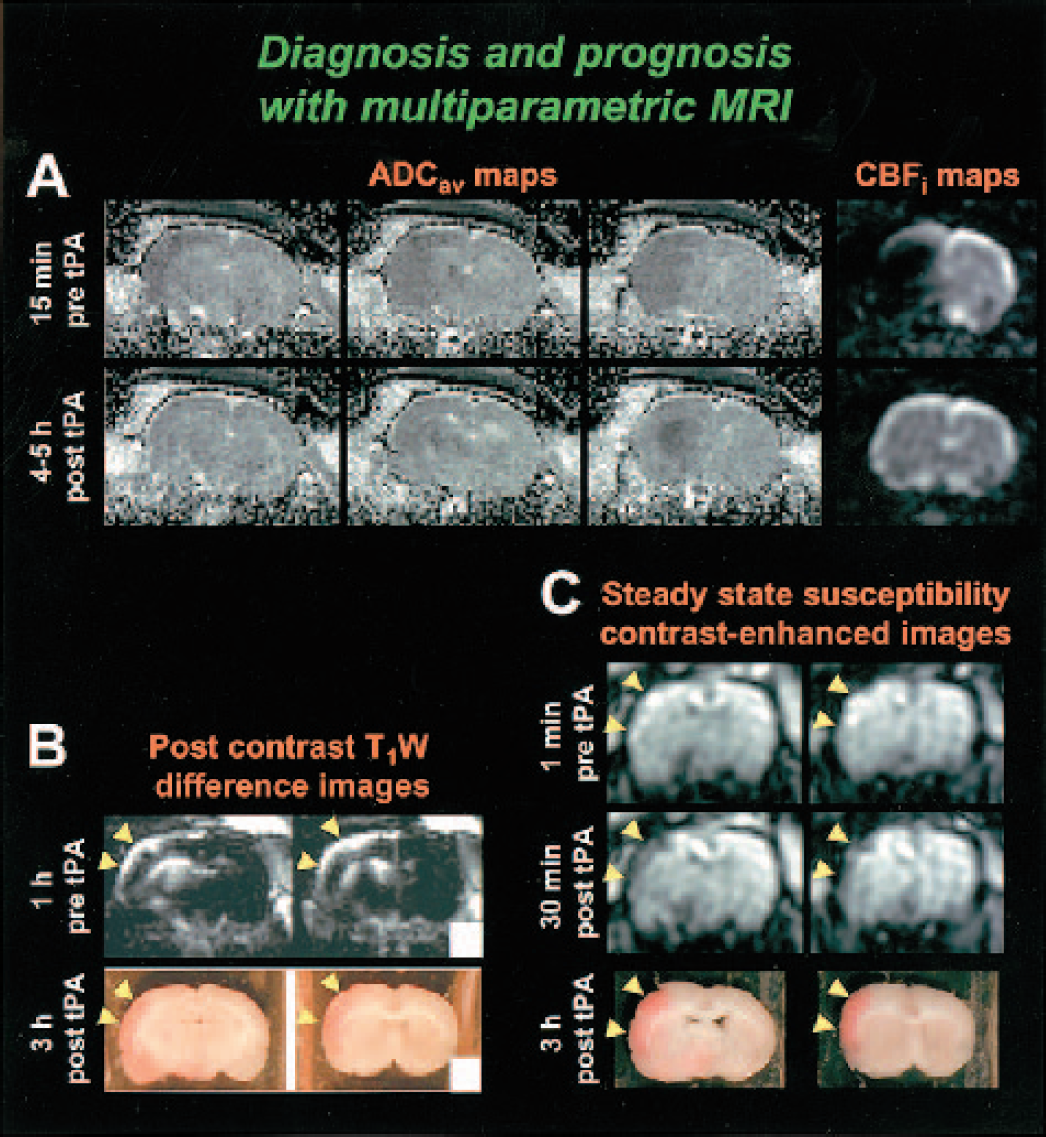
Diagnosis and prognosis with multiparametric MRI. (A) ADCav and CBFi maps of coronal rat brain slices at 15 minutes before (top row) and at 4 to 5 hours after treatment with pamiteplase, a genetically modified t-PA (bottom row). The MCA was unilaterally occluded with an embolic clot, resulting in an ischemic lesion that was characterized by perfusion loss and a reduced tissue water ADC in the ipsilateral MCA territory. Treatment with pamiteplase was started 1 hour after stroke and resulted in reperfusion in the pretreatment lesion area and reduction of the ADC lesion (R.M. Dijkhuizen, T. Sumii, M. Sasamata, O. Wu, B.R. Rosen and E.H. Lo, (2003)). (B) Post-Gd_DTPA T1W difference images of coronal brain slices, 1 hour before rt-PA treatment (top row) and corresponding unstained brain sections, 3 hours after rt-PA treatment (bottom row). Treatment with rt-PA was started 6 hours after unilateral embolic occlusion of the MCA. Hemorrhage after delayed rt-PA administration developed in areas with increased post-contrast T1W signal intensity enhancement, that is, areas with a leaky BBB, before rt-PA treatment (yellow arrowheads). Modified from Dijkhuizen et al. (2001a). Reprinted with permission from Lippincott, Williams & Wilkins. (C) Steady state MION-enhanced MR images of coronal rat brain slices at 1 minute before (top row) and 30 minutes after onset of late rt-PA injection (i.e., 6 hours after unilateral embolic MCA occlusion) (middle row) and corresponding unstained brain sections at 3 hours after rt-PA treatment (bottom row). Yellow arrowheads depict areas with a large MR signal intensity drop early after rt-PA administration, indicative of extravasation of MION caused by enhanced breakdown of microvascular barriers, which corresponded with regions with marked hemorrhagic transformation. Modified from Dijkhuizen et al. (2002). Reprinted with permission from Lippincott, Williams & Wilkins.
Tissue signature modeling
Recently, statistical algorithms have been developed that combine multiple MRI-derived parameters for the diagnosis and prognosis of lesioned tissue. This approach categorizes pathologic tissue and allows evaluation of the spatio-temporal evolution and destiny of tissue signatures. Jiang et al. (1997) first described a user-controlled multiparameter MRI cluster analysis model that uses T2 and ADC values to designate the degree of damage after stroke in rats. MRI signatures were assigned to histopathologic stages of unaffected tissue (normal T2, normal ADC), compromised yet recoverable tissue (normal T2, low ADC), transition to necrosis (long T2, low/normal ADC) and necrosis (long/normal T2, high ADC). Similarly, MRI in combination with a cluster algorithm has been applied to characterize tissue after experimental traumatic brain injury (Stroop et al., 1998) and in a brain tumor model (Vinitski et al., 1998). Recently, Jacobs et al. (2000) developed an unsupervised computer segmentation algorithm that is based upon the angular segmentation of abnormal from normal tissue. With this technique, T1W, T2W, and DW MRI data were successfully used to objectively stage ischemic tissue damage (Jacobs et al., 2001) (Fig. 3). Alternative unsupervised classification methods that make use of diffusion and perfusion parameters to characterize the progression of ischemic damage in experimental models have also been described (Carano et al., 2000).
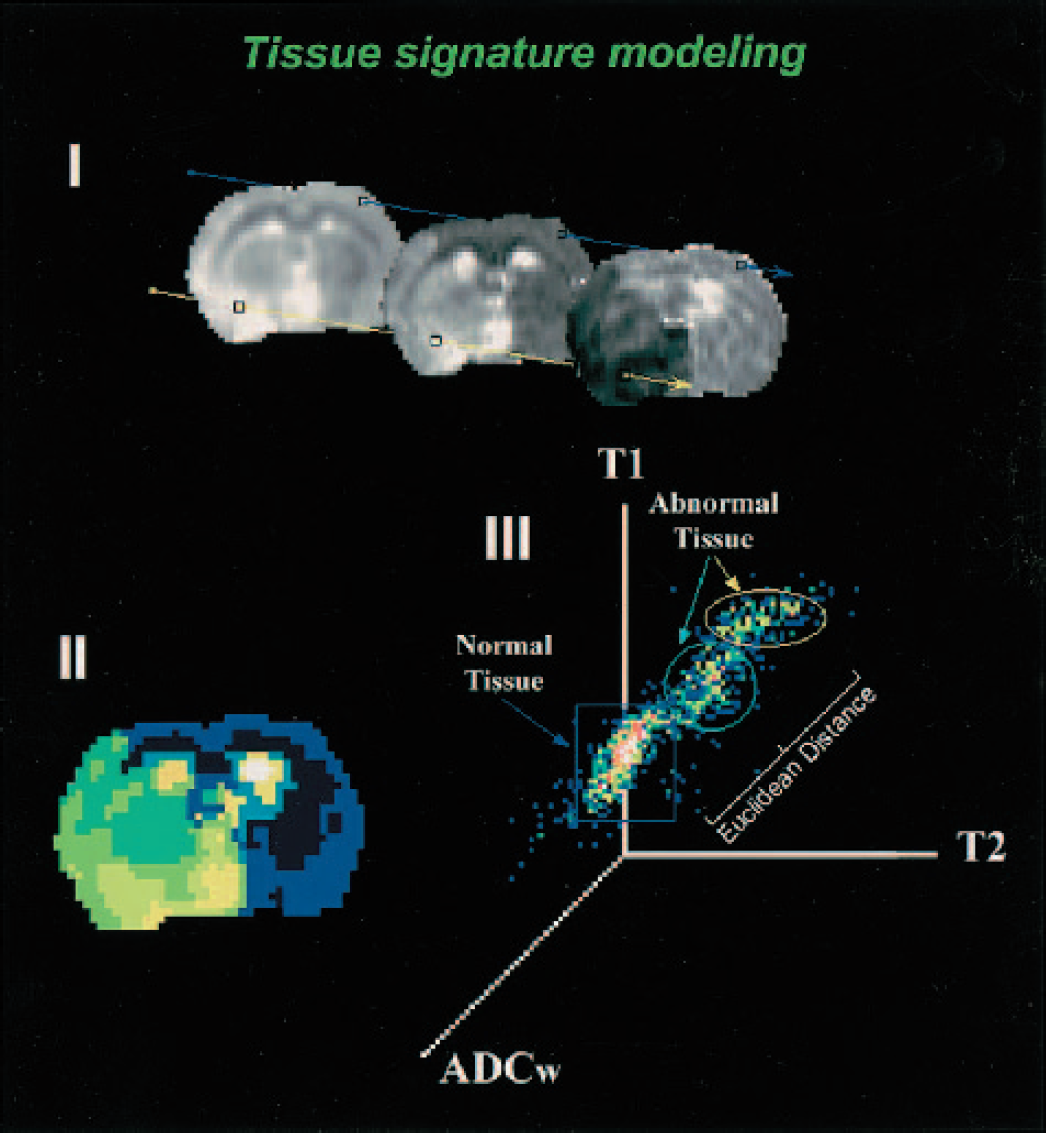
Tissue signature modeling. (I) Tissue signature vectors for different tissue types on T1, T2, and ADCav maps (left to right) from a rat with embolic focal stroke. Signature vectors are defined for each separate tissue class and assigned to the cluster that closely resembles its vector elements in the ISODATA (Iterative Self-Organizing Data Analysis Technique) algorithm. (II) Representative ISODATA theme map from the tissue signature vectors defined from the centroid of each tissue cluster is shown. The dark blue color encompassing the contralateral hemisphere and frontal and parietal cortex of the ipsilateral hemisphere represents normal tissue. The various colored regions (light green to yellow) within the ipsilateral hemisphere represent abnormal tissue clusters. Cerebrospinal fluid (white) was segmented as a separate tissue class. (III) A representation of the three-dimensional feature space formed by T1, T2, and ADCav (the three-dimensional feature space is shown for easy visualization). The angle separation model is demonstrated with the distribution of tissue clusters in the three-dimensional feature space. Angles are calculated by the inner product between the normal tissue and abnormal tissue clusters using each cluster's tissue signature vector, as shown by θ1 and θ2. Each axis represents the value distribution for each MR map. Courtesy of Drs. Q. Jiang and M. Chopp.
PROMISING APPLICATIONS OF MAGNETIC RESONANCE IMAGING
The previous sections describe how MRI techniques can be applied to study brain disorders. With the growing interest in molecular and functional aspects of neurologic diseases, the expanding fields of genomics and proteomics, and development of novel cell-based treatment strategies, contemporary MRI methodologies have been tailored for application to these modern research areas. Examples are described below.
Magnetic resonance microscopy
The growing availability of high-field MR systems and improved RF coil design provide the means to perform MRI experiments with increasing signal-to-noise ratio and, consequently, higher resolution. MRI with high spatial resolution (less than 100 μm in at least one dimension) (Benveniste and Blackband, 2002) has been termed MR microscopy (for review, see Johnson et al., 1993). MR microscopy has historically been applied for brain morphometry, both in vivo and in vitro. In vitro MR microscopy eliminates motion artifacts, enables better sample control, and allows longer imaging times, all of which improve signal-to-noise. MR microscopy has been shown to allow visualization of microscopic pathologic features on fixed brain sections from guinea pigs with EAE (Gareau et al., 2002) (Fig. 4A). Perivascular cuffs of infiltrating inflammatory cells, histologic signs of neuroinflammation, were clearly identified on high-resolution MR images. Nevertheless, for functional or longitudinal studies, in vivo analysis is obviously preferred.
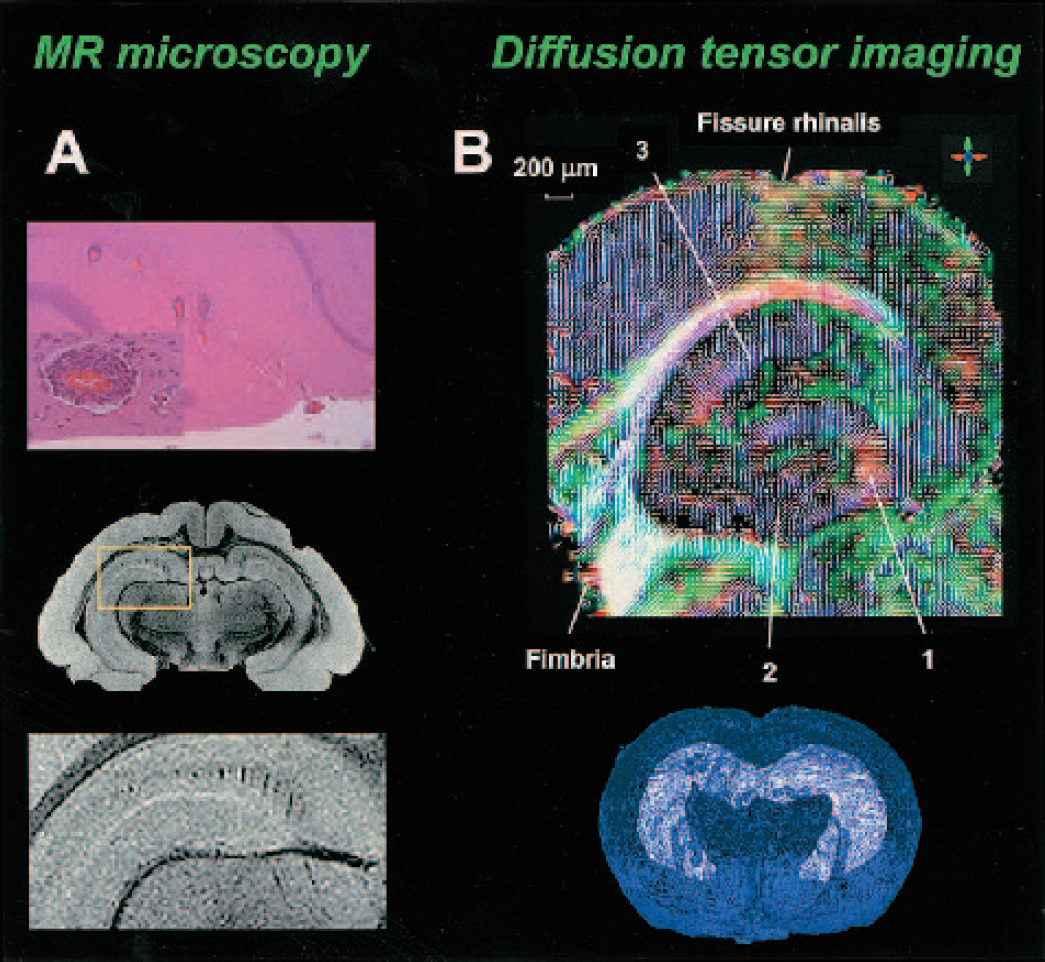
MR microscopy and diffusion tensor imaging. (A) Hematoxylin and eosin staining (top) and corresponding high-resolution T1W MR image (in-plane resolution: 60 × 60 μm) (middle and bottom) of a rat brain section after acute EAE. On the histologic section, a row of individual perivascular cuffs of inflammatory cells are visible within the hippocampus (top). A magnified view of a single perivascular cuff is shown in the inset. A corresponding row of cuffs emerges on the T1W MR image (middle). A magnified view of the boxed region shown in the middle image is presented on the bottom. From Gareau et al., Copyright (2002). Reprinted by permission of Wiley-Liss, Inc., a subsidiary of John Wiley & Sons, Inc. Courtesy of Drs. P.J. Gareau and G.A. Johnson. (B) Horizontal primary eigenvector map (i.e., the eigenvector associated with the largest eigenvalue) overlaid on DTI color map of fractional anisotropy of temporal hippocampal formation (color of each pixel is defined by the orientation of its primary eigenvector (red: anterior-posterior; green: left-right; blue: dorsal-ventral), and the intensity is proportional to the fractional anisotropy (top). In region 1, direction of tensor runs perpendicular with respect to stratum granulosum. In region 2, the direction of tensor runs toward the V shaped stratum granulosum. In region 3, fibers run vertically. The bottom picture shows a three-dimensional reconstruction of hippocampus, stratum granulosum and stratum pyramidale in the ventral-temporal part of hippocampus (white surface) in blue wire-frame representing brain surface. Modified from Zhang et al., Copyright (2002), with permission from Elsevier. Courtesy of Dr. S. Mori.
In recent years, MR microscopy has become of particular interest for morphologic phenotyping of genetically engineered animal models of diseases. MRI on transgenic animals is a fast growing field of biomedical research. Multiple studies on transgenic animals have used MRI to investigate pathophysiologic mechanisms involved in neurologic diseases (Benveniste and Blackband, 2002; Kooy et al., 2001). For example, a brain volumetry study using three-dimensional MRI at a spatial resolution of 1.6 × 10⁻³ mm3 exhibited postischemic ventricular enlargement and hippocampal shrinkage in ApoE-deficient mouse brain (McDaniel et al., 2001). Because of the small size of rodent (in particular mouse) brain and the importance of anatomical detail, MRI of transgenic rodents requires high-resolution approaches. Therefore, MR microscopy is believed to play an increasingly important role in studies on transgenic animal models of neurologic disorders.
Magnetic resonance imaging of tissue architecture
Information on diffusion anisotropy in brain tissue can be used for modeling neuronal tracts. With the use of three-dimensional DTI in combination with a fiber reconstruction algorithm, Xue et al. (1999) mapped major axonal projections in in vivo rat brain. Similarly, with high-resolution three-dimensional DTI (pixel dimensions as low as 40 × 40 × 40 μm), fiber architecture in fixed mouse brain has been reconstructed (Zhang et al., 2002) (Fig. 4B). Despite certain limitations, such as relatively poor spatial resolution as compared with axon dimensions and reconstruction difficulties at fiber branching or merging sites, DTI provides a unique means to study integrity of fiber bundles in particular neurologic disorders. To illustrate, DTI in shiverer mice with incomplete myelin formation showed that water diffusivity perpendicular to axonal fiber tract was significantly higher than in control mice, whereas diffusion along axonal tracts was unaffected (Song et al., 2002).
Functional magnetic resonance imaging
During the last decade, mapping of cerebral activity has become a major field in MRI research. Standard fMRI techniques measure hemodynamic responses to neural activity in the functioning brain during cognitive, perceptual, sensory, or motor processes or during a pharmacologic challenge (i.e., pharmacologic MRI (phMRI) (see later sections)). An activation-induced increase in perfusion can be measured with CBF- or CBV-weighted MRI techniques. However, because of its ease of data acquisition, BOLD MRI is the most frequently applied fMRI method, particularly in human studies. Yet, BOLD fMRI is hampered by relatively small activation-induced signal changes, sensitivity to macrovascular inflow effects, and dependence upon multiple hemodynamic and metabolic factors (i.e., hematocrit, CBF, CBV, and oxygen metabolism) (Mandeville and Rosen, 2002). These problems may be overcome by using CBF- or CBV-based techniques (Mandeville and Rosen, 2002).
Functional MRI studies in animal models have applied BOLD fMRI (Hyder et al., 1994), perfusion MRI using ASL (Kerskens et al., 1996), and steady state susceptibility contrast-enhanced MRI (Mandeville et al., 1998). In addition, Lin and Koretsky (1997) have shown that intracellular accumulation of intravenously administered paramagnetic Mn2+ may enable direct detection of brain activation on T1W MR images. The method qualitatively monitors the neuronal depolarization-induced Ca2+ influx during brain activation. Mn2+ is a Ca2+ analogue that can enter cells through Ca2+ channels during neuronal activation, and that is relatively slowly cleared, thereby allowing detection of activated sites on a prolonged time scale. Unfortunately, this promising methodology is hampered by the requirement of transient leakage of the BBB to make Mn2+ accessible to the active sites for efficient detection, as well as neurotoxic properties of Mn2+.
Besides providing more insights into brain function and the physiologic basis of fMRI signals, animal fMRI studies allow the assessment of spatial and temporal dynamics of brain reorganization in relation to cerebral pathophysiology and functional recovery. With the use of BOLD and perfusion fMRI, Schmitz et al. (1998) demonstrated loss of hemodynamic responses in the somatosensory cortex evoked by electrical forelimb stimulation in rats recovering from cardiac arrest. Brain activity slowly recovered but was still significantly suppressed up to 1 day after 10 minutes of cardiac arrest, despite normal CO2 responsiveness and recovery of the tissue water ADC. Changes in limb stimulation-induced brain activation patterns have also been reported after unilateral MCA occlusion (Reese et al., 2000), unilateral CCA occlusion plus 30 minutes hypoxia (Tuor et al., 2001), and photothrombotic lesioning of the sensorimotor cortex in rats (Abo et al., 2001). Loss of brain activation responses in the forelimb region of the sensorimotor cortex after focal cerebral ischemia in rats occurred despite relatively mild tissue and perfusion impairment and normal cerebrovascular reactivity (Dijkhuizen et al., 2001b; Reese et al., 2000). Steady state contrast-enhanced CBV-weighted fMRI studies by Dijkhuizen et al. (2001b) and Abo et al. (2001) have described extensive contralesional activity and perilesional activation foci after cerebral ischemia, thereby providing evidence for post-stroke brain reorganization (Fig. 5A). Correlation analyses demonstrated that the degree of shift of activation balance towards the contralesional hemisphere early after experimental unilateral stroke increases with the extent of tissue injury and that functional recovery is mainly associated with preservation, restoration, or shift of activation in the ipsilesional hemisphere (Dijkhuizen et al., 2003).
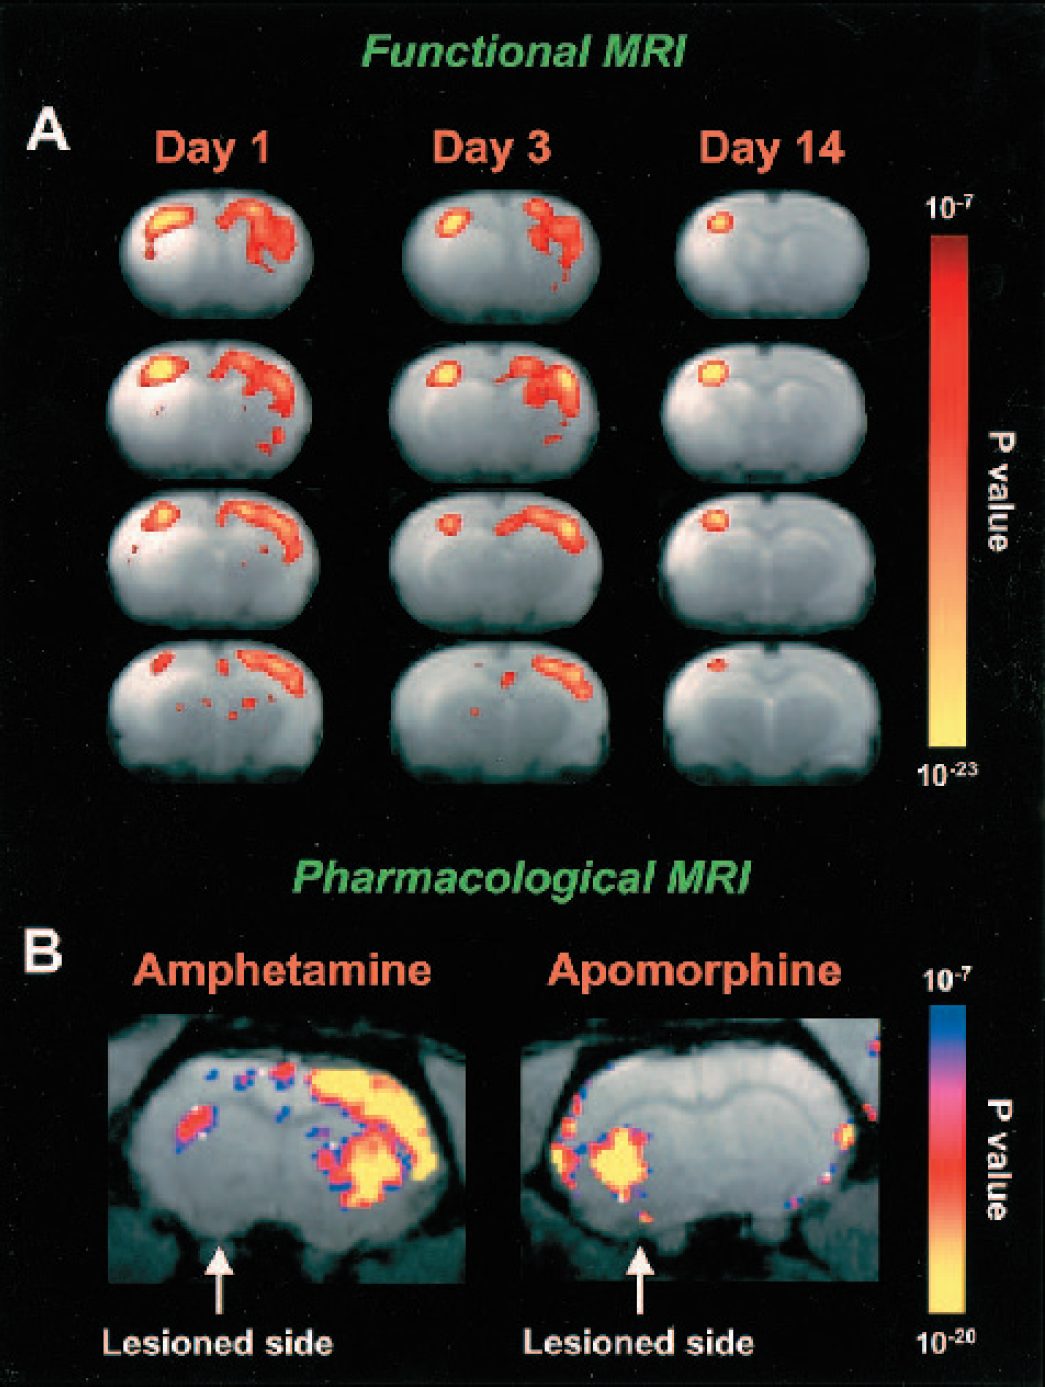
Functional MRI and pharmacologic MRI. (A) T2W MR images of coronal rat brain slices overlaid by functional activation maps at 1, 3, and 14 days after transient stroke in the right hemisphere. Statistical activation maps were calculated from cerebral hemodynamic changes as detected with steady state susceptibility contrast-enhanced fMRI during stimulation of the hemiplegic (left) forelimb (data were averaged across seven animals for each time-point). Left, affected limb stimulation resulted in diminished responsiveness in the right, ipsilesional sensorimotor cortex at day 1 and 3 after stroke. Widespread activation was detected in the unaffected hemisphere, i.e. ipsilateral to the stimulated limb. After 14 days, activation responses were predominantly in the ipsilesional sensorimotor cortex. Infarction areas are characterized by increased T2W signal intensity. Data from Dijkhuizen et al. (2003). (B) Maps of statistically significant changes in CBV overlaid on a T2W image of rat brain unilaterally lesioned with 6-OHDA after ip injection of 4 mg/kg amphetamine or 2 mg/kg apomorphine. Modified from Nguyen et al., Copyright (2000). Reprinted by permission of Wiley-Liss, Inc., a subsidiary of John Wiley & Sons, Inc. Courtesy of Drs. Y.I. Chen and B.G. Jenkins.
Altered brain activation patterns have also been demonstrated in a rodent model of Parkinson's disease. BOLD fMRI during forelimb stimulation after unilateral intranigral injection of the dopaminergic neurotoxin 6-hydroxydopamine (6-OHDA) in rats showed bilateral overactivation in the sensorimotor cortex, which points toward involvement of interhemispheric interaction in the pathophysiology of Parkinson's disease (Pelled et al., 2002). Furthermore, fMRI can be used to assess epileptic activity. In a sheep model of penicillin-induced partial epilepsy, BOLD fMRI was performed in combination with electroencephalography (Opdam et al., 2002). BOLD signal changes were detected at the seizure focus and ipsilateral amygdala, which illustrates the potential of fMRI to analyze the origin and propagation of seizures.
Pharmacologic MRI has also been applied in models of stroke and Alzheimer's disease. Systemic administration of bicuculline, a GABAA antagonist, gives rise to a strong steady-state, contrast-enhanced phMRI response in normal brain (up to 50% rise in CBV), which is diminished after unilateral MCA occlusion in rats (Reese et al., 2002) or in amyloid precursor protein transgenic mice (Mueggler et al., 2002). These findings underscore the potential of phMRI to detect compromised regions in pathologic brain. Diminished phMRI responses are suggestive of reduced neuronal excitability but may also be attributed to impaired hemodynamic reactivity.
Cell-specific magnetic resonance imaging
The prospect to trace specific cells and follow their biodistribution in vivo allows monitoring of transplanted cells for therapeutic purposes. Labeling of cells with MR contrast agent provides a tool to detect and track cells with MRI (Bulte et al., 2002; Norman et al., 1992). Several methods for cellular incorporation of MR contrast agent exist, as has been reviewed by Bulte et al. (2002). One approach makes use of phagocytosis of intravascularly administered SPIOs. In tumor-bearing rats, intravenous injection of MION resulted in MR signal intensity changes in gliomas that peaked at 12 hours and remained up to 5 days, indicative of accumulation of MION in glioma cells through phagocytosis (Zimmer et al., 1995). Cell-specific MRI can also inform on macrophage activity in brain disorders that involve inflammation. In rats with clinical EAE, low signal abnormalities in the brain were detected on T2W images at 24 hours after intravenous injection of SPIOs (Dousset et al., 1999). Uptake of SPIOs by macrophages that accumulate in inflammatory sites was confirmed by light and electron microscopy.
In recent years, stem cell therapy has proven to be a promising means to improve neurologic function in various brain pathologies and has excellent perspectives to be clinically effective on a large scale. With cell-specific MRI, the distribution and survival of magnetically labeled stem cells can be monitored. Stem cells labeled with a gadolinium complex have been successfully detected in ischemia-damaged hippocampus in ex vivo rat brain up to 7 days after transplantation (Modo et al., 2002). Hoehn et al. (2002) performed longitudinal, in vivo MRI-based stem cell tracking after experimental stroke. Embryonic stem cells labeled with USPIOs were implanted in the contralateral hemisphere at 2 weeks after unilateral transient MCA occlusion in rats (Fig. 6). During 3 weeks after transplantation, high-resolution T2*W MRI demonstrated migration of grafted cells along the corpus callosum to the subventricular zone and massive accumulation in the peri-infarct region. This pronounced dynamical migration, which was not found in control animals, suggests strong directional cell mobility that may be involved in tissue repair after injury. Clearly, this study illustrates the potential of MRI to map the distribution, migration, and destination of transplanted cells for therapeutic purposes.
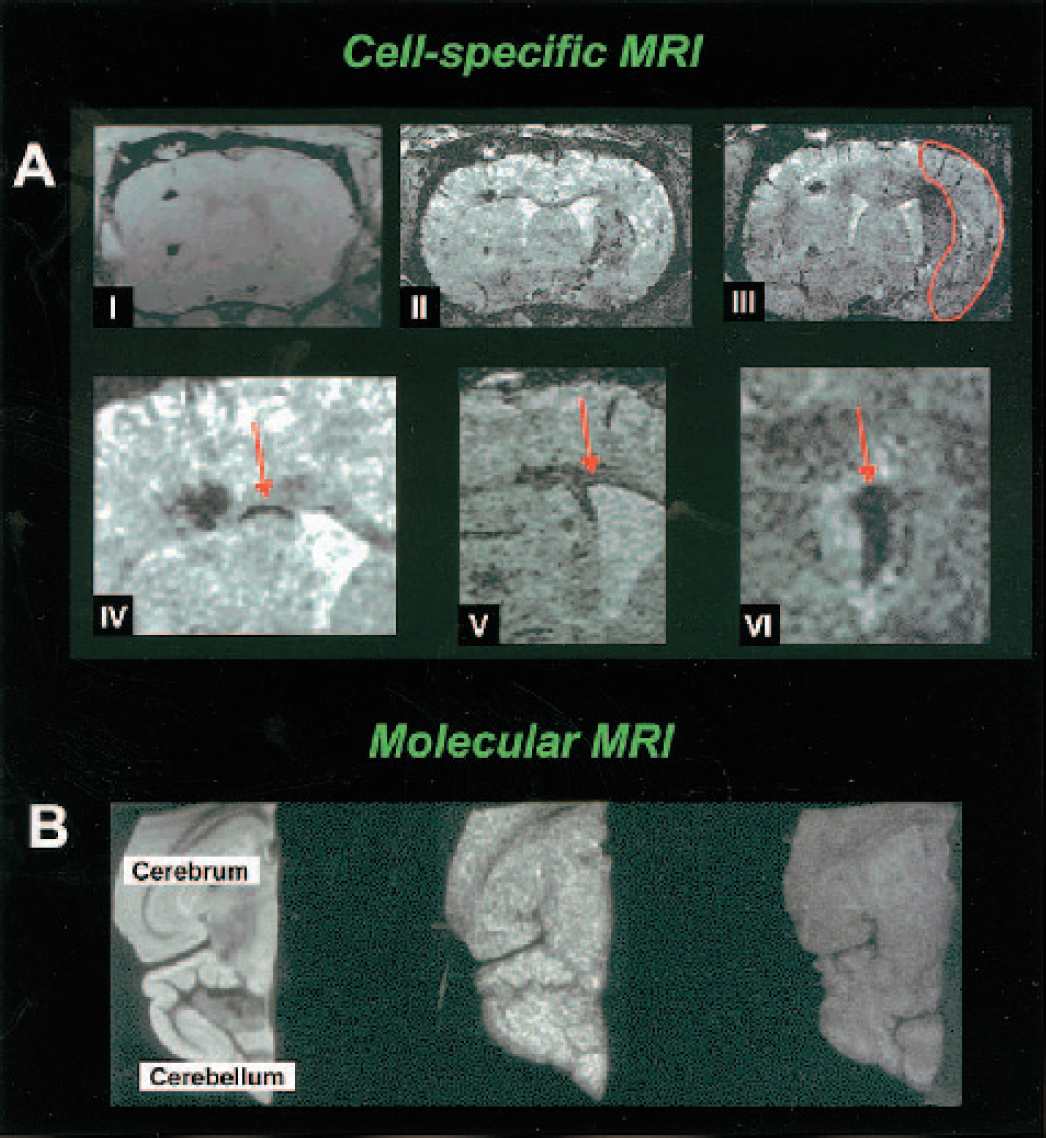
Cell-specific MRI and molecular MRI. (A) MRI of a coronal section through rat brain at various times after implantation of USPIO-labeled embryonic stem cells into the hemisphere contralateral to the induced transient 60-min focal ischemia. Three-dimensional data sets were recorded at the day of implantation (I) and at 6 (II) and 8 (III) days after implantation. For orientation, the necrotic tissue area is outlined on III. Note at 6 days (II) the discrete dark line (arrow in IV, with higher magnification) along the corpus callosum between the cortical implantation site and the ventricular wall showing cells migrating toward the lesioned hemisphere. At 8 days (III), a dark region becomes visible in the dorsal part of the lesioned territory reflecting the arrival of USPIO-labeled cells. At higher magnification (IV), the migration along the corpus callosum is clearly visible. Taken from another animal, the lining along the ventricular wall (V) and the accumulation of labeled stem cells on the choroid plexus (VI) are also presented with high magnification. From Hoehn et al., Copyright (2002). National Academy of Sciences, U.S.A. Courtesy of Dr. M. Hoehn. (B) Horizontal T2W MR image of ex vivo mouse cerebrum and cerebellum after EAE (left). T1W MR image of ex vivo mouse brain with (middle) and without EAE (right) after injection of anti-ICAM-1 antibody-conjugated gadolinium-containing liposomes. Widespread MR signal intensity enhancement throughout the brain with EAE (middle image) correlated with the pattern of ICAM-1 expression as determined immunohistochemically. Modified from Sipkins et al., Copyright (2000). Reprinted with permission from Elsevier. Courtesy of Dr. L. Steinman.
Molecular imaging
Molecular imaging involves the detection of biologic processes at the cellular and molecular level (see reviews by Blasberg, 2002; Weissleder and Mahmood, 2001). Molecular MRI makes use of dedicated MRI reporter probes that consist of a specific targeting element (e.g., monoclonal antibodies) and a MR detectable label (e.g., paramagnetic atoms). Technology in this field is rapidly advancing and has resulted for example in development of “smart imaging probes” that are activated and detected only when interacting with the target (Blasberg, 2002; Weissleder and Mahmood, 2001). Expression of specific marker genes can be detected as they encode for cell-surface receptors that bind or internalize the imaging probes (i.e., direct molecular imaging). Alternatively, the reporter gene product induces or amplifies detectability of the imaging tracer (i.e., indirect molecular imaging), such as by unshielding of the MR contrast agent through enzymatic processing of the reporter probe. Examples of direct molecular MRI in models of brain disorders are starting to emanate. Tumor-specific imaging can be achieved with tumor-targeted monoclonal antibodies conjugated to MION, which has been shown to result in contrast enhancement of rat gliomas with the strongest effect in areas with highest tumor cell density (Remsen et al., 1996). Endothelial antigens that are expressed under pathophysiologic conditions, such as leukocyte adhesion molecules, also provide significant targets for molecular MRI. Antibody-conjugated gadolinium-containing liposomes targeted to intracellular adhesion molecule-1 (ICAM-1) have been used to highlight areas with strong ICAM-1 expression with ex vivo high-resolution T1W MRI after in vivo administration in mice with EAE (Sipkins et al., 2000) (Fig. 6B). In a transgenic mouse model for Alzheimer's disease, intravenously injected putrescine-gadolinium-amyloid-β peptide was shown to bind to β-amyloid plaques, resulting in selective plaque enhancement on post mortem T1W MR microscopic images (Poduslo et al., 2002).
Molecular MRI is still in its infancy in terms of in vivo application in brain injury models. Nevertheless, it has a promising future for the characterization of cellular and molecular processes in neurologic disorders and the assessment of gene-based therapy.
CONCLUSIONS
This review has provided an overview of the applicability of MRI to study brain disorders in experimental models. With different MRI techniques, in vivo diagnostic and prognostic information can be obtained on edema formation, hemodynamics, tissue structure, neuronal activation, cell migration, gene expression, and more. The potential to provide multiparametric information noninvasively is the main strength of MRI in biomedical research. Because MRI is available in preclinical and clinical settings, optimal translational research can be achieved. In addition, MRI can be combined with other imaging modalities (e.g., PET or optical imaging) to obtain complementary or supplementary information. Advances in MR technology, such as magnets with higher field strength, more powerful gradient systems, refined RF coil design, and increasing availability of targeted MR contrast agents, allow MRI research with higher sensitivity, faster acquisition, and improved specificity. Hence, we expect that MRI will continue to provide significant information on the pathophysiology and recovery mechanisms involved in brain disorders. In the near future, MRI studies are expected to play an increasing role in characterization of new experimental models of neurologic diseases (e.g., noninvasive phenotyping of genetically modified animals) and novel therapeutic strategies, more detailed delineation of pathophysiologic mechanisms (e.g., in vivo mapping of molecular biologic processes) and longitudinal assessment of spontaneous or treatment-induced recovery mechanisms (e.g., monitoring of stem cell therapy).
Footnotes
Acknowledgment:
The authors apologize to those colleagues whose work could not be cited because of space considerations.