
Abstract
Kinetic rate constants for 2-[18F]fluoro-2-deoxy-
Keywords
H215O and 2-[18F]fluoro-2-deoxy-
Dynamic PET also allows noninvasive investigation of the initial steps of metabolism with tracer kinetics modeling. Several dynamic PET studies in Alzheimer's disease (AD) demonstrated alterations in glucose transport, as well as phosphorylation (Jagust et al., 1991; Piert et al., 1996), compared with a normal control, as observed in human autoptic brains (Iwangoff et al., 1980; Vannucci et al., 1997). However, previous dynamic PET studies were based upon region of interest (ROI) analysis; therefore, localization of the alteration in kinetic parameters might not be fully described, possibly overlooking localized alteration. The quality of parametric images may also be insufficient despite the time consuming process in computing kinetic parameters. In the present study, by averaging parametric images over subjects with anatomic standardization techniques, the power of pixel-by-pixel image analysis was improved, and the group differences were examined on a pixel-by-pixel basis.
The anatomic standardization technique has become fundamental in recent brain investigations using PET. It allows transformation of individual brain images of various sizes and shapes into a standard template matrix that can be analyzed on a pixel-by-pixel basis. NEUROSTAT (3D-SSP), developed by Minoshima et al. (1994a, b , c , 1995) is software for which a macaque version has also been developed (Cross et al., 2000). Thus, in the present study, we determined kinetic rate constants for FDG and the tissue-blood partition coefficient of water in conscious rhesus macaques. Alterations in aging or anesthesia conditions were also examined on a pixel-by-pixel basis employing an anatomic standardization technique.
MATERIALS AND METHODS
Animals
Studies were performed on three groups of male rhesus macaques (Macaca mulatta): seven young adults (age, 6.6 ± 1.8 years; body weight 6.5 ± 1.9 kg) for the young group, seven old adults (age, 20.5 ± 2.9 years; body weight 6.9 ± 1.6 kg) for the aged group, and six young adults (age, 7.6 ± 0.3 years; body weight 8.3 ± 0.7 kg) for the anesthesia group. Animals were maintained and handled in accordance with the recommendations of the United States National Institute of Health. The research protocol was approved by the Central Research Laboratory, Hamamatsu Photonics K.K., Hamakita, Japan. T1-weighted MR-images of animals were obtained on an MRT-50A/II scanner (Toshiba, Tokyo, Japan) with a magnetic field strength of 0.5 T. Each animal was attached by a specially designed head holder (Onoe et al., 1994; Takechi et al., 1994), which was used to fix each animal's head to a chair during PET scans. Then the animals were habituated to the chair restraint several times a week for more than 1 month before the initiation of PET.
PET experiment
PET scans were performed with a high-resolution animal PET scanner (SHR-7700; Hamamatsu Photonics K.K., Hamamatsu, Japan), with transaxial resolution of 2.6 mm full-width at half-maximum (FWHM) in the center of the scan field and a center-to-center distance of 3.6 mm (Watanabe et al., 1997). A blank scan (120 minutes) was performed with a rotating 68Ge-68Ga source before each study. Before scanning, a catheter was inserted into the left femoral artery under transient anesthetization with approximately 2% of sevoflurane (0.1% to 0.8% of isoflurane for the anesthesia group) in a N2O/O2 (70:30) gas mixture. Then, in the anesthesia group, animals were immobilized with 0.05 mg/kg intramuscular pancuronium bromide every 2 hours and artificially ventilated (90 to 110 mL/stroke, 8 to 10 stroke/min). Anesthetization was continued during PET experiments with 0.1% to 0.8% of isoflurane in a N2O/O2 (70:30) gas mixture maintaining 90 to 110 mmHg of MABP and 30 to 35 mmHg of end-tidal CO2 with an anesthesia workstation (Cato, Dräger Medizintechnik GmbH, Lübeck, Germany). MABP was monitored by a life-monitoring system (Nihon Kohden, Tokyo, Japan). Each animal's head was fixed to a monkey chair for PET scans with a head holder and stereotaxically aligned parallel to the orbito-meatal (OM) plane with a laser marker. Then, a transmission scan (30 minutes) was performed with a rotating 68Ge−68Ga source. PET emission scans were performed with the animal's ears unplugged and eyes uncovered and the room lights dimmed.
A 2 minute dynamic PET scan (20 seconds × 3; 30 seconds × 2) was performed after intravenous injection of approximately 740 MBq of H215O. Arterial blood samples were withdrawn over 4 seconds intervals for the first 88 seconds, then at 2 minutes, from a catheter placed in the femoral artery to measure arterial blood radioactivity using an auto well gamma counter (ARC-2000, Aloka, Tokyo, Japan). Approximately 15 minutes after the H215O PET scan, approximately 370 MBq of [18F]FDG was injected intravenously. A 60-minute dynamic PET scan (1 minute × 6; 2 minutes × 2; 5 minutes × 10) was performed after injection of FDG. Both tracers were injected, taking 20 seconds to help in acquiring precise input function and reducing error in fitting. Arterial blood samples were withdrawn over 10-second intervals for the first 1 minute, followed by increasingly longer intervals to 60 minutes, for arterial plasma radioactivity measurements. The blood samples obtained at 45 and 60 minutes after injection were also analyzed for blood glucose levels using COBAS READY (Nihon Roche, Tokyo, Japan).
Data analysis
Dynamic PET images were reconstructed with 4.5 mm FWHM of a Hanning convolution filter. All images and arterial radioactivity for input function were decay-corrected. Anatomic standardization was performed upon the images using NEUROSTAT (3D-SSP) developed by Minoshima et al. (Cross et al., 2000; Minoshima et al., 1994a, 1995). Then, the anatomically standardized images were smoothed by 6 mm (for H215O) and 3.6 mm (for FDG) FWHM with a three-dimensional gaussian filter. Kinetic parameters were estimated from those images and arterial radioactivity by a nonlinear least-square fitting procedure using the Marquardt algorithm (Bevington and Robinson, 1992; Marquardt, 1963). One- (for H215O) and two- (for FDG) tissue compartment models (Fig. 1) were used for the analysis. Each model configuration was implemented to account for the effects of the cerebral blood volume (CBV) component in the measured PET data (CPET) and for the time shift (Δt) between the input function (Ca) measured from the femoral artery and measured PET data as
Kinetic Models for H215O and [18F]FDG. In addition to the parameters shown, terms for the cerebral blood volume (CBV) and time delay of the input function (Δt) were included. The tissue-blood partition coefficient of water (p) was calculated as p = K1,H2O/k2,H2O. Parameters were estimated in each pixel except for k4,FDG, which was fixed as estimated from the whole brain. BBB, blood-brain barrier; C1, C2, tissue components; FDG-6-P, FDG-6-phosphate.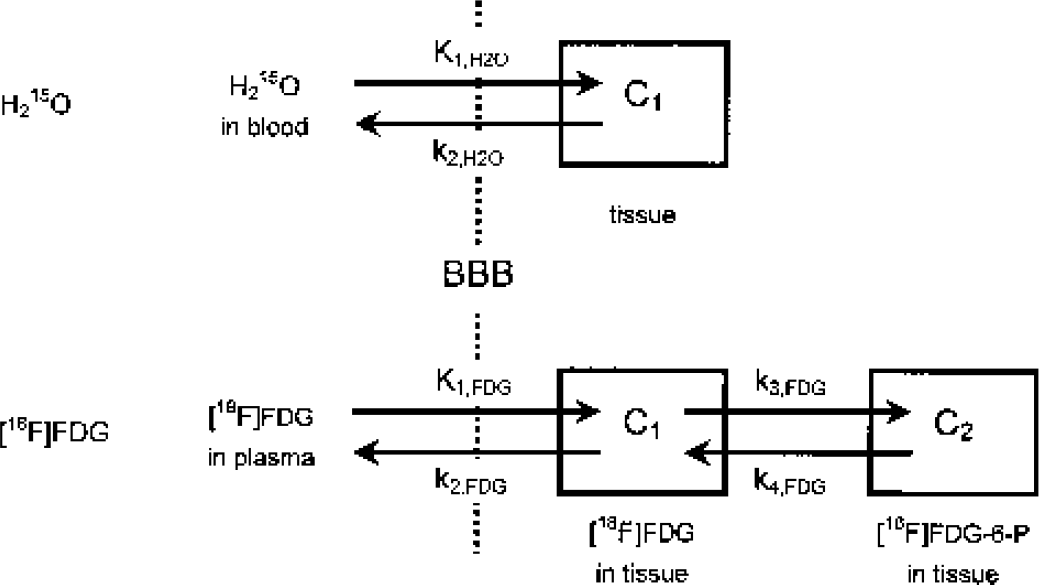

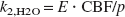
Here, Ci (i ≥1) are tissue components, as described in Fig. 1. Each component was formulated as a function of time. The Δt was estimated for each tracer by fitting the whole brain PET data to the corresponding model for each tracer using the entire data set and assuming a whole brain CBV of 3%. The values for Δt and k4,FDG estimated from the whole brain were fixed for all subsequent fittings to help reduce noise in the estimated parametric images, and k4,FDG was reported to have no difference between gray and white matter in human (Reivich et al., 1985). CBV for each pixel was estimated using all (for H215O) or the first 5 minutes (for FDG) of the PET data. The estimated CBV for each pixel was used for all subsequent fittings. With these values fixed, K1,FDG, k2,FDG, k3,FDG, K1,H2O, and k2,H2O were estimated for each pixel. The tissue-blood partition coefficient of water (p) was calculated as p = K1,H2O/k2,H2O as the lead from Equations 2 and 3, which were based upon Kety's model (Kety, 1960). Here, K1,H2O equals CBF assuming the extraction fraction (E) is 1.

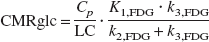
CMRglc images were calculated from images of kinetic rate constants according to Equation 4 assuming the lumped constant (LC) was 0.344 (Kennedy et al., 1978). Here, Cp was the plasma glucose level measured from arterial blood samples.
An anatomically standardized MRI image was generated using NEUROSTAT from one macaque because anatomically standardized MRI images from all individual macaques were essentially identical. Regions of interest (ROIs) were drawn on the anatomically standardized MRI image, and the ROIs were applied for anatomically standardized PET images. ROIs were taken for the cerebellum, white matter, cingulate, frontal cortex, parietal cortex, temporal cortex, and occipital cortex. All data were represented as means and SD. Repeated measures (RM-) analysis of variance (ANOVA) was used to assess differences among groups in each parameter. Dunnett's post hoc test was used to reveal regions that had significant differences compared with the young group. Mean images from the young group were generated for each parameter. To assess regional changes that were not included in ROI analysis, Z images (two-sample t-tests converted to Z using a probability integral transformation), for difference compared with the young group, were also generated for the aged and anesthesia groups using anatomically standardized parametric image sets. Plasma glucose levels were also analyzed using ANOVA with a post hoc Dunnett's test.
RESULTS
The results are shown in Table 1 (from ROI analysis) and Fig. 2 (from pixel-by-pixel analysis). In the aged group, glucose transport (K1,FDG) and glucose phosphorylation (k3,FDG) were both reduced, and k3,FDG was more decreased. Although CMRglc was reduced in all regions, the occipital cortex was the most affected region, which also showed an associated reduction in CBV, K1,FDG, k3,FDG, and CBF. Pixel-by-pixel analysis (Fig. 2) also indicated reduction in K1,FDG, CMRglc and CBF showed a similar pattern, that is, decreased in the occipital, temporal, and parietal cortex. However, k3,FDG, appeared to decrease in all cortical regions. The partition coefficient of water (p) was intact in the aged group.
Estimated parameters for H215O and [18F]FDG
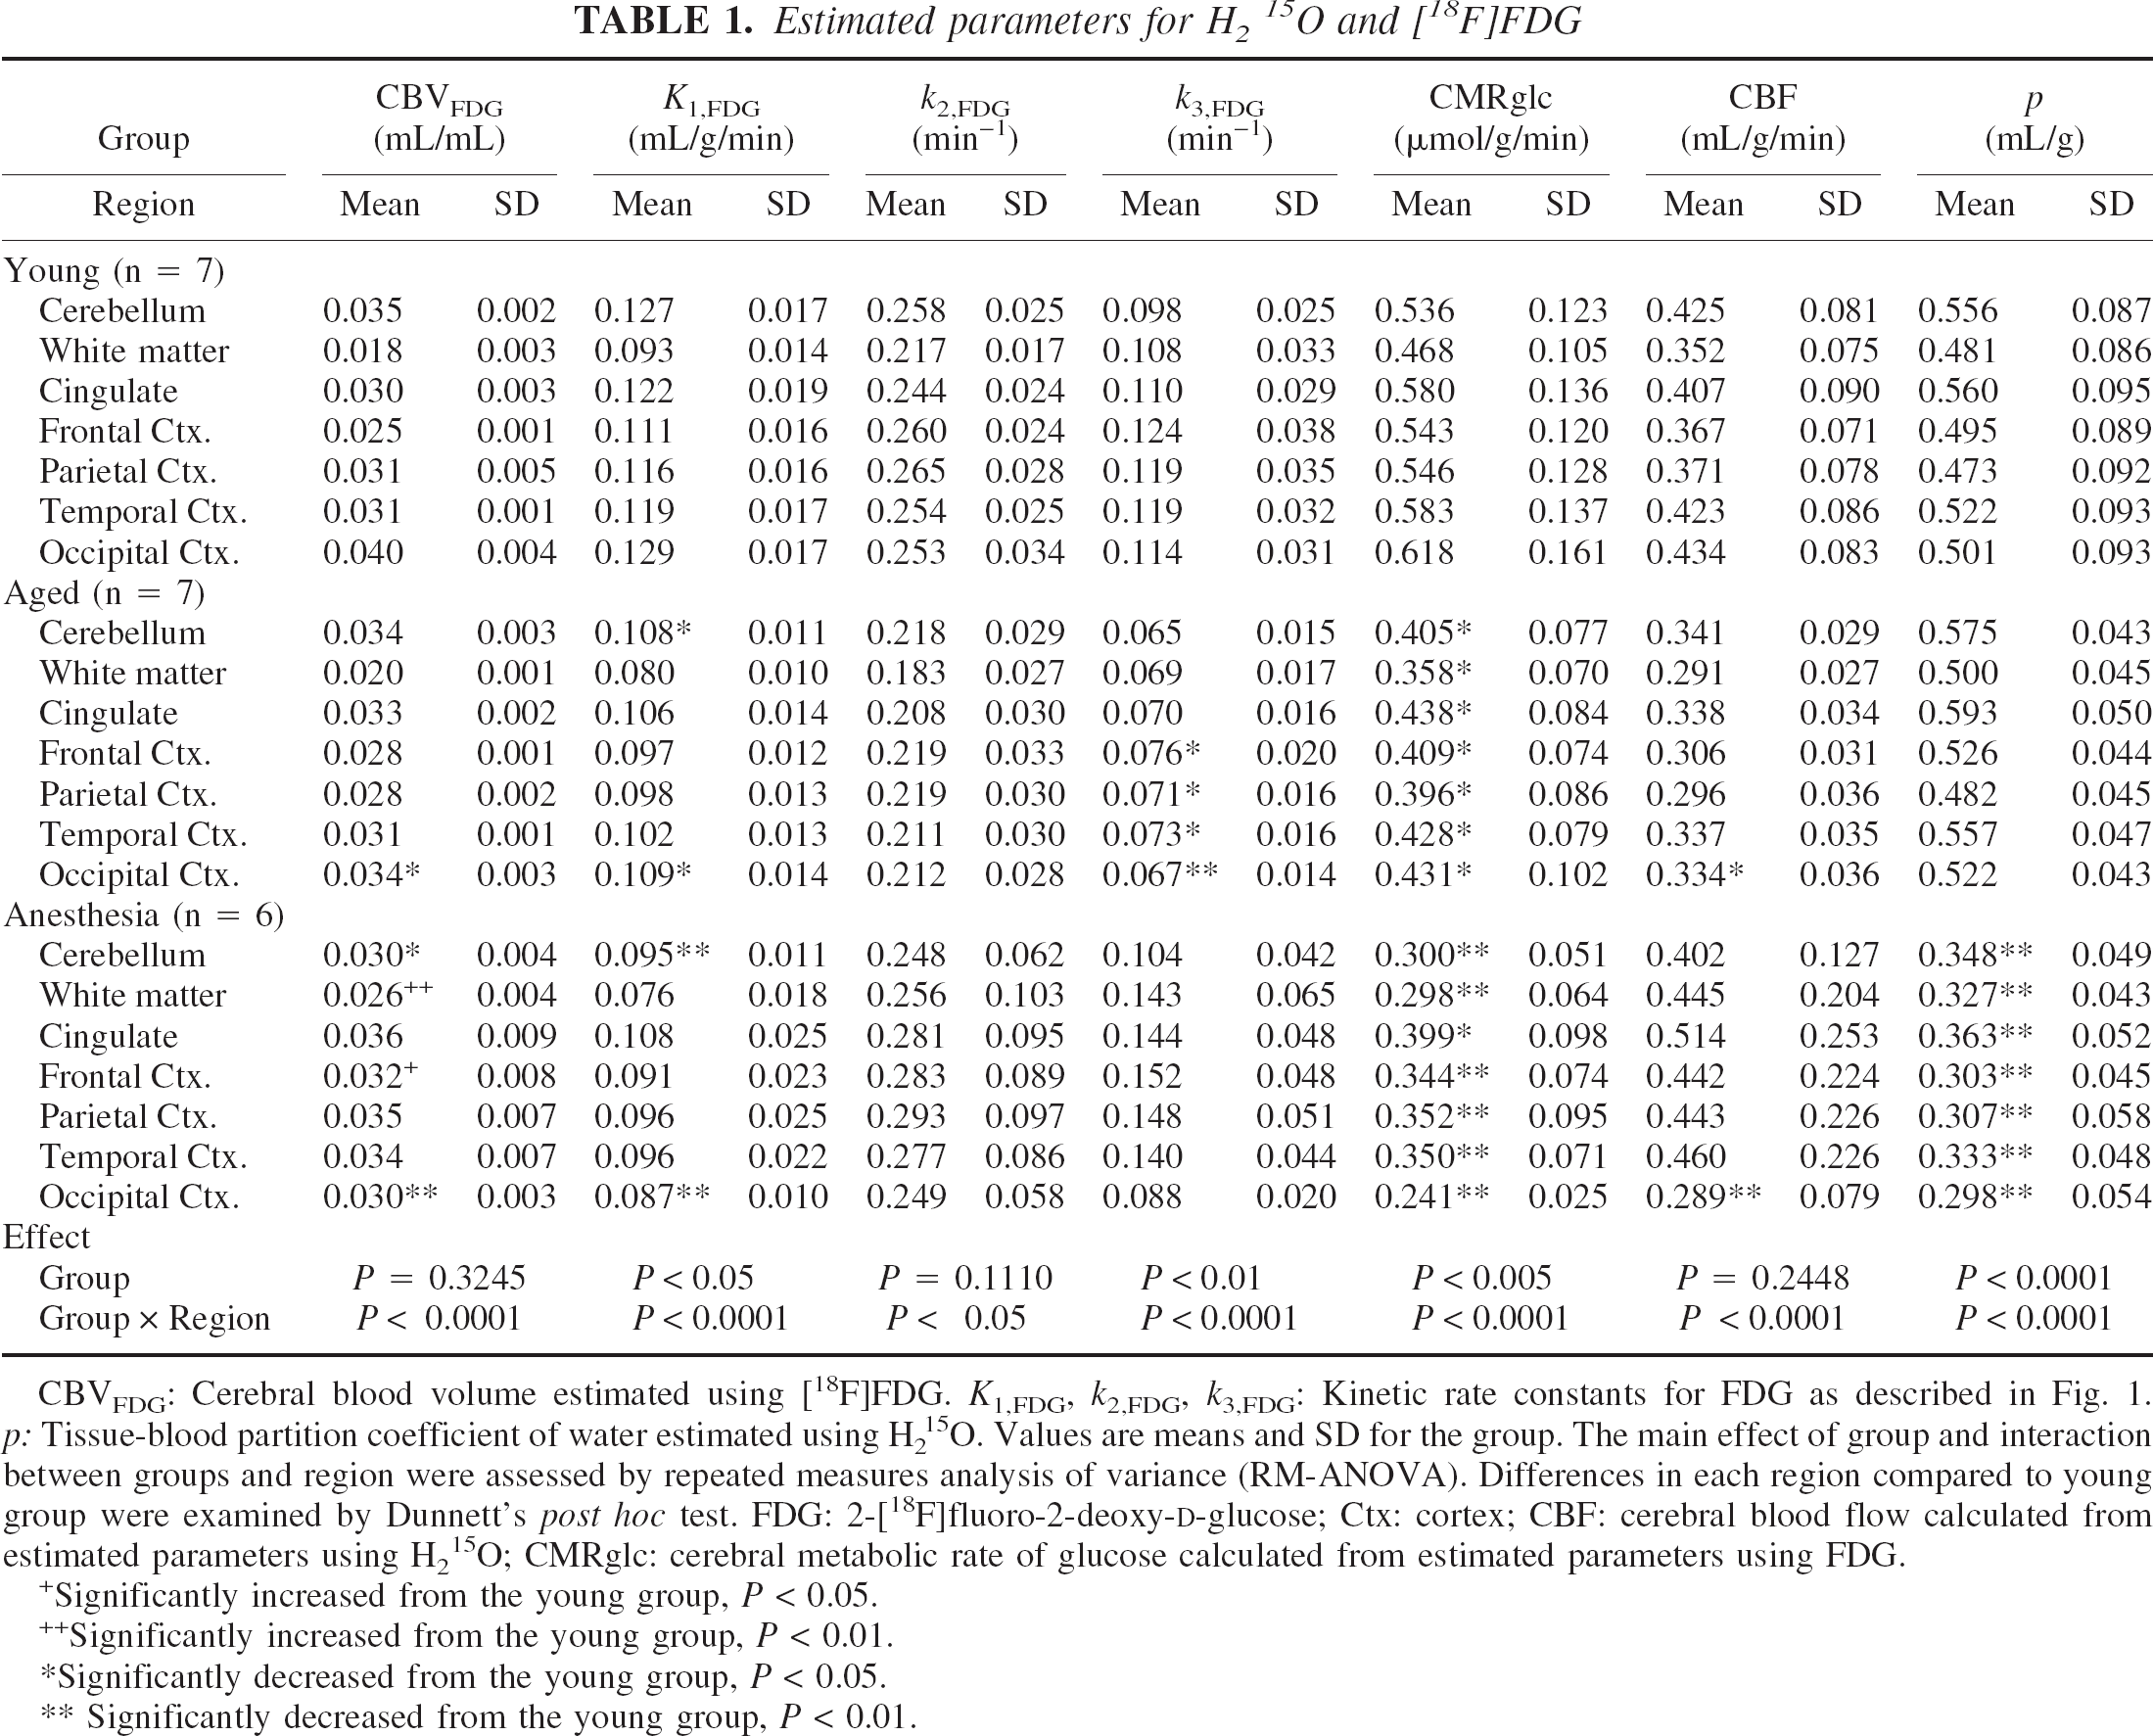
CBVFDG: Cerebral blood volume estimated using [18F]FDG. K1,FDG, k2,FDG, k3,FDG: Kinetic rate constants for FDG as described in Fig. 1. p: Tissue-blood partition coefficient of water estimated using H215O. Values are means and SD for the group. The main effect of group and interaction between groups and region were assessed by repeated measures analysis of variance (RM-ANOVA). Differences in each region compared to young group were examined by Dunnett's post hoc test. FDG: 2-[18F]fluoro-2-deoxy-
Significantly increased from the young group, P < 0.05.
Significantly increased from the young group, P < 0.01.
Significantly decreased from the young group, P < 0.05.
Significantly decreased from the young group, P < 0.01.
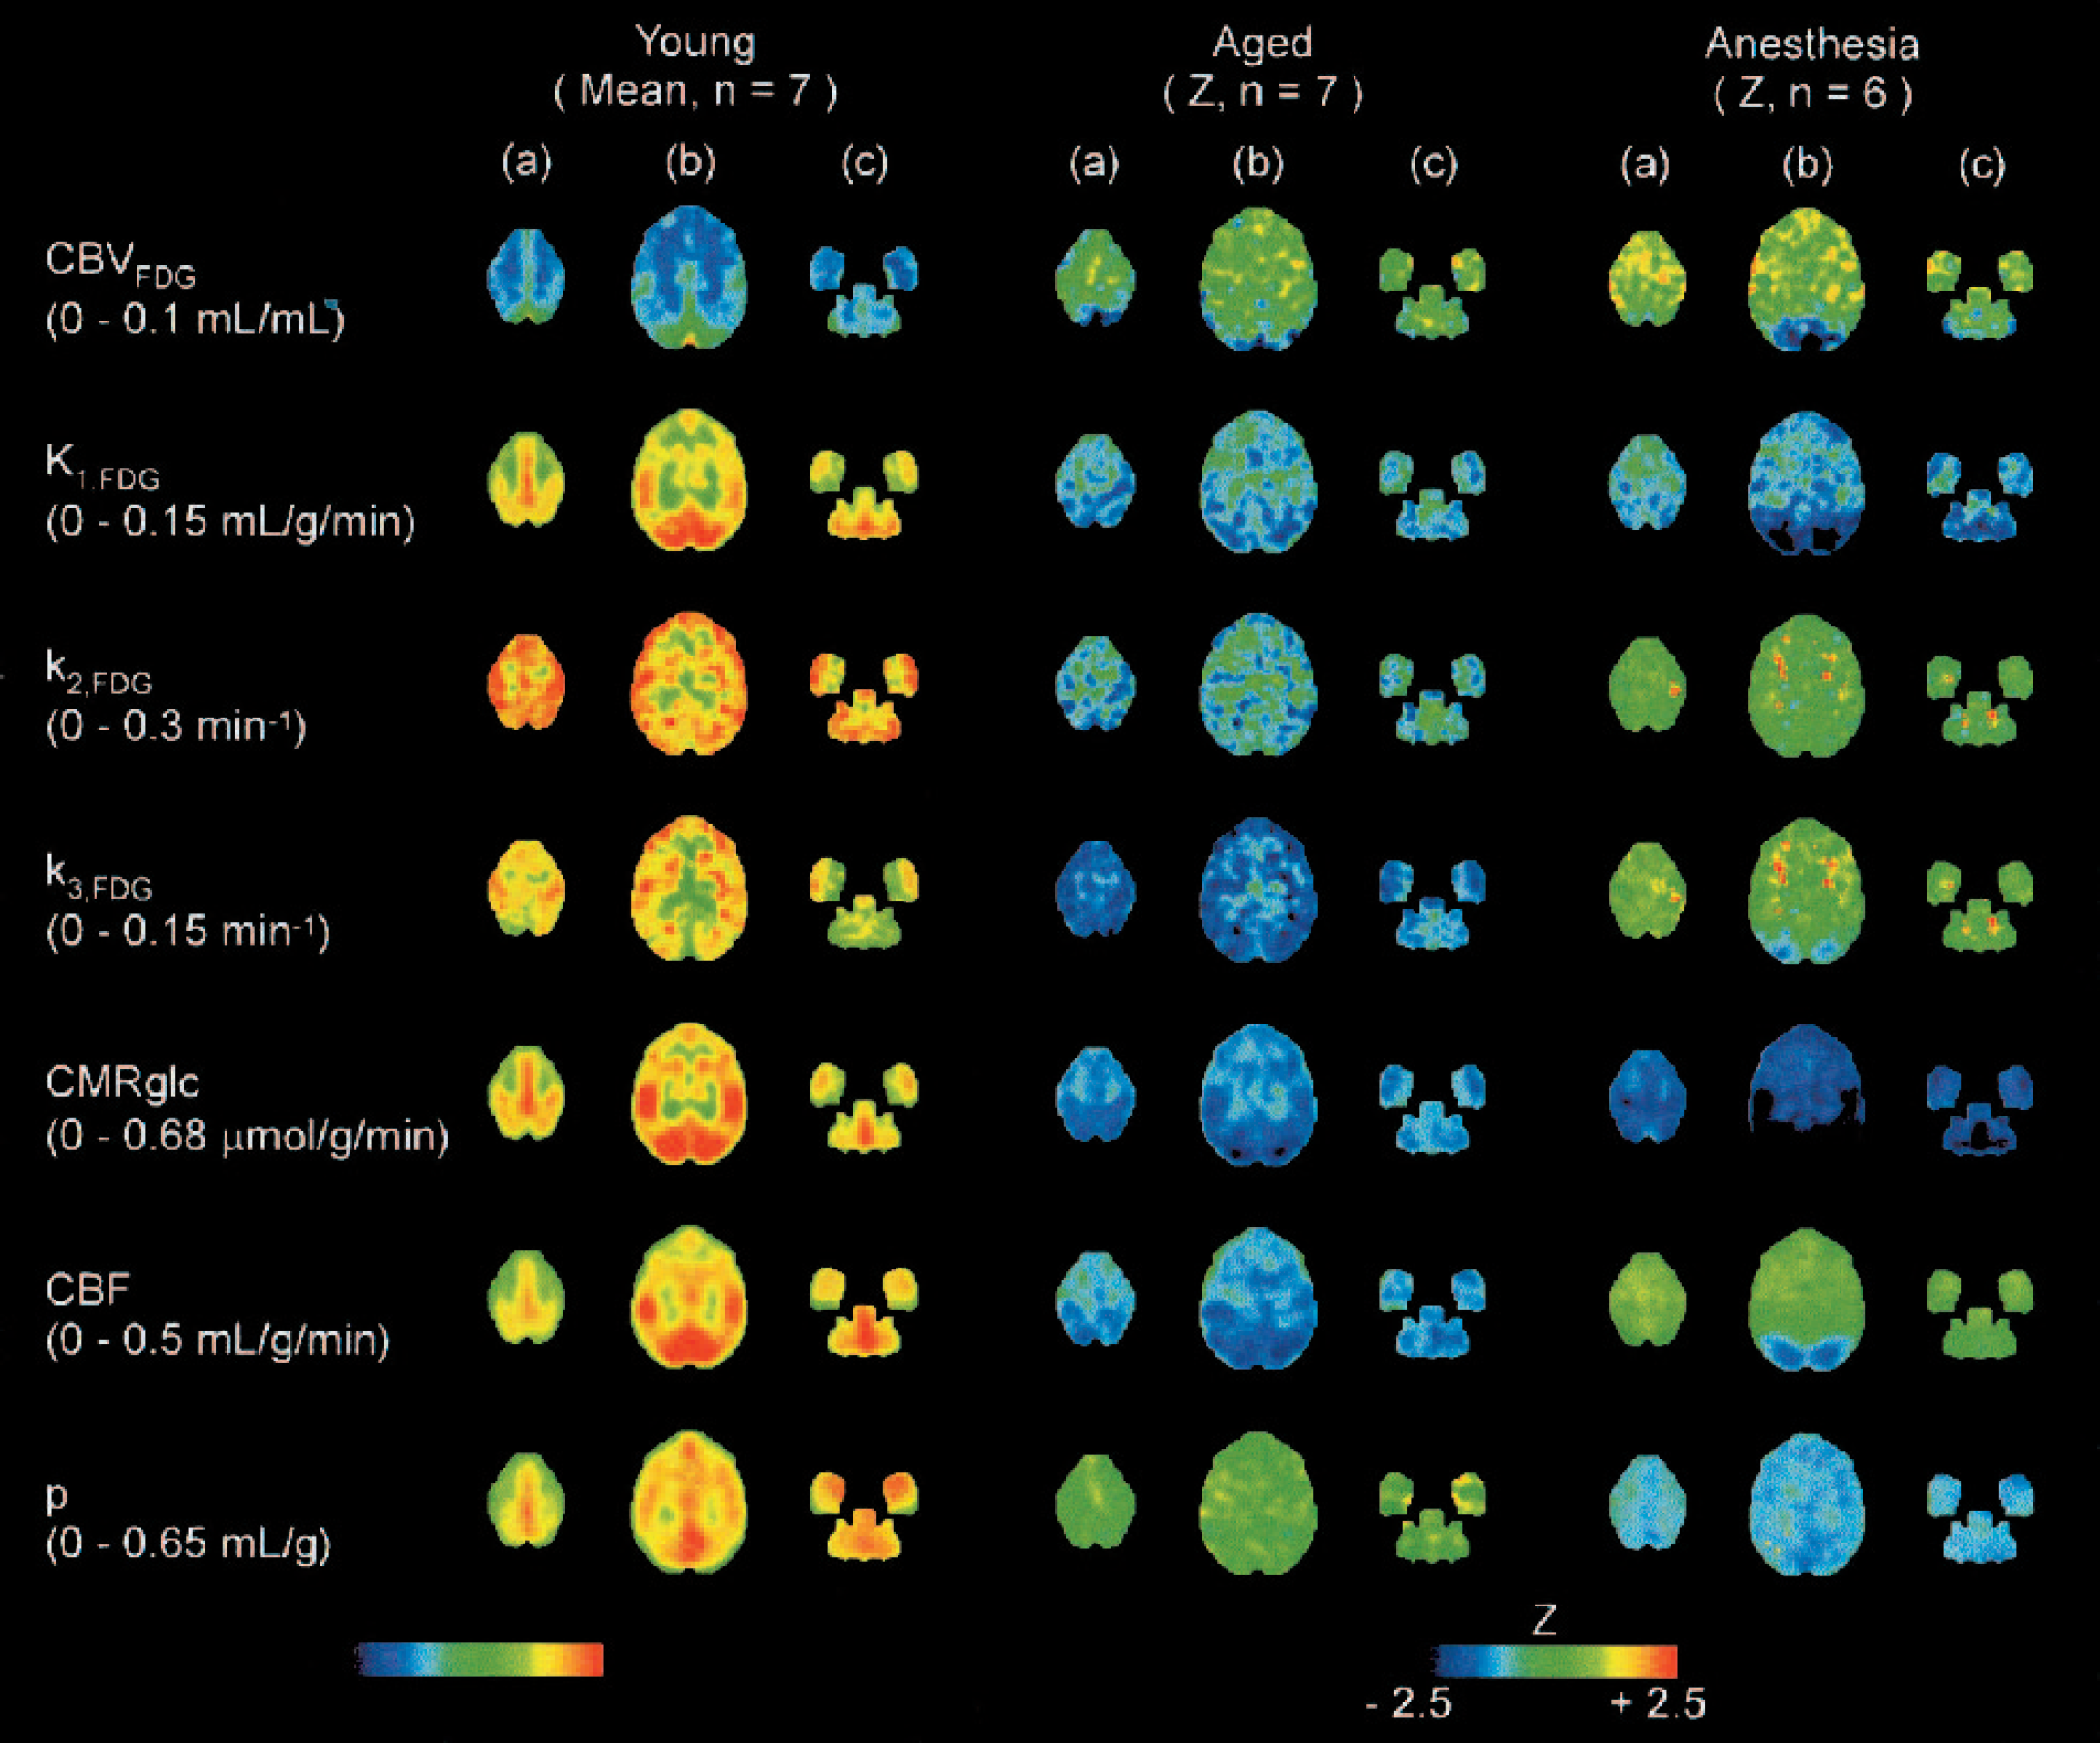
Young: Mean images of estimated parameters from the young group (n = 7). Aged: Z images from the aged group compared with the young group (n = 7). Anesthesia: Z images from the anesthesia group compared with the young group (n = 6). All images were anatomically standardized using NEUROSTAT (3D-SSP) and represented as images of transverse slices at the three levels from the anterior commissure-posterior commissure (AC-PC). (A) AC-PC + 13 mm; (B) AC-PC + 4 mm; (C) AC-PC − 5 mm. Ranges in parentheses accompanying each parameter's label correspond to the color scale for the young group indicated at the bottom left. Color scales for the aged and anesthesia groups were as indicated at the bottom right.
In the anesthesia group, glucose transport (K1,FDG) was also reduced; however, glucose phosphorylation (k3,FDG) was intact except for the occipital pole (Fig. 2). The occipital cortex was highly affected in CMRglc, as well as in CBV, K1,FDG, and CBF. The partition coefficient of water (p) was significantly decreased in the entire brain. No localized decrease in k3,FDG in the occipital pole was revealed in ROI analysis but was found by pixel-by-pixel analysis. Pixel-by-pixel analysis suggested the extent of the reduction. The extent of reduction in the occipital cortex was different between K1,FDG and k3,FDG. The pattern of K1,FDG was closer to that of CMRglc and CBF, whereas that of k3,FDG was closer to the pattern of CBV (Fig. 2).
In the young group, the patterns of distribution for each parameter are compared in Fig. 2. Here, K1,FDG was highest in the occipital cortex; however, there was no such high intensity in k3,FDG, especially in the posterior cingulate, where rather low activity in k3,FDG was found.
Estimated values for k4,FDG from whole brain were 0.0182 ± 0.0031 (young group), 0.0158 ± 0.0034 (aged group), and 0.0184 ± 0.0054 (anesthesia group) min−1, with no significant difference among the groups. Plasma glucose levels were 103 ± 27 (young group), 107 ± 14 (aged group), and 70 ± 6 (anesthesia group) mg/dL, with a significant decrease in the anesthesia group compared with the young group (P < 0.01).
DISCUSSION
In the present study, kinetic rate constants for FDG and the tissue-blood partition coefficient of water were estimated in rhesus macaques using dynamic PET. CBV, CMRglc, and CBF were also derived. Alterations in these parameters were examined in aging or anesthesia conditions. Analysis was performed upon parametric images using an anatomic standardization technique. Then, group differences were examined on a pixel-by-pixel basis. In the young group, all kinetic rate constants for FDG were higher than those in humans (K1 = 0.095, k2 = 0.125, k3 = 0.069, k4 = 0.0055, by Reivich et al., 1985), which indicated faster kinetics in each step of glucose metabolism in macaques. It was also suggested by the time course of PET data from macaques peaking within 1 hour (data not shown), whereas that of humans was still increasing at 1 hour (Jagust et al., 1991; Piert et al., 1996). The tissue-blood partition coefficient of water obtained in young macaques (approximately 0.5) was lower than in humans (approximately 0.8, by Yokoi et al., 1991), which also indicated faster clearance of water from tissue. These faster kinetics allowed relatively shorter scan duration in estimating kinetic parameters than needed in human. Because these parameters in macaques were considerably different from those in humans, use of humans for macaque studies is rather inappropriate. The values from the young group would be important and useful for other macaque PET studies. However, the values for aged and anesthesia condition may not be directly applicable to all other PET studies in primates because aged animals have generally greater individual variation, and effect of anesthesia also varies according to how the anesthesia was controlled. The group differences revealed on the parametric images were somewhat qualitative but would provide valuable information for the other studies.
Declines in CMRglc (Chawluk et al., 1987; De Santi et al., 1995; Kuhl et al., 1982; Loessner et al., 1995) and CBF (Leenders et al., 1990; Martin et al., 1991; Pantano et al., 1984) were shown in aged humans as well as in aged macaques (Eberling et al., 1995; Noda et al., 2002). The macaques used in the present study were approximately 20 years old (roughly equivalent to 60 years in humans), the age at which it has been reported that some animals show impairments in performance of certain spatial abilities, as well as senile plaques and amyloid deposits (Price et al., 1992). The macaques in the aged group were more affected in glucose phosphorylation (k3,FDG) than glucose transport (K1,FDG) compared with the young group. The occipital cortex was the most affected region in K1,FDG and k3,FDG, which was also associated with a decrease in CBV, CMRglc, and CBF (Table 1 and Fig. 2). This correlates with impairment of visual related performance, such as object recognition, spatial delayed response, visuospatial orientation, and visually guided reaching in aged rhesus macaques (Price et al., 1992). Although a decline in the occipital cortex was also observed in the anesthesia group, there was no decline in the partition coefficient (p) in the aged group, and there was only a slight decrease in k3,FDG in the anesthesia group. Therefore, the profound decline in the occipital cortex can be considered an effect of aging.
In the anesthesia group, CBV increased in the frontal cortex and decreased in the occipital cortex (Table 1 and Fig. 2). CBF also slightly increased in the frontal cortex (Fig. 2) and decreased in the occipital cortex (Table 1 and Fig. 2). Isoflurane was reported to have intrinsic cerebral vasodilatory effects, and these effects were different between regions in humans (Matta et al., 1999) as well as rhesus macaques (Enlund et al., 1997). Effects of isoflurane were suggested to depend upon the balance between the isoflurane's intrinsic vasodilatory action and the vasoconstriction secondary to flow-metabolism coupling (Enlund et al., 1997; Hansen et al., 1989; Matta et al., 1995). As for the effect of isoflurane, CMRglc decreased globally, but a relatively larger decrease was observed in the occipital cortex (Fig. 2), which may have caused CBV and CBF to decrease in the occipital cortex by exceeding vasodilative effect of isoflurane. The profound decrease in the occipital cortex was possibly caused by the blockade of visual stimulation in the anesthesia condition, as eyes were opened in the young group. The smaller extension in CBV decrease compared with K1,FDG and CBF decrease is supported by the evidence that the CBV increase caused by visual stimulation was smaller than the CBF increase (Ito et al., 2001). These results also suggested isoflurane affected glucose transport more than phosphorylation, as K1,FDG decreased and k3,FDG was unchanged. GLUT1 is the primary isoform of the glucose transporter in the brain and is highly expressed in the blood-brain barrier (BBB) (Vannucci et al., 1997). Isoflurane may affect BBB function, which is also suggested by a decrease in the tissue-blood partition coefficient of water (p), as is shown in Table 1 and Fig. 2. Water movement in the brain was regulated by aquaporin (AQP) 4 expressed on astrocytes (Badaut et al., 2002). AQP2, in the same group with AQP4, was reported to be affected by sevoflurane anesthesia; therefore, AQP4 might be affected by isoflurane, leading to an alteration in the tissue-blood partition coefficient of water (p). Although the partition coefficient of FDG (K1,FDG/k2,FDG) was not calculated, it also decreased, as K1,FDG decreased and k2,FDG was unchanged. Isoflurane is suggested to affect BBB function and change the permeability of water, as well as FDG.
In the young group, the occipital cortex showed an intensely high rate of K1,FDG, CMRglc, and CBF, although k3,FDG was not especially observed in the posterior cingulate (Fig. 2). The occipital cortex had high CBV, indicating high capillary density. Glucose metabolism in the occipital cortex may be primarily regulated by glucose transport in macaques.
In summary, kinetic parameters for macaques determined in the present study will be useful for future macaque studies, and alterations in the parameters in aging or anesthesia were revealed upon parametric images using an anatomic standardization technique. The results also demonstrated the potential capabilities of dynamic PET, as well as the usefulness of the anatomic standardization technique in tracer kinetics studies.
Footnotes
Acknowledgment:
The authors thank Prof. Norihisa Tonami and Dr. Ichiei Kuji of Kanazawa University Graduate School of Medical Sciences for their support. The authors also thank Ms. Donna J. Cross of the University of Washington for assistance in using NEUROSTAT; Dr. Satoshi Nakanishi of Suzuka University of Medical Science and Technology for the MRI data acquisition; Mr. Shingo Nishiyama, Mr. Masami Futatsubashi, and Mr. Kengo Sato of Hamamatsu Photonics K.K. for the synthesis of H215O and [18F]FDG; and Dr. Takeharu Kakiuchi of Hamamatsu Photonics K.K. for assistance in PET experiments.