
Abstract
An understanding of the local changes in cerebral oxygen content accompanying functional brain activation is critical for making a valid signal interpretation of hemodynamic-based functional brain imaging. However, spatiotemporal relations between changes in tissue partial pressure of oxygen (Po2) and induced neural activity remain incompletely understood. To characterize the local Po2 response to the given neural activity, the authors simultaneously measured tissue Po2 and neural activity in the identical region of guinea pig auditory cortex with an oxygen microelectrode (tip < 10 μm) and optical recording with voltage-sensitive dye (RH 795). In addition, a laser displacement gauge and a laser-Doppler flowmeter were used to monitor the spatial displacement and regional cerebral blood flow, respectively, in the Po2 measurement region. In the activated region, tissue Po2 initially decreased during the ∼3seconds after the onset of acoustic stimuli, and then increased during the next ∼5 seconds. Such biphasic changes are consistently found in cortical layers I to IV. In addition, amplitude of the biphasic change was closely related to detected peak height of the optical signal changes. The results suggest that the initial decrease in tissue Po2 is coupled to the induced neural activity and depends on response time of local increase in cerebral blood flow.
A fundamental function of cerebral microcirculation is to maintain constant levels of oxygen and carbon dioxide content in brain tissue (Mchedlishvili, 1986). Once localized neurons are functionally activated, regional CBF is redistributed in the activated region. This CBF redistribution might prevent a deficiency of local oxygen supply and minimize variations in tissue partial pressure of oxygen (Po2) resulting from an increase in CMRO2 after the neural activation. However, these differential changes in CBF and CMRO2 vary the spatiotemporal distribution of oxygen content in the activated region. Because such variations in oxygen content are significant for making a valid signal interpretation of current brain-imaging techniques, such as blood oxygen level–dependent functional magnetic resonance imaging (Ogawa et al., 1992), optical intrinsic signal imaging (Bonhoeffer and Grinvald, 1993), and near-infrared topography (Maki et al., 1995; Villringer et al., 1993), an understanding of the local changes in cerebral oxygen content is required.
Although several investigators have directly measured tissue Po2 response with an oxygen electrode, the response of tissue Po2 in the activated region has shown contradictory results; e.g., a decrease in tissue Po2 during the neural activation (Buerk et al., 1998; Metzger, 1979), and an increase in tissue Po2 accompanying the CBF increase in the activated region (Ances et al., 2001; Leniger-Follert and Lübbers, 1976; Lowry et al., 1997). In addition, various methods have been used to induce the neural activation, such as direct electrical stimulation to the cerebral cortex (LaManna et al., 1989; Leniger-Follert and Lübbers, 1976; Metzger, 1979; Silver, 1978), electrical forepaw stimulation (Ances et al., 2001), and physiologic stimulation (Buerk et al., 1998; Lowry et al., 1997; Vanzetta and Grinvald, 1999). Because these methods of activating the cortex are likely to cause various neural activity in the Po2 measurement region, they might account for the discrepancy in Po2 responses among studies.
Silver (1978) described that within 250 μm of the stimulated spot, tissue Po2 increased with increasing CBF after the cortical stimulation in rat brain, whereas in a location close to the stimulated spot, tissue Po2 initially decreased and then increased (biphasic changes). Silver's pioneering work reveals that the type of Po2 response depends on the distance from the activated site. LaManna et al. (1989) showed that the direction (decrease or increase) of tissue Po2 response depends on the depth from the stimulated cortical surface. These studies suggest that a pattern of tissue Po2 response depends on localized neural activity, because the induced neural activity attenuates with increasing distance from the stimulated spot. Therefore, simultaneous measurement of Po2 response and localized neural activity is needed to determine the spatiotemporal relations between Po2 response and neural activity.
In the present study, to characterize spatiotemporal patterns of local tissue Po2 response to the given neural activity, we simultaneously measured tissue Po2 and neural activity in the identical region of guinea pig primary auditory cortex (AI) with an oxygen microelectrode (tip diameter < 10 μm) and optical recording with voltage-sensitive dye (RH-795). AI is a unique region in which acoustic frequency and amplitude are topographically mapped (Schreiner and Mendelson, 1990). Using a fixed acoustic frequency and amplitude as functional activation therefore generates a stable activity map in a determinate spot of AI. Thus, AI is useful to examine the spatiotemporal relations between tissue Po2 response and localized neural activity. We used two acoustic stimuli consisting of a broad frequency band (1–16 kHz; called a click and a scream) (Fukunishi, 1994), to generate a broad activated region spatially varying in neural activity within the AI. An oxygen microelectrode was sequentially placed within the cortical layers I to IV and various areas differing in neural activity. Tissue Po2 was continuously measured before and after the acoustic stimuli. In addition, a laser displacement gauge and a laser-Doppler flowmeter were used to monitor the spatial displacement and regional CBF, respectively, to discriminate the Po2 signals and artifactual noises. Our results show that tissue Po2 response consistently shows biphasic changes in the activated region of guinea pig auditory cortex.
MATERIALS AND METHODS
Animal preparation
Seven Hartley guinea pigs (5 or 6 weeks old) weighing 340 to 400 g were anesthetized by intramuscular injection of ketamine hydrochloride (46 mg/kg body weight) and xylazine hydrochloride (23.3 mg/kg body weight). Subsequent anesthetic levels were maintained by supplementary injections of a half dose of the initial application every hour. Before the surgery, we dehaired the parietal and left hemisphere regions of the head, surrounding region of both ear lobes, and pectoral regions with electric clippers, and checked on normal conditions of eardrum membranes. The animals were tracheotomized and mechanically ventilated at a rate of 60 to 80 cycles/min (12 mL/kg body weight per cycle) with inhalation of a mixture of 30% oxygen and 70% nitrogen. The animals were placed on a stereotaxic apparatus, and a 7 mm × 7 mm piece of the skull overlying the auditory cortex of the left hemisphere was removed in parallel to the median line with a dental drill. After blood vessels on the dura were carefully cut with a bipolar coagulator, the dura was resected, and the exposed cortex was stained by covering with cotton gauze that contained voltage-sensitive dye RH 795 (0.7 mg/mL in saline; Molecular Probes) for the optical recording of neural activity. After 1 hour, the cortical surface was rinsed with saline and covered with silicone oil (SH200, Toray). During the surgery and all experiments, body temperature of the animal was maintained at 35.0 ± 1.0°C with a regulated heating pad (ATB-1100, Nihon Koden). Arterial blood gases were monitored with a blood gas analyzer (GASTAT-mini, Techno Medica, Yokohama, Japan), and ventilation parameters were adjusted (Pao2 = 103 ± 27 mm Hg, PaCO2 = 20 ± 3 mm Hg, pH = 7.39 ± 0.04). The rectal temperature, ECG, and end-tidal carbon dioxide were also monitored, and all experiments were performed in a soundshield room. After the experiments, the animals were euthanized by intraperitoneal injection of sodium pentobarbital. All experiments were performed in accordance with the principles approved by the Council of the Physiological Society of Japan and the guidelines of the Animal Experimental Committee of the Advanced Research Laboratory, Hitachi.
Acoustic stimulus
Acoustic stimulus was generated by a computer with a 100-kHz D/A system and presented binaurally at a stimulus level of approximately 100-dB sound pressure level via circum-aural earphone (MDR-E888, Sony) placed on both ears of the animal. To produce a broad activated region in which activity spatially varies within AI, we applied two physiologic acoustic stimuli, called click (brief stimulus of 0.1-millisecond duration) and scream (extended stimulus of 630-millisecond duration) (Fukunishi, 1994). A click consisted of a broad band of frequency; a scream, which imitates the communication sound of the animals, also consisted of a broad band of frequency, but was temporally modulated from low to high frequency within the stimulus duration (630 milliseconds). In each experiment, 6 to 16 trials were repeated at a time interval of at least approximately 28 seconds between each trial. To improve the signal-to-noise ratio, timing of the stimulus onset was phased with the ECG.
Electrical recording of tissue Po2 response
Tissue Po2 was measured with a recessed polarographic microcoaxial electrode developed by Baumgärtl and Lübbers (1983). This microelectrode has been recognized as an exceptional tool for measuring local tissue Po2 directly with high spatiotemporal resolution. The small tip (0.6 μm in diameter in the original design by Baumgärtl and Lübbers, 1983) of the electrode allows reliable Po2 measurement with minimal oxygen consumption by the electrode itself (less than approximately 0.1 mm Hg/min) and tissue breakdown. In brief, this microelectrode consisted of a Pt cathode (approximately 0.1 μm in diameter at its tip) coaxially covered with sputtered Ag-AgCl anode. The final size of the electrode tip we used here was less than 10 μm in diameter. The microelectrode was calibrated before and after each experiment, in saline (37 °C) consecutively gassed with 0%, 10%, and 20% oxygen. Sensitivity of the microelectrode was 7 to 15 pA/mm Hg. Baumgärtl and Lübbers (1983) reported that a 90% oxygen content in the region within 6.3 times the radius of the cathode (i.e., ∼50-μm hemisphere around the cathode), and that a 90% response time was ∼0.5 seconds. Oxygen reduction current was measured with a microammeter (R8340A, ADVANTEST, Tokyo, Japan) polarizing at a constant voltage (–0.65 V) and recorded with a data collector (NR-2000, Keyence, Osaka, Japan) at 40-Hz sampling frequency. The recorded current was converted into Po2 values with the calibration curve derived from the three points of calibration (i.e., 0%, 10%, and 20% oxygen). A relative change in tissue Po2 response (ΔPo2) was determined by subtracting the prestimulus Po2 level (i.e., ∼3-second period of measurement before the onset of stimulus) from each Po2 value. The oxygen microelectrode was inserted from cortical surface at an angle of approximately 52 degrees with a micromanipulator (ME-71, Narishige Scientific Instrument Lab, Tokyo, Japan), as illustrated in Fig. 1. Insertion of the microelectrode was set at 0.1-mm advancement at a rate of 0.02 mm/s and then a 0.05-mm withdrawal at the same rate after each advancement, thus yielding the 0.05-mm measurement intervals. The position at which the electrode tip first contacted the cortical surface was defined as 0-mm depth (in the z direction). The subsequent depths denoted in this study are represented by multiplying the implemented electrode advancement by sin52°. Each location of Po2 measurement was captured with a video camera from a dorsal view and identified with its neural activity determined with optical recording. Figure 2 shows a dorsal view of a region for simultaneous measurement of tissue Po2 response and neural activity within the AI. The location of Po2 measurement was chosen based on a preliminarily acquired activity map to both click and scream stimuli, with exception of the region on or near the large pial vessels.
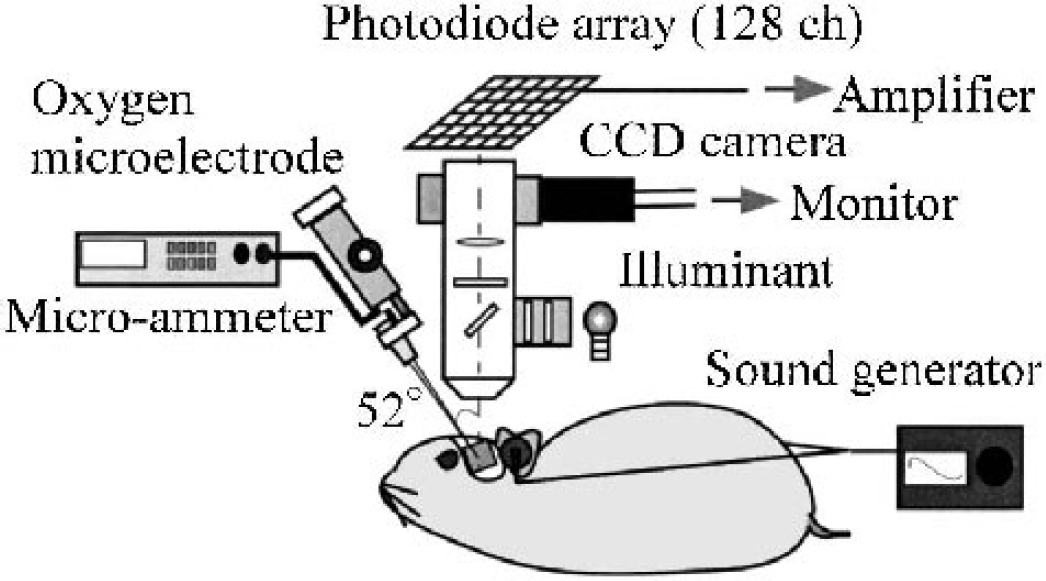
Simultaneous measurement of tissue Po2 response and localized neural activity in guinea pig auditory cortex.
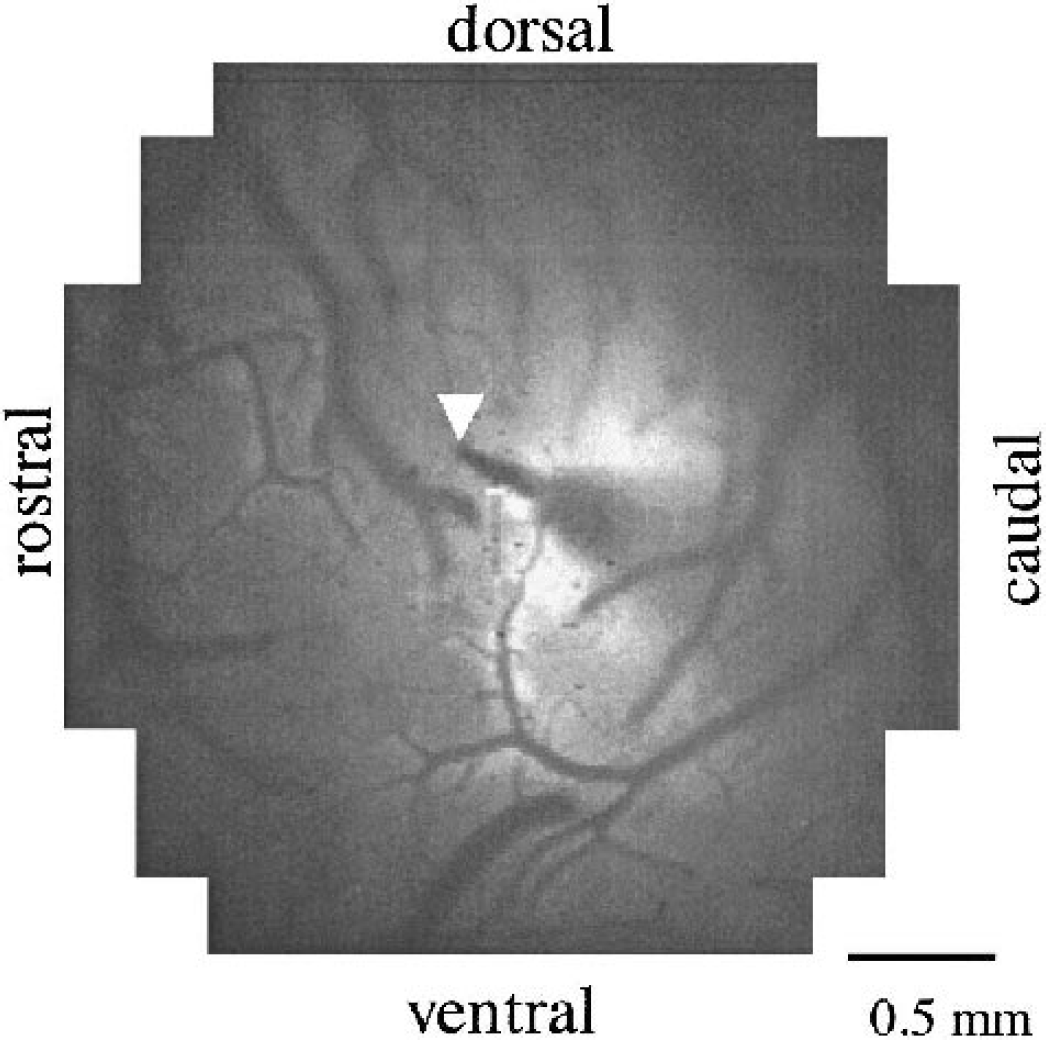
Measurement region for optical recording of neural activity. Tissue Po2 was simultaneously measured within this region of AI. Arrowhead indicates a location of the oxygen microelectrode tip.
Optical recording of neural activity
Localized neural activity was measured with a custommanufactured optical recording system previously reported in detail (Tokioka et al., 2000). In brief, the optical recording system was a 12 × 12 photodiode array installed in an eye port of a microscope to detect spatiotemporal changes in optical signals from cortical tissue. The measurement region was a 3 mm × 3 mm (Fig. 2). The optical signals detected by each single photodiode array represent the integral of membrane potential changes throughout approximately 0.5-mm depth from cortical surface within an approximately 0.25 mm × 0.25 mm region of the cortical surface. Therefore, obtained neural activity includes the sum of electrical activity of all the neuronal elements (cell bodies, axons, and dendrites), such as membrane potential changes in both presynaptic and postsynaptic neuronal elements, as well as a possible contribution from the depolarization of neighboring glial cells (Grinvald et al., 1999). All signals of the photodiode array (128 channels) were amplified and then inputted in parallel at 1 kHz into a computer (FLORA, Hitachi). To reduce any artifacts of the optical signals, we subtracted the signal of no-stimulus onset (approximately 14 seconds after stimulus onset) from the signal of stimulus onset, and averaged it over 10 to 16 trials, as previously described in detail (Tokioka et al., 2000).
Optical monitoring of spatial displacement of cortical surface
Because these electrical and optical recordings are susceptible to spatial displacement of the cortical surface (e.g., derived from mechanical ventilation and pulses in blood pressure), the spatial displacement was monitored with a laser displacement gauge (LK-03 & LK-2000, Keyence). The laser displacement gauge was placed approximately 0.3 m above the cortical surface. Then, its excited beam was adjusted to be perpendicular to the cortical surface. The spot of the beam overlapped the location of Po2 measurement, namely, the oxygen microelectrode was fixed beneath the beam spot. Spatial displacement and tissue Po2 response were simultaneously recorded with a data collector (NR-2000, Keyence) at a 40-Hz sampling rate. Then, these spectral components were analyzed with spectral analyzer software (WAVE SHOT 2000, Keyence) to discriminate the artifacts caused by the spatial displacement.
Local CBF monitoring
A laser-Doppler flowmeter (LDF) (TBF-LN1, Unique Medical, Tokyo, Japan) was used to monitor local CBF changes elicited by the acoustic stimulus in the overlapped region in which the oxygen microelectrode was inserted. Light source of the LDF was a laser diode with 780-nm excitation, and the laser output was ∼2 mW. The LDF probe (0.5 mm in diameter; LP-N, Unique Medical) was adjusted on the cortical surface, and then the oxygen microelectrode was inserted beneath the center of the probe (approximately 0.25-mm depth). The probe samples a tissue volume of approximately 1 mm3, and has a 0.14-mm fiber separation (core diameter of each fiber was 0.10 mm). The local CBF changes were measured with a time constant of 0.1 second, and tissue Po2 and LDF signals were simultaneously recorded with a data collector (NR-2000, Keyence) at a 40-Hz sampling rate.
Statistical analysis
The relative change in tissue Po2 (ΔPo2) and CBF (ΔCBF) was determined in each trial by subtracting the prestimulus levels (i.e., ∼3-second period of measurements before the stimulus onset) from each value. Mean and SD of the ΔPo2 and ΔCBF were calculated for 6 to 10 trials in each location. The mean of baseline Po2 levels (0.5 seconds before the stimulus onset) was compared to the mean of each 0.5-second period after the stimulus onset using the Student's or Welch's t-test. P values less than 0.01 were considered statistically significant.
RESULTS
Tissue Po2 response to acoustic stimulus
Figure 3 shows a typical chart of the continuous measurement of tissue Po2 response to the acoustic stimulus (scream) for 10 trials at the single location. Tissue Po2 significantly increased after the stimulus onset (arrowheads) and subsequently returned to its initial Po2 level (prestimulus level). This prestimulus Po2 level (mean ± SD: 57.0 ± 0.8 mm Hg) was derived from averaging 3 seconds of measurements before every stimulus onset (Fig. 3). In addition, the maximum increase in Po2 response (approximately 108% of the prestimulus level) was significantly larger than the temporal fluctuations of prestimulus Po2 levels (<4% of the average prestimulus level). Such Po2 responses were repeatedly found in the activated region irrespective of the different stimuli (click or scream).
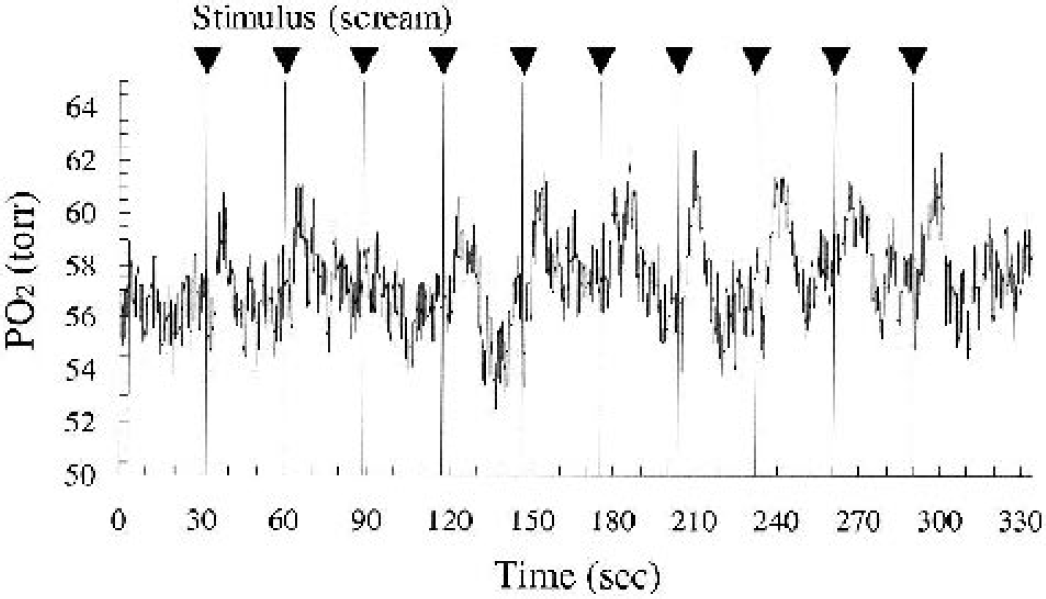
Typical chart of tissue Po2 measurement for 10 repeated trials of acoustic stimulus (scream) in one animal. Tissue Po2 significantly increased after stimulus onset (arrowhead) and subsequently returned to prestimulus Po2 level (57.0 ± 0.8 mm Hg). These patterns of tissue Po2 response were recurrently found in the both measurements elicited by click and scream.
Tissue Po2 response and spatial displacement
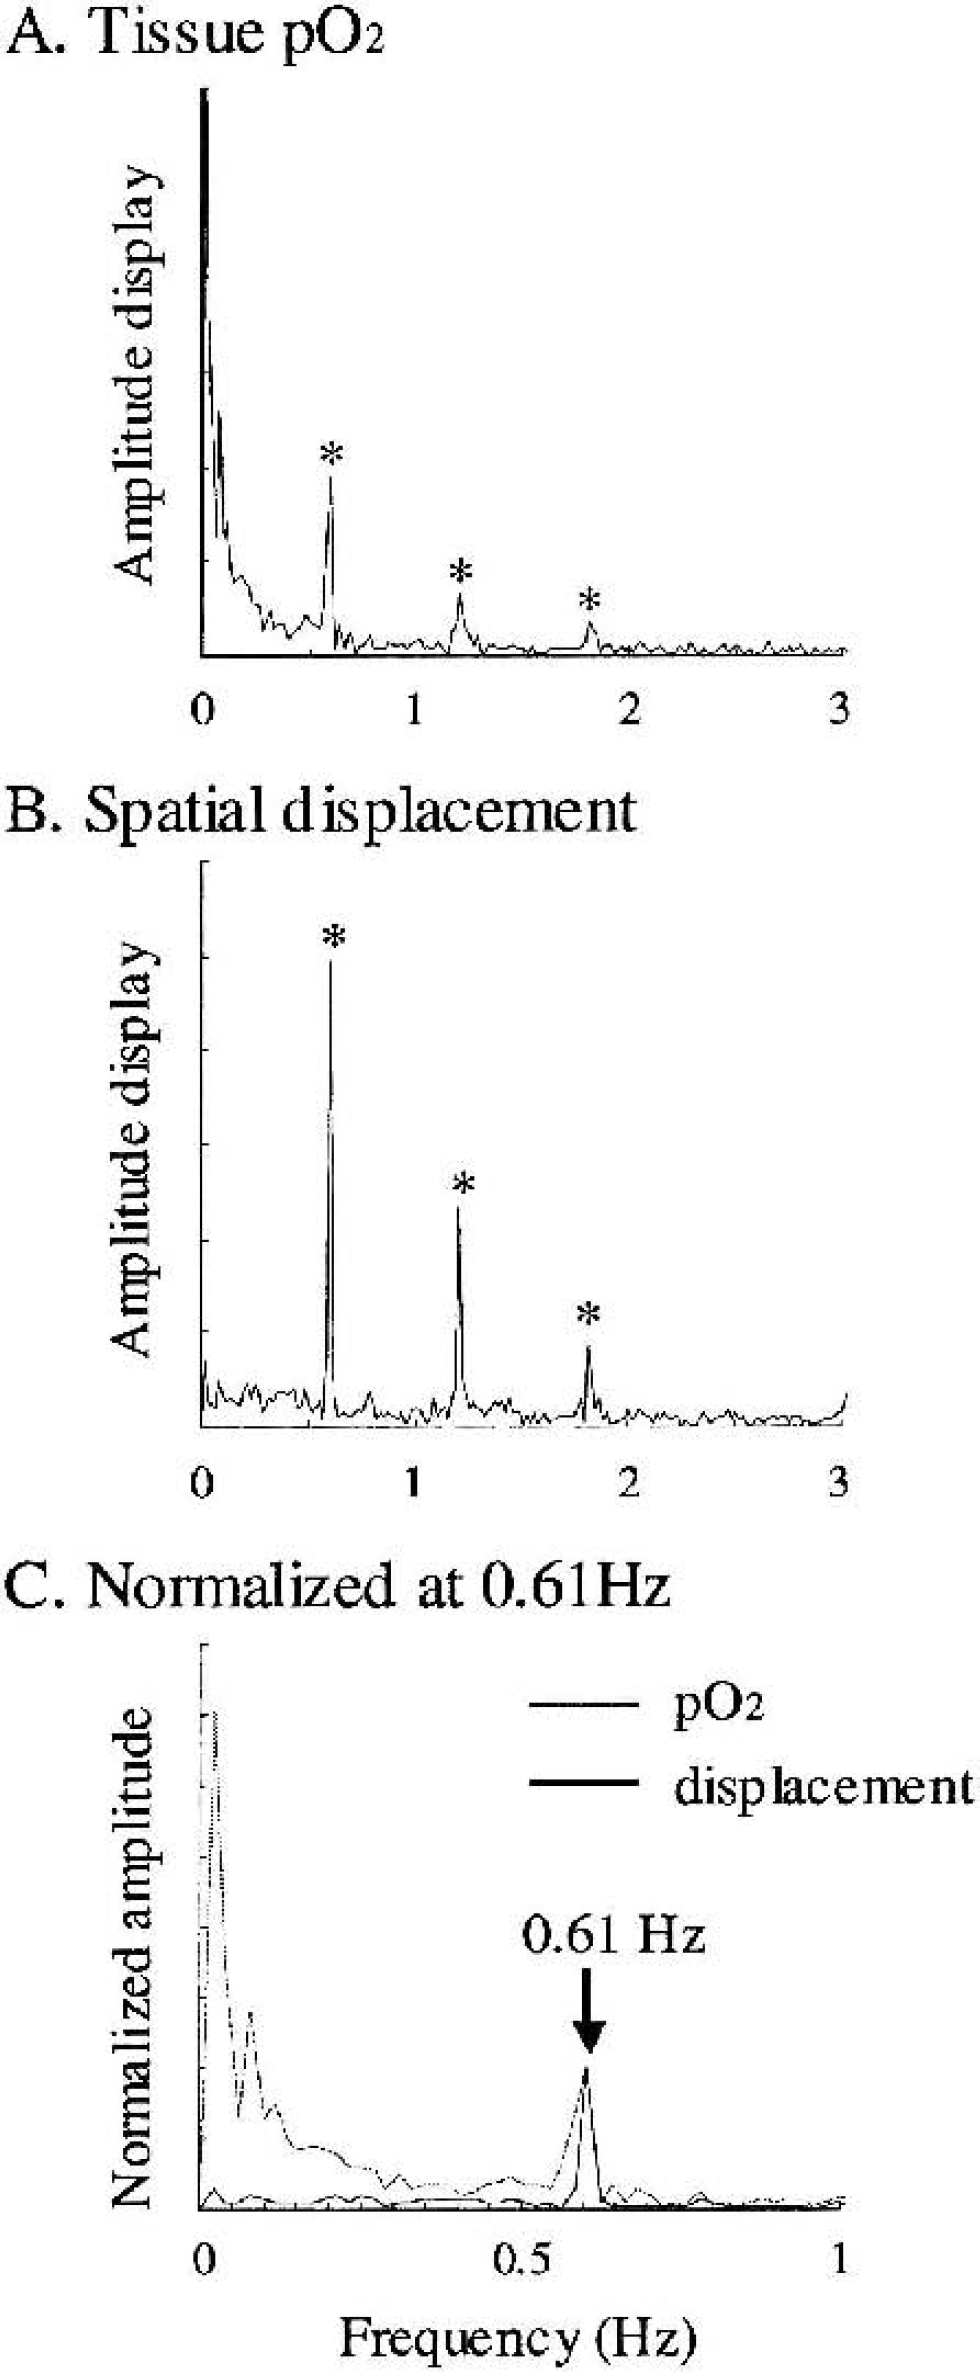
Figure 4 shows typical results of the spectral analysis of tissue Po2 and spatial displacement measured in the identical region for seven trials at a single location. Major spectral components of the spatial displacement were 3.03 Hz (heartbeat) and 1.83, 1.21, and 0.61 Hz (mechanical ventilation and its harmonics) (Fig. 4A). The corresponding tissue Po2 values were 1.83, 1.21, and 0.61 Hz (mechanical ventilation) (Fig. 4B). The low-frequency components (<0.3 Hz) were evident in tissue Po2, compared with those of the spatial displacement (Fig. 4C). These low-frequency components of tissue Po2 represent gradual shifts in cerebral oxygen content. Based on these spectral analyses, bandpass filter (<0.3 Hz) was applied to eliminate the artifacts caused by spatial displacement. Figure 5 compares an original raw data of tissue Po2 and data applied with the bandpass filter. Both measurements before the stimulus onset (Fig. 5A) and after the stimulus onset (Fig. 5B) were not impaired by the filter process, and revealed the slow shifts in tissue Po2 including spontaneous fluctuation of baseline Po2. As for the low-frequency component of this fluctuation, the standard variation of baseline Po2 (resting) was ± 0.8 mm Hg (Fig. 5A). In comparison with this fluctuation of baseline Po2, each trial showed relatively large shifts in tissue Po2, such as an initial decrease and a second increase after the stimulus onset (Fig. 5B).
Spectral components of tissue Po2 response
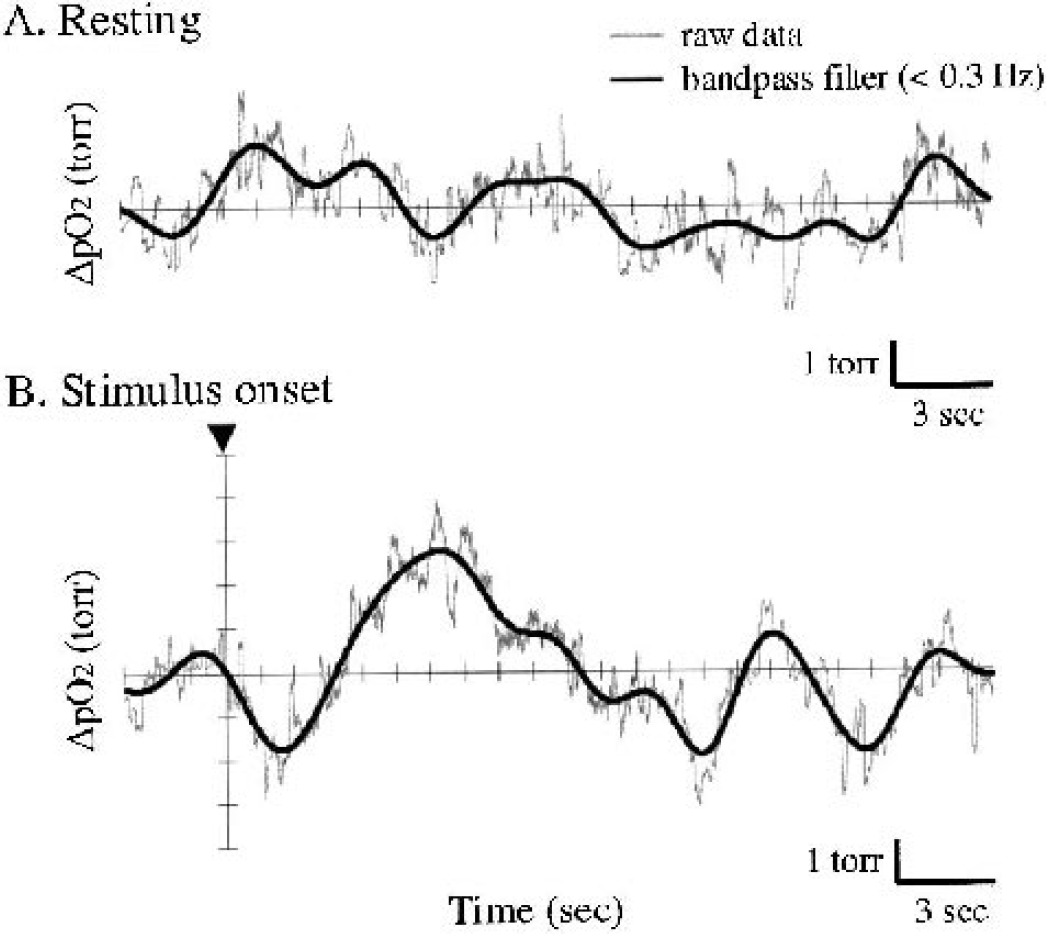
Comparison of Po2 measurements between raw data and applied with bandpass filter (<0.3 Hz) based on the spectral analysis of spatial displacement (see Fig. 4). Measurements taken at rest (before the stimulus onset,
Time course of tissue Po2 response
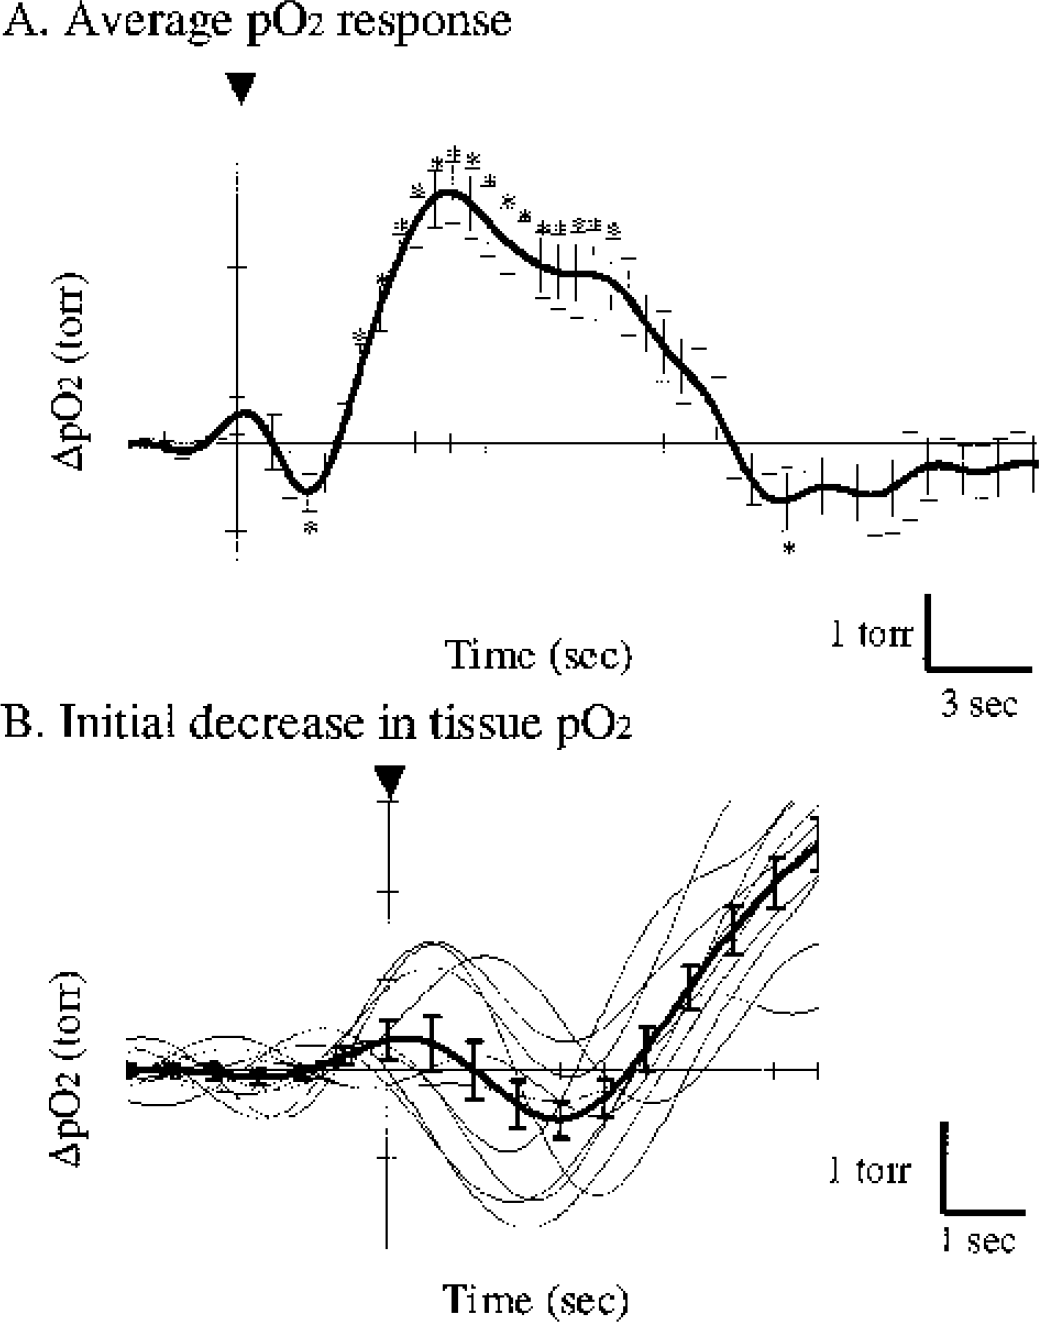
Figure 6A represents the average Po2 response obtained from all 10 trials shown in Fig. 3. Although a single Po2 response included spontaneous fluctuations of the baseline Po2 (Fig. 5B), the averaged Po2 response offset such fluctuations and revealed that tissue Po2 initially decreases and subsequently increases after the stimulus onset (Fig. 6A). Figure 6B focuses on the variations in individual Po2 responses to the stimulus onset. Although the variations in Po2 response were found among individual trials, an initial decrease in tissue Po2 was triggered by the stimulus onset (arrowhead), and showed an initial decrease and a second increase in 9 of the 10 trials. In addition, significant differences (P<0.01) with respect to the baseline level (0.5 seconds before the stimulus onset) were found in the initial negative peak and subsequent positive peak. Such biphasic changes in tissue Po2 responses (initial decrease and subsequent increase) were characterized by four parameters: delay to negative peak (DN), delay to positive peak (DP), negative peak height (NH), and positive peak height (PH). Consequently, we obtained the following values (mean ± SD) from 10 trials shown in Fig. 3: DN, 2.0 ± 0.5 seconds; DP, 6.2 ± 1.2 seconds; NH, −0.8 ± 0.7 mm Hg; and PH, 3.2 ± 0.9 mm Hg. These biphasic changes in tissue Po2 were reproducibly found in the activated region of both click and scream experiments.
Depth distribution of tissue Po2 response
The biphasic changes in tissue Po2 response were also found at successive depths in the activated region. Figure 7 shows typical results of the depth distribution of tissue Po2 response to scream from six trials at a single location. These Po2 responses were sequentially measured from the cortical surface to deeper layers at 0.1-mm intervals (i.e., approximately 0.08-mm-deep intervals due to the implemented electrode advancement by Sin52°). The measurement region corresponds to cortical layers I to IV within a 0.3-mm horizontal distance. This result demonstrates that the average Po2 initially decreased within 2 or 3 seconds after the stimulus onset (arrowhead) and then increased at 5 to 8 seconds throughout the cortical layers (I–IV).
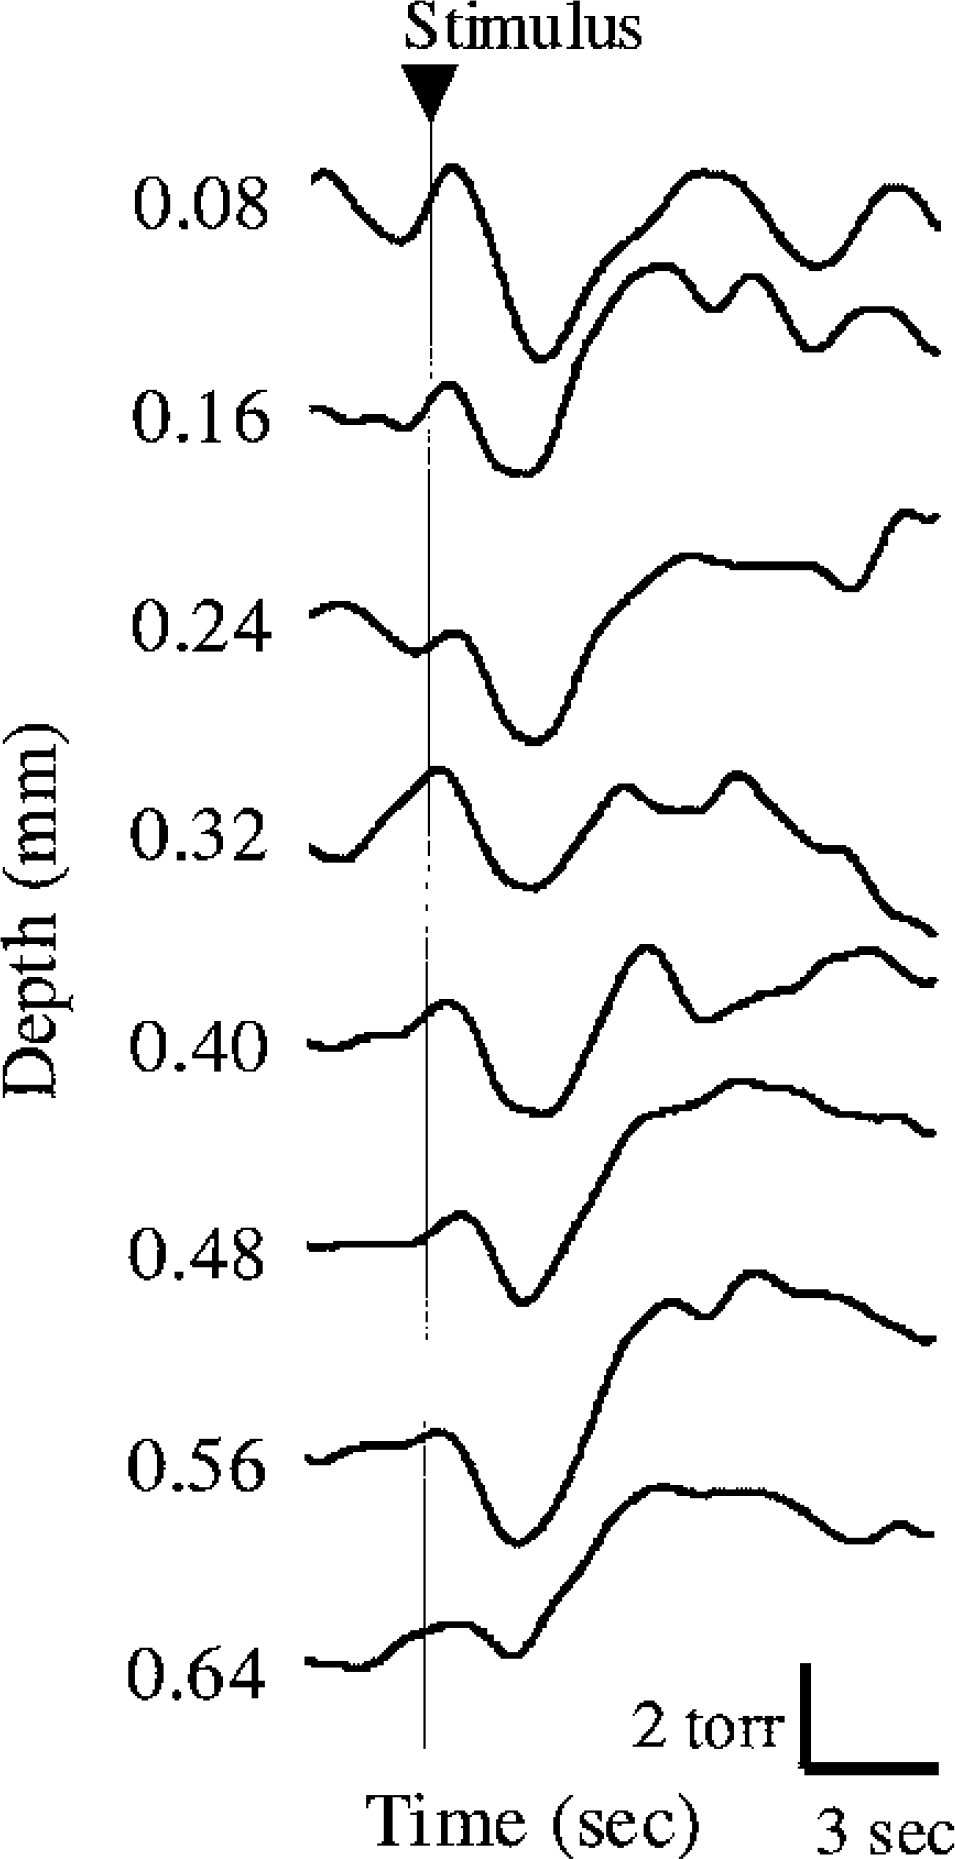
Depth distribution of tissue Po2 response induced by scream (n = 1 location). Biphasic changes in tissue Po2 response are consistently found in successive depths (cortical layers I–IV) in the activated region. N = 1 animal.
Spatial variation in tissue Po2 response relating to localized neural activity
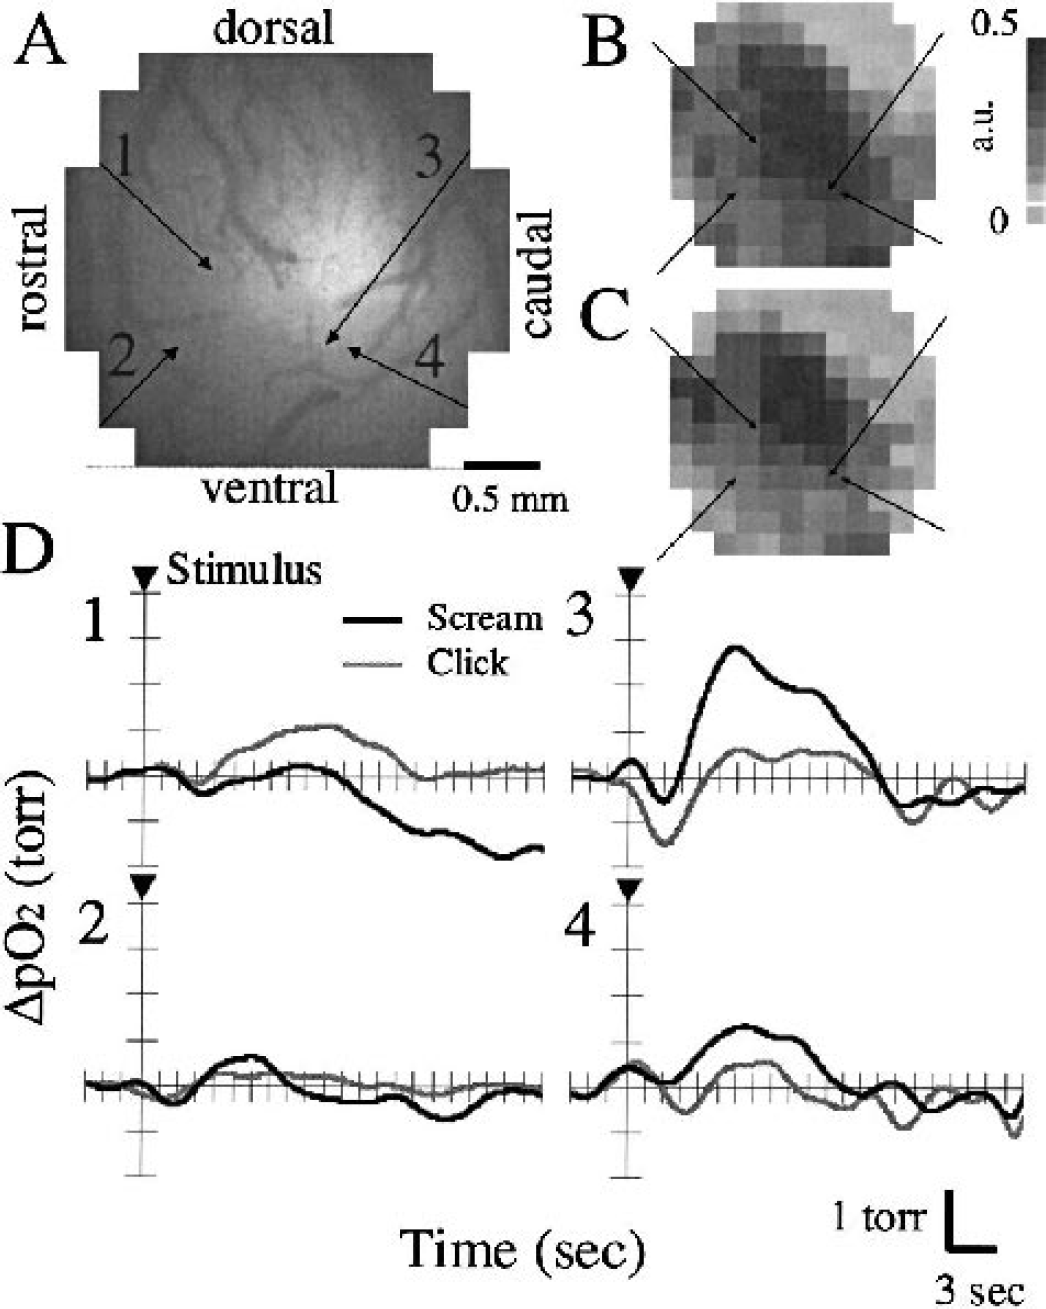
Spatial patterns of induced neural activity did not differ between click and scream stimuli. Figures 8B and 8C show typical results for the spatial mapping of neural activity elicited by click and scream in the same region (a 3 mm × 3 mm in AI) represented in Fig. 8A. The Po2 response was measured at a depth of 0.24 mm at four locations in the same region as the optical recordings (Figs. 8B and 8C). Figure 8D shows the obtained tissue Po2 responses to both click (black line) and scream (gray line) stimuli in the respective locations (1–4). The Po2 response (ΔPo2) was averaged from 10 trials at each location. The stimulus (arrowhead) was induced during 10 trials of click stimulus and subsequent 10 of scream (i.e., 20 trials at each location) at approximately 28-second time intervals between each trial, and thus Po2 measurement took approximately 10 minutes at each location. Although Figs. 8B and 8C represent the neural activity map acquired before the Po2 measurements, these spatial patterns and their activity did not differ from those after all the Po2 measurements were obtained.
Simultaneous measurements for optical recording of localized neural activity induced by click
Comparison of tissue Po2 responses among different types of neural activity (Fig. 8D) reveals that time course and amplitude of Po2 response spatially varied depending on the measurement location (1–4), and that the amplitude of Po2 response was closely related to the neural activity (Figs. 8B and 8C). Interestingly, locations 3 and 4 show the different responses of Po2 (Fig. 8D), although their Po2 measurements were in close proximity (∼0.2 mm). This may reflect the differences of neural activity within each pixel (0.25 × 0.25 mm2) of optical recordings, because each optical signal measures the sum of electrical activity within the detected region. Figures 8B and 8C show that the neural activity near the center of the measurement region was greater than that in the border regions. Another explanation is that the obtained Po2 responses may be affected by the distances from microvasculature around the tip of the oxygen microelectrode. Because location 3 represents a slightly high baseline Po2 level (56 mm Hg) compared with location 4 (52 mm Hg), location 3 was close to the vascular side, and may reflect the large diffusion of oxygen from the vasculature. In view of the distances between their locations (∼0.2 mm), the differences in the oxygen diffusion process are likely to cause the different Po2 responses in local measurements.
Comparison of different stimuli (click and scream) reveals that the temporal pattern of Po2 response was independent of measurement location, whereas the amplitude of Po2 response varied depending on the induced stimuli. Nevertheless, average Po2 responses from all six animals did not significantly differ in DN, NH, DP, and PH between click and scream stimuli (Table 1). This finding suggests that Po2 response might reflect the localized neural activity, because obtained spatial pattern of localized neural activity did not differ for click and scream stimuli (Fig. 8).
Average Po2 responses elicited by scream and click stimuli
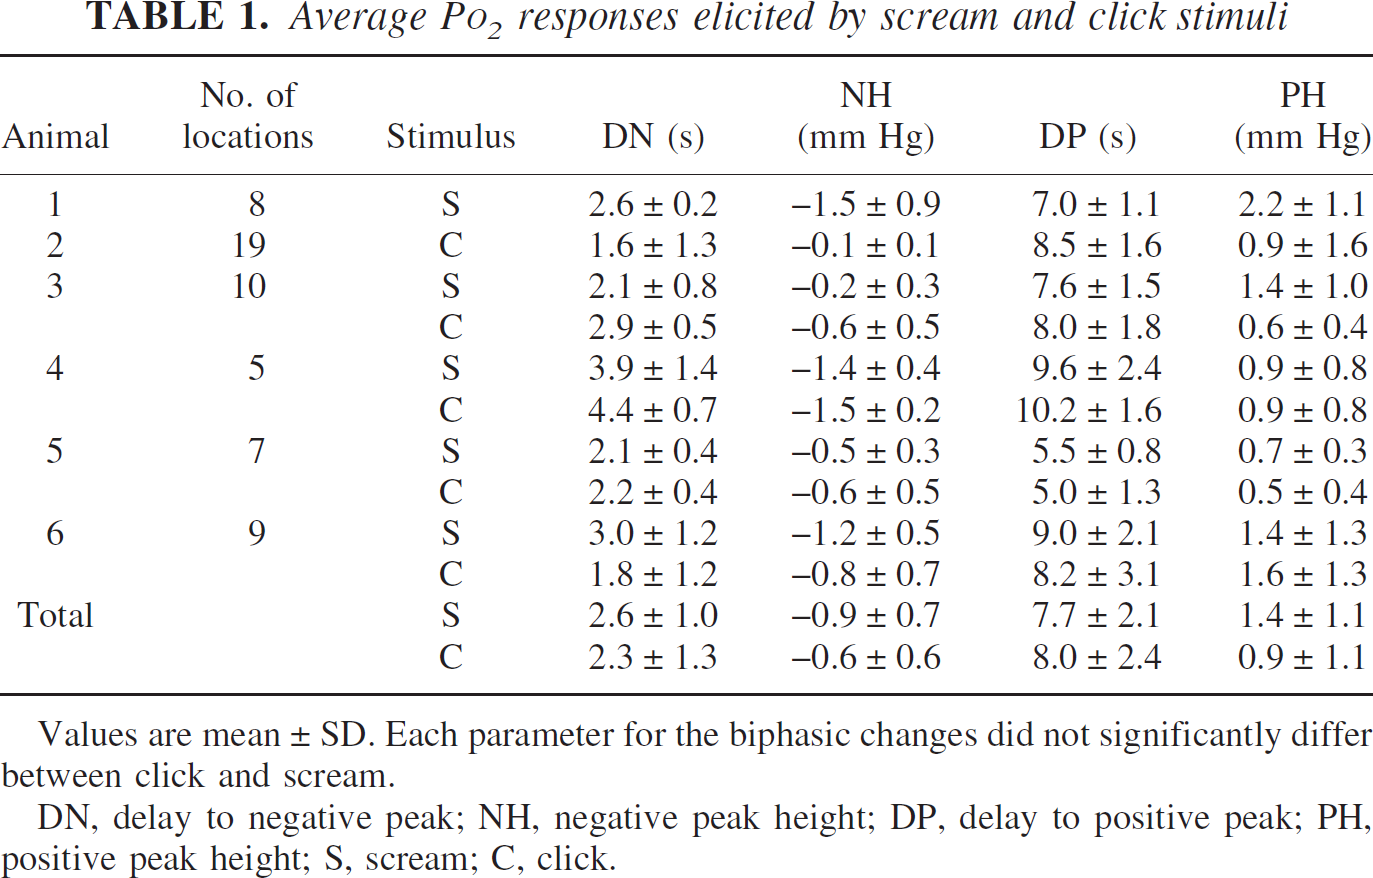
Values are mean ± SD. Each parameter for the biphasic changes did not significantly differ between click and scream.
DN, delay to negative peak; NH, negative peak height; DP, delay to positive peak; PH, positive peak height; S, scream; C, click.
Tissue Po2 response and increase in local CBF
Although LDF measurements detect the relative changes in regional CBF arising from the general region that includes the Po2 measurement location, the detected response of CBF was satisfactorily localized in the activated region. Figure 9 shows two different relationships between Po2 response (ΔPo2) and CBF response (ΔCBF) obtained from different trials at a single location. In one trial, a significant increase in ΔCBF (gray line) after the stimulus onset (arrowhead) corresponded to a rapid increase in ΔPo2 (black line) (Fig. 9A). In contrast, a slight change in ΔCBF corresponded to a drastic decrease in ΔPo2 in another trial (Fig. 9B). These results suggest that variations in tissue Po2 response depend on the response time of CBF increase after the neural activation.
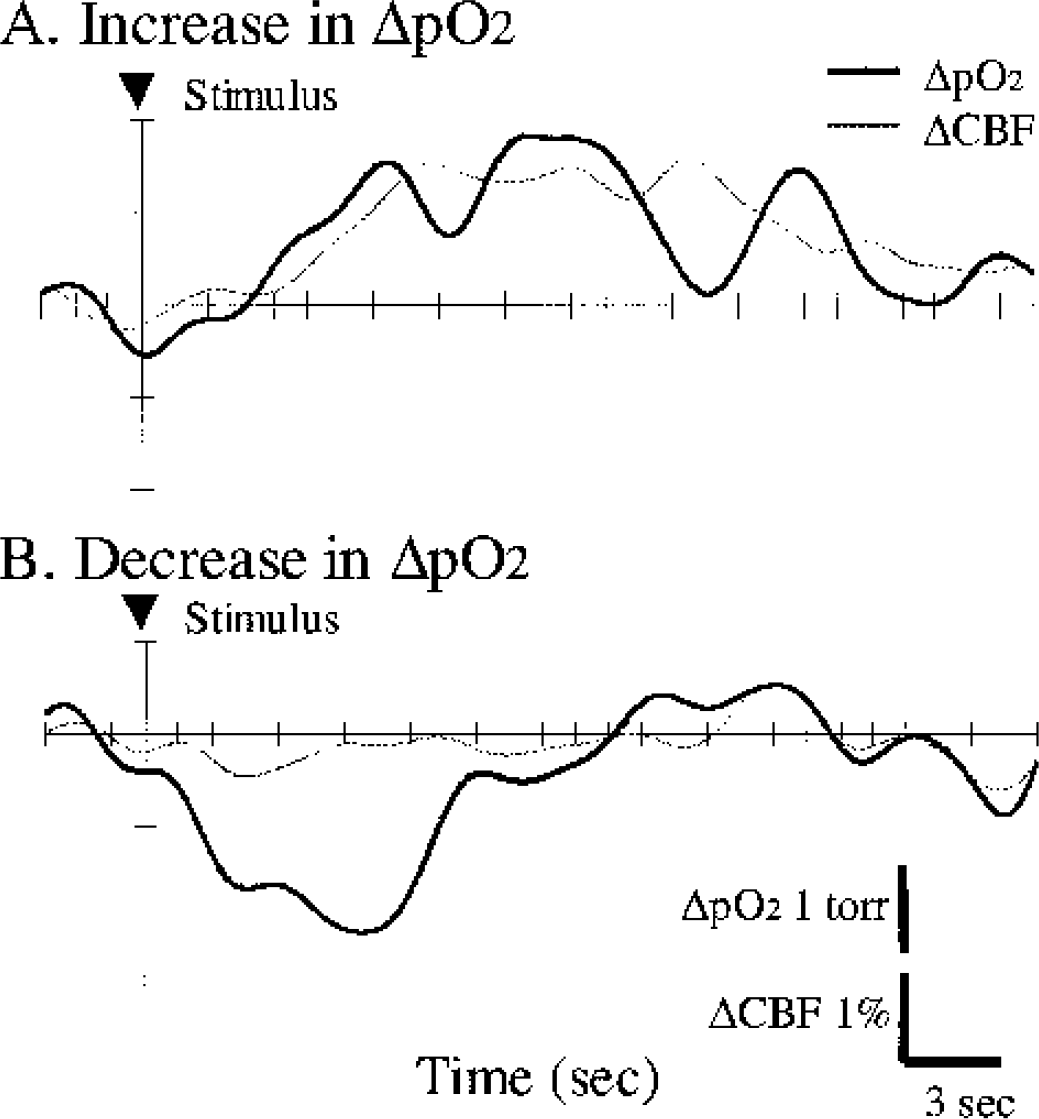
Two typical patterns showing the close relationship between Po2 response (ΔPo2) and CBF response (ΔCBF) in single trials in the fixed location (N = 1 animal). A rapid increase in ΔPo2 (black) corresponds to a considerable increase in ΔCBF (gray)
DISCUSSION
We observed that tissue Po2 response to an acoustic stimulus shows a biphasic change (i.e., initial decrease and second increase) in the activated region of AI (Figs. 3–8). These results support the view that oxygen content in the activated region initially decreases with increasing metabolic demand, and subsequently increases with increasing local CBF after functional brain activation (Vanzetta and Grinvald, 1999; Erecinska and Silver, 2001). In addition, our simultaneous measurements of tissue Po2 and localized neural activity revealed that such biphasic changes in oxygen content are consistently found in cortical layers I to IV of the activated region (Fig. 7) and that magnitude of the biphasic changes is closely related to the induced neural activity (Fig. 8). These results imply that signal intensity of the initial decrease in local oxygen content might be useful to track the induced neural activity for functional brain imaging. However, our results also suggest that a pattern of tissue Po2 response (e.g., decrease or increase) is affected by local variations in CBF responses (Fig. 9).
One possible reason for the discrepancies among the previously reported tissue Po2 responses (Ances et al., 2001; Buerk et al., 1998; LaManna et al., 1989; Leniger-Follert and Lübbers, 1976; Lowry et al., 1997; Metzger, 1979; Silver, 1978) is that the oxygen electrode used in some previous studies might have failed to detect the initial decrease in tissue Po2 because of the low temporal resolution of the electrode. Response time of the polarographic oxygen electrode depends on diameter of the electrode cathode, thickness of membrane that covers the electrode tip, and diffusion coefficient of membrane (Baumgärtl and Lübbers, 1983; Fatt, 1982). Because a tip diameter of the electrode cathode affects the time to develop a constant diffusion field in front of the cathode surface, only small tip electrode can be available to measure a rapid response of tissue Po2 changes. In addition, the response time is quadratically influenced by thickness of the membrane that prevents poisoning effects (i.e., signal drifting due to the biological materials adsorbing onto the electrode surface) and stirring effects (i.e., diffusion error caused by disturbance of oxygen diffusion field). Thin membranes of collodion and polystyrene that we used in the present study have been recognized as a valid performance for the measurement of absolute Po2 values with a high temporal resolution, because the collodion and polystyrene have a high oxygen diffusion coefficient (leading to a short response time) and a small solubility for oxygen (Baumgärtl and Lübbers, 1983).
Although optical recording of neural activity detects electrical activity of all neuronal elements (cell bodies, axons, and dendrites), obtained neural activity might be enough to cause the initial decrease in tissue Po2 because the neural activation occurred in a relatively broad region compared to the Po2 measurement locations (Fig. 8). Estimation of energy usage for a signaling process predicted that an increase in activity of one action potential per neuron per second increases CMRO2 by 1.2 μmol·min−1 ·g−1 tissue (Attwell and Laughlin, 2001). This amount of CMRO2 reaches 22% to 92% of the resting level (1.3–5.4 μmol·min−1·g−1 tissue) (Erecinska and Silver, 2001), indicating that shifts in CMRO2 resulting from changes in cell firing rates are enough to alter the tissue Po2 in the activated region. In addition, our timescale of initial decrease in tissue Po2 corresponds to the calculated timescale of CMRO2 changes after the neural activation (Dunn AK et al., 2003; Mayhew et al., 2001). Also, a theoretical model of oxygen delivery predicted that tissue Po2 initially decreases after neural activation corresponding to increasing CMRO2, depending on capillary flow and oxygen diffusivity in tissue (Zheng et al., 2002).
The subsequent increases in tissue Po2 following the initial decrease are clearly due to the escalation of regional CBF that is coupled to the localized neural activity (Lauritzen, 2001). As for the regulation of regional CBF, its regulatory pattern is likely to modify depending on the induced neural activity, and thus the various patterns of tissue Po2 response appeared in relation to the induced neural activity. Namely, possible effectors of this CBF regulation are radial arteries penetrating the cerebral cortex, precortical arteries, and sphincters at offshoots from larger pial arteries (Mchedlishvili, 1986). These effectors interact with each other depending on metabolic demands of the activated region. In cases of minor demand, precortical artery initiates an increase in local CBF. In contrast, in cases of major demand, sphincters at the larger pial arterioles cause dilation in the minor pial arteries connecting to the larger pial arterioles. Such dilation may generate a large increase in CBF that spreads to ever wider cortical regions, regardless of whether the CBF increase is spatially coupled to the activated site. Namely, in some locations, significant increase in tissue Po2 can be observed despite a lack of an increase in CMRO2, and might “hide” the initial decrease in tissue Po2 due to the considerable increase in local CBF in these wide regions. This type of CBF increase is possibly induced by strong neural activation (e.g., with direct cortical stimulation).
Although we did not observe such a large increase in CBF response spreading to nonactivated regions in the auditory cortex, the observed CBF response varied among the repeated trials in the single location (Fig. 9). These variations in local CBF might be related to the induced short duration of acoustic stimulation, because sustained acoustic stimulation (e.g., 5-second duration) consistently elicited a large increase in CBF (35% increase) without variations among the single trials (data not shown). This finding suggests that the acoustic stimulation used in the present study is a certain level of threshold, thus resulting in a large (or wide) increase in CBF or a small (local) increase in CBF among the trials. Although LDF measurements are limited to measure the relative changes in average CBF within undefined microvascular region beneath the probe, Po2 measurement is responsive to such variations in local CBF response (Fig. 9). This result suggests that the Po2 measurement reflects the oxygen content of microvasculature in the vicinity of the electrode location. In this microvascular region, penetrating arterioles directly connecting the microvasculature also play a key role in regulating local CBF distribution. Interestingly, our results for the biphasic changes in tissue Po2 show a similar temporal pattern with a biphasic response of isolated cerebral penetrating arterioles showing the changes in their diameter (i.e., initial constriction of −5.7% constriction and secondary dilation of 30.4%) in response to locally microapplied extracellular K+ stimulation; Horiuchi et al., 2002), which may generate considerable changes in local CBF (initial decrease and then increase) in the microvascular regions. Further information regarding the geometric pattern of penetrating arterioles and capillary distribution and the spatiotemporal relations in local CBF distribution and tissue Po2 response is needed.
In conclusion, our results for the biphasic changes in tissue Po2 response imply that response of local oxygen content in the activated region is determined by a phase lag between initial shifts in CMRO2 and delayed response of local CBF increase after the neural activation. In particular, a pattern of tissue Po2 response (biphasic or monophasic changes) might depend on the reactivity of local CBF that depends on the induced neural activity. Because the oxygenation changes in hemoglobin are well localized in the activated region (Dunn et al., 2003), and because the magnitude of the biphasic changes in tissue Po2 are closely related to localized neural activity, the biphasic changes in local oxygen content will significantly help establish the signal interpretation by brain-imaging techniques under physiologic functional activation.