
Abstract
Variations in the height of the CBF response to hypotension have been described recently in normal animals. The authors evaluated the effects of nitric oxide synthase (NOS) inhibition on these variations in height using laser Doppler flowmetry in 42 anesthetized (halothane and N2O) male Sprague-Dawley rats prepared with a superfused closed cranial window. In four groups (time control, enantiomer control, NOS inhibition, and reinfusion control) exsanguination to MABPs from 100 to 40 mm Hg was used to produce autoregulatory curves. For each curve the lower limit of autoregulation (the MABP at the first decrease in CBF) was identified; the pattern of autoregulation was classified as “peak” (15% increase in %CBF), “classic” (plateau with a decrease at the lower limit of autoregulation), or “none” (15% decrease in %CBF); and the autoregulatory height as the %CBF at 70 mm Hg (%CBF70) was determined. NOS inhibition decreased %CBF70 in the NOS inhibition group (P = 0.014), in the control (combined time and enantiomer control) group (P = 0.015), and in the reinfusion control group (P = 0.025). NOS inhibition via superfusion depressed the autoregulatory pattern (P = 0.02, McNemar test on changes in autoregulatory pattern) compared with control (P = 0.375). Analysis of covariance showed that changes induced by NOS inhibition in the parameters of autoregulatory height are not related to changes in the lower limit, but are strongly (P < 0.001) related to each other. NOS inhibition depressed the autoregulatory pattern, decreasing the seemingly paradoxical increase in CBF as blood pressure decreases. These results suggest that nitric oxide increases CBF near the lower limit and augments the hypotensive portion of the autoregulatory curve.
Keywords
Cerebral blood flow and blood pressure autoregulation, the relation between CBF and MABP, is usually described with CBF maintaining a plateau, sometimes slightly sloped, between arterial blood pressures of 160 mm Hg to the lower limit of autoregulation, which is defined as the MABP at which CBF starts to decrease, typically 70 mm Hg (Lassen, 1959). Although this classical description of autoregulation is widely accepted (Paulson et al., 1990), we observed wide heterogeneity in the height of the curve as blood pressure decreases near the lower limit (Jones et al., 2002), as shown schematically in Fig. 1C. Because these increases and decreases in CBF during hypotension change the shape of the autoregulatory curve and have been shown to be distinct from variations in the lower limit in the normal rat (Jones et al., 2002), two new terms are introduced to describe this phenomenon of the autoregulatory curve. For the variations of the lower limit of autoregulation along the x-axis of the autoregulatory curve, the term “horizontal autoregulation” is used; for the variations of CBF along the y-axis near the lower limit of autoregulation, the term “vertical autoregulation” is used. These concepts of horizontal and vertical autoregulation and their variations are depicted in Fig. 1.
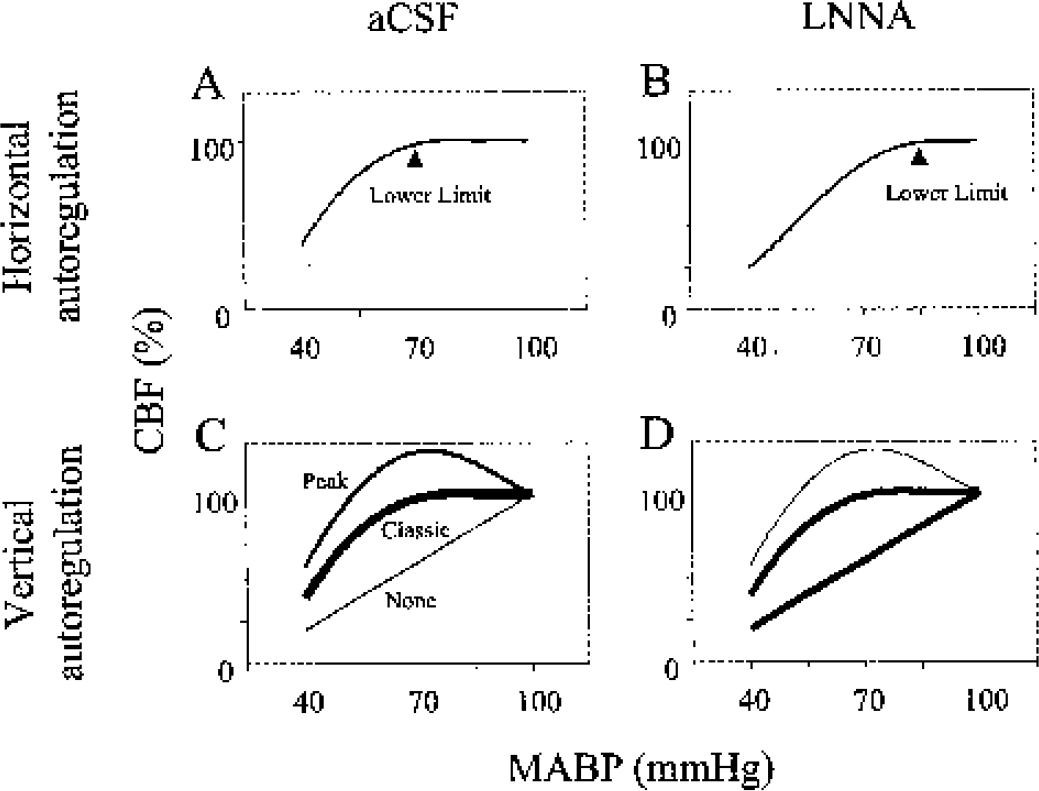
A schematic diagram shows horizontal (
The maintenance of the CBF plateau necessitates a vasoactive process. Nitric oxide is a well-known cerebrovascular vasodilator (Iadecola et al., 1994) and many workers have investigated its role in horizontal autoregulation by assessing changes in the lower limit of autoregulation. Most studies using cortical nitric oxide synthase (NOS) inhibition, highly regional CBF methods (Kobari et al., 1994; Preckel et al., 1996; Tanaka et al., 1993), or both (Jones et al., 1999; Toyoda et al., 1997) support a role of nitric oxide in increasing the lower limit of autoregulation, as shown in Figs. 1A and 1B. Because NOS inhibition increases the lower limit, we propose that nitric oxide mediates the differences in CBF that are responsible for these vertical variations in the height of the autoregulatory curve near the lower limit. Therefore, we investigated whether cortical NOS inhibition decreased the magnitude of the CBF response to hypotension near the lower limit, as depicted schematically in Figs. 1C and 1D.
We also hypothesize that the proposed changes in vertical autoregulation induced by NOS inhibition are not related to those induced in the horizontal autoregulatory parameter, the lower limit. Therefore, we also investigated whether the potential effect of NOS inhibition on vertical autoregulation is related to its previously demonstrated effect on horizontal autoregulation (Jones et al., 1999; Toyoda et al., 1997).
MATERIALS AND METHODS
Methods have been described previously (Jones et al., 1999; Jones et al., 2002), but are repeated for clarity and to document changes in data analysis.
Animal preparation and cranial window
Animal procedures were performed in conformance with the Guide for the Care and Use of Laboratory Animals (Committee to Revise the Guide for the Care and Use of Laboratory Animals, 1996) and were approved by the mandated institutional committee concerned with animal procedures. At the end of the experiment, animals were euthanized with an overdose of halothane.
Installation of cranial window
A 1.5-mm-thick × 10-mm-diameter methylmethacrylate cranial window was implanted, with the dura mater removed, the day before experimental determinations to minimize the effects of possible trauma to the brain surface. Forty-two male Sprague-Dawley rats (376 ± 48 g, std) were prepared the first day under 1–2% halothane and 70% N2O anesthesia (balance O2), administered via endotracheal tube and artificial respiration (Model 681, Harvard Apparatus, South Natick, MA, U.S.A.). Thirty-four animals were used previously in our investigation of the effect of NOS inhibition on the lower limit (Jones et al., 1999) and the first blood withdrawal data from 32 animals were used previously in our investigation describing vertical variations in autoregulation (Jones et al., 2002).
Rectal temperature was maintained at 37°C using a servocontrolled heat lamp (YSI 74, Yellow Springs, OH, U.S.A.). The cranial window was glued over a 8-mm-diameter craniotomy (dura mater removed) as described previously (Jones et al., 1999). The animal was given saline (10 mL/kg, subcutaneously) to prevent postsurgical dehydration and cefazolin sodium (1 mg/kg intramuscularly; Eli Lilly, Indianapolis, IN, U.S.A.) to control possible infection. The scalp was sutured, and the animal was allowed to recover from anesthesia. A suspension of the analgesic acetaminophen (McNeil, Fort Washington, PA, U.S.A.) in water (0.5 mg/mL) was presented as drinking water for the animal overnight.
Animal preparation: second day
The next day the animal was anesthetized using 1–2% halothane and 70% N2O in O2, a tracheotomy was performed, and artificial ventilation was instituted. Femoral arterial and venous catheters were inserted bilaterally. Halothane was reduced to a maintenance level of approximately 0.8% by monitoring the blood pressure response to tail pinch. Gallamine triethiodide (Davis-Geck, Wayne, NJ, U.S.A.) in normal saline was infused intravenously at 10 mg·kg−1·h−1 and the animal was placed in a stereotaxic frame (David Kopf Instruments, Tujunga, CA, U.S.A.).
Arterial blood gases (Paco2, Pao2, and pH) and hemoglobin concentration, [Hb], were determined with a blood gas analyzer (Model ABL3, Radiometer America, Westlake, OH, U.S.A.). Arterial blood pressure was monitored continuously from a femoral artery, and epicortical pressure from the cranial window port, using strain gauge transducers (Model DT-XX, Viggo-spectramed, Oxnard, CA, U.S.A.). The artifical cerebrospinal fluid (aCSF) solution (Morii et al., 1986) was bubbled with 6% CO2, 10% O2, and 84% N2 at 37°C, and pumped at a rate of 0.5 mL/min to the cranial window. It was reheated to 37°C just before entering the cranial window, as confirmed by monitoring the temperature in the cavity under the window with a thermocouple. The height of the outflow catheter was adjusted to provide a cranial window pressure of 10 mm Hg. The Paco2, Pao2, and pH of the aCSF at the inflow catheter were 38 ± 3.1 mm Hg, 122 ± 20 mm Hg, and 7.386 ± 0.029, respectively. Epicortical temperature and pressure from under the cranial window, arterial blood pressure (both mean and pulsatile), end-tidal CO2, and laser Doppler flow were recorded on a polygraph (Model 2600S, Gould, Inc., Cleveland, OH, U.S.A.) and on magnetic tape (VR-100-8EXP, Instrutech, Elmont, NY, U.S.A.). MABP and laser Doppler flow were sampled at 1 Hz either by a specially written computer program or by a data-acquisition system (Codas, Dataq Instruments, Inc., Akron, OH, U.S.A.) and stored on the computer hard drive. The tracings of MABP, end-tidal CO2, and laser Doppler flow were displayed prominently for use in the vascular reactivity testing and hypotension protocol.
Laser Doppler flowmetry
Cerebral blood flow was monitored continuously using laser Doppler flowmetry (LDF) (Stern, 1975). LDF is a reliable, noninvasive method for continuously monitoring changes in CBF, but cannot provide microcirculatory CBF in the units used to measure nutritional flow (mL·min−1·100 g−1) (Dirnagl et al., 1989). The product of the Doppler shift of photons, proportional to red cell velocity, and the amplitude of the shifted signal, proportional to red cell mass, provides a signal proportional to CBF, or tissue flow. These measurements of CBF were obtained with a time constant of 1 second (Model BMP-403A, Vasamedics, St. Paul, MN, U.S.A., 780-nm wavelength, 1.6-mW output power) using a 0.8-mm-diameter LDF probe (Model P-433-2). The probe was positioned just over the cranial window at a relatively avascular area using a micromanipulator attached to the stereotaxic frame. CBF values were expressed as a percentage of the control value (%CBF) corrected for biologic zero obtained after the termination of the experiment when the brain circulation was stopped, as shown in Fig. 2.
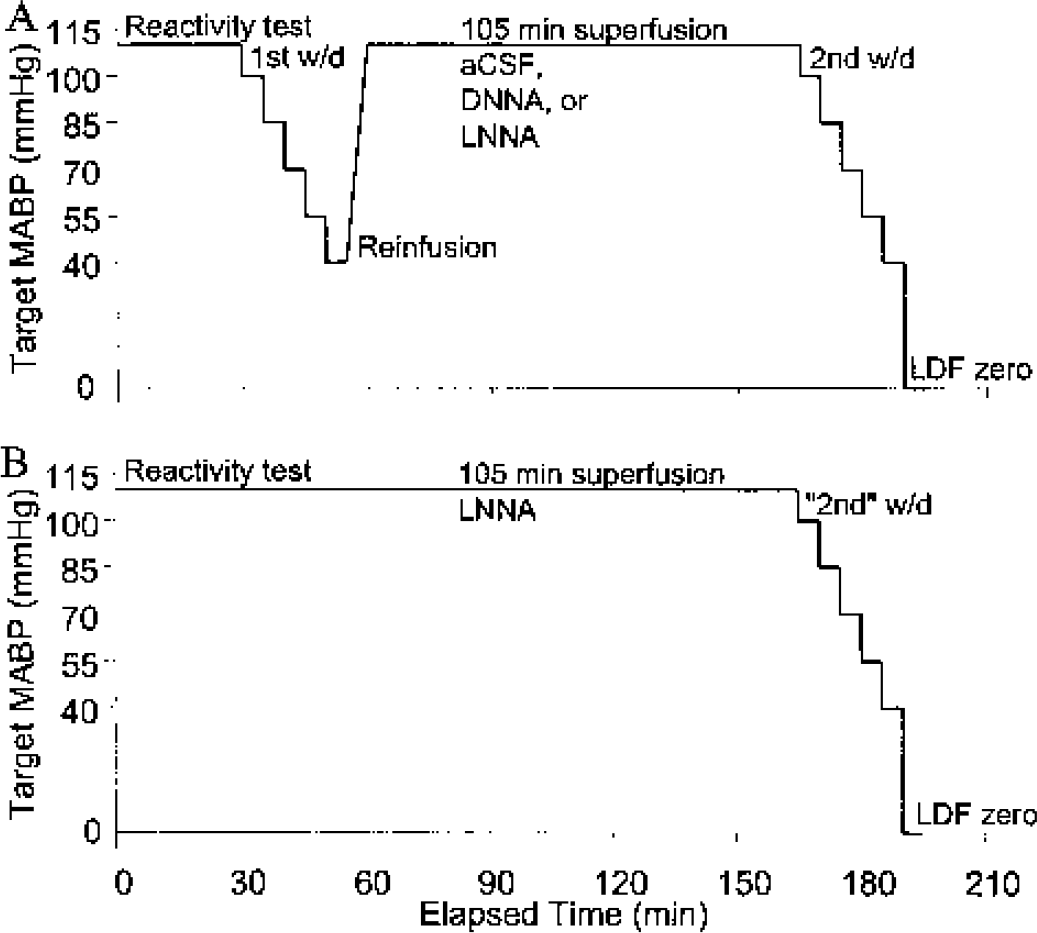
The double-blood-withdrawal protocol is depicted in schematic form, showing the time progression from the initial assessment of vascular reactivity, the sequence of hemorrhagic hypotension to the target MABPs for the first blood withdrawal, reinfusion, the 105-minute period of superfusion of aCSF, DNNA, or LNNA, the second blood withdrawal, and the LDF biologic zero. The single-blood-withdrawal protocol for the SLNNA group is depicted in panel
Vascular reactivity testing
Both the position of the probe and the integrity of the vasculature were tested during the initial control period by monitoring the laser Doppler flow response to brief hypercapnia (Jones et al., 1989) and to either superfused 0.1-mmol/L ADP (in the first 19 animals) or superfused 0.01-mmol/L acetylcholine (in the remaining 23 animals), as described previously (Jones et al., 1999) and as shown in Fig. 2. When the calculated reactivity to CO2 was less than 1% mm Hg−1, or to ADP or acetylcholine less than 10% or 15%, respectively, the animal was excluded from the data set. These reactivity limits for ADP and acetylcholine were arbitrary; for CO2 reactivity, the value of 1% mm Hg−1 was chosen because it is an acceptable value at the low end of the normal range around the mean of 2.5% mm Hg−1 (Jones et al., 1989).
Hemorrhagic hypotension
The double-blood-withdrawal protocol included two incidents of hemorrhagic hypotension separated by a superfusion period of 105 minutes, as shown in Fig. 2A. Blood was withdrawn from the arterial femoral catheter into a heparinized 10-mL syringe until a MABP of 100 mm Hg was reached. This procedure was repeated for arterial pressures of 85, 70, 55, and 40 mm Hg over a 25-minute period. The mean total volume of withdrawn blood was 4.4 ± 1.8 mL. Respirator adjustments, deduced in pilot experiments and guided by end-tidal CO2, were made during the blood withdrawal sequence to minimize the decrease in PaCO2. Blood was then slowly reinfused. Superfusion was continued with the chosen agent (as detailed below) for 105 minutes, followed by another sequence of controlled hemorrhagic hypotension. To establish a blood reinfusion control group, a single-blood-withdrawal protocol using superfusion for 105 minutes followed by a sequence of hemorrhagic hypotension was used (Fig. 2B). A control pre–blood withdrawal MABP value was recorded just before blood was withdrawn to reach the initial target pressure of 100 mm Hg. Blood gases and MABP were determined at the beginning (target MABP, 100 mm Hg) and end (target MABP, 40 mm Hg) of each blood withdrawal.
Experimental groups and measurements
Four experimental groups were used. Three groups were studied with the double-blood-withdrawal protocol, providing two repeated sequences of hemorrhagic hypotension in the same animal (Table 1 and Fig. 2A). For the time control group, the first blood withdrawal was followed by a 105-minute superfusion of aCSF (group CTRL, n = 11). In the NOS inhibition group, the first blood withdrawal under aCSF superfusion was followed by 105 minutes of 1-mmol/L Nw-nitro-L-arginine (LNNA, group LNNA, n = 16) whereas in the enantiomer control group, 1-mmol/L Nw-nitro-D-arginine (group DNNA, n = 5) was used. These 105-minute periods of superfusion were followed by a second blood withdrawal for the second autoregulatory curve. The CTRL and DNNA groups were combined (CTRL&DNNA), as no differences in input variables (arterial blood gases, MABP) or outcome variables (lower limit, autoregulatory pattern, or %CBF70, as defined below) were detected between them. In the reinfusion control group, a 105-minute superfusion with LNNA was followed by a single-blood-withdrawal procedure (Table 1 and Fig. 2B). The purpose of this single-blood-withdrawal group (SLNNA, n = 10) was to control for the effects of blood withdrawal and reinfusion in the double-blood-withdrawal groups (LNNA, DNNA, and CTRL). The single-blood-withdrawal autoregulatory parameters of this SLNNA group were compared with the first blood-withdrawal parameters from the other groups (n = 32).
Group definitions
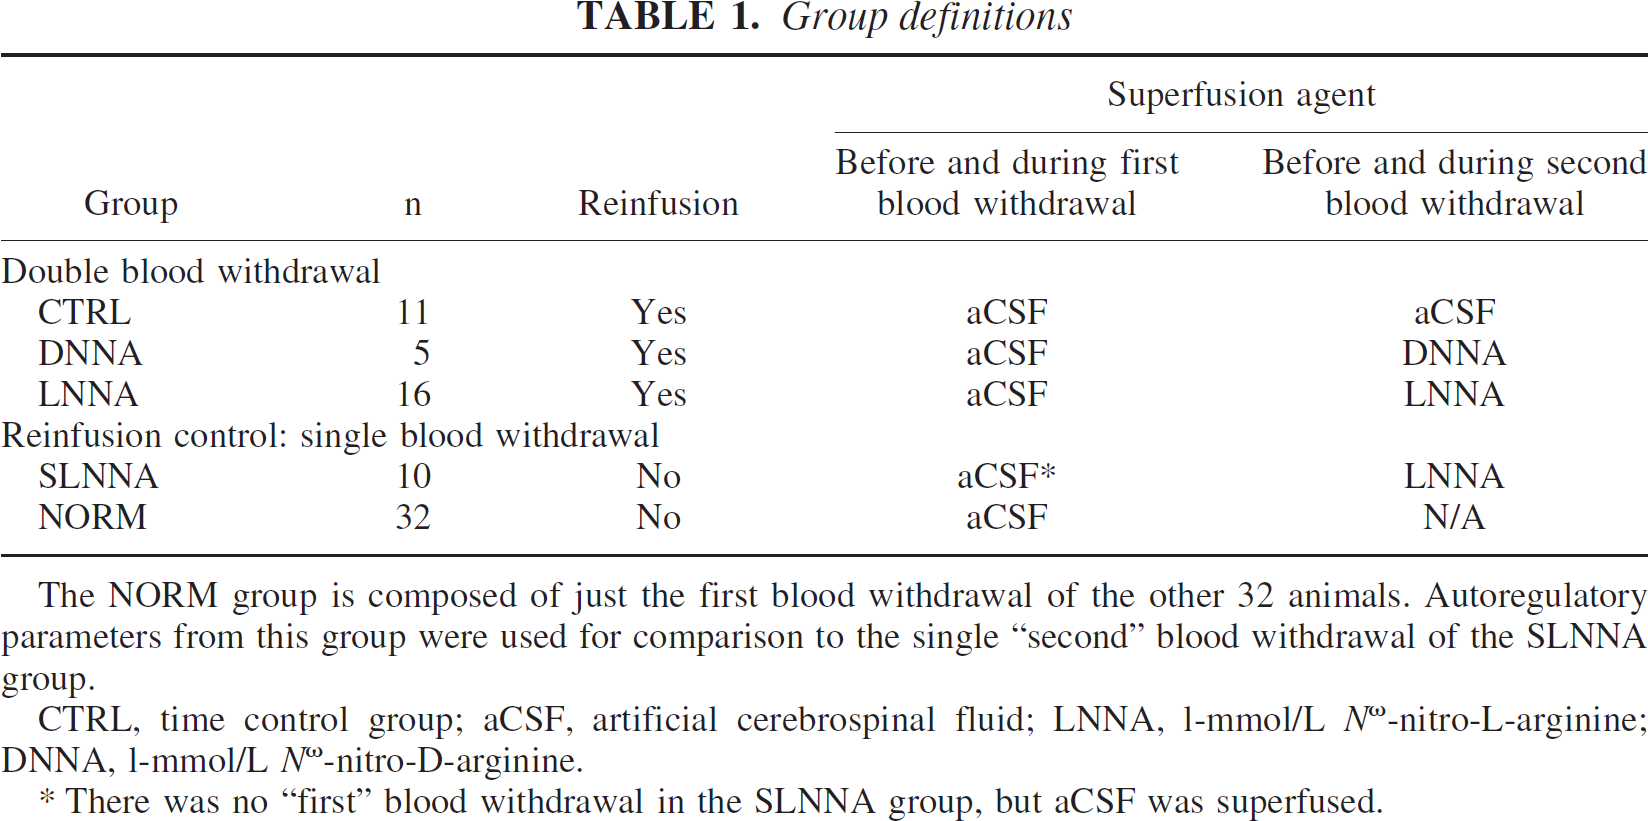
The NORM group is composed of just the first blood withdrawal of the other 32 animals. Autoregulatory parameters from this group were used for comparison to the single “second” blood withdrawal of the SLNNA group.
CTRL, time control group; aCSF, artificial cerebrospinal fluid; LNNA, l-mmol/L Nω-nitro-L-arginine; DNNA, l-mmol/L Nω-nitro-D-arginine.
There was no “first” blood withdrawal in the SLNNA group, but aCSF was superfused.
As a gauge of the level of vessel constriction after reinfusion in the double-blood-withdrawal groups, the CBF (in arbitrary units) at a blood pressure of 100 mm Hg at the beginning of the first blood withdrawal was compared with the CBF at a blood pressure of 100 mm Hg at the beginning of the second blood withdrawal: %CBF2nd = 100 × (CBF second blood withdrawal) / (CBF first blood withdrawal). For the single-blood-withdrawal protocol (group SLNNA), a control CBF measurement at a blood pressure of 100 mm Hg before the LNNA superfusion was compared with the CBF at the beginning of the blood-withdrawal sequence at a blood pressure of 100 mm Hg.
Determination of the pattern of autoregulation and the magnitude of the CBF response
For each blood-withdrawal sequence, five pairs of measurements of mean MABP and %CBF were taken over 128-second epochs during 5-minute periods of stable MABP at each pressure level (Jones et al., 1999). The CBF (in arbitrary units) at an arterial pressure of 100 mm Hg was used as the control (100%) %CBF value.
Two different parameters were used to assess the vertical component of the autoregulatory curve. A full five-point autoregulatory curve was required to evaluate one of these parameters, the autoregulatory pattern. An algorithm consisting of a series of expressions using inequalities and logical operators was constructed to assign the pattern of autoregulation for each individual curve described by the five MABP versus %CBF data pairs. The “peak” pattern was assigned if there was at least a 15% increase in %CBF during the pressure decrease, a “none” pattern if there was a continuous decrease in %CBF of at least 5% in each successive data point with at least a 15% decrease by 70 mm Hg, and a “classic” pattern (CBF plateau followed by a decrease) for the rest. For every autoregulatory curve designated as a “none” pattern, we attempted to find a sixth %CBF-MABP data pair at a higher pressure immediately before the first 100-mm Hg point. When a data pair from a higher pressure did exist, a six-point plot was produced, and the curve was then reassessed in an attempt to define a lower limit and pattern. This procedure to find a sixth data pair was used to minimize the frequency of the none pattern, which does not have a lower limit and therefore could not be used for comparison to the other autoregulatory parameters.
To evaluate the other vertical autoregulatory parameter, two CBF values were required: a control value at 100 mm Hg and another at 70 mm Hg. For each autoregulatory curve, the %CBF at an arterial pressure of 70 mm Hg, %CBF70, was used to characterize the magnitude of the CBF response to hypotension, since the mean lower limit was approximately 70 mm Hg. %CBF70 was calculated as the interpolated value of the linear line segment at a MABP of 70 mm Hg.
Determination of the lower limit
The lower limit, defined as the blood pressure at which CBF starts to decrease, was determined by a previously described procedure (Jones et al., 1999). A separate autoregulatory curve for each animal and blood withdrawal was plotted with a code number but without animal or group identification. Four blinded graders were instructed to choose the lower limit of autoregulation, defined as the arterial pressure just above the fall-off of %CBF. For a “classic” pattern, the lower limit was chosen as the pressure at which the plateau in %CBF starts to decrease and for the “peak” pattern, the pressure at which %CBF starts to decrease from the peak. The average of the lower limits from each grader was used for further analysis. This procedure has been validated (Jones et al., 1999), where the intraclass correlation coefficient was 0.83. This high level of agreement provides evidence that the instructions for estimating the lower limit were clear, easily understood, and produced consistency.
Chemicals
ADP, acetylcholine, and LNNA were obtained from Sigma Chemical Co. (St. Louis, MI, U.S.A). DNNA was obtained from Bachem California (Torrance, CA, U.S.A).
Statistics
Repeated-measures analysis of variance was performed to test for differences over time and between treatment groups in physiologic variables, the lower limit of autoregulation, and values of %CBF70. Linear combinations of treatment means were used to test differences between groups. Changes in autoregulatory pattern were assessed using an exact McNemar test, a paired sample sign test, appropriate to compare paired correlated proportions (Sprent, 1993). The McNemar test is an exact method based on exact binomial probabilities. Analysis of covariance (ANCOVA) was used to assess the relationship between changes in the parameters of autoregulatory height and the lower limit over the first and second blood withdrawals. Bland and Altman (1995) have described this statistical methodology. For the ANCOVA, the autoregulatory patterns were assigned numeric values (peak = 3, classic = 2, and none = 1). Even though the pattern is a nonparametric variable, this assignment is appropriate if we assume that the three patterns are regularly spaced. Because the change in %CBF used to choose the none and peak pattern were both 15%, this is an appropriate assumption. Both the animal and autoregulatory pattern are predictor variables. Values are expressed as mean ± SD. Statistical significance was assumed when P values were less than 0.05. The statistical analyses were performed using the SAS system (SAS Institute, 1989).
RESULTS
Physiologic stability
Table 2 presents the physiologic variables in the groups over time. There were no differences between groups in MABP, pH, Paco2, or [Hb]. However, there were significant differences between groups for Pao2 (P < 0.001), but because all Pao2 values were between 110 and 150 mm Hg, O2 saturation was always greater than 95%. There were differences (P < 0.001) over time for MABP, Pao2, [Hb], and Paco2, but not for pH. The differences in MABP were intentional. Both PaCO2 and [Hb] decreased as MABP was decreased from 100 mm Hg to 40 mm Hg. For instance, mean PaCO2 for the first blood withdrawal was 36 mm Hg at 100 mm Hg and 33 mm Hg at the lower pressure. The maximum of the mean [Hb] difference during imposed hemorrhagic hypotension was 2.5 g/dL. There were no group-by-time interactions based on a repeated measures analysis of variance (for MABP there were no differences between groups when compared at each time point). Thus, these differences in physiologic variables were of a similar pattern in each group and therefore did not influence the autoregulatory curve differently between groups, and were controlled for by the repeated measures experimental design with the time control group CTRL.
Physiologic variables at various experimental stages
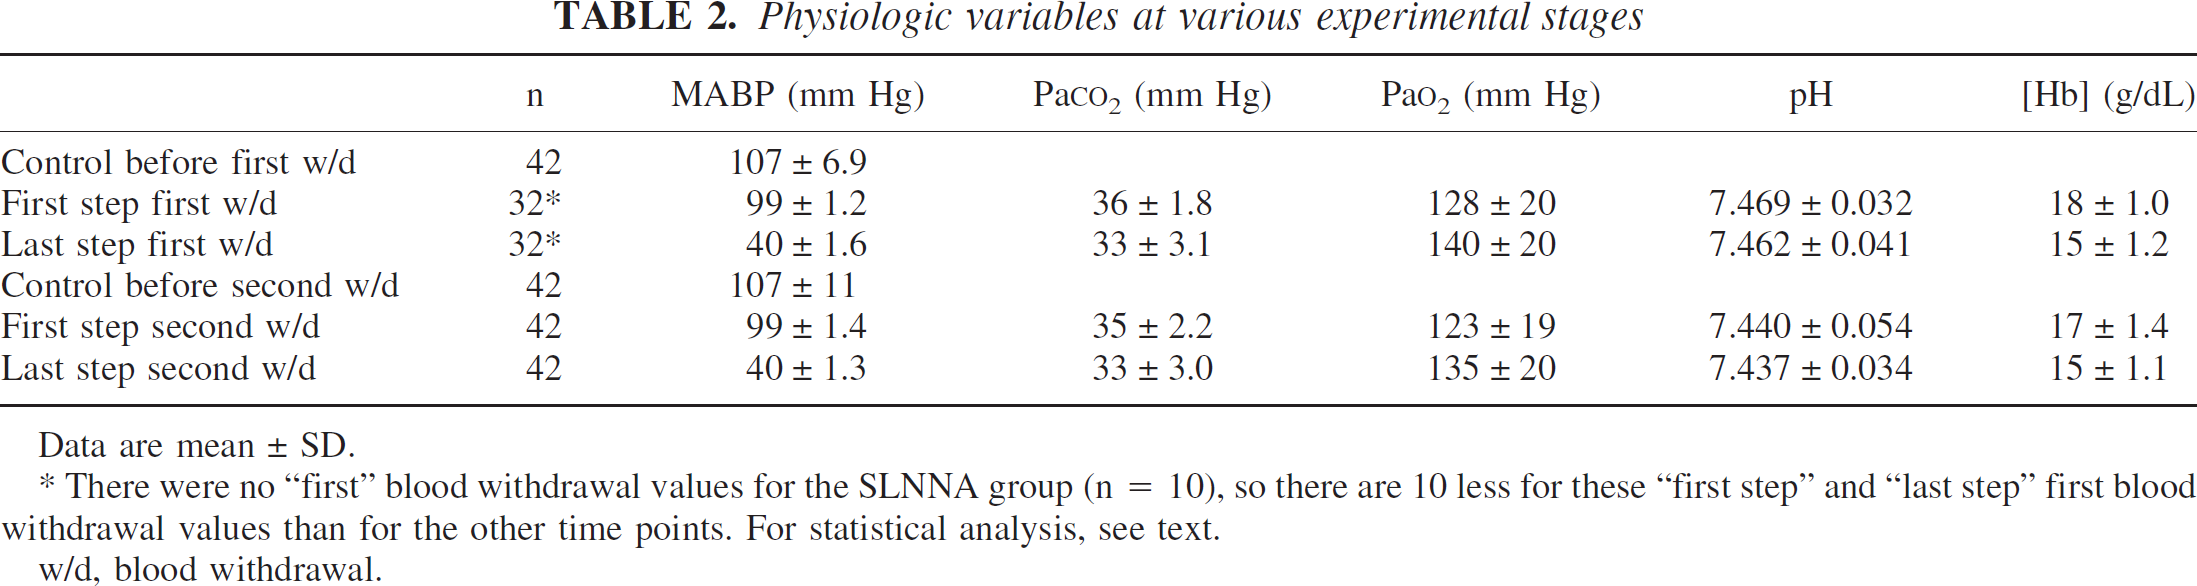
Data are mean ± SD.
There were no “first” blood withdrawal values for the SLNNA group (n = 10), so there are 10 less for these “first step” and “last step” first blood withdrawal values than for the other time points. For statistical analysis, see text. w/d, blood withdrawal.
Effect of NOS inhibition on the vertical component of autoregulation
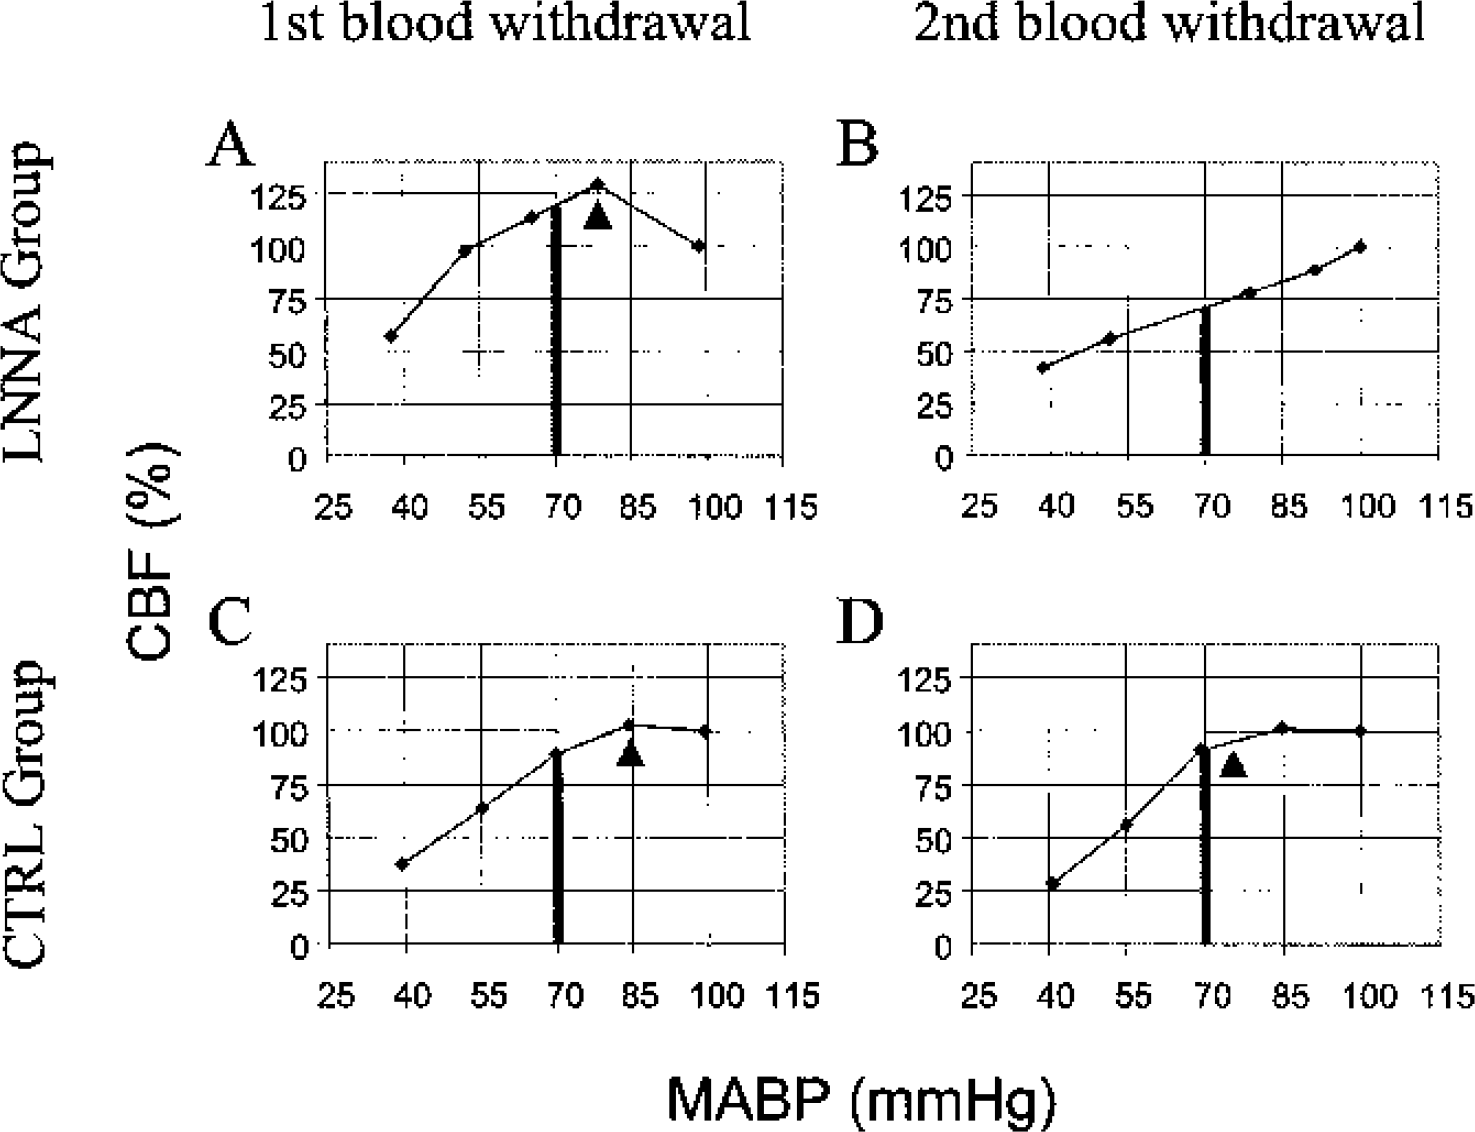
Typical autoregulatory curves from the LNNA and CTRL groups, plotted as linear segments connecting the five pairs of MABP and %CBF. In
In the left and right portions of Table 3, changes in the patterns of autoregulation are compared for the CTRL&DNNA and LNNA groups, respectively. For example, an animal is counted in these three-by-three tables in the cell (First blood withdrawal – Peak, second blood withdrawal – None) if the pattern was “peak” during the first blood withdrawal and, during the second blood withdrawal, the pattern changed to “none.” If no change in pattern between the two blood withdrawals occurred, an animal was counted in one of the cells on the principal diagonal of the three-by-three table (bold). Values above this diagonal are in italics and indicate that the autoregulatory pattern decreased (from peak towards none), and values below the diagonal indicate that the pattern increased. In the LNNA superfusion group, 9 of the 16 animals (3 peak to classic, 2 peak to none, and 4 classic to none) were above the diagonal, indicating their autoregulatory pattern decreased after 105 minutes of LNNA superfusion, while the pattern increased (none to classic) in one animal. The McNemar test of derived difference variables, based on the discordant pairs only, showed that the change in the 9 animals whose patterns decreased were statistically different from the one animal whose pattern increased (P = 0.02). For the combined control group (CTRL&DNNA, n = 16), there was no significant difference between the animals whose pattern decreased (4) and increased (1) (P = 0.375, McNemar test). Thus, NOS inhibition affected the pattern of autoregulation, changing the shape of the CBF response to hypotension, as shown in Figs. 3A and 3B.
Change in pattern of autoregulation after 105 minutes of aCSF or DNNA and LNNA superfusion
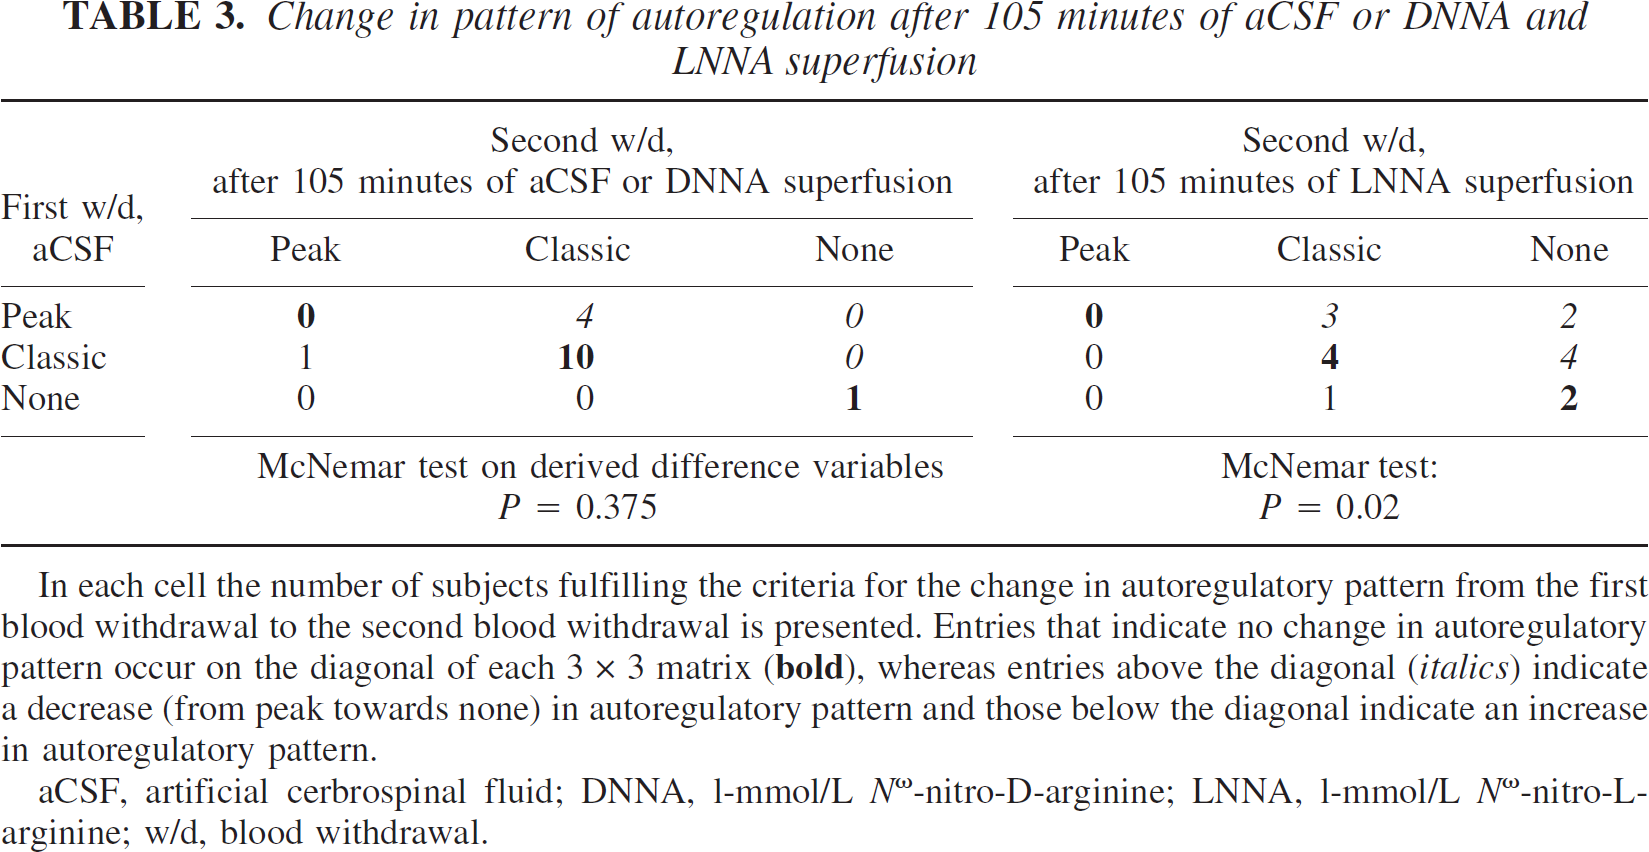
In each cell the number of subjects fulfilling the criteria for the change in autoregulatory pattern from the first blood withdrawal to the second blood withdrawal is presented. Entries that indicate no change in autoregulatory pattern occur on the diagonal of each 3 × 3 matrix (
aCSF, artificial cerbrospinal fluid; DNNA, l-mmol/L Nω-nitro-D-arginine; LNNA, l-mmol/L Nω-nitro-L-arginine; w/d, blood withdrawal.
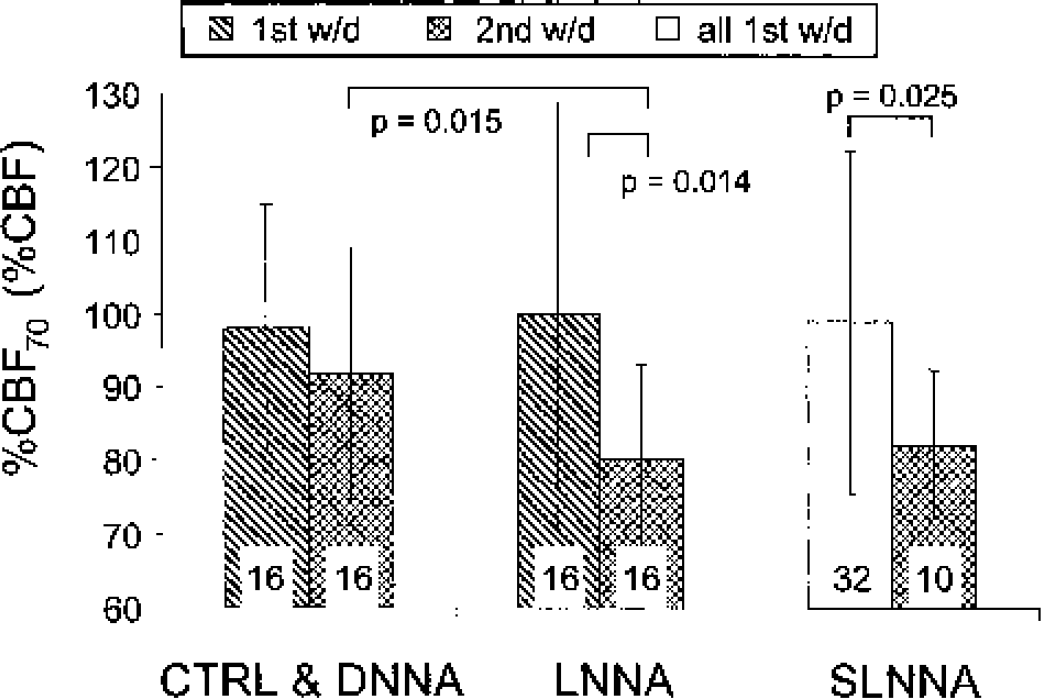
Mean ± SD %CBF values at a mean arterial pressure of 70 mm Hg (%CBF70) for the three groups (CTRL&DNNA, n = 16; LNNA, n = 16; and SLNNA, n = 10) are presented for the first (hatched pattern) and second (crosshatched pattern) blood withdrawals. There were differences between the first and second blood withdrawal %CBF70 for the LNNA group (P = 0.014) and between the time controls, the second-blood-withdrawal control (CTRL&DNNA), and the second-blood-withdrawal treatment (LNNA) groups (P = 0.015). The %CBF70 for single-blood-withdrawal group (SLNNA, n = 10) is decreased compared with the mean %CBF70 of all the first blood withdrawal animals (n = 32, clear pattern, P = 0.025). The number in each group is displayed in the lower portion of the bar. For group definitions see Table 1. 1st w/d, first blood withdrawal; 2nd w/d, second blood withdrawal.
Changes in parameters of vertical autoregulation, %CBF70, and autoregulatory pattern versus changes in the lower limit
Using ANCOVA, we compared the changes in %CBF70 and autoregulatory pattern from the autoregulatory curves of the first to the second blood withdrawal to the changes in the lower limit. The individual data pairs and their means are plotted in Fig. 5, in which a significant slope and correlation coefficient indicates that the compared parameters are related, whereas a lack of significance indicates that they are not related. In the CTRL&DNNA group, there is no relation between the parameters of autoregulatory height (Fig. 5A) and pattern (Fig. 5C) and the lower limit. In the LNNA group, decreases in %CBF70 (slope ± SE = −0.40 ± 0.21, Fig. 5B) and autoregulatory pattern (slope = −20.7 ± 14, Fig. 5D) after NOS inhibition are echoed by increases in the lower limit, but these changes are not significant (P = 0.10 and P = 0.19, respectively). However, changes of the parameters of autoregulatory height, %CBF70, and autoregulatory pattern are highly correlated with each other, both for the control group, CTRL&DNNA (P < 0.001, Fig. 5E), and after administration of LNNA (P < 0.001, Fig. 5F). Thus, changes in vertical autoregulatory parameters induced by NOS inhibition were not related to changes in the horizontal autoregulatory parameter, the lower limit, but are strongly related to each other.
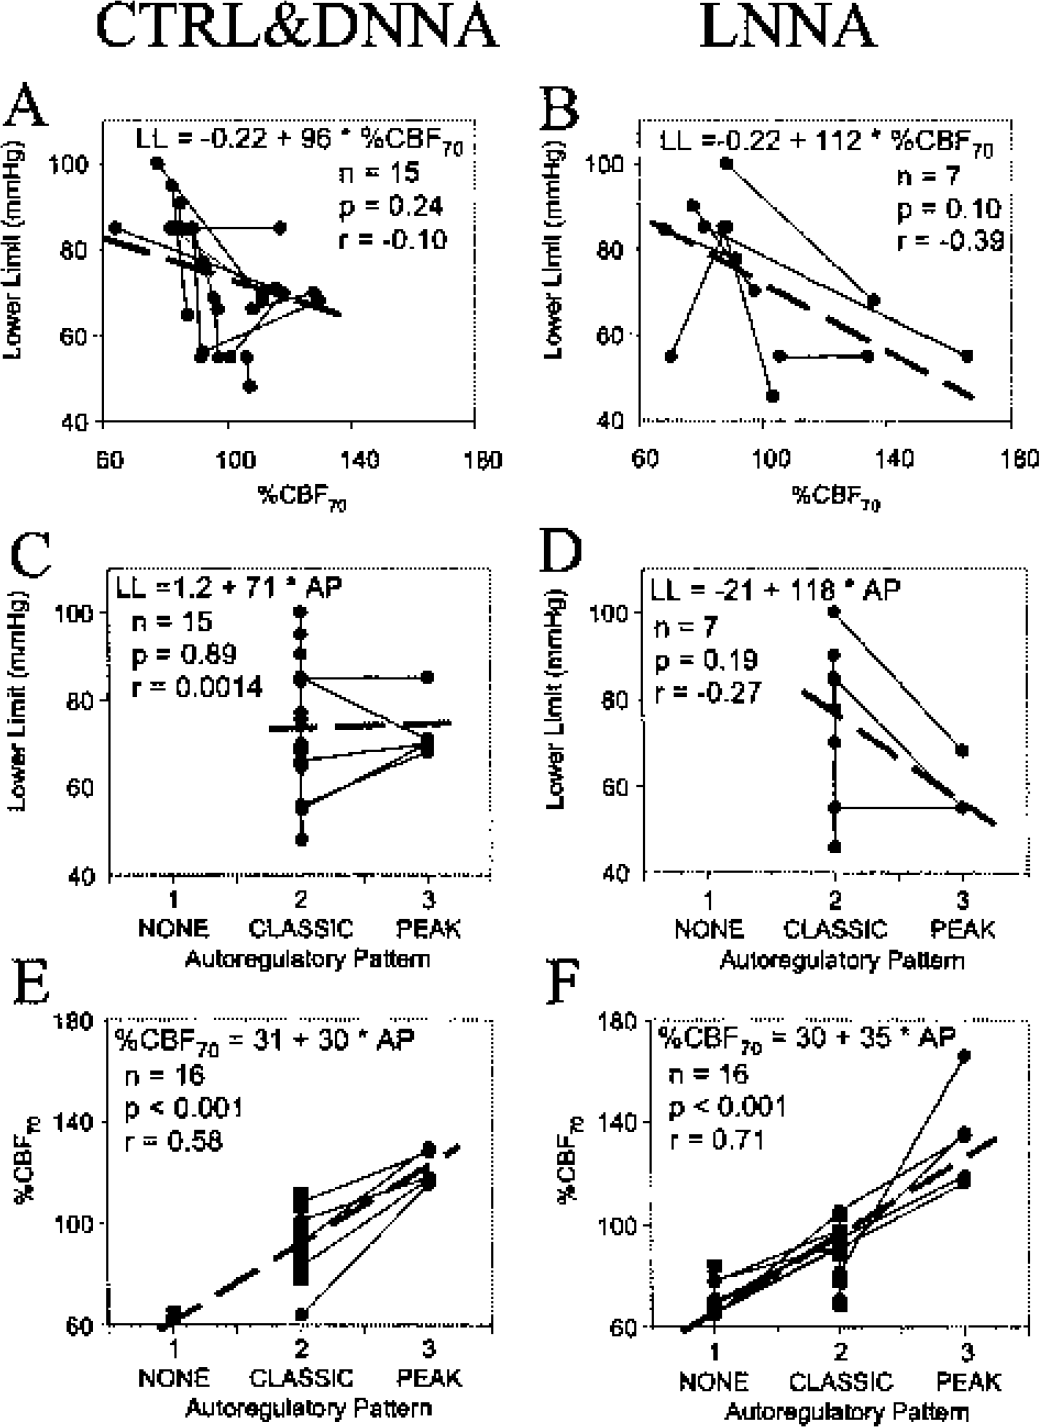
The relationships between changes in parameters of autoregulatory height to changes in the lower limit are depicted in panels
Changes in CBF: reinfusion and NOS inhibition
The changes in CBF from the beginning of the first blood withdrawal to the beginning of the second blood withdrawal, %CBF2nd, were 145 ± 44 of control (n = 16, P = 0.009 from control) in the combined 105-minute aCSF (CTRL) and DNNA groups. After 105 minutes of LNNA superfusion, %CBF2nd was not different from the control value of 100% at the beginning of the first blood withdrawal in both the LNNA (101 ± 39%, n = 16) and SLNNA (132 ± 67%, n = 10) groups.
DISCUSSION
Nitric oxide synthase inhibition decreased the magnitude of the vertical autoregulatory response to hypotension. NOS inhibition produced two related effects on CBF at blood pressures near the lower limit: (1) decreases in the pattern of the autoregulatory response (from peak to classic to none); and (2) decreases in the autoregulatory height, %CBF70. In addition, these effects of NOS inhibition on vertical autoregulation were not associated with changes in horizontal autoregulation (the lower limit). Although the autoregulatory pattern (peak, classic, none) may be more immediately understandable and presentable, %CBF70, as a continuous variable, gave a more rational and numerical basis for the conclusions. In addition, no effect was noted using the enantiomer of LNNA, DNNA, a finding that suggested that enzyme inhibition did occur, or at least that an enzyme specific effect was occurring. Our finding that NOS inhibition depressed the pattern of autoregulation and decreased %CBF70 adds support to the notion that nitric oxide acts to maintain CBF during mild hypotension in addition to its effect on horizontal autoregulation shown previously (Jones et al., 1999; Toyoda et al., 1997).
This role of nitric oxide points to a metabolic, as opposed to myogenic, mechanism (Halpern and Osol, 1985; Johnson, 1986) for this vertical aspect of autoregulation. The flow-dependent release of nitric oxide, which supplements the myogenic response near the lower limit, was presented as a speculative mechanism in our previous work on the lower limit of autoregulation (Jones et al., 1999), and could well be responsible for the variations in autoregulatory height reported here.
Quantifying horizontal and vertical autoregulation
Variability and heterogeneity of the autoregulatory curve have hampered and complicated its experimental investigation. This variability is based on the interaction of the established metabolic and myogenic mechanisms with systemic, central, and local factors, including changing vasoactive mechanisms as the vascular tree branches into smaller diameter vessels. The hypotensive portion of the autoregulatory curve represents a complex mixture of these factors, which have never been described analytically. The lower limit, vascular resistance, and autoregulatory gain have served as quantifiable indices in this hypotensive portion of the curve. We chose the lower limit as the analysis parameter for horizontal autoregulation because it can be clearly evaluated from a five-point curve using our grading system. Both vascular resistance, a derived parameter calculated from measured parameters, and autoregulatory gain, usually represented as the slope of a limited portion of the curve, have serious limitations and disadvantages for our purposes.
For the evaluation of vertical autoregulation, we used two measures of autoregulatory height, %CBF70 and autoregulatory pattern (Jones et al., 2002). Even though these parameters have just been introduced for the evaluation of autoregulation, the data presented in Figs. 5A to 5D showing their lack of correlation with the lower limit support their use to distinguish vertical from horizontal autoregulation. The strong correlation of these parameters of vertical autoregulation in Figs. 5E and 5F clearly support their similarity for evaluating the effect of NOS inhibition on autoregulatory height, %CBF70, and pattern, as presented individually in Fig. 4 and Table 3.
Location and isoform of nitric oxide
The two constitutive isoforms of NOS, neuronal and endothelial, which are inhibited by cortical LNNA superfusion, could be located in perivascular nerves, astrocytes, neurons, or endothelium (Iadecola et al., 1994). Either isoform or location could account for our observations of depressed autoregulatory height using LNNA as the nonselective NOS inhibitor. Toyoda et al. (1997) reported that 7-NI, a specific nNOS inhibitor, was ineffective in changing autoregulation in comparison to LNNA, and 7-NI was shown not to increase the lower limit (Jones and Radinsky, 1998). Both of these studies suggest that the responsible isoform is eNOS. An endothelial location of NOS is also supported by the reports that nNOS knockout mice show no change in “autoregulation” (Huang et al., 1994) and that CBF is depressed at arterial pressures near the lower limit in eNOS-knockout compared with wild-type mice (Huang et al., 1996). These knockout studies do not provide a definitive location because developmental and compensatory changes can occur in the knockouts that would not occur in the wild type (Meng et al., 1996).
Effect of LNNA superfusion on CBF and vessel tone
Even though we used cortical superfusion to produce local NOS inhibition to eliminate the systemic hypertensive effects, we were initially concerned that the local vasoconstrictive effect of NOS inhibition, which usually causes a reduction in CBF, would affect our results. In contrast to the changes in %CBF70 and autoregulatory pattern caused by NOS inhibition, cortical superfusion for 105 minutes with 1-mmol/L LNNA did not change CBF in either the LNNA or SLNNA groups. NOS inhibition is usually associated with slight decreases in cortical flow; flow decreased to 71% with topical 1-mmol/L LNNA (Dirnagl et al., 1993). However, many of the studies that show CBF depression after NOS inhibition use intravenously administered NOS inhibition. For instance, Fabricius et al. in two studies (1994, 1996) showed that 45 minutes of topical 1-mmol/L NOS did not decrease CBF, but that intravenously administered NOS inhibition did depress CBF. This result supports our results in which topically administered NOS inhibition did not depress CBF. In addition, other investigators have noted no changes in pial artery diameter (Pelligrino et al., 1995) with topical application of NOS inhibitor. We suspect that different results from different studies might be caused by different experimental conditions including the type of anesthesia and timing factors.
We were also concerned that the often-observed decreases in CBF with NOS inhibition would affect our results through the mechanism of increased cerebrovascular tone. Although a direct measure of vessel constriction is not possible using only CBF and MABP, our measurement of %CBF2nd (comparing the %CBF at the beginning of the first blood withdrawal with %CBF at the beginning of the second blood withdrawal) allowed an indirect comparison of vessel tone, because both measurements were made at 100 mm Hg. %CBF2nd did not change significantly in the LNNA and SLNNA groups, indicating that the estimated tone was equivalent before and after NOS inhibition. In the combined group, CTRL&DNNA, an increase in %CBF2nd was observed, presumably due to the effects of blood reinfusion after the first blood withdrawal. Fitch et al. (1975) observed a similar increase of approximately 166% in CBF after reinfusion under similar conditions in the baboon. Hemorrhage (and reinfusion) can affect vessel tone due to sympathetic activation (Hamar et al., 1979). We maintain that the observed changes in autoregulatory height and pattern were independent of these changes in CBF because in the combined group, CTRL&DNNA, the increased CBF after reinfusion at the equivalent MABP of 100 mm Hg would suggest vasodilation and decreased autoregulatory height, whereas we observed no change in these groups; and because in groups LNNA and SLNNA, there was no change in CBF at equivalent MABP, suggesting equivalent tone, but we observed decreases in autoregulatory height. Thus, our initial concern that the constrictive effect of NOS inhibition would modify our results was not substantiated, because the observed changes were different than those predicted based on this concern.
In addition, the comparison of the experimental, time control, and reinfusion control groups alleviated this concern on the effect of vessel constriction. The experimental (LNNA) and control (CTRL) groups had similar blood withdrawal and reinfusion schedules. The reinfusion control group (SLNNA) had only a single blood withdrawal. Because the comparisons between these groups sustained our hypothesis, we claim that the differential degrees of sympathetic activation did not affect our results. Thus, the effect of sympathetic activation and vessel constriction is controlled for by our experimental design using experimental, time control, and reinfusion control groups.
It is possible that the demonstrated increase in CBF following reinfusion in the CTRL group was mediated by nitric oxide via an unknown mechanism, was abolished by NOS inhibition in the LNNA group, and that the lack of flow depression in the SLNNA group without reinfusion was a characteristic of this preparation. These considerations correspond to the results of others who did not observe a depression of flow (Fabricius and Lauritzen, 1994; Fabricius et al., 1996) or pial artery diameter (Pelligrino et al., 1995) with cortical NOS inhibition.
Effect of hemorrhagic hypotension on physiologic variables
Although both PaCO2 and [Hb] were decreased as a result of hemorrhagic hypotension, these changes occurred equally in all groups, as evidenced by the lack of group-by-time interactions in the ANOVA. The changes in PaCO2, from 36 to 33 mm Hg from the start of the decrease in MABP at 100 mm Hg to the final MABP of 40 mm Hg, would decrease CBF at 40 mm Hg by approximately 10% using the normal PaCO2 reactivity of 2.5% mm Hg−1 (Jones et al., 1989), although this is a maximal estimate because PaCO2 reactivity is depressed at low arterial pressures (Harper and Glass, 1965). Thus, the magnitude of the estimated depression in CBF by this decrease in PaCO2 was of little significance for our conclusions.
The maximum difference in [Hb] was 2.5 g/dL from the beginning to the end of the sequence of hemorrhagic hypotension. An estimate based on the hematocrit versus CBF data in halothane anesthetized rats under conditions similar to ours (Todd et al., 1992) shows that CBF would be increased by a factor of 1.3, but this increase would occur equally in all groups. Thus, it seems unlikely that this decrease in [Hb] could explain intergroup differences in autoregulatory pattern and %CBF70.
Changes from NOS inhibition in the autoregulatory height are different from changes in the lower limit
Our previous study documented an increase in the lower limit with NOS inhibition (Fig. 2 in Jones et al., 1999), whereas in the present study we document a depression in autoregulatory height, as shown in Fig. 4. The results shown in Fig. 4 bear a striking resemblance to those of Fig. 2 from the previous work; LNNA increased the lower limit in the previous study and decreased %CBF70 in the present study. Because of this similarity, we suspected that changes in the lower limit and autoregulatory height induced by NOS inhibition were inversely related. To investigate this possibility, we used ANCOVA to compare the changes in %CBF70 and autoregulatory pattern to the changes in the lower limit from the autoregulatory curves of the first to the second blood withdrawals, as shown in Fig. 5. From visual observation, it appeared that in the LNNA group, decreases in %CBF70 (Fig. 5B) and autoregulatory pattern (Fig. 5D) were echoed by increases in the lower limit, but these changes were not significant (P = 0.10 and P = 0.19). Our sample size of seven achieved a low statistical power of less than 50% to detect a correlation coefficient of −0.4 as different from zero. A power analysis suggests that a sample size of 60 would be required to show significance for the existing relationship between changes in the lower limit and %CBF70 with a power of 90%. Because LNNA superfusion increased the frequency of the none pattern (which lacks a lower limit and therefore could not be used for this proposed analysis) to approximately 50%, double the number of animals (60/0.5 = 120) would be needed. Therefore, it was reasonable to conclude that if an inverse relationship between changes in the lower limit and %CBF70 existed, then it was an extremely weak relationship that would be virtually impossible to establish. In the CTRL&DNNA group, there was no obvious relationship between the parameters of autoregulatory height (Fig. 5A) and pattern (Fig. 5C) and the lower limit. Thus, changes in vertical and horizontal autoregulation both during the control protocols and during NOS inhibition were not related. This lack of relation over time was similar to the lack of correspondence between vertical and horizontal autoregulatory parameters demonstrated in normal animals (Jones et al., 2002). These results suggest that the concept of shape and height of the autoregulatory curve near the lower limit, which we have described as vertical autoregulation, are distinct and different from the lower limit, and that one does not substitute for the other. It is possible that if an autoregulatory curve was used that extended to a pressure higher than 100 mm Hg, that such a relation between vertical and horizontal autoregulatory parameters might be easier to establish, even though this higher arterial pressure might introduce other variations. In contrast to the lack of correlation between changes in the vertical and horizontal autoregulatory parameters, changes in the parameters of autoregulatory height were highly correlated with each other, both for the control group (P < 0.001, Fig. 5E) and after administration of LNNA (P < 0.001, Fig. 5F).
Relevance of differentiation between vertical and horizontal autoregulation
There are at least two issues that make the differences between vertical and horizontal autoregulation and the effect of NOS inhibition relevant. L-arginine has been shown to increase CBF and reduce infarct volume in a series of experimental focal ischemia studies (Dalkara et al., 1994; Morikawa et al., 1992a; Morikawa et al., 1992b; Morikawa et al., 1994). We surmise that L-arginine increased %CBF70 in these studies. One potential explanation is that L-arginine, as a substrate for eNOS derived NO, increased the autoregulatory height during the first hours after arterial occlusion. For peak and classic curves with the same lower limit, the one with a higher %CBF70 will have a higher flow at the same level of hypotension. Thus the higher frequency of occurrence of the peak autoregulatory pattern could be the reason that L-arginine has a positive effect on stroke damage in experimental focal ischemia. L-arginine has also been shown to increase basal CBF (Micieli et al., 1997; Reutens et al., 1997).
Also relevant is the potential for adding a unique characteristic to the autoregulatory curve in addition to the slope of the plateau, the autoregulatory index using two data pairs, or the lower limit. The parameter of autoregulatory height, %CBF70, different from the lower limit, adds an additional layer of understanding to the “textbook” description of the autoregulatory regulation, which has potentially important ramifications.
In conclusion, our results indicate that NOS inhibition changes the height and pattern of the autoregulatory curve and suggest a role for nitric oxide in augmenting CBF to increase the height of the autoregulatory curve during moderate hypotension. Furthermore, these changes in vertical autoregulation induced by NOS inhibition are not related to changes in horizontal autoregulation as represented by the lower limit.
Footnotes
Acknowledgments:
The authors thank Kevin Kelly, MD, and Rita Conn for helpful discussions.