
Abstract
Lactate derived from glucose can serve as an energy source in the brain. However, it is not certain how much lactate, directly taken from the blood circulation, may replace glucose as an energy source. This study aimed to estimate the uptake, release, and utilization of lactate entering the brain from the blood circulation. The change in cerebral venous-arterial glucose and lactate differences after lactate infusions in the anesthetized rat were measured. Ultrafiltration probes were placed in the aorta and in the jugular vein, and connected to a flow injection analysis system with biosensors for glucose and lactate. Measurements were taken every minute. Lactate efflux was observed at baseline, whereas an influx of lactate was seen during lactate infusion. Immediately after the infusion there was a net efflux of lactate from the brain. The results suggest that the majority of lactate moving into the brain is not used as an energy substrate, and that lactate does not replace glucose as an energy source. Instead, the authors propose the concept of a lactate pool in the brain that can be filled and emptied in accordance with the blood lactate concentration, but which is not used as an energy supply for cerebral metabolism.
It is generally accepted that blood glucose is the major energy substrate of the brain. Only in extreme circumstances do other fuel sources become alternative metabolic energy substrates; for example, ketone bodies in fasting (Hasselbalch et al., 1994, 1996; Owen et al., 1967) or lactate in hypoglycemia and brain injury (Chen et al., 2000a; Maran et al., 1994, 2000). Both substances enter the brain via the monocarboxylate transporter (Halestrap and Price, 1999). Inside the brain, lactate derived from glucose may serve as an additional energy substrate. According to the glucose-lactate shuttle hypothesis (Pellerin et al., 1998), glucose is taken up by astrocytes, where it is converted to lactate and used as an energy substrate by neurons.
It is not clear whether lactate directly taken up from the blood can serve as an alternative energy substrate under normoglycemic conditions. Although the blood–brain barrier is readily permeable to lactate (Knudsen et al., 1991; Oldendorf, 1971) and lactate transfer across the blood–brain barrier can be significant (Lear and Kasliwal, 1991), there is no (Inao et al., 1988; Ide et al., 2000) or a small net flux of lactate (Cruz et al., 1999; Frerichs et al., 1990; Leegsma-Vogt et al., 2001; Madsen et al., 1998; Wahren et al., 1999) under normal resting circumstances, suggesting little cerebral lactate metabolism. Under conditions with an elevated blood lactate level, caused by lactate infusion (Dager et al., 1997; LaManna et al., 1993) or exercise (Ide et al., 1999, 2000), an influx of lactate has been reported, (LaManna et al., 1993; Madsen et al., 1998; Ide et al., 2000) which may indicate that blood-derived lactate is used as a cerebral energy substrate mainly during conditions of increased blood lactate concentration. Studies using radiolabeled lactate infusions have found lactate metabolism in awake mice (Hassel and Bråthe, 2000) and the anesthetized rat (Bouzier et al., 2000). Bouzier et al (2000) and Hassel and Bråthe (2000) showed substantial lactate metabolism during high blood lactate levels. Using intravenously injected [3-13C]lactate, the cerebral uptake and metabolism of [3-13C]lactate was 50% that of [1-13C]glucose (Hassel and Bråthe, 2000), and can contribute up to 35% to cerebral metabolism (Bouzier et al., 2000). Both studies found lactate is almost exclusively metabolized by neurons and hardly at all by glia. If the lactate metabolized by the brain is indeed used as a substitute for glucose metabolism, or as an extra energy source, is not clear.
In the present study, we investigated the change in brain lactate and glucose flux during and after lactate infusions in the rat by monitoring venous-arterial (VA) differences over the brain. We studied the concentration-dependency of the cerebral lactate uptake mechanism, the possibility of lactate metabolism by the brain, and if so, if lactate is used to substitute glucose consumption. Glucose and lactate were measured using intravenous ultrafiltration probes and flow injection analysis (FIA) with biosensors for glucose and lactate. Our approach allows the measurement of glucose and lactate in the aorta and jugular vein simultaneously and every minute, so any change in substrate utilization can be determined nearly on-line (Leegsma-Vogt et al., 2001). The results of the present study suggest little net lactate consumption by the anesthetized rat brain.
MATERIALS AND METHODS
Animals and surgery
Seven adult male Wistar rats (Harlan, Zeist, The Netherlands) were separately housed in a 12/12-hour light/dark cycle. The local animal experiments committee (DEC, Groningen, the Netherlands) approved the experiments. Rats were fasted approximately 20 hours before surgery, which was performed on the day of the experiment. Rats were anesthetized with 30% O2, 70% N2O combined with halothane (Fluothane, Zeneca, Ridderkerk, The Netherlands), and anesthesia was maintained throughout the experiment. The rat was tracheotomized (14-G Insyte intravenous catheter, 2.1 × 45 mm, Becton Dickinson, Sandy, UT, U.S.A.) for mechanical ventilation (MK2 infant ventilator, Hoek Loos, Loosco, Amsterdam). For heparin administration and lactate infusion, a needle (0.6 × 25 mm, 23 G × 1 inch, Braun, Melsungen, Germany) with the conus removed was placed in the tail vein and connected via fine-bore polyethylene tubing (0.28-mm inner diameter, 0.61-mm outer diameter) of about 40 cm to a syringe filled with saline.
Venous-arterial differences were measured by placing one ultrafiltration probe (see below) in the aorta and another in the right jugular vein near the bifurcation with the external jugular vein. The aorta was chosen primarily because of its relatively large diameter. We assumed that the concentration of glucose and lactate in the aorta was equal to the concentration entering the brain via the carotid artery. The jugular vein is the main effluent vein of the brain, easily accessible, and large enough for probe placement. Although the jugular vein also carries blood from the head and front paw, contribution in the blood glucose and lactate levels should be minimal in the anesthetized animal. To minimize blood-flow disturbances, we placed the probes in the direction of the blood flow. In previous experiments, the potential of the two-probe system for the measurement of brain arteriovenous measurements was demonstrated (Leegsma-Vogt et al., 2001). After probe placement, the blood vessel was sealed with cyano-acrylic glue (Ruplo, Ten Boer, The Netherlands). The left jugular vein was ligated to force a higher blood flow through the probed vein. The rats were heparinized through the tail vein after the insertion of the aorta probe (50-IU/mL saline, Leo Pharma B.V., Weesp, The Netherlands).
In four animals, a cannula (5-mm-long fine-bore polyethylene tubing, 0.28-mm inner diameter and 0.61-mm outer diameter, connected to 10-cm-long silicon tubing, 0.5-mm inner diameter and 1-mm outer diameter) was placed in the femoral artery and connected via a blunted needle (0.6 × 25 mm, 23 G × 1 inch, Braun) to a syringe for blood withdrawal. Four times during the experiment, approximately 150 μL blood was taken for the measurement of blood pH, partial pressure of oxygen and carbon dioxide (Po2, Pco2), oxygen saturation, and base excess, all measured at once with a portable clinical analyzer (I-STAT, cartridge type G3+, Abbott, Wiesbaden-Delkenheim, Germany). The blood gas values were monitored during baseline situations, immediately after the lactate infusion, and at the end of the experiment. In three rats two baseline measurements were taken, and in one rat an extra measurement was taken after the lactate infusion. The average pH and blood gas values were calculated. After surgery, the animal was transferred and connected to an FIA apparatus.
Ultrafiltration probe, flow injection analysis system, and biosensors
The ultrafiltration probe, the FIA system, and the biosensors used in these experiments are essentially the same as those described by Leegsma-Vogt et al. (2001). In short, the probe consists of a filtration membrane (acrylonitrile-sodium methallyl sulfonate copolymer, Filtral 16; Hospal Ind., Meyzieu, France, 290 -μm outer diameter and, 240-μm inner diameter, 20-kd molecular weight cut-off) connected to a 15-cm to 20-cm-long fused silica tube (50-μm inner diameter and 150-μm outer diameter, Polymicro Technologies, Phoenix, AZ, U.S.A.). After the insertion of the probe in the aorta and the jugular vein, the open side of the fused silica tubes is connected to the FIA system. By applying underpressure, blood ultrafiltrate is pulled through the probe towards the FIA system and the biosensors at a flow of 100 nL/min. The two fused silica tubes (one from the jugular vein and one from the aorta) are each connected to the analytical part of the setup by an intercalated valve. The valve with a 20-nL internal loop (Vici-Valco Instruments, Houston, TX, U.S.A.) injects a 50-second collected ultrafiltrate sample every minute. Glucose and lactate are measured using glucose oxidase and lactate oxidase, respectively, placed in four separate enzyme reactors together with horseradish peroxidase (all enzymes from Roche, Mannheim, Germany). The resulting current is measured using wall-jet–type electrochemical flowcells (VT-03, Antec Leyden B.V., Zoetermeer, The Netherlands) and four potentiostates (two Decades, Antec Leyden B.V.), an Amor amperometric detector (Spark Holland, Emmen, The Netherlands), and a homemade potentiostate (Central electrical service, Groningen University, Groningen, The Netherlands). A schematic representation of the experimental setup is shown in Fig. 1A.
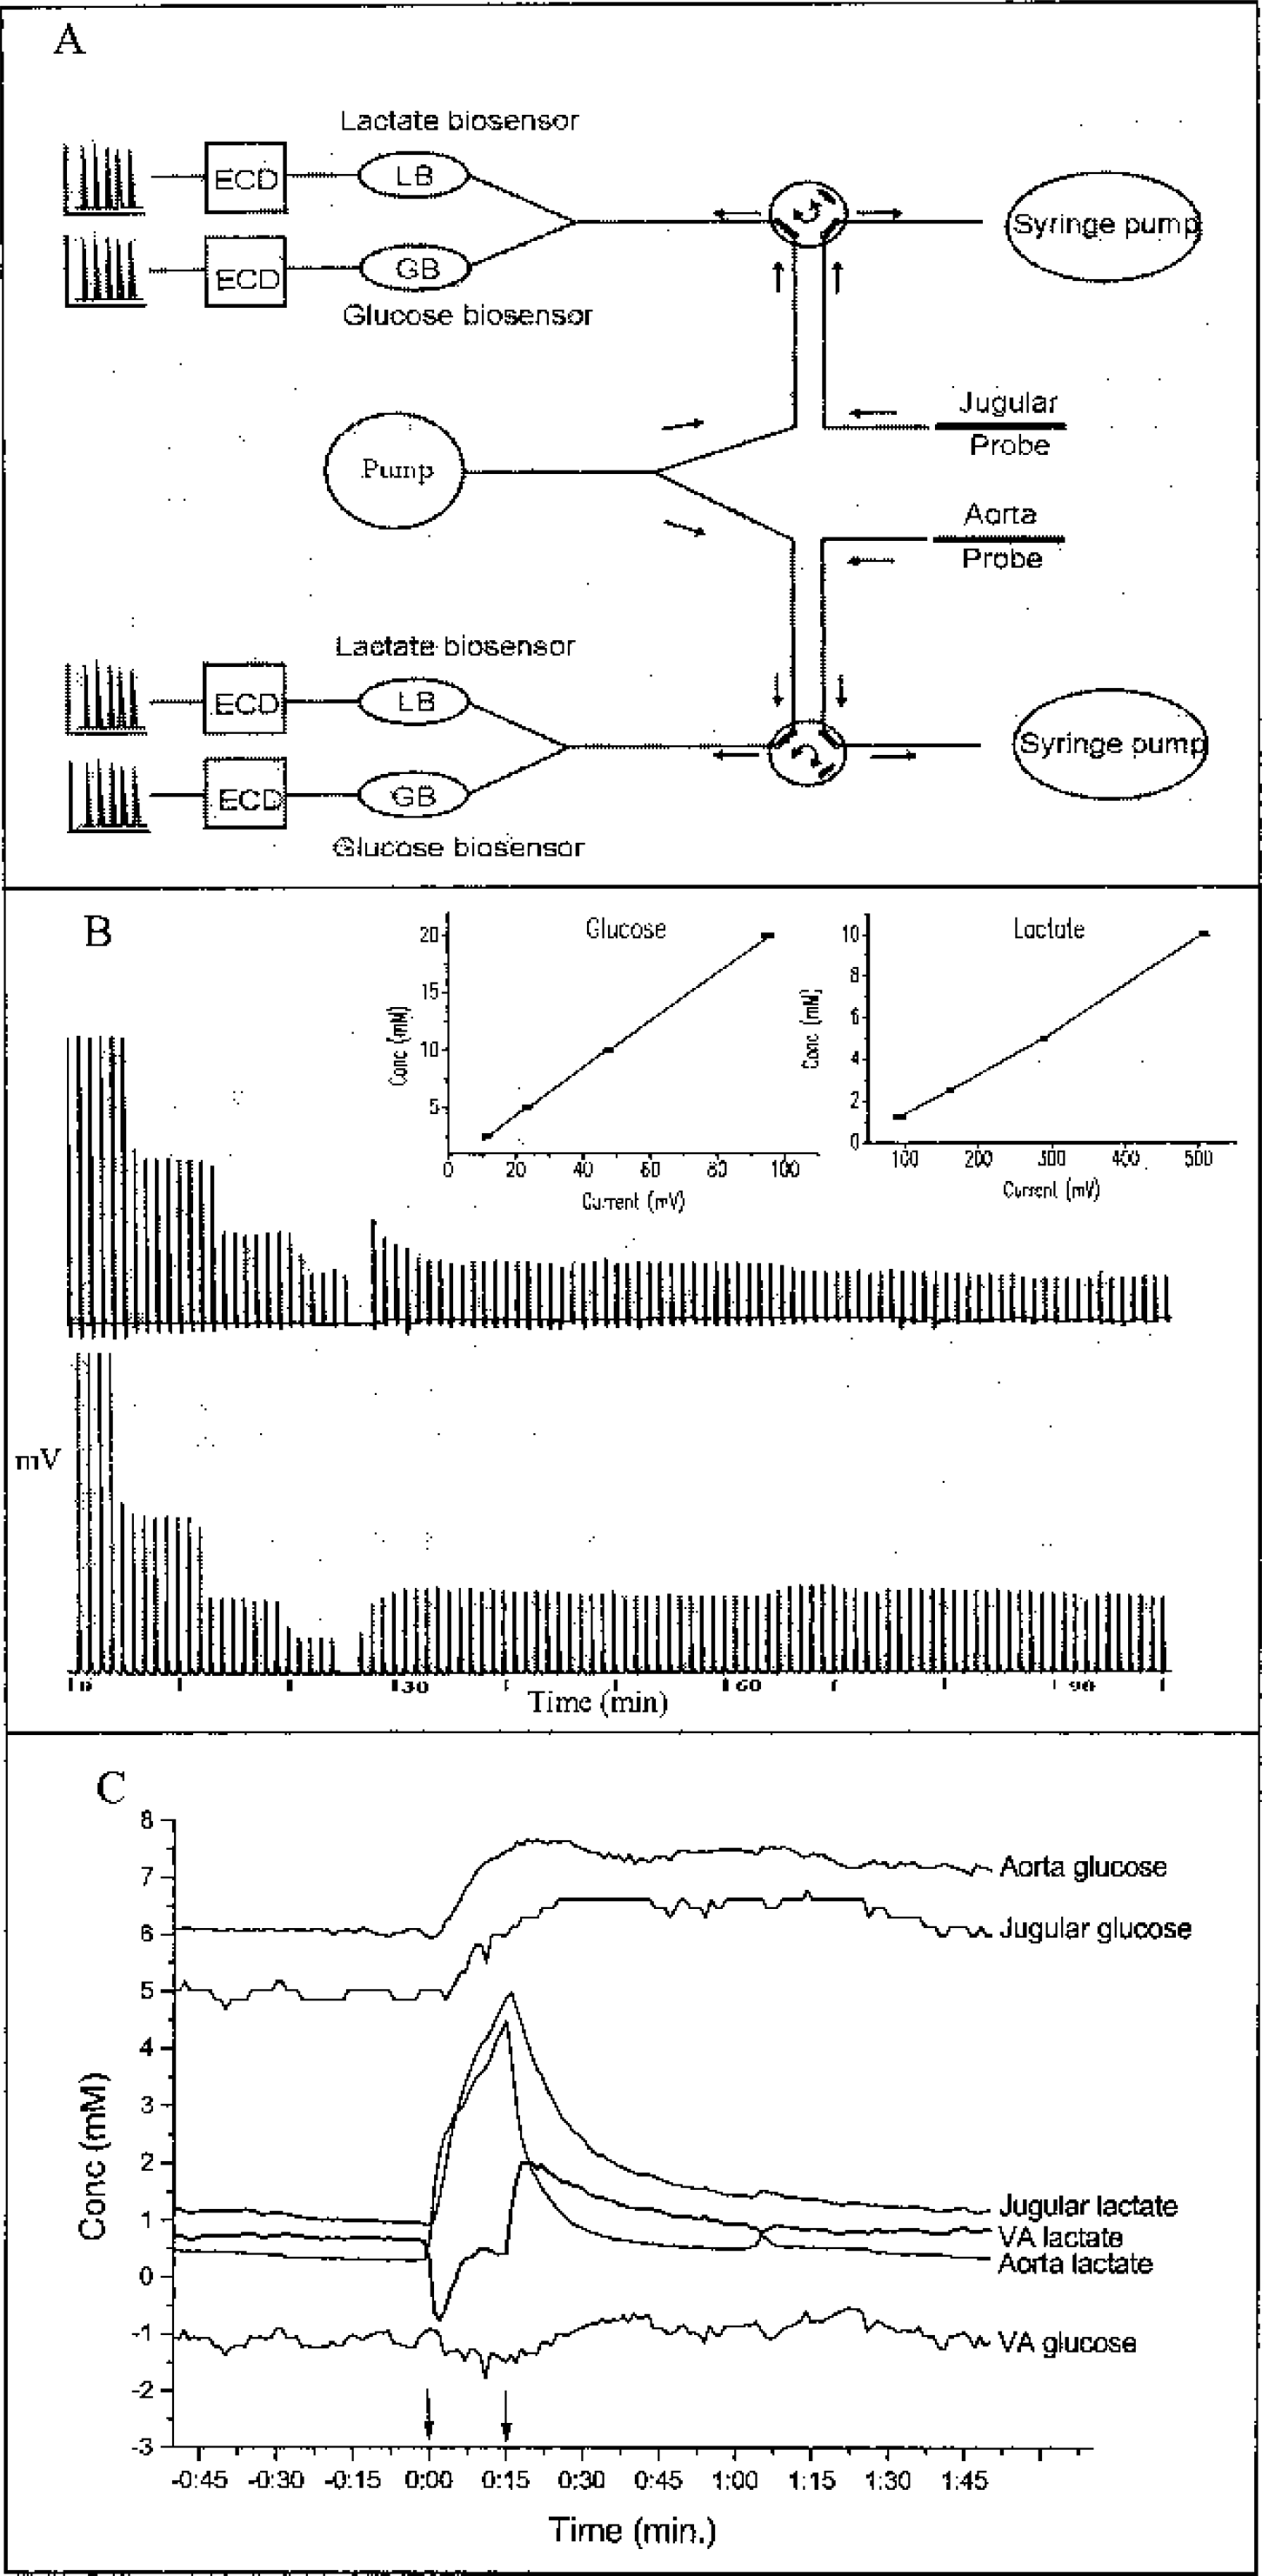
Figure 1a, b, and c: Figure 1a shows a schematic setup of the flow injection analysis (FIA) system. Arrows indicate flow direction. The flow in the ultrafiltration probe is 100 nL/min. ECD = electrochemical detection, LB = lactate biosensor, GB = glucose biosensor. An example of an experimental printout is shown in figure 1b, with a calibration curve (left) and part of the measured rat ultrafiltrate glucose (below) and lactate (above) concentrations. Insets show straight-line calibration-curve plots, current versus concentration. The equations of the regression lines are: glucose (right plot): y = 0.21x + 0.13, R2 = 0.9998, lactate (left plot): y = 0.021x − 0.92, R2 = 0.9978. Ultrafiltrate samples are measured every minute, with a recurrent return to FIA-baseline. The time-period in minutes is presented on the x-axis. Connecting all minute- to minute samples creates a graphical representation in figure 1c. Arrows indicate infusion start and ending. There is glucose influx throughout the experiment. Before lactate infusion there is lactate efflux, which turns to influx during infusion. Directly after the lactate infusion lactate efflux is higher than before infusion.
During the surgery, an in vitro calibration curve is run on the FIA (glucose: 0, 2.5, 5, 10, and 20 mmol/L; lactate: 0, 1.25, 2.5, 5, and 10 mmol/L). During the experiment, the glucose and lactate concentration is measured every minute and the currents (in nanoamperes) are recorded on two double-pens recorders (BD 112, Kipp en Zonen, Zoetermeer, The Netherlands) and by a data-acquisition program (Chromeleon, Dionex Corporation, Sunnyville, CA, U.S.A.).
Experimental procedure
After a baseline was recorded for at least 30 minutes, lactate (1-mol/L sodium-l-lactate, pH 7.4, dissolved in potassium-phosphate buffered saline) was infused at a rate of 100 μL/min for different time-periods (5–33 minutes) to achieve various maximal lactate levels. One experiment was done at an infusion rate of 50 μL/min for 80 minutes to reach a steady state during lactate infusion. After the infusion, the blood lactate level was allowed to return to baseline. The rats were killed at the end of the experiment.
Calculations
Because only about 80% of the blood volume consists of water, glucose molarity of whole blood is different from the ultrafiltrate molarity (Marks, 1996). To make correct comparisons with whole-blood glucose determinations, we adjusted the ultrafiltrate concentrations by −15% to unite with clinical practice of glucose molarity measurements in whole blood (Tiessen et al., 2001). Because the exchange over the erythrocyte membrane is much higher than the glucose use by the erythrocytes (Jacquez, 1984), hematocrit values are ignored. Erythrocytes do not have mitochondria to aerobically break down metabolic products; they acquire energy through anaerobic glycolysis. We assumed that, in contrast to their role in glucose metabolism, the erythrocytes do not actively participate in the lactate pool, because the typical lactate concentration in erythrocytes is higher than the normal lactate concentration in the blood (i.e., 2.9 versus normal 1–1.5 mmol/L, respectively;Stryer, 1995) and the maximal transport rate of the MCT1 transporter, present on erythrocytes, in adult rats is not very high (0.023 mmol·g−1·min−1, Cremer et al., 1979; 0.97 μmol·g−1·min−1, Kuhr et al., 1988). Therefore, we corrected the lactate values by −50% to correct for hematocrit for comparisons with whole-blood lactate determinations.
For both glucose and lactate, mean ± SD values were calculated during baseline (calculated average over 30 minutes), during lactate infusion (calculated average over infusion time), and after lactate infusion (calculated average over 60 minutes) for the aorta, the jugular vein, and the VA differences (Table 1). These averages were used for the calculation of correlation between the aorta lactate concentration and the flux of lactate, and for the correlation between the VA glucose with the VA lactate difference.
Average glucose and lactate concentrations at baseline and during and after lactate infusion
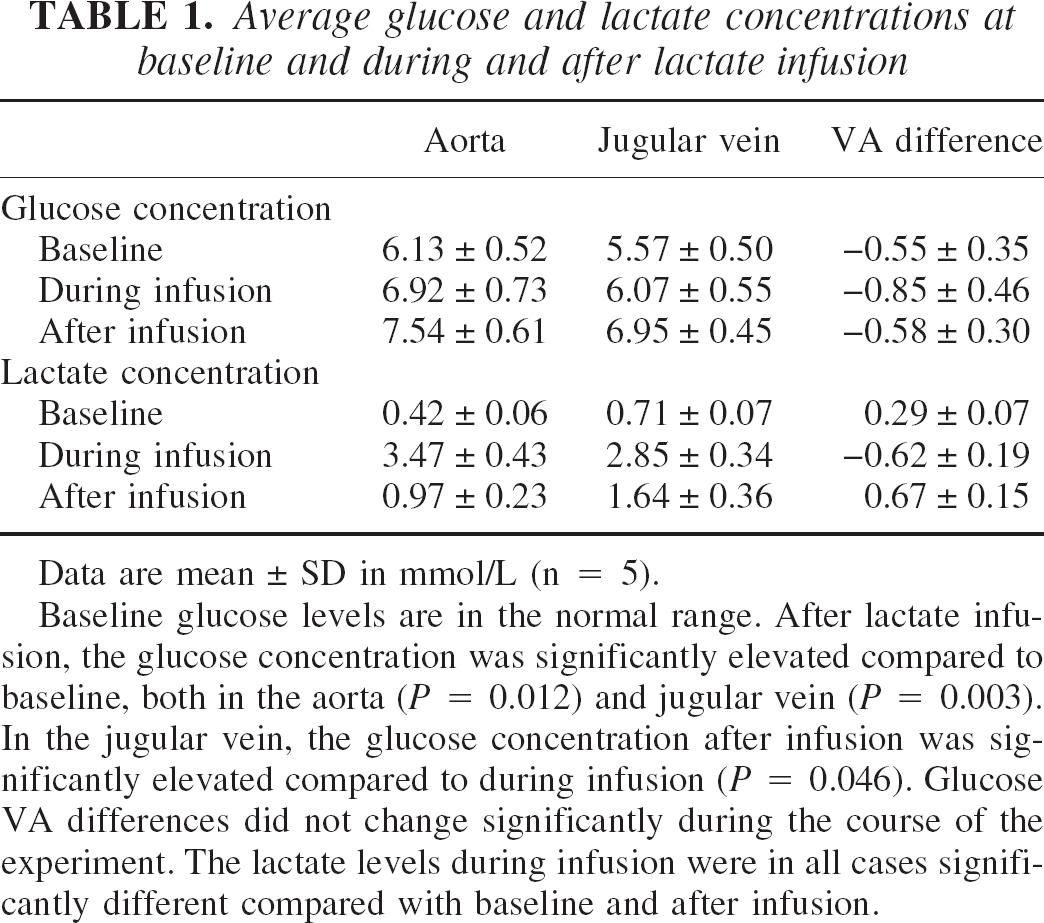
Data are mean ± SD in mmol/L (n = 5).
Baseline glucose levels are in the normal range. After lactate infusion, the glucose concentration was significantly elevated compared to baseline, both in the aorta (P = 0.012) and jugular vein (P = 0.003). In the jugular vein, the glucose concentration after infusion was significantly elevated compared to during infusion (P = 0.046). Glucose VA differences did not change significantly during the course of the experiment. The lactate levels during infusion were in all cases significantly different compared with baseline and after infusion.
From the deltas of the VA difference during and after infusion (thus minus baseline), the area under the curve (AUC) was calculated as the sum of the minute-to-minute delta concentrations. We assumed the curve to be divided into 1-minute-wide columns, in which the AUC is the sum of the height of these columns. The AUC during infusion was calculated over the length of the infusion time, the AUC after infusion was taken over a period of 60 minutes.
Statistical analysis
Correlations were calculated between the aorta lactate concentration and VA lactate, between the VA glucose concentration and VA lactate concentration, and between the AUC during infusion and the AUC after infusion. Differences between baseline, during-infusion, and after-infusion values for aorta, jugular vein, or VA glucose or lactate levels, and differences in glucose fluxes in separate lactate flux groups (lactate influx, no lactate flux, and lactate efflux) were analyzed with analysis of variance with a Bonferroni post hoc test. Values are given as mean ± SD.
RESULTS
Experimental examples
An example of an experimental printout and the graphic representation of an entire experiment are presented in Fig. 1, B and C, respectively. In Fig. 1B, two separate calibration curves are shown, as well as a part of the curves with the original lactate (above) and glucose (below) measurements. The minute-to-minute peaks have a recurrent return to baseline. After correcting the data (described in Materials and Methods) and calculating the VA differences, connecting the minute- to minute measurements creates a graph as shown in (Fig. 1C). Before lactate infusion, we measured stable baseline levels for at least 30 minutes, during which time there was glucose influx and lactate efflux.
Physiologic variables
Baseline glucose levels were in the normal range. After lactate infusion, the glucose concentration was significantly higher compared to baseline, both in the aorta (P = 0.012) and jugular vein (P = 0.003). In the jugular vein, the glucose concentration after infusion was significantly increased compared to during infusion (P = 0.046). However, glucose VA differences did not change significantly during the course of the experiment (Fig. 1C, Table 1). During lactate infusion, lactate influx is seen, which turns into an even higher than baseline efflux immediately after lactate infusion, and then returns to stable VA lactate levels (Fig. 1C, Table 1). The lactate levels during infusion are significantly different compared to baseline and after infusion, in the aorta (during infusion versus baseline, P = 0.005; during infusion versus after infusion, P < 0.000), in the jugular vein (during infusion versus baseline, P < 0.000; during infusion versus after infusion, P < 0.000), and in the VA differences (during infusion versus baseline, P < 0.000; during infusion versus after infusion, P = 0.021).
The pH and blood gas was analyzed in four animals (Table 2). The baseline pH was somewhat above the normal arterial range of 7.35 to 7.45 (all reference ranges provided by I-STAT), and the baseline CO2 was below normal arterial range of 4.67 to 6.0. It is possible that the infant ventilator used in this study caused these deviations, because these ventilators are not ideally suited for use on small laboratory animals. The baseline Po2 was somewhat above normal arterial range of 10.7 to 14.0, but stabilized during the experiment. The baseline HCO3 and base excess were within range (normal HCO3 range, 22 to 26; normal range base excess, −2 to 3). During infusion, the pH, HCO3, and base excess rose and remained high during the remainder of the experiment.
Blood gas and pH values before, during, and after lactate infusion
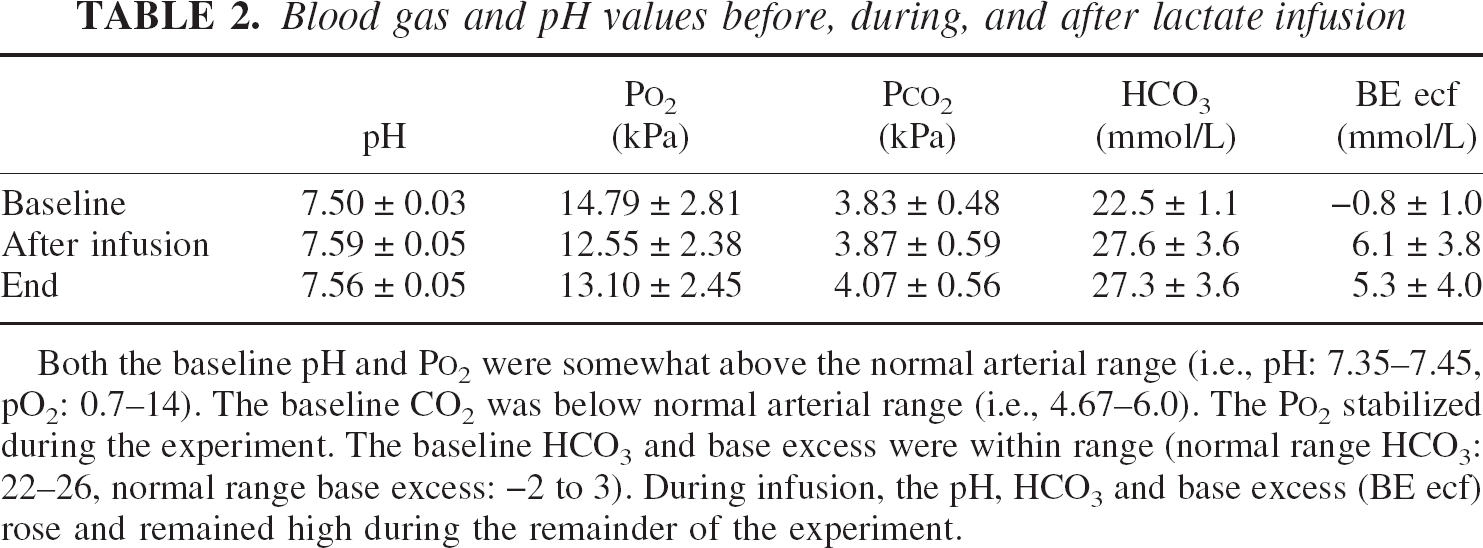
Both the baseline pH and P
Lactate flux and metabolism
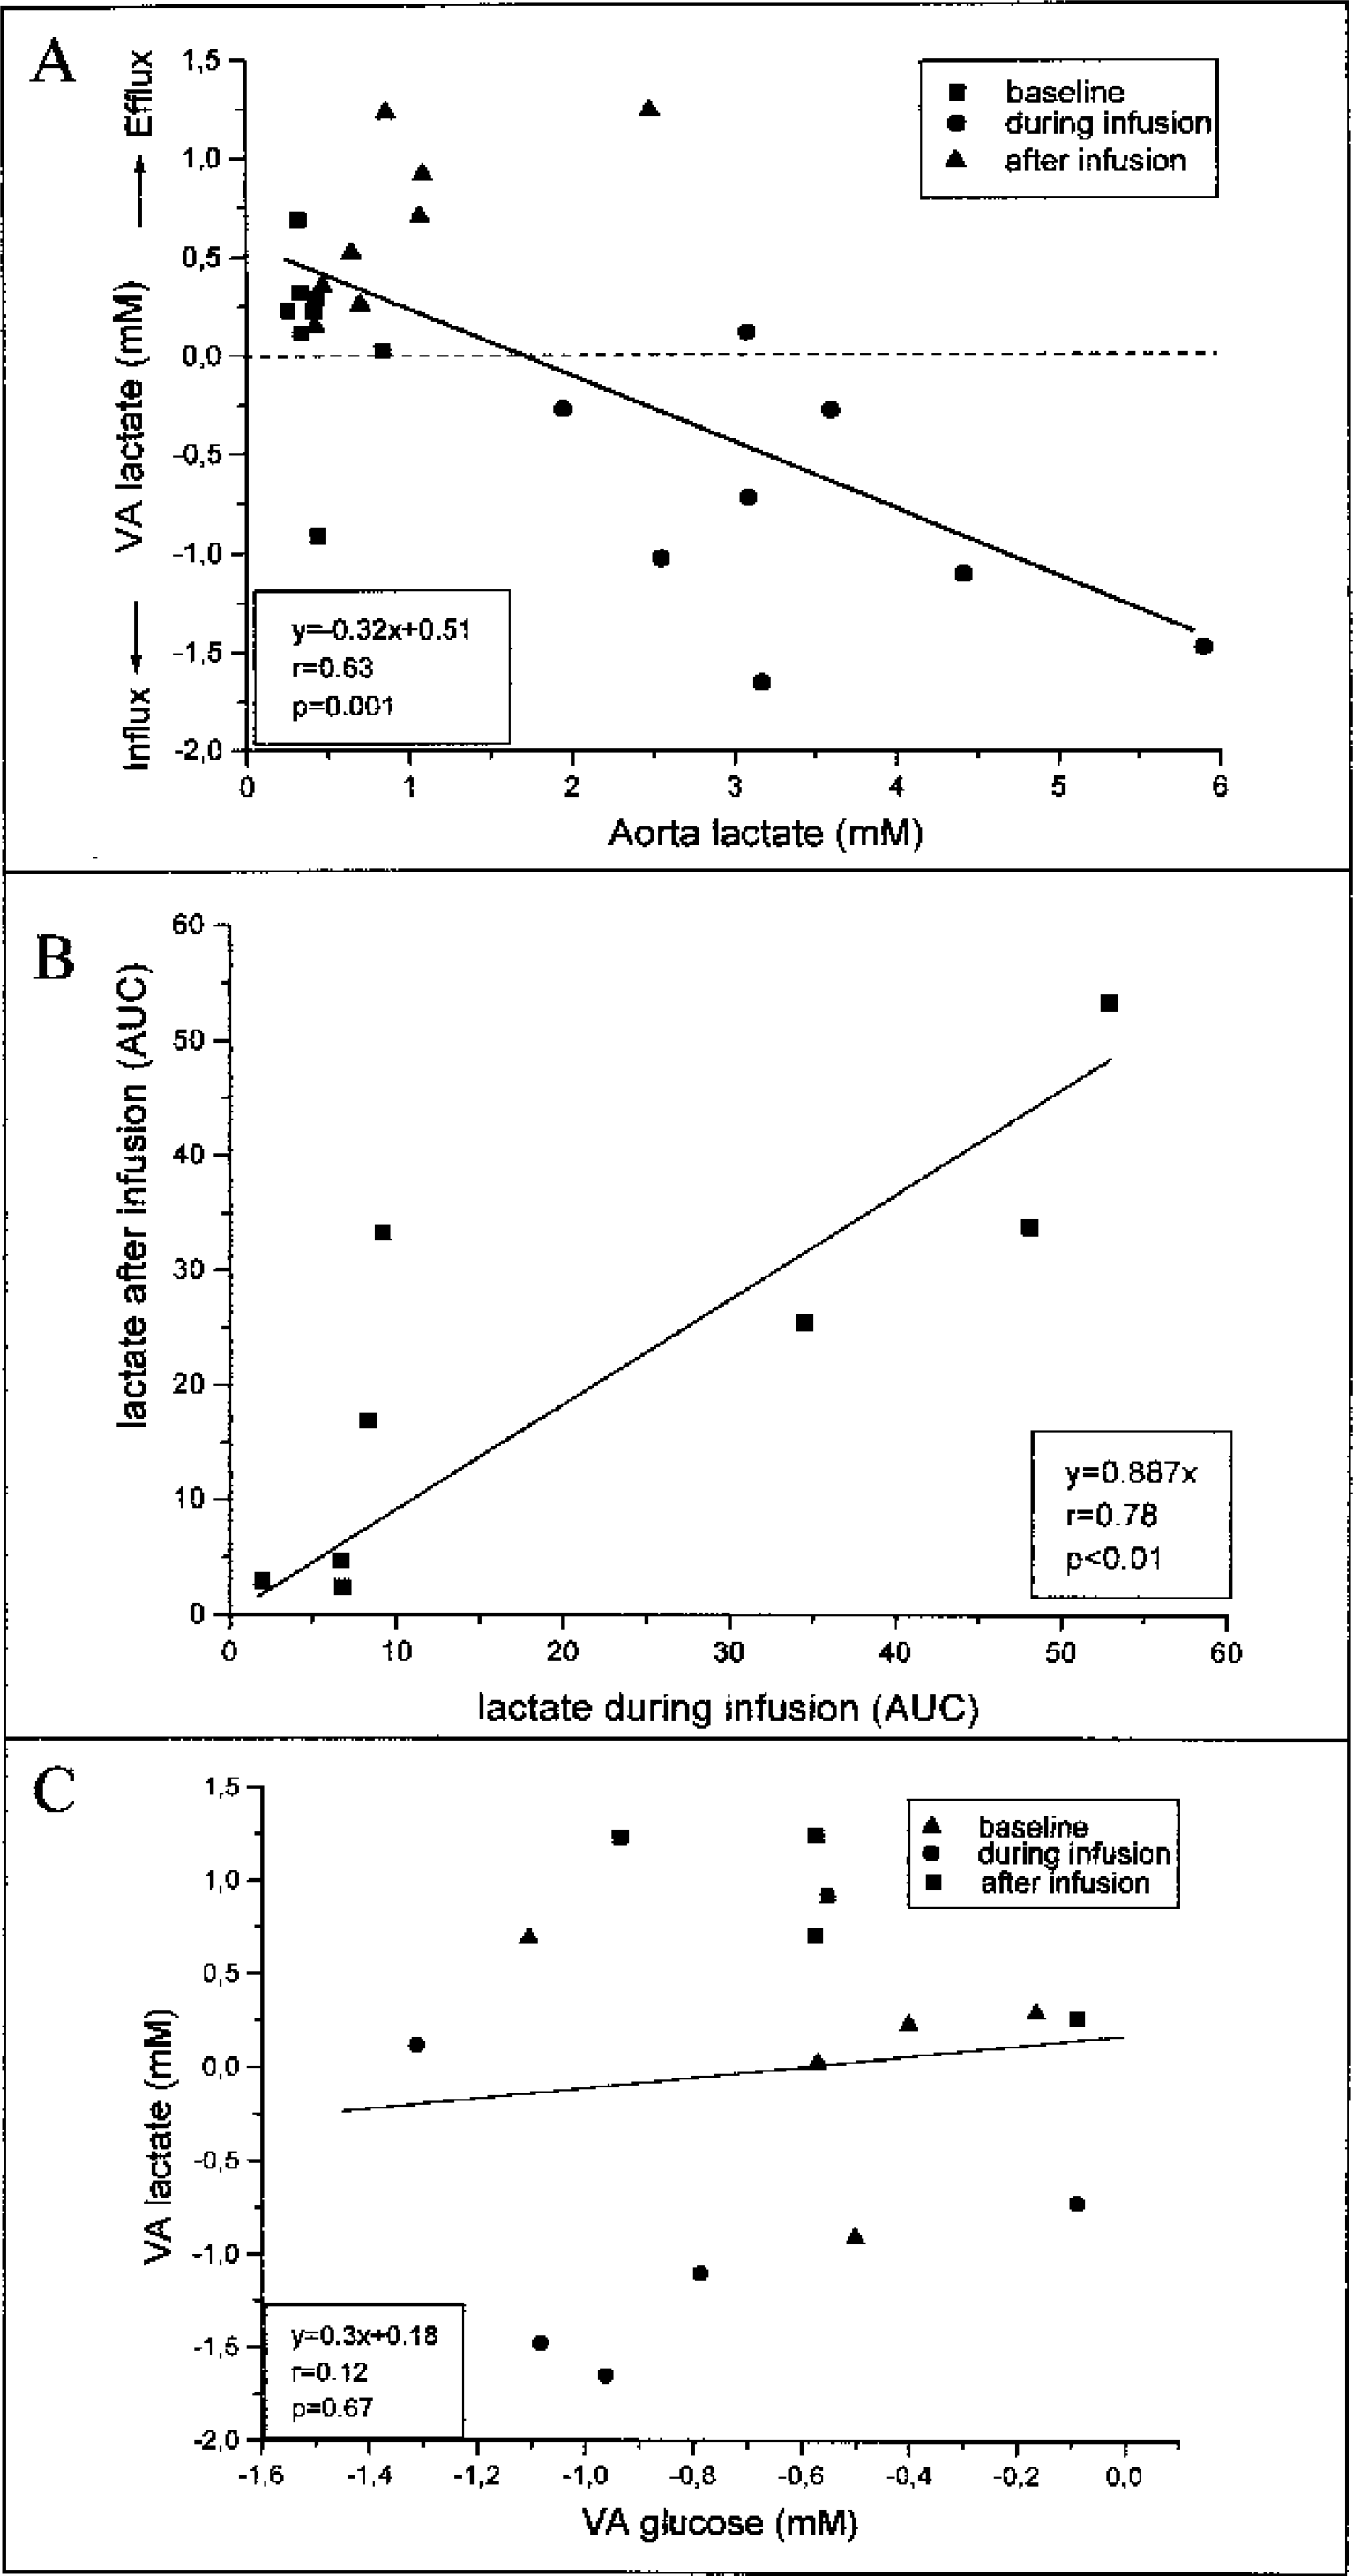
From the correlation between the mean aorta lactate concentration during baseline, infusion, or after infusion and the accompanying VA lactate (Fig. 2A) (n = 8, r = 0.63, P = 0.001), it can be shown that a lactate efflux turns to an influx at higher aorta lactate concentrations. The zero net flux point is approximately 1.75 mmol/L. The lactate AUC during infusion and the lactate AUC after infusion are significantly correlated (Fig. 2B) (n = 8, P = 0.01). All experiments showed an influx of lactate during the infusion and an efflux of lactate after the infusion. Thus, the amount of lactate moving into the brain during infusion correlates to the amount of lactate leaving the brain after infusion. The calculated function (Fig. 2B) reveals an almost 1:1 correlation (y = 0.89x).
Interanimal comparisons.
Glucose data from five lactate-infusion experiments were used for glucose uptake calculations. Averages were calculated for baseline, during infusion, and after infusion. Average glucose was calculated by taking a cerebral blood flow (CBF) rate from other halothane-anesthesia experiments (150 mL·100 g−1·min−1, the average of two studies [Linde et al., 1999; Verhaegen et al., 1992]) and a perfused brain-area of 1 g. The baseline VA glucose differences gave a glucose use of 0.83 μmol·g−1·min−1. Correcting the cerebral metabolic rate for glucose (CMRglc) for the lactate efflux during baseline (−0.12 ± 0.16, assumed to be derived from glucose) gave a CMRglc of 0.83 − 0.09 = 0.74 μmol·g−1·min−1.
Assuming a constant brain metabolism rate during the experiment, less glucose will be used when lactate replaces glucose as energy substrate (e.g., during high circulating lactate levels). If lactate were metabolized, a negative correlation would be expected between VA differences of lactate and glucose. In our experiments, however, no correlation was found between glucose and lactate flux in an interanimal comparison (Fig. 2C) and an intraanimal comparison (data not shown). Another way of analyzing lactate metabolism is by comparing the average glucose flux for different lactate fluxes. Therefore, we divided the lactate flux into three groups: lactate influx (average: −1.17 ± 0.39, n = 5), (almost) no lactate flux (0.18 ± 0.11, n = 5), and lactate efflux (0.96 ± 0.27, n = 5) and compared the concomitant glucose flux (glucose at lactate influx, −0.68 ± 0.40; glucose at no lactate flux, −0.51 ± 0.49; glucose at lactate efflux, −0.75 ± 0.26). When lactate is metabolized, the average glucose influx should be different between the separate groups. Again, no differences were found between the glucose fluxes in the different groups (F = 0.504, P = 0.617), suggesting that lactate does not replace glucose as metabolic substrate under these experimental conditions.
DISCUSSION
Some methodologic aspects
Lactate infusions have been used in cerebral studies to assess uptake (Chen et al., 2000a, 2000b; Dager et al., 1992a, 1992b) and metabolism (Bouzier et al., 2000; Hassel and Bråthe, 2000). High lactate levels, as found in our study, are within the physiologic range found during exercise in humans (Ide et al., 2000) and rats (Fregosi and Dempsey, 1984). The present report is based on measurements with a high time resolution of arteriovenous differences of lactate and glucose over the anesthetized rat brain under nonpathological conditions. The current approach allows four simultaneous measurements every minute, resulting in almost 1,000 values in a 4-hour experiment. Glucose and lactate levels are both measured in the same sample, and the aorta and jugular vein blood levels are monitored at the same time. Central elements in the setup are ultrafiltration and biosensor technology. Ultrafiltration sampling does not require complicated calculations of the recovery, because the recovery for glucose and lactate is 100% and remains constant during the experiment. The combination of flow-injection analysis and biosensor technology has already been used in several other studies (Kaptein et al., 1997; Leegsma-Vogt et al., 2001; Rhemrev-Boom, 1999; Savenije et al., 2002; Tiessen et al., 1999, 2001). For details concerning specificity, sensitivity, and speed of the lactate and glucose assays, we refer to our previous reports.
We considered the (confluence of the) sinus, the direct afferent vein of the cerebral cortex, as a site for the placement of the ultrafiltration-probe alternative to the jugular vein used in the present study. Unfortunately, the sinus is too short for the ultrafiltration probes and we considered the risk of bleeding too high. Therefore, we preferred the jugular vein for probe implantation. The jugular vein carries blood from extracerebral tissue, such as the facial muscles and the front limb; however, during anesthesia these contributions are small compared to those of the brain, and were therefore ignored. Evidence that the brain does indeed contribute to jugular venous lactate was reported in a study where jugular lactate was affected by acute brain injury (Leegsma-Vogt et al., 2001).
High lactate levels disturb the acid–base balance (Hood and Tannen, 1998), and may initially cause a low blood pH, followed by an alkalization due to aerobic metabolism (Gladden and Yates, 1983). Above an infusate pH of 4.4, alkalization predominates (Gladden and Yates, 1983); optimal respiration may reduce the alkalization. Alkalosis, as seen in our experiments, could decrease lactate production (Buchalter et al., 1989), clearance (Hetenyi et al., 1988), and transport across the blood–brain barrier (Oldendorf et al., 1979). Decreased lactate production and clearance will be equal in the aorta and jugular vein and thus will not influence our VA conclusions. The effect of lactate on CBF is unresolved. One study in patients with lactate-induced panic showed a 20% increase in CBF in normal control subjects (Stewart et al., 1988), whereas another study found no significant effect of lactate on CBF in nonpanicking patients or control subjects (Reiman et al., 1989). Any possible increase in CBF will have no effect on the VA glucose and lactate levels, as the increase in CBF will be equal in the aorta and the jugular vein because the brain is unable to expand in volume, and one jugular vein is ligated, forcing all jugular blood via the probed jugular vein. Halothane probably has no direct influence on lactate metabolism, considering that halothane does not affect lactate dehydrogenase activity (Johnstone et al., 1976) and lactate metabolism in hepatocytes (Becker, 1990). However, during halothane anesthesia, cerebral metabolism is reduced (Alkire et al., 1999; Attwell and Laughlin, 2001; Sibson et al., 1998) and CBF is increased (Kuroda et al., 1997; Linde et al., 1999; Paut and Bissonnette, 2001; Verhaegen et al., 1992).
Glucose metabolism
The average CMRglc in our experiments was 0.74 μmol·g−1·min−1. Because the CBF is increased during halothane anesthesia (Kuroda et al., 1997; Linde et al., 1999; Paut and Bissonnette, 2001; Verhaegen et al., 1992) we used an average CBF under halothane anesthesia (averaged from Linde et al., 1999; Verhaegen et al., 1992) of 150 mL·100 g−1·min−1 and a perfused brain area of 1 g. The calculated CMRglc was slightly above range of CMRglc values under anesthesia reported in literature (40–69 μmol·g−1·min−1;Mies et al., 1990; Ueki et al., 1992; Verhaegen et al., 1992), possibly because of altered hemodynamics due to the ligation of one jugular vein (Chai et al., 1995). For the comparison of VA differences, which is the main objective of this article, the exact measurement of CBF values is less important, because the blood flow entering the brain is equal to the blood flow going out of the brain due to the physical expansion barrier caused by the skull, and due to the ligation of one jugular vein. After the lactate infusion, both arterial and venous glucose concentrations were significantly elevated, although the VA glucose difference was not significantly changed. This increase in blood glucose may be caused by gluconeogenesis from lactate by the liver (Bouzier et al., 2000; Brooks, 2000).
Lactate uptake, release, and brain metabolism
Influx of lactate has been observed in humans and rats during exercise, and it was suggested that the uptake of lactate is dependent on enhanced activity of the brain (Ide et al., 2000). We used anesthetized rats with a diminished brain activity, so we conclude that lactate uptake does occur irrespective of the state of the brain, which was also shown in our previous study (Leegsma-Vogt et al., 2001). The lactate flux is concentration dependent; at normal levels of lactate there is lactate efflux, at higher blood lactate levels there is lactate influx. In this study, the equilibrium point is approximately 1.75 mmol/L, at which the flux of lactate into the brain is equal to the amount of lactate leaving the brain. This equilibrium concentration is somewhat higher than in our previous experiments (Leegsma-Vogt et al., 2001), but still in between the Km values of the monocarboxylate transporters (MCT1, 3.5 mmol/L; MCT2, 0.5 mmol/L;Broer et al., 1998, 1999).
There is a significant correlation between the amounts of lactate taken up by the brain during infusion and released from the brain after infusion. Almost all of the lactate taken up during infusion is released afterwards (89%), indicating that 11% of the lactate taken up was not released. In the current setup, we can calculate whether cerebral accumulated lactate serves as a substrate alternative to glucose. There was no relation between accumulated lactate and VA differences in glucose. Thus, net cerebral blood lactate use is minimal and blood lactate is not a replacement energy substrate for glucose. The 11% lactate taken up by the brain is either not metabolized, or if metabolized, not used for energy consumption (e.g., converted to alanine). These results suggest that there is a lactate pool in the brain that can be filled and emptied depending on the blood lactate concentration, and which is not used as an energy supply. Although we cannot exclude the possibility that high lactate levels may disrupt normal metabolic relationships, our study emphasizes that high lactate levels do not necessarily lead to altered glucose consumption.
As the VA method measures net metabolism instead of total metabolism, this conclusion does not necessarily imply that lactate is not metabolized at all. For example, after the injection of [3-13C]lactate, which increased blood lactate concentrations to exercise levels (8–11 mmol/L;Bouzier et al., 2000; Hassel and Bråthe, 2000), rapid incorporation of the label is seen in glutamate, glutamine (Hassel and Bråthe, 2000), and alanine (Bouzier et al., 2000), with a cerebral uptake and metabolism of lactate up to 50% that of [1-13C]glucose in awake mice (Hassel and Bråthe, 2000). Although brain energy use is lower under anesthesia (Attwell and Laughlin, 2001; Sibson et al., 1998), lactate is also metabolized in the anesthetized rat (Bouzier et al., 2000). In addition, lactate metabolism under both pathological and physiologic conditions is now well established in vitro (Cater et al., 2001; Schurr et al., 1997, 1988, 1999). However, incorporation of [3-13C]lactate may overestimate lactate consumption, because the conversion of lactate to alanine does not necessarily imply lactate metabolism (through the citric acid cycle to CO2 and H2O). Also, the efflux of unlabeled lactate, which possibly occurs in larger quantities than that of [3-13C]lactate, has not been taken into account in the [3-13C]lactate studies. We believe that [3-13C]lactate experiments are very well suited to study the rapid flux of lactate in the brain, but it does not necessarily imply that lactate metabolism contributes significantly to the net brain energy use. However, because experiments were performed under halothane anesthesia, our study may have underestimated cerebral lactate consumption. Lactate consumption could be higher in conscious animals. Unfortunately, the necessity of anesthesia is a limitation of the present technique.
In conclusion, the results of this study suggest that lactate does not replace glucose as a cerebral metabolic substrate. The findings that 89% of the lactate moving into the brain during infusion is released afterwards and no reduction of glucose consumption is seen at lactate influx suggest that there is hardly any net lactate use by the brain. The possible lactate metabolism is of minor importance to total net brain energy consumption. There seems to be a lactate pool in the brain that can be filled and emptied, allowing exchange of lactate even at equimolar concentrations between brain and blood, but which is not used as a supply for cerebral metabolism under normoglycemic circumstances.