
Abstract
We compared blood-brain barrier (BBB) permeability to glucose between quiet wakefulness and rapid-eye-movement (REM) sleep to assess whether changes in BBB permeability play a role in coupling glucose supply to the physiologic metabolic needs of the brain. Male Sprague-Dawley rats were prepared with electrodes for wake-sleep state scoring and with arterial and venous catheters. Using the single-pass, dual-label indicator method, unidirectional glucose extraction by the brain and cerebral blood flow (CBF) were simultaneously measured during states of quiet wakefulness (n = 12) or REM sleep (n = 7). The product of BBB surface area and permeability to glucose (PS product) was computed in each state. During REM sleep, CBF significantly exceeded that during quiet wakefulness in all regions but the cerebellum, whereas the difference in the PS product between quiet wakefulness and REM sleep was not statistically significant in any brain region. In the brain as a whole, CBF significantly increased 29% from quiet wakefulness to REM sleep, while a nonsignificant 0.8% increase occurred in the PS product. During REM sleep, the increase in CBF indicates a higher rate of brain glucose consumption than in quiet wakefulness, given the tight flow-metabolism coupling in the brain. Therefore, these data show that modulation of BBB permeability to glucose is not a mechanism that provides ‘energy on demand’ during the physiologic brain activation characterising REM sleep.
Introduction
The adult brain mainly relies on glucose for its energy metabolism (Dienel, 2002). In the brain, carbohydrate stores exist in astrocytes as glycogen, which is only sufficient to fuel the cerebral rate of glucose consumption for a limited time (Brown, 2004). The brain therefore depends on a continuous supply of glucose from the circulation. To be transported into the brain, blood glucose must cross the blood-brain barrier (BBB) through stereospecific GLUT-1 membrane carriers (Duelli and Kuschinsky, 2001). Net blood-brain glucose transport is the result of two opposite unidirectional glucose fluxes. The fluxes in each direction depend mainly on the glucose concentration in the fluid adjacent to the capillary wall, the surface area (S) of the capillary network, and the capillary permeability (P) to glucose, which itself is a function of the density and kinetic constants of GLUT-1 transporters on the barrier membranes and of glucose concentration in the cis-side fluid (Gjedde, 1992). The unidirectional blood-brain glucose transport is limited in physiologic conditions by the diffusion across the BBB rather than by cerebral blood flow (CBF) (Gjedde, 1992; Lund-Andersen, 1979).
During pharmacologically induced tremors (Cremer et al, 1983) or seizures (Cornfold et al, 2000), the unidirectional clearance of blood glucose across the BBB rises acutely (Cornfold et al, 2000; Cremer et al, 1983), thereby effectively increasing glucose supply to the brain in times of increased demand. It has recently been hypothesised that a raised glutamatergic tone in the cerebral cortex activates allocation of glucose to the brain by promoting GLUT1-mediated glucose transport across the BBB (Peters et al, 2004). Such an effect could be mediated by increases in GLUT-1 transporter density on the barrier membranes, conformational changes of the GLUT-1 transporters leading to an increased maximum velocity of transfer and/or to a decreased half-saturation constant (Gjedde, 1992), increases in the number of perfused capillaries, and increases in the homogeneity of perfusion rates in the capillary network (Kuschinsky and Paulson, 1992). It is still unclear whether a modulation of one or more of these variables is involved in maintaining brain tissue homeostasis in the face of physiologic rather than extreme increases in brain activity. To address this question, one must contend with the difficulty of eliciting a condition of brain activation that is both physiologic and widespread, while avoiding the effects of stress (Esposito et al, 2001) or anaesthesia (Gjedde, 1992; Gjedde and Rasmussen, 1980) on the BBB. Rapid-eye-movement (REM) sleep is a spontaneous, repetitive, and physiologic behavioural state, which entails increases in CBF with respect to quiet wakefulness in human subjects (cf. Maquet (2000) for a review) and animal models (Maquet, 2000; Zoccoli et al, 2002). In rats, in particular, regional CBF increases during REM sleep with respect to quiet wakefulness are both substantial and widespread (Zoccoli et al, 1994).
Thus, we assessed whether the PS product for blood-brain glucose transport differs between quiet wakefulness and REM sleep in unrestrained rats 10 days after surgical preparation. The CBF is coupled to brain metabolism during sleep as well as during wakefulness (Madsen, 1993). Therefore, if the BBB takes a part in coupling brain glucose uptake to physiologic synaptic function (Peters et al, 2004), BBB permeability to glucose will increase from quiet wakefulness to REM sleep to provide ‘energy on demand’ during physiologic brain activation.
Methods
The experiments were performed on 36 male Sprague-Dawley rats (Charles River, 250–300 g). The study protocol was approved by the Bologna University ethical committee on animal experimentation. Animals were kept on a light-dark schedule of 12/12 h with the light on at 9.00 a.m., ambient temperature controlled at 23°C and free access to food and water.
Surgery
Surgery was performed under general anaesthesia (1% halothane, 30% O2, balance N2O) and sterile conditions. Electrodes were implanted for electroencephalographic and electromyographic recordings. Two Silastic catheters were positioned in the abdominal aorta and the inferior vena cava via the femoral artery and vein, respectively. Catheters were tunnelled subcutaneously and fixed to the skull, together with the electrodes, by dental acrylic. An osmotic pump (ALZA 2002, Durect Co., Cupertino, CA, USA) was implanted subcutaneously to continuously administer calcium heparin (10 IU/100g day).
Experimental Procedures
After one week's recovery, each animal was habituated for three days to the recording apparatus, which consisted of a Plexiglas cylinder (20 cm in diameter) placed inside a thermoregulated box. An air-pressure-operated blade controlled from outside the box was mounted on the movable lid of the cylinder.
The dual-label indicator-fractionation method (Harik et al, 1994; Puchowicz et al, 2004; Sage et al, 1981) was adapted to the study of freely moving animals and used to simultaneously measure cerebral glucose extraction and CBF. On the day of the experiment, a polyethylene tube was filled with 60 mL of saline buffered solution (10 mmol/L HEPES buffer, pH 7.40) containing 4-[N-methyl-14C] iodoantipyrine (NEN; 0.231 to 0.482 MBq, 1.96 GBq/mmol), d-[2-3H] glucose (NEN; 0.794 to 1.208 MBq, 740.0 GBq/mmol), and 10 mmol/L nonradioactive glucose. Purity of the radioactive material added to the solution was assessed by paper or silica gel chromatography. The polyethylene tube was connected on one side to the venous catheter and on the other to a 250 mL Hamilton syringe. The arterial catheter was connected to two polyethylene tubes by means of a T-shaped connector. Through one of these tubes (20 mL in volume), an arterial blood sample (150 mL) was obtained during the wake-sleep state chosen for the experiment and analysed (Gem 3000, Instrumentation Laboratory, Italy) at a reference temperature of 37°C. The other tube was connected to a syringe fitted in a Sage pump (Cambridge, MA, USA) calibrated to withdraw blood at a rate of 1.5 mL/min.
The wake-sleep state was scored according to polygraphic and behavioural criteria: in particular, electroencephalographic theta rhythm of higher amplitude, muscle atonia, and twitches distinguish REM sleep from quiet wakefulness. Measurements in quiet wakefulness were taken after spontaneous awakenings from sleep, the rat lying still. During stable states of quiet wakefulness (n = 12) or REM sleep (n = 7), the withdrawal pump was started and saline injected (100 mL, 4 secs) through the Hamilton syringe, flushing the radioactive solution in the polyethylene tube into the inferior vena cava. In REM sleep, injection started 50±18 secs after the beginning of a stable REM sleep state. At a fixed time interval after the beginning of the injection, determined in preliminary experiments as 13 secs (see Results), the rat was decapitated by means of the air-pressure-operated blade and the withdrawal pump stopped simultaneously. All animals maintained a stable behavioural state (i.e., did not fall asleep from quiet wakefulness or awake from REM sleep) during the circulation time of the radioactive bolus through the cerebral circulation.
Three samples (5 mL each) of the prevalently venous blood that dripped from the foramen magnum were collected to estimate radioactivity (liquid β-scintillator, LS 6500, Beckman, Fullerton, CA, USA) in the cerebral intravascular space (Harik et al, 1994; Puchowicz et al, 2004). Aliquots of the withdrawn arterial blood were taken for radioactivity measurement. The brain was rapidly removed and dissected into medulla, pons, midbrain, cerebellum, diencephalon, hippocampi, and cerebral hemispheres. Samples were weighed and sonicated in distilled water before radioactivity measurement.
Optimal Cerebral Perfusion Time
To determine the optimal time from injection to decapitation, that is, the shortest time allowing most of the radioactive bolus to pass through cerebral capillaries, preliminary experiments were performed in a separate group of rats (n = 8) according to the method described by Sage et al (1981). Rats were prepared under general anaesthesia with arterial and venous catheters, as previously described. Two rats were implanted with an additional catheter in the confluence of the cerebral sinuses. A bolus containing l-[1-3H(N)] glucose (NEN; 0.968 to 1.079 MBq, 540.2 GBq/mmol) was administered with identical injection parameters as used in d-glucose experiments. l-glucose was chosen because of its limited capacity to cross the BBB. Serial blood samples consisted of blood drops freely dripping from the arterial and cerebral venous catheters and singly collected in preweighed vials. The times of collection for each drop from the start of the injection were measured.
Apparent Cerebral Volume of Distribution of l-glucose
To accurately estimate carrier-mediated d-glucose transport across the BBB, the contributions because of simple diffusion, vesicular transport (Lucchesi and Gosselin, 1990), and residual intravascular label were estimated by measuring the apparent volume of distribution of l-glucose (Harik et al, 1994; Puchowicz et al, 2004) under the same protocol used in d-glucose experiments. l-[1-3H(N)] glucose (NEN; 0.902 to 1.062 MBq, 540.2 GBq/mmol) was injected during quiet wakefulness (n = 6) or REM sleep (n = 3). The apparent volume of distribution of l-glucose in each region was computed as the ratio of [3H]l-glucose radioactivity in each brain region and the plasmatic [3H]l-glucose concentration in the blood obtained from the foramen magnum.
Data Analysis
Regional CBF (mL/100 g min) was calculated as (Harik et al, 1994; Puchowicz et al, 2004; Sage et al, 1981):

where FS is the withdrawal rate of the pump, W is the weight of the brain sample, and [14C]B and [14C]S indicate the [14C]iodoantipyrine radioactivity in the brain sample and in the arterial blood, respectively. Equation (1) assumes high permeability for iodoantipyrine (i.e., that iodoantipyrine flux across the BBB is limited by blood flow) and that no iodoantipyrine backflux occurs from brain to blood during the measurement. The first assumption is substantially verified when CBF is lower than 180 mL/100 g min (van Uitert et al, 1981). The backflux error is proportional to CBF and the duration of the experiment and is inversely proportional to the brain-blood partition coefficient for the indicator.
Regional cerebral extraction fraction (E) of d-glucose was computed as

where [3H]B and [3H]S indicate the [3H]d-glucose radioactivity in the brain sample and in the arterial blood, respectively. Equation (2) assumes that no backflux of [3H]d-glucose occurs from brain to blood during the measurement. The backflux error has the same dependency as that of Equation (1).
In each experiment, the regional apparent volume of distribution of l-glucose was multiplied by the plasmatic radioactivity of [3H]d-glucose in the blood obtained from the foramen magnum. For each region, this product was then subtracted from [3H]B to correct for the contribution due to noncarrier-mediated glucose transport and residual intravascular [3H] (Harik et al, 1994; Puchowicz et al, 2004).
Regional permeability-surface area (PS) product was computed from E and cerebral plasma flow (CPF = CBF(1-hematocrit)) according to the equation (Crone, 1965):
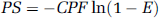
where ln indicates natural logarithm. Equation (3) assumes that E represents unidirectional blood-to-brain glucose extraction, and propagates any error in CBF and E resulting from the violation of the assumptions of equations (1) and (2).
Data for brain regions and for the whole brain are expressed as mean values±s.d., with n indicating the number of animals. Values of CBF, E, and PS presented for the brain as a whole were computed on the basis of the sum, for each animal, of the respective weight, [3H]-radioactivity, and [14C]-radioactivity of the regional samples in which the whole brain was dissected.
Statistical significance of the differences between quiet wakefulness and REM sleep for each brain region was assessed by Student's t-test with a comparison-wise error rate (Kusuoka and Hoffman, 2002) of P<0.05.
RESULTS
Analysis of Arterial Blood
Results of the arterial blood analysis are reported in Table 1. Results were similar to those previously obtained in healthy rats (Zoccoli et al, 1994, 1996) and did not differ significantly between quiet wakefulness and REM sleep.
Optimal Cerebral Perfusion Time
Results of the arterial blood gas analysis in quiet wakefulness and REM sleep
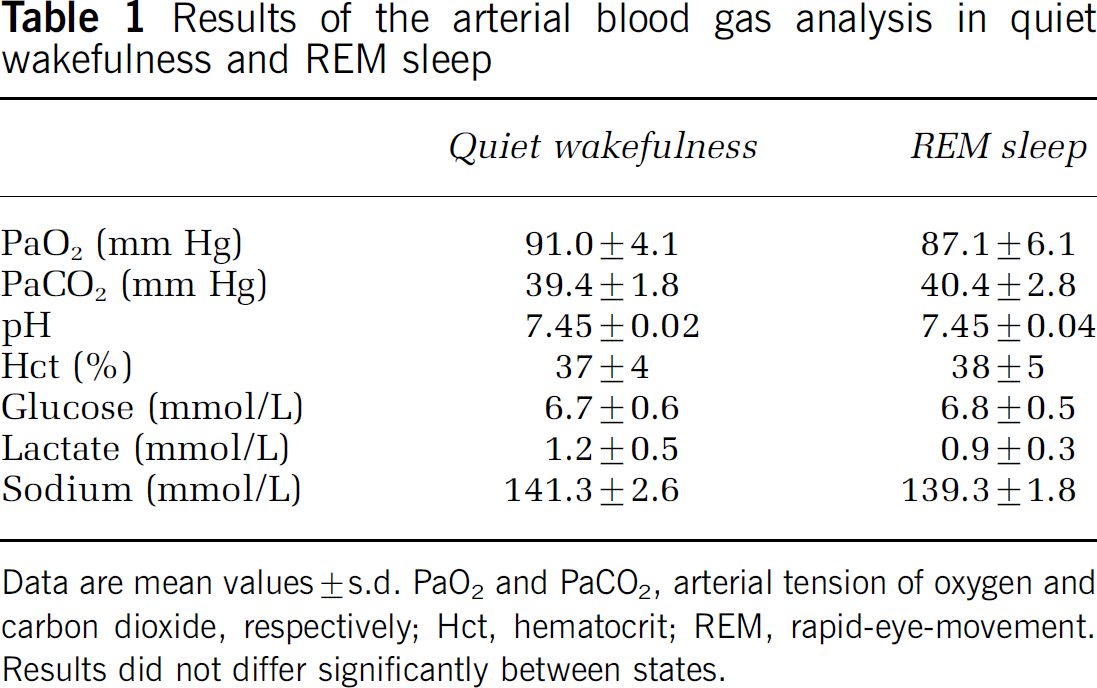
Data are mean values ± s.d. PaO2 and PaCO2, arterial tension of oxygen and carbon dioxide, respectively; Hct, hematocrit; REM, rapid-eye-movement. Results did not differ significantly between states.
Results of a representative experiment are reported in Figure 1. In this experiment, the recirculation time of the radioactive bolus was also apparent. The peak concentration of [3H]l-glucose in the cerebral venous blood occurred 4 secs after the peak of arterial concentration. Cerebral venous concentration of [3H]l-glucose then decreased sharply to 44% of the peak venous radioactivity 11 secs after the start of injection, to decrease more slowly afterwards. A secondary peak in arterial concentration due to recirculation of the radioactive bolus occurred 15 secs after the start of injection. The optimal decapitation time was selected as 13 secs after the start of injection, that is, half-way between the onset of the slow decrease in cerebral venous radioactivity and the arterial recirculation peak. Blood pressure was not measured during the experiment; however, the paucity of the blood loss due to sampling (220 mL after 20 secs in the experiment in Figure 1) makes it unlikely that major changes in blood pressure biased the result.
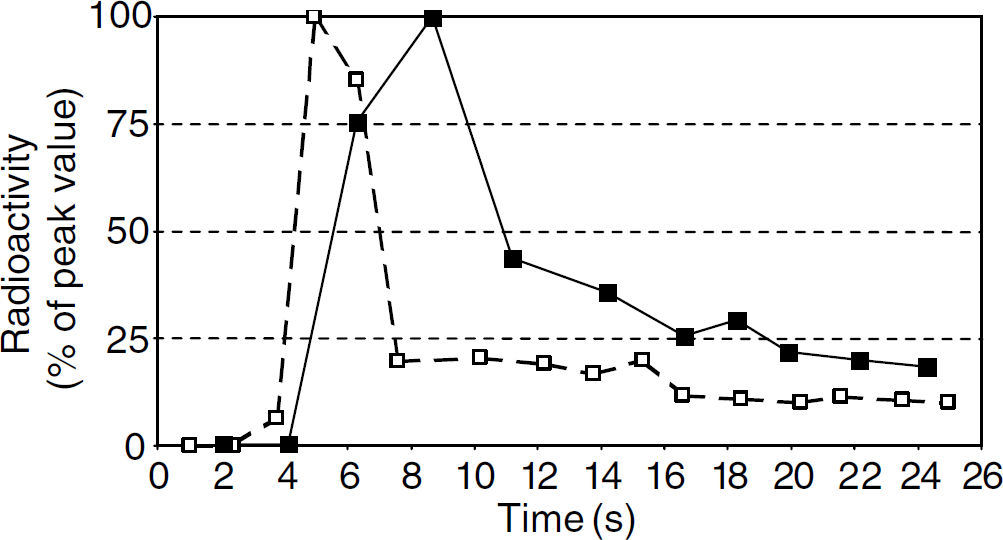
Optimal cerebral perfusion time. Arterial (dashed line) and cerebral venous (continuous line) radioactivity of labelled l-glucose after intravenous injection in a representative experiment. Both arterial and venous radioactivity are reported as percentages of the respective peak value.
Apparent Cerebral Volume of Distribution of l-glucose
In one rat, in quiet wakefulness, the values of the apparent volume of distribution of l-glucose in the medulla and pons exceeded the mean±2s.d. of the values in the corresponding region and were thus excluded from the subsequent analysis.
The apparent volume of distribution of l-glucose for each brain region did not significantly differ between quiet wakefulness and REM sleep, in agreement with the paucity of changes in cerebral blood volume between quiet wakefulness and REM sleep (Risberg and Ingvar, 1973), and with the lack of brain capillary recruitment between these states (Zoccoli et al, 1996). Data for each region were therefore pooled between states and are reported in Figure 2.
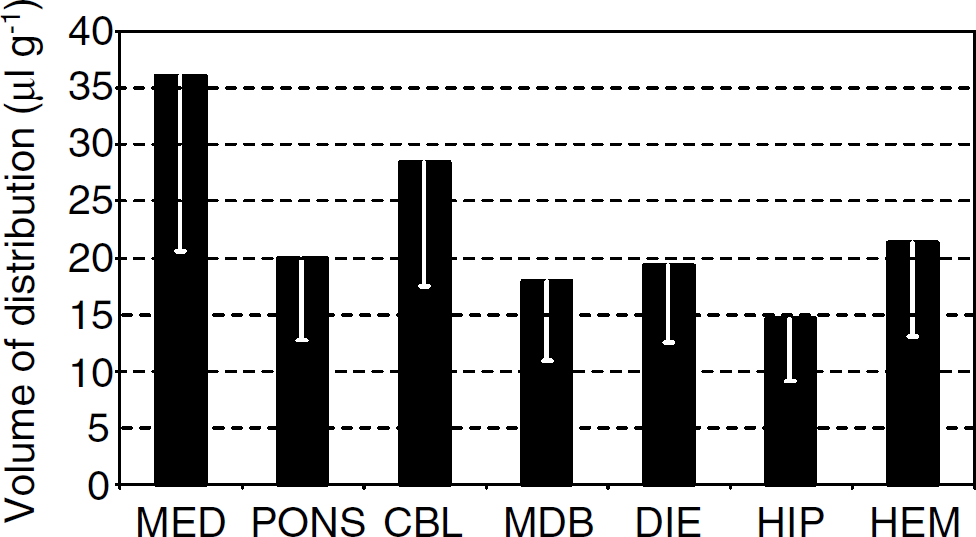
Apparent cerebral volume of distribution of l-glucose. Volume of distribution of l-glucose in the cerebral regions examined under the same setting adopted in the d-glucose experiments. Mean values and s.d. of the data pooled between quiet wakefulness and rapid-eye-movement (REM) sleep are reported (n = 9). MED, medulla; CBL, cerebellum; MDB, midbrain; DIE, diencephalon; HIP, hippocampi; HEM, cerebral hemispheres. Values in hippocampi and cerebral hemispheres are mean values over left and right samples.
Regional Cerebral Blood Flow, Glucose Extraction Fraction, and Permeability-Surface Area Product for Glucose
Regional CBF data in quiet wakefulness and in REM sleep are reported in Figure 3. Regional CBF in REM sleep significantly exceeded that in quiet wakefulness by approximately 30% in all regions but the cerebellum. In the brain as a whole, CBF was 107.1±16.7 mL/100 g min in REM sleep and 83.1±14.6 mL/100 g min in quiet wakefulness, the difference being statistically significant.
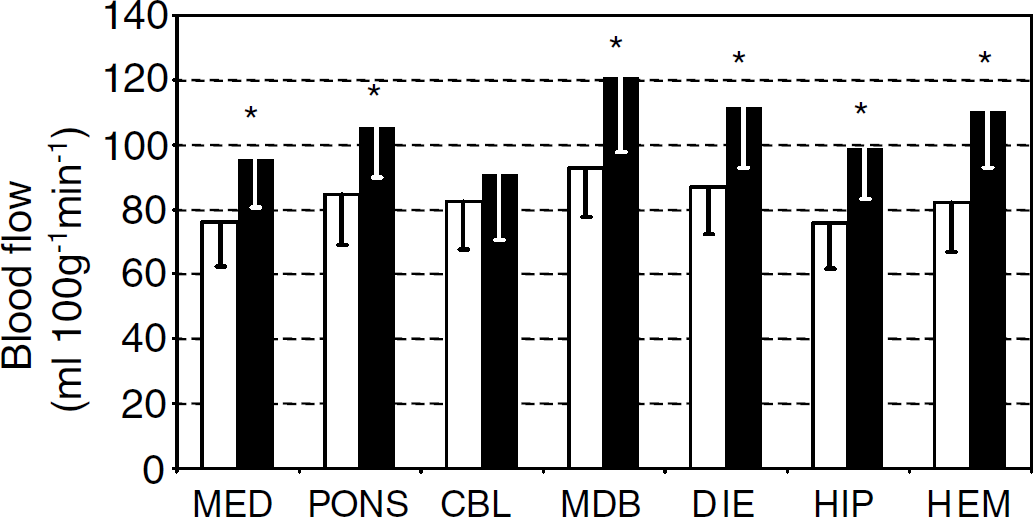
Regional cerebral blood flow in quiet wakefulness and in rapid-eye-movement (REM) sleep. Blood flow in the cerebral regions examined in quiet wakefulness (white bars, n = 12) and REM sleep (black bars, n = 7). Mean values and s.d. of the data are reported for each region. MED, medulla; CBL, cerebellum; MDB, midbrain; DIE, diencephalon; HIP, hippocampi; HEM, cerebral hemispheres. Values in hippocampi and cerebral hemispheres are mean values over left and right samples. *P<0.05 versus quiet wakefulness.
Conversely, glucose extraction fraction in the different brain regions was lower in REM sleep than in quiet wakefulness, the difference being significant in the mesencephalon, diencephalon, hippocampi, and cerebral hemispheres (Figure 4). In the brain as a whole, glucose extraction fraction was 0.21±0.04 in REM sleep and 0.25±0.03 in quiet wakefulness, the difference being statistically significant.
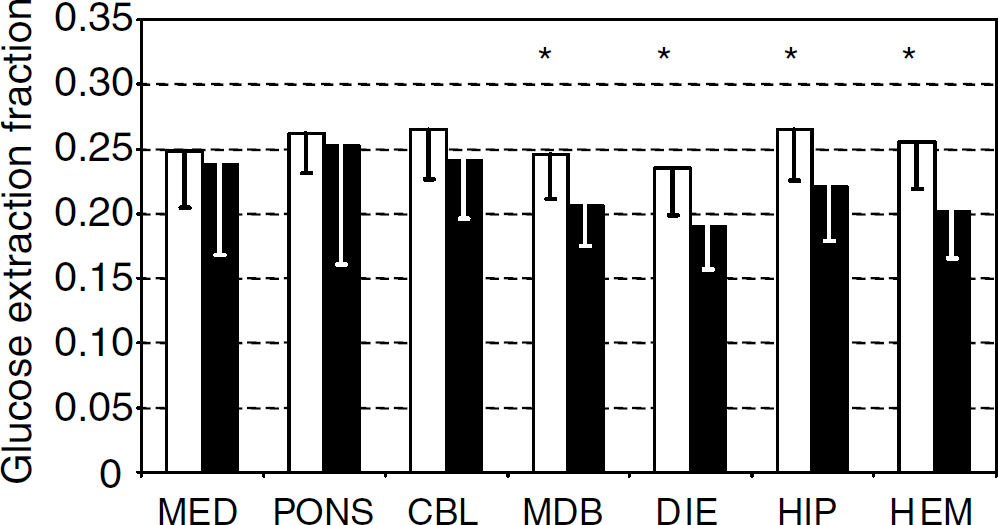
Regional cerebral extraction fraction of glucose in quiet wakefulness and in rapid-eye-movement (REM) sleep. Glucose extraction fraction in the cerebral regions examined in quiet wakefulness (white bars, n = 12) and REM sleep (black bars, n = 7). Mean values and s.d. of the data are reported for each region. MED, medulla; CBL, cerebellum; MDB, midbrain; DIE, diencephalon; HIP, hippocampi; HEM, cerebral hemispheres. Values in hippocampi and cerebral hemispheres are mean values over left and right samples. *P<0.05 versus REM sleep.
As a result of the contrasting increases in CBF and decreases in glucose extraction fraction, the difference in the PS product between quiet wakefulness and REM sleep was not statistically significant in any brain region, P ranging from 0.23 to 0.89 in the different regions. Regional PS product for glucose during quiet wakefulness and REM sleep is reported in Figure 5. In the brain as a whole, PS product for glucose was 15.2±2.8 mL/100 g min in REM sleep and 15.1±2.4 mL/100 g min in quiet wakefulness. The difference between states was less than 1% of the value in quiet wakefulness and was not statistically significant (P = 0.93).
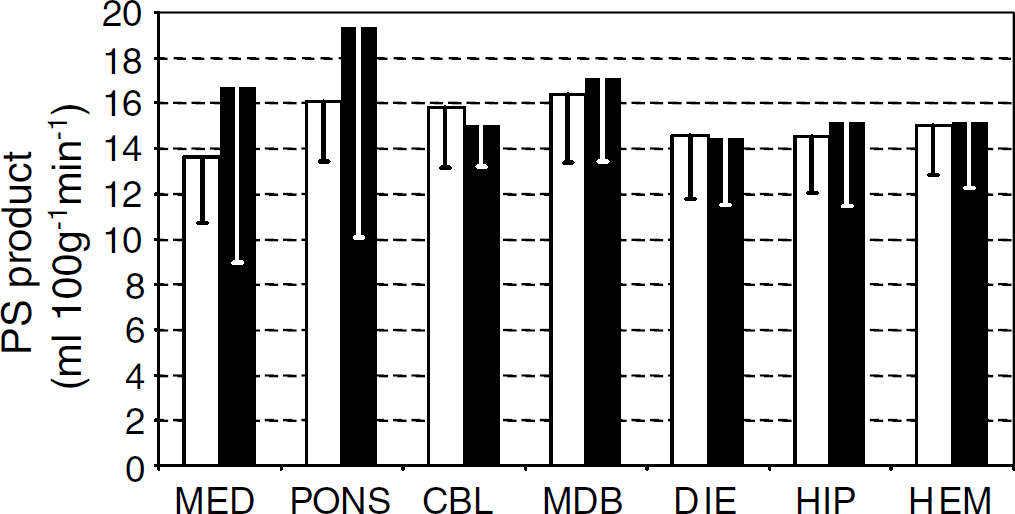
Regional cerebral permeability-surface area (PS) product for glucose during quiet wakefulness and rapid-eye-movement (REM) sleep. PS product for blood-brain glucose transport in the cerebral regions examined in quiet wakefulness (white bars, n = 12) and REM sleep (black bars, n = 7). Mean values and s.d. of the data are reported for each region. MED, medulla; CBL, cerebellum; MDB, midbrain; DIE, diencephalon; HIP, hippocampi; HEM, cerebral hemispheres. Values in hippocampi and cerebral hemispheres are mean values over left and right samples. No significant difference was found between states in any region.
DISCUSSION
We simultaneously measured the PS product for blood-brain glucose transport and CBF in unrestrained rats during spontaneous states of quiet wakefulness and REM sleep. In REM sleep, no significant change in BBB permeability to glucose occurred with respect to quiet wakefulness in spite of a substantial widespread increase in CBF. This finding indicates that modulation of BBB permeability is not involved in providing glucose ‘on demand’ during physiologic brain activation.
The adult brain mainly relies on blood-borne glucose for its energy metabolism (Dienel, 2002). It has recently been hypothesised that facilitation of glucose diffusion across the BBB via GLUT-1 transporters is a physiologic mechanism that couples synaptic function with brain glucose uptake (Peters et al, 2004). This hypothesis has never been directly proved. To resolve the issue, we adapted the dual-label indicator fractionation technique (Harik et al, 1994; Puchowicz et al, 2004; Sage et al, 1981) to directly measure the PS product for blood-brain glucose transport in physiologic conditions of quiet wakefulness and REM sleep.
Rapid-eye-movement sleep is a physiologic and repetitive behavioural state in which high cerebral energy requirements correspond to a sustained neuronal activity (Maquet, 2000). In our experimental conditions, during REM sleep, CBF significantly increased with respect to quiet wakefulness in all cerebral regions examined but the cerebellum (Figure 3). The CBF increases agree with previous measurements obtained in our laboratory using radioactive microspheres (Zoccoli et al, 1994), a technique independent from the assumptions of the indicator-fractionation method applied in the present study. Changes in CBF across wake-sleep states are because of variations in cerebral vascular resistance rather than arterial pressure (Zoccoli et al, 2002), and the flow-metabolism coupling is effective in the brain during sleep and during wakefulness (Madsen, 1993). Therefore, the increases in CBF during REM sleep suggest that the cerebral metabolic rate of glucose consumption was higher in this state. In agreement with this view, both CBF and the cerebral metabolic rate of glucose consumption rise at a regional level during REM sleep in human subjects (Maquet, 2000). Therefore, REM sleep may be regarded as a state of physiologic brain activation, which was remarkably widespread in the rat model we studied.
The wide increase in CBF observed from quiet wakefulness to REM sleep was accompanied by a reduction in the cerebral extraction fraction of glucose, which was statistically significant in mesencephalic, diencephalic, and telencephalic regions (Figure 4); as a result, regional PS product for blood-brain glucose transport did not significantly differ between states. Large values of glucose extraction fraction and PS product were computed in the medulla in one rat in REM sleep and in the pons in a different rat in REM sleep. A greater variability in glucose extraction and PS values in the brainstem may be ascribed to the difficulty of removing pial membranes when dissecting tissue samples from this brain region (Lucchesi and Gosselin, 1990). Accordingly, the only outlier values of the volume of distribution of l-glucose were obtained in the brainstem (see Results). In all other regions, differences of the mean PS product between states were negligible and both increases and decreases in the mean PS product were observed in the different regions (Figure 5). The indicator-fractionation method that we and others (Cornfold et al, 2000; Harik et al, 1994; Puchowicz et al, 2004; Sage et al, 1981) adopted is based on assumptions (see Methods) that are violated, albeit modestly, in its experimental application, yielding an underestimation of CBF, E, and PS. Tracer backflux depends inversely on the brain-blood partition coefficient of the tracer. The partition coefficient of [3H]d-glucose, estimated from that of 3-O-methylglucose, is lower than 0.55 mL/g (Namba et al, 1987), and is thus lower than the partition coefficient of [14C]iodoantipyrine, which is 0.80 mL/g (Sakurada et al, 1978). Because the errors due to tracer backflux depend directly on CBF, the underestimation of CBF, E, and PS in our study was more marked in REM sleep than in quiet wakefulness. However, the dependence of the backflux error on CBF is stronger for [14C]iodoantipyrine, whose transport across the BBB is limited by blood flow, than for [3H]d-glucose, whose transport is substantially diffusion-limited. Moreover, even with wide changes in CBF from 50 to 250 ml/100 g min and after 15 secs, only a 2% decrease occurs in the apparent brain extraction of butanol (Sage et al, 1981), whose transport is flow-limited and whose partition coefficient of 0.77 mL/g (Gjedde et al, 1980) is slightly lower than that of iodoantipyrine. Thus, available evidence indicates that the errors due to tracer backflux are small and insufficient to explain our findings, and it is safe to conclude that differences in the PS product for blood-brain glucose transport between quiet wakefulness and REM sleep were truly negligible in our study.
Because the fraction of cerebral capillaries perfused by plasma is close to unity and is constant among wake-sleep states in the same model as in the present study (Zoccoli et al, 1996), these data indicate that changes in BBB permeability to glucose are negligible during sleep-related brain activation. The unidirectional blood-brain glucose transport is diffusion-limited in physiologic conditions (Gjedde, 1992; Lund-Andersen, 1979). Therefore, our data suggest that extracellular glucose in the brain is continuously consumed and is not at a steady state during REM sleep. It is unlikely, however, that a compensatory increase in the PS product would have occurred in REM sleep after our measurements, because the extracellular glucose concentration 90 secs after the onset of REM sleep episodes is still 11.4% lower in the rat somatosensory cortex with respect to wakefulness (Netchiporouk et al, 2001).
Our results are at variance with the increase in the PS product for blood-brain glucose transport that occurs when brain activation is induced pharmacologically in rats (Cornfold et al, 2000; Cremer et al, 1983). Such rapid increases in the PS product, taking less than 3 mins to occur (Cornfold et al, 2000), cannot be ascribed to increases in the surface area of brain capillaries because capillary recruitment does not occur in the brain (Kuschinsky and Paulson, 1992; Zoccoli et al, 1996). Rather, the increase in the measured PS product may be because of the homogenization of the perfusion rate of different capillaries within the vascular bed (Kuschinsky and Paulson, 1992), a redistribution of carriers among endothelial cell compartments (Cornfold et al, 2000; Duelli and Kuschinsky, 2001), or changes in glucose carrier kinetics (Carruthers, 1990; Cornfold et al, 2000). Rapid changes in glucose carrier kinetics have been described because of the interaction with barbiturates (Haspel et al, 1999) and lead to a decrease in glucose transfer across the BBB in vivo (Gjedde and Rasmussen, 1980). Moreover, an aspecific increase in BBB permeability because of stress may increase the measured PS product for blood-brain glucose transport in nonphysiologic conditions such as intoxication (Cremer et al, 1983) or seizures (Cornfold et al, 2000), at least in the diencephalon and cerebellum (Esposito et al, 2001). During nonphysiologic brain activation, the increases in BBB permeability to glucose are accompanied by increases in CBF with respect to baseline values that are greater (range +47% to +239%, cismethrin-induced tremors (Cremer et al, 1983); +50%, seizures (Cornfold et al, 2000)) than those we observed from quiet wakefulness to REM sleep (range +24% to +34% in the different regions). A threshold level for the rise in CBF may be needed to reduce the heterogeneity of capillary flow velocities substantially enough to raise the measured PS product for blood-brain glucose transport. In addition, the increase in cerebral metabolic needs during nonphysiologic brain activation may be higher than the physiologic increase from quiet wakefulness to REM sleep, although a direct comparison is hindered by alterations in the flow-metabolism coupling in nonphysiologic conditions (Cremer et al, 1983). It is noteworthy that after the oxidative machinery has reached saturation, glucose consumption increases 15-fold for each molecule of ATP produced (cf. Lenzi et al, 1999). A threshold level for the cerebral rate of glucose consumption might thus be required to trigger a compensatory change in glucose carrier kinetics or intracellular distribution. Our study then indicates that such thresholds are hardly reached in physiological conditions because the increases in regional CBF observed from quiet wakefulness to REM sleep compare favourably with those elicited by functional brain activation obtained by means of electrical forepaw stimulation (Ances et al, 2001).
The lack of a compensatory increase in BBB permeability to glucose during physiologic brain activation implies that other mechanisms provide for physiologic increases in the brain requirement for glucose. The estimated unidirectional glucose transport to the brain is higher than net glucose transport, that is, cerebral glucose consumption at the steady state (Gjedde, 1992; Lund-Andersen, 1979), and the decrease in brain glucose concentration tends to equalise net and unidirectional blood-brain glucose transport, that is, it reduces glucose backflux from the brain. Moreover, the affinity for glucose of hexokinase, the first enzyme involved in glucose metabolism, is high with respect to glucose concentration in the brain (Lund-Andersen, 1979). The coupling between CBF and neuronal activity, although likely linked to the local brain requirement for oxygen (Lenzi et al, 1999) rather than to glucose supply to the brain (Powers et al, 1996), leads to a modest increase in unidirectional blood-brain glucose transport during physiologic brain activation. Finally, although glycogen stores in the brain are too small to provide for long-term energy requirements, the breakdown of brain glycogen constitutes an ‘energy buffer’ that provides for short-term energy needs (Brown, 2004).
In conclusion, our study shows that BBB permeability to glucose is not modulated to maintain the homeostasis of the brain's internal environment during physiologic brain activation. Thus, the brain may prioritise its glucose supply by modulating glucose transporters on the BBB (Peters et al, 2004) only in times of extreme and nonphysiologic increases in synaptic activity (Cornfold et al, 2000; Cremer et al, 1983).
Footnotes
Acknowledgements
The authors acknowledge the skilful contribution of undergraduate students Gioia Longhi and Fabiola Monnati to the experimental work.