
Abstract
Plasticity after central lesions may result in the reorganization of cortical representations of the sensory input. Visual cortex reorganization has been extensively studied after peripheral (retinal) lesions, but focal cortical lesions have received less attention. In this study, we investigated the organization of retinotopic and orientation preference maps at different time points after a focal ischemic lesion in the primary visual cortex (V1). We induced a focal photochemical lesion in V1 of kittens and assessed, through optical imaging of intrinsic signals, the functional cortical layout immediately afterwards and at 4, 13, 33, and 40 days after lesion. We analyzed histologic sections and evaluated temporal changes of functional maps. Histological analysis showed a clear lesion at all time points, which shrank over time. Imaging results showed that the retinotopic and orientation preference maps reorganize to some extent after the lesion. Near the lesion, the cortical retinotopic representation of one degree of visual space expands over time, while at the same time the area of some orientation domains also increases. These results show that different cortical representations can reorganize after a lesion process and suggest a mechanism through which filling-in of a cortical scotoma can occur in cortically damaged patients.
Cortical maps represent numerous aspects of sensory information about the outside world in a dynamic mosaic, which has been shown to change under different circumstances. In particular, lesion studies have provided important information regarding plasticity of cortical maps and have shown that damage to the cortical body surface representation often leads to the remodeling of the spared representational zones surrounding the lesion (Doetsch et al., 1990; Nudo et al., 1996).
Responses of cortical neurons depend on the inputs that they receive from the thalamus as well as on those from neurons within their local network. Therefore, lesion-induced changes observed in cortical sensory maps may rely on remodeling of thalamic inputs (Jones and Pons, 1998) and intrinsic cortical connections (Darian-Smith and Gilbert, 1994; Jones, 2000). Modifications of motor and somatosensory maps in response to focal cortical lesions have been extensively studied (Coq and Xerri, 1999; Doetsch et al., 1990; Nudo et al., 1996), as opposed to the effects of focal visual cortex lesions, which have received little attention (Eysel and Schweigart, 1999; Schweigart and Eysel, 2002).
The primary visual cortex is characterized by a columnar functional organization and contains a number of orderly maps of visual stimulus properties (Hubel and Wiesel, 1974; Hübener et al., 1997), such as the retinotopic and the orientation preference map.
Reorganization of the cortical retinotopic representation has been extensively explored after retinal lesions (Kaas et al., 1990) and more recently after cortical lesions (Eysel and Schweigart, 1999), whereas reorganization of orientation preference maps has not been explored after either of these procedures.
Previous studies investigating the consequences of primary visual cortex (V1 or area 17) lesions have been mainly concerned with behavioral compensation and reorganization in other visual cortical areas (Illig et al., 2000; MacNeil et al., 1996; Orban et al., 1990; Payne and Lomber, 2002; Spear et al., 1988; Vandenbussche et al., 1991). Only one study has analyzed the effects of a focal visual cortical lesion on the damaged cortical area itself, showing changes in receptive field size of neurons outside the lesion (Eysel and Schweigart, 1999). This study provided information regarding modifications in the receptive fields of single cells in the surrounding of a cortical lesion. However, an imaging analysis evaluating the reorganization of visual cortex maps and the temporal evolution of such a process has not been performed.
The aim of the present work was to address whether the cortical retinotopic representation and the orientation preference maps reorganized with time in areas adjacent to a focal ischemic lesion and to establish a temporal correlation between functional and morphologic lesion size.
We induced a focal photochemical lesion in V1 of kittens and visualized retinotopic and orientation preference maps by optical imaging of intrinsic signals before the lesion, immediately afterwards, and after survival times of 4, 13, 33, and 40 days. At each of these time points, animals were killed and histologic analysis was performed.
SUBJECTS AND METHODS
The experiments were performed on 9 kittens (6–10 weeks old) bred in colonies; all procedures were carried out in accordance with local government rules.
Seven kittens were subjected to optical imaging experiments before lesion and at several times afterwards; two additional kittens received a lesion and were killed 4 days later, without imaging (Table 1). Thus, except for the 40 days postlesion time point, we obtained imaging and histologic data from at least 3 animals per time point.
Number of kittens used in the present study
All nine kittens received a lesion; seven were imaged prior to the lesion and at different time points postlesion (middle column, 0 means “immediately after the lesion”). The right column shows the day postlesion when the animals were killed.
Before and after the lesion, kittens were housed in a laboratory environment with a 12:12-hour artificial light–dark cycle. They lived within a colony of cats and did not receive any specific training or treatment at any time.
Optical imaging of intrinsic signals
Surgery and optical imaging techniques have been described in detail elsewhere (Bonhoeffer and Grinvald, 1993; Bonhoeffer and Grinvald, 1996). All procedures were performed under sterile conditions. Animals were anesthetized intramuscularly with ketamine (20 to 40 mg/kg) and xylazine (Rompun, Bayer, Leverkusen, Germany, 2 to 4 mg/kg) and then intubated. They were placed in a stereotaxic frame and were artificially respired with a mixture of 60% N2O and 40% O2 with 0.7% to 1.5% halothane. Electrocardiogram, expired CO2, and body temperature were monitored throughout the experiment. A 4% glucose in saline solution was infused intravenously at 3 mL · kg−1 · h−1 throughout the experiment. To prevent eye movements, the infusion solution was supplemented with a fast-acting muscle relaxant, atracurium (Tracrium, GlaxoWellcome, Munich, Germany, 0.6 mg · kg−1 · h−1).
In the initial imaging session, the scalp was incised and retracted. A circular craniotomy was performed above area 17 (centered on P4, Horsley-Clarke coordinates), and a titanium chamber was cemented onto the skull. The chamber was filled with silicon oil and was sealed with a glass coverslip.
Animals were fitted with contact lenses to focus their eyes on a computer screen at a distance of 33 cm. For imaging of orientation preference maps, visual stimuli (VSG Series Three, Cambridge Research Systems, Rochester, UK) consisted of high-contrast square-wave gratings of 0.15 to 0.5 cycles/degree, drifting back and forth at 2 cycles/s and presented at 4 different orientations (0, 45, 90, and 135°).
For retinotopic stimulation, we presented drifting high-contrast square-wave gratings of 1 cycle/degree oriented at 0° or 90° within a 1°-wide horizontal aperture. Stimuli were presented in random order at 11 positions separated by 1°, from an elevation of 5° above to 5° below the horizontal meridian.
For both stimulation protocols, each stimulus lasted 3 seconds (data consisted of 5 frames of 600-millisecond duration) and was followed by a 9-second interstimulus interval during which the next stimulus was displayed but remained stationary. For the analysis, the first frame (after the onset of drift) was discarded.
For intrinsic-signal imaging, the cortex was illuminated with bandpass-filtered light of 707 ± 10 nm. At this wavelength, much of the intrinsic signal derives from increased light scatter of active brain regions, as opposed to the deoxy- versus oxyhemoglobin (oximetry) signal that dominates at wavelengths just above 600 nm. The increase in light scatter is caused by ion and water movement during neural activity and is therefore correlated more closely with electrical activity both in time course and spatial extent (Bonhoeffer and Grinvald, 1996). Responses to visual stimulation were captured by a cooled slow-scan CCD camera focused 500 μm below the cortical surface (ORA 2001, Optical Imaging, Germantown, NY, U.S.A.).
A control optical imaging experiment was carried out immediately before the photochemical lesion. A second recording session was conducted immediately after the lesion (n = 7), and subsequent experiments were carried out 4 (n = 3), 13 (n = 5), 33 (n = 3), and 40 (n = 2) days after lesion (Table 1).
After all but the final experiment, the chamber was half-filled with agar containing antibiotic (Paraxin, Bayer); the rest of the chamber was filled with silicone oil and sealed with a glass coverslip. Anesthesia was suspended; kittens were allowed to recover and were then returned to their mother and littermates.
Photochemical lesion
We used the photochemical lesion technique initially described by Watson et al. (1985) with some variations. We found that removal of the dura from the exposed cortical region was a requirement for the lesion to succeed. The cortical surface was carefully cleared and kept free from any traces of blood using Sugi sterile swabs (Kettenbach, Eschenburg, Germany). A krypton/argon 514-nm laser beam (Ion Laser Technology, Frankfort, IL, U.S.A.) light guide positioned 5 cm above V1 was directed towards the area of the cortex where the ischemic lesion was to be produced. Rose bengal dye, 10 mg/kg (Sigma, St. Louis, MO, U.S.A.), was injected during a 2-minute interval through the femoral vein; the cortex was illuminated simultaneously and for the next 12 minutes. The parameters ensured vascular occlusion in an area of approximately 3 mm (see Results).
Image analysis
Retinotopic and orientation preference maps
For producing retinotopic maps, signal averaging across 48 stimulus presentations was performed. Single condition maps elicited by orthogonal orientations (0° and 90°) at each of the 11 stimulus positions were divided by each other to obtain the response to the respective position.
For producing orientation preference maps, signal averaging across 128 to 192 stimulus presentations was performed. Iso-orientation maps were produced by dividing single condition maps by the “cocktail blank,” which consists of the sum of the images obtained in response to all four orientations (Bonhoeffer and Grinvald, 1993; Bonhoeffer and Grinvald, 1996). Twelve-bit digitized camera images were range-fitted such that the 1.5% most responsive pixels were set to black, and the least responsive were set to white. Signal amplitude was displayed on an 8-bit gray scale. “Polar” maps resulting from vectorial addition of the four iso-orientation maps were calculated (Bonhoeffer and Grinvald, 1993). The vector angle was displayed as hue; the length of the vector was encoded additionally as the brightness of the colors.
Measures of functional lesion
The area devoid of response to all four orientations in the polar maps was selected and measured using Scion Image (Scion Corp., National Institutes of Health, U.S.A.). These measurements were repeated for every kitten at each time point after the lesion and the mean ± SD was calculated. One-way analysis of variance (ANOVA) was performed to assess differences between “time post-lesion” groups.
Measures of retinotopic representation
Analysis of retinotopic representation was performed at each time point for every kitten, using IDL software (RSI, Boulder, CO, U.S.A.). We determined the cortical area for each stimulus position where a response above a fixed threshold (identical between stimuli and experiments) was observed, and calculated the number of pixels for which an above-threshold response was obtained for neighboring stimulus positions. The extent of “overlap” in the responses to abutting stimuli was taken as a measure for the divergence in the retinocortical projection, or in other words, as an indicator of the aggregate receptive field size.
Measures of orientation domains
Response area analysis was performed at each time point for every kitten, using routines written in IDL. Measures of the area of identical iso-orientation domains were done at all time-points and only those domains appearing in all imaging sessions in each subject were compared intrasubject. One-way ANOVA followed by a post hoc Scheffe test was performed to evaluate changes in area of identical domains measured at different time-points. Results represent the mean area (± SD) of the pooled data. Measures were based on the gray-scale values of pixels in the image obtained after high-pass filtering.
Histology and immunohistochemistry
On completion of the final imaging session (Table 1), animals received an overdose of barbiturate and were perfused transcardially with 0.9% saline followed by chilled 2% paraformaldehyde fixative in phosphate buffer. Brains were removed and postfixed at 4°C for 4 days and were then successively transferred to sucrose solutions (up to 30%). Serial 30-μm sections were cut at the level of the lesion on a cryostat and were processed for (1) cresyl violet (Nissl) staining, (2) cytochrome oxidase histochemistry, or (3) immunohistochemically for cow anti-rabbit glial fibrillary acidic protein (Dako, Carpinteria, CA, U.S.A. 1:1,000) using Vector Elite AVE kit (Vector, Burlingame, CA, U.S.A.) and diaminobenzidine (Sigma) as the final reaction product.
Volumetric measurements and reconstruction of the lesion
All Nissl sections containing an area of photochemically damaged tissue were used to calculate the volume of the lesion. Nissl sections were 30 μm thick and were separated by 45 μm. Serial sections were placed under a transilluminator (Northern Light, Quebec, Canada), and images of the lesion were acquired through a CCD camera (NEC, Santa Clara, CA, U.S.A.) attached to a computer. The area of the lesion in each Nissl section was measured using the Scion Image Software (Scion Corp., U.S.A.) and total volume lesion (Vol) was calculated as follows:
where As = area of lesion in one Nissl section, T = thickness of Nissl section (30 μm), K = tissue separating adjacent Nissl sections, and n = number of sections that contain the lesion.
These measurements were done for every brain, and the means ± SD were calculated. One-way ANOVA was performed to assess differences between groups killed at different time points.
All digitized images from Nissl sections were aligned using Image J (National Institutes of Health), and the three-dimensional reconstruction was rendered in two orientations (coronal and dorsal) using VolumeJ. Volumes from the reconstructed data were obtained with custom routines written with OpenDX (IBM), and were not statistically different from those obtained using Eq. 1.
RESULTS
Photochemically induced cortical lesion
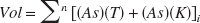
The morphology of the lesion as assessed through cresyl violet staining is shown in Fig. 1a. These sections showed a well-delimited conical lesion area (extending from layer I to layer VI), composed of pyknotic nuclei and surrounded by anisomorphic astroglia (Fig. 1a, 1b, and 1d). The core and glial scar of the lesion were evident at all time points. However, the volume of the lesion decreased over time (see following paragraphs).
Histologic verification of a photochemical lesion. Coronal sections of V1 from a kitten killed 13 days after lesion.
To compare the area of dead cells, as shown by pyknotic nuclei, with the region of metabolically inactive cells, we performed a cytochrome oxidase reaction (Fig. 1c). We found a close correlation between the area occupied by pyknotic nuclei and the region devoid of metabolic activity at all time points.
The functional area of the lesion as defined by the absence of orientation domains or retinotopic activity, was not significantly different among subjects imaged at the same time points. However, it decreased significantly with time in all subjects. The average area of the lesion measured from polar orientation maps was (mm2 ± SD) 2.92 ± 0.16 immediately after the lesion (n = 7), 2.05 ± 0.4 at 4 days after lesion (dPL) (n = 3), 1.06 ± 0.07 at 13 dPL (n = 5), and 0.61 ± 0.11 at 33 dPL (n = 3) (Fig. 2 and Fig. 3a and 3c). In addition, the volume of the lesion obtained from histologic sections decreased in parallel to the functional lesion, from (mm3 ± SD) 2.87 ± 0.33 at day 4, 0.87 ± 0.08 at day 13 to 0.39 ± 0.02 at day 33 (Fig. 3b, 3d). One-way ANOVA showed statistically significant differences (P < 0.05) in the reduction of functional and anatomic lesion area from day 4. Although there was a reduction of functional area from day 0 to day 4, it was not significant.
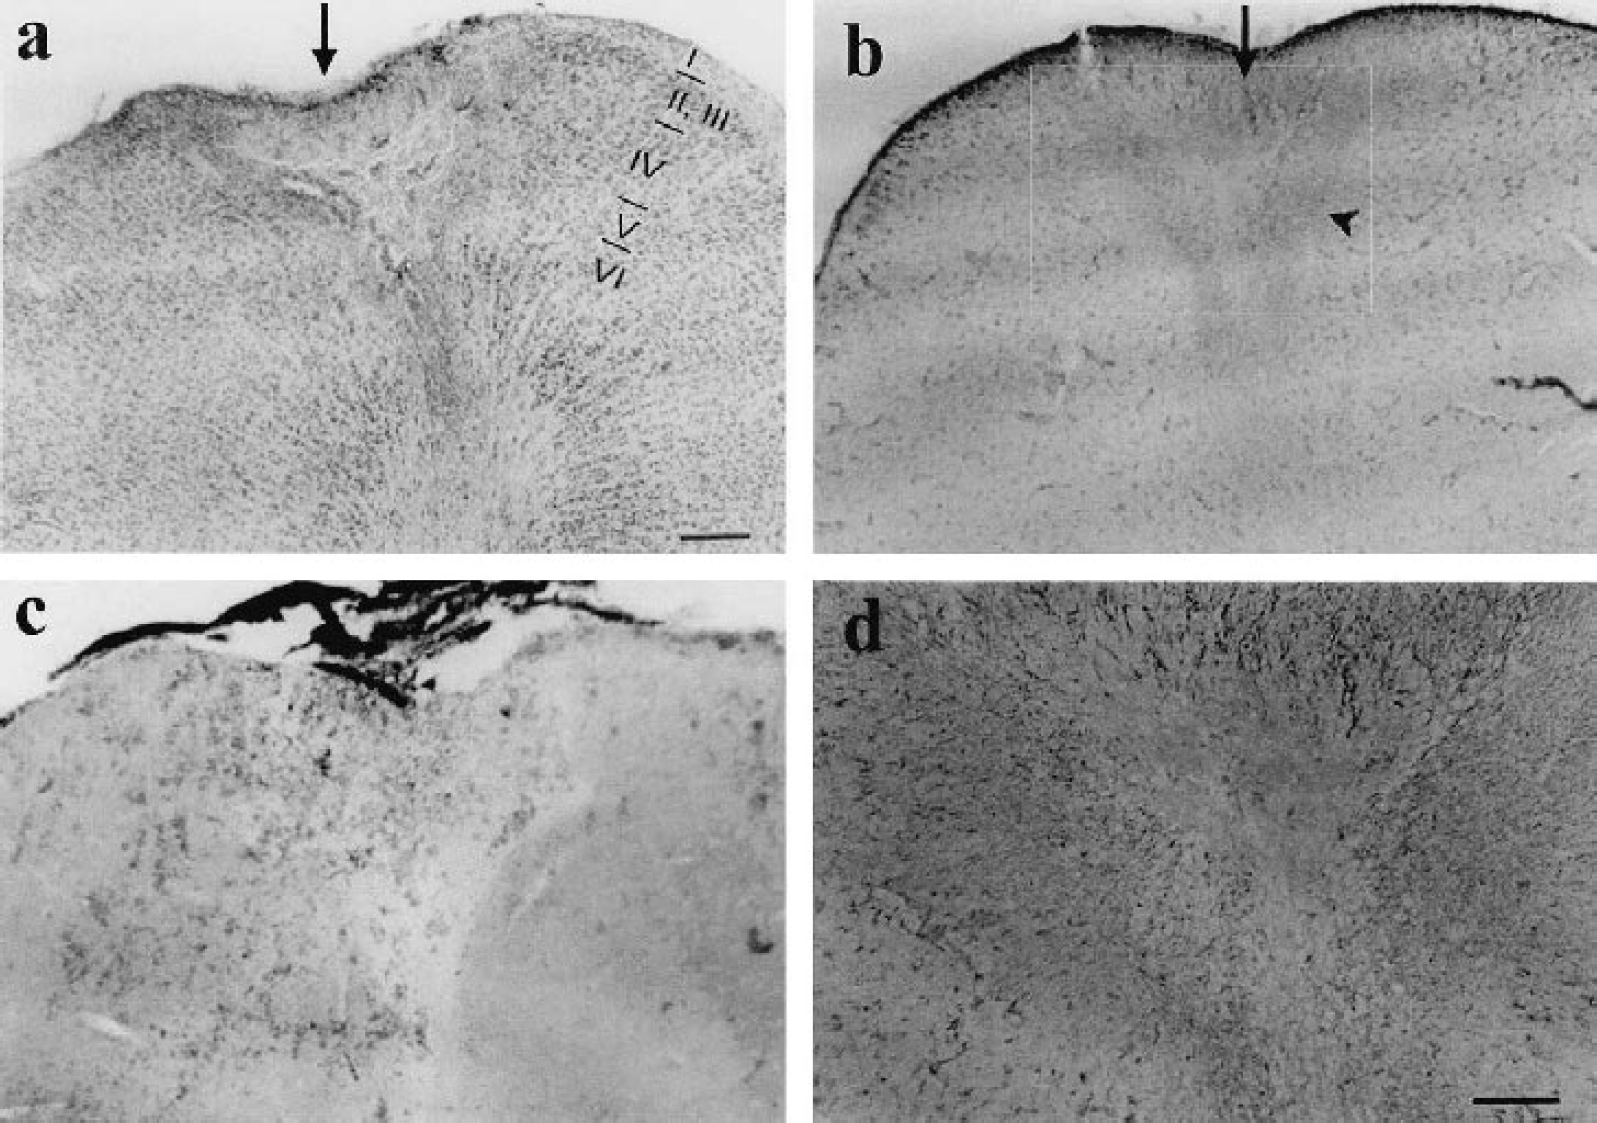
Temporal follow-up of blood vessel pattern (BVP) and orientation preference maps.
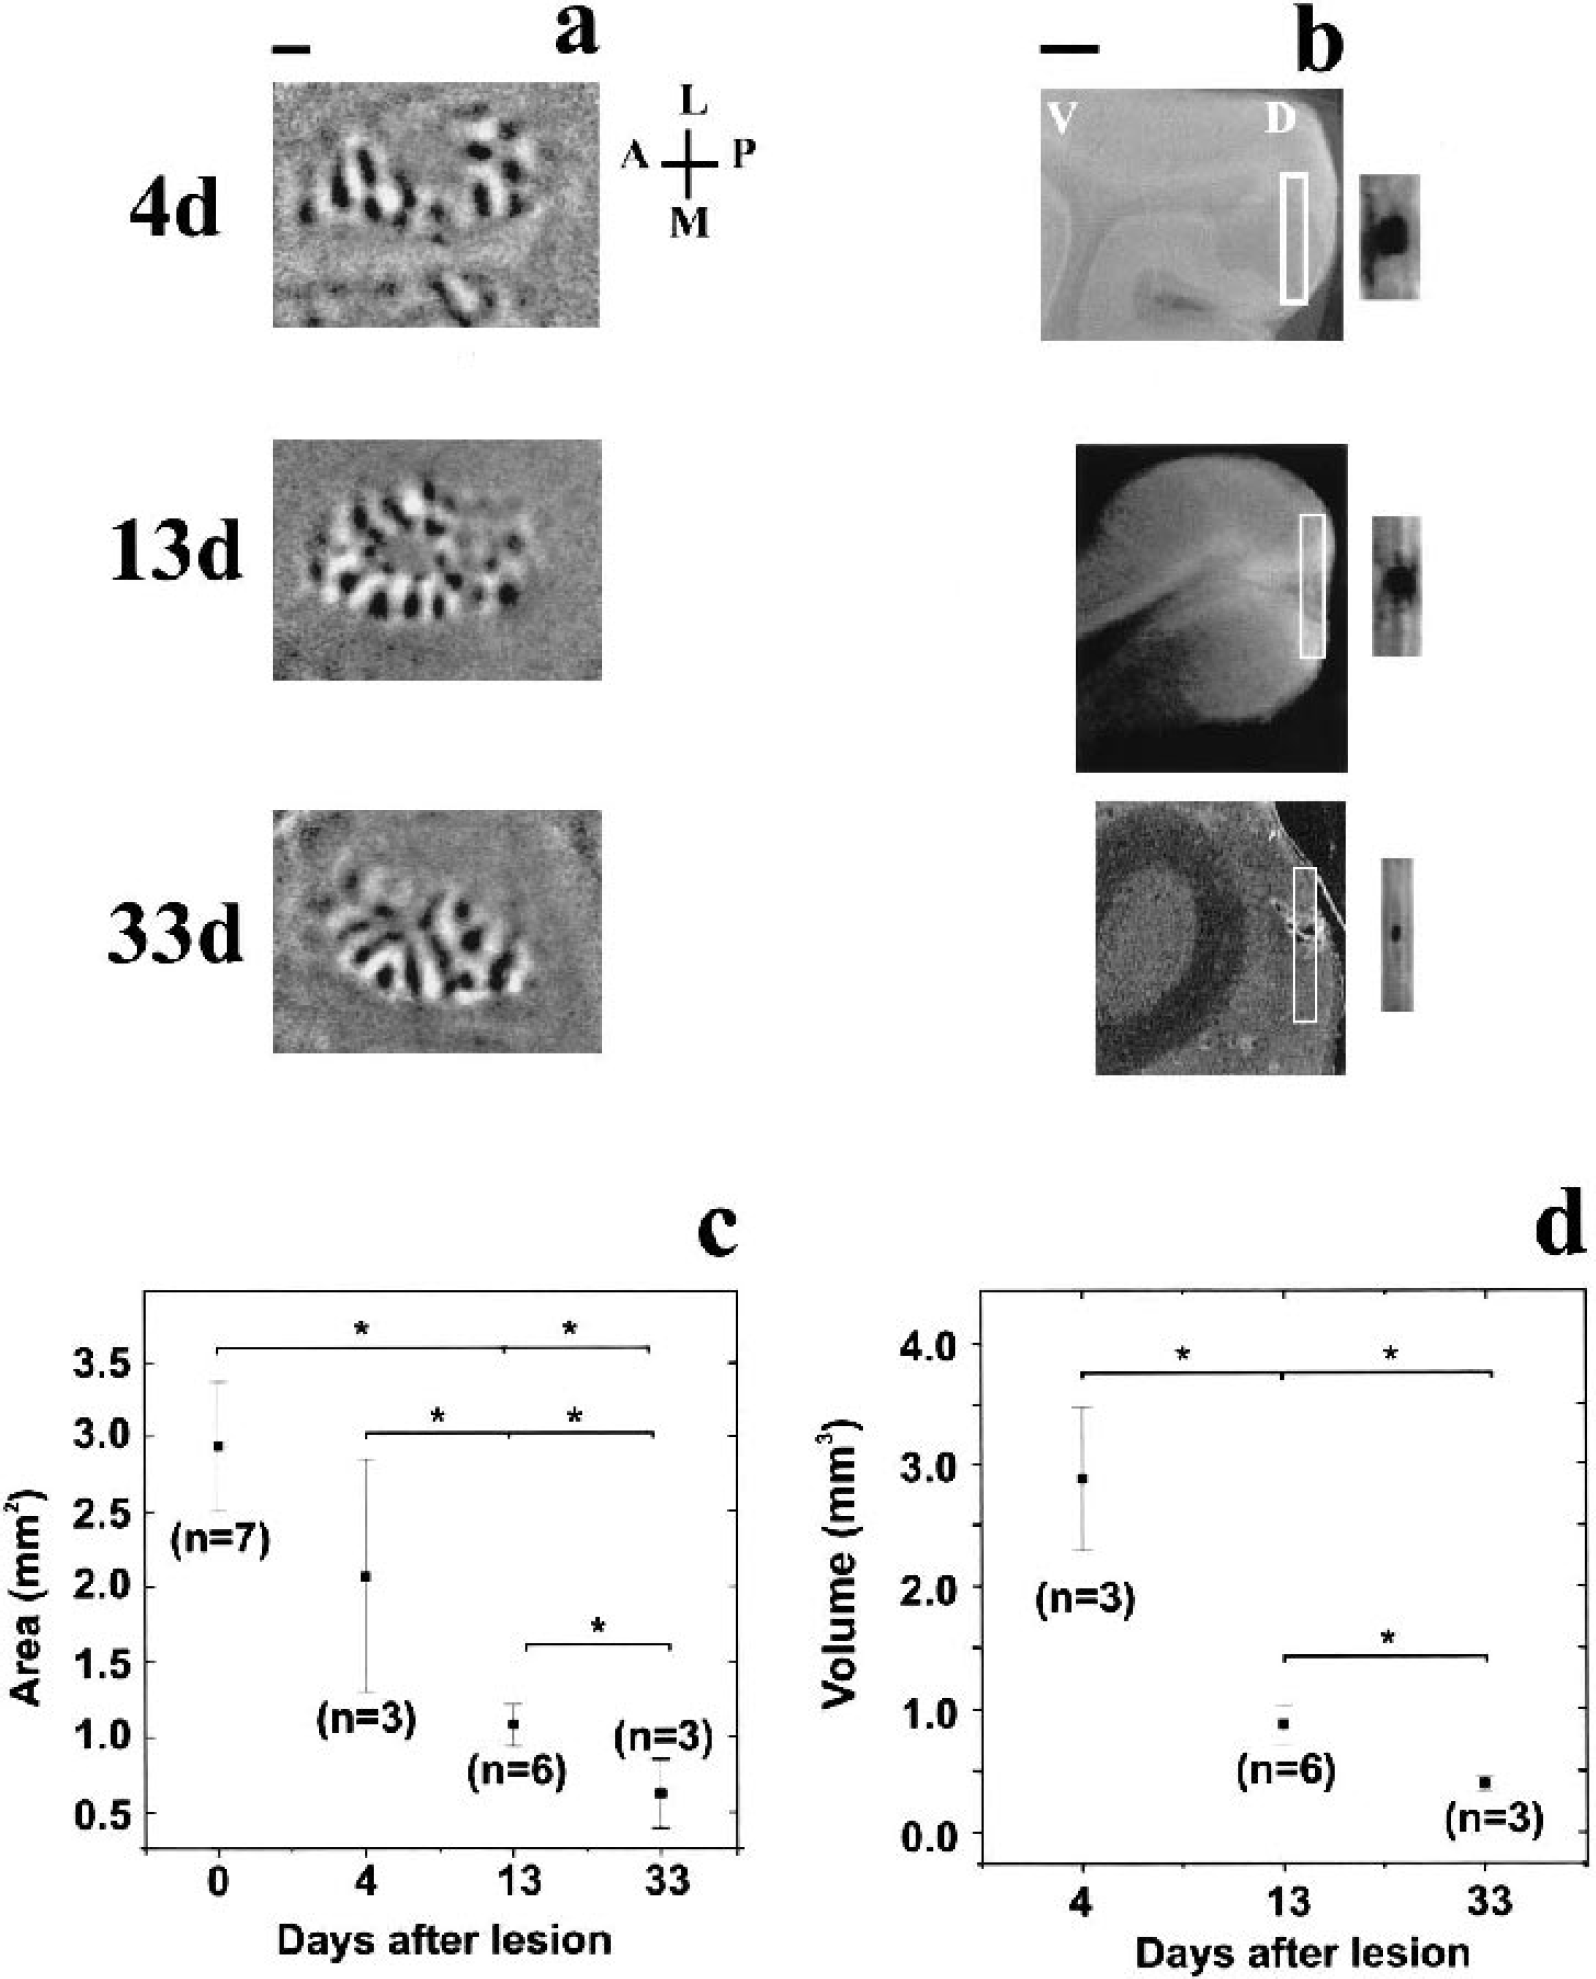
Functional and anatomic correlates of the decrease in size of the lesions through time.
Effects of the photochemical lesion on the orientation preference maps
Before inducing the lesion, orientation maps of the explored cortical area had the typical appearance of iso-orientation domains arranged around pinwheel centers (Fig. 2a). Immediately after the photochemical lesion, a circumscribed area of the functional layout of the cortex appeared disrupted, causing the disappearance of neuronal activity in an area of 3 mm2 (Fig. 2b). Domains just outside the silenced zone showed a decrease in area, but they recovered their original prelesion area by 13 dPL, (Fig. 2a–c and Fig. 4a–c, 4e, 4f). The area of some of these domains was increased further at 33 dPL when compared to the same domains measured prelesion, immediately after lesion, and at 13 dPL (Fig. 4a–d, 4f), whereas others did not change from 13 to 33 dPL (Fig. 4a–e). In contrast, the average area of domains not affected immediately after the insult (those further away from the lesion center) did not change significantly at any time point (Fig. 4a–d, 4g). In no case could emergence of new pinwheel centers be detected. These results show that after an ischemic insult some orientation preference domains, which were in closest proximity to the original lesion, not only recovered fully but increased in size by 33 dPL.
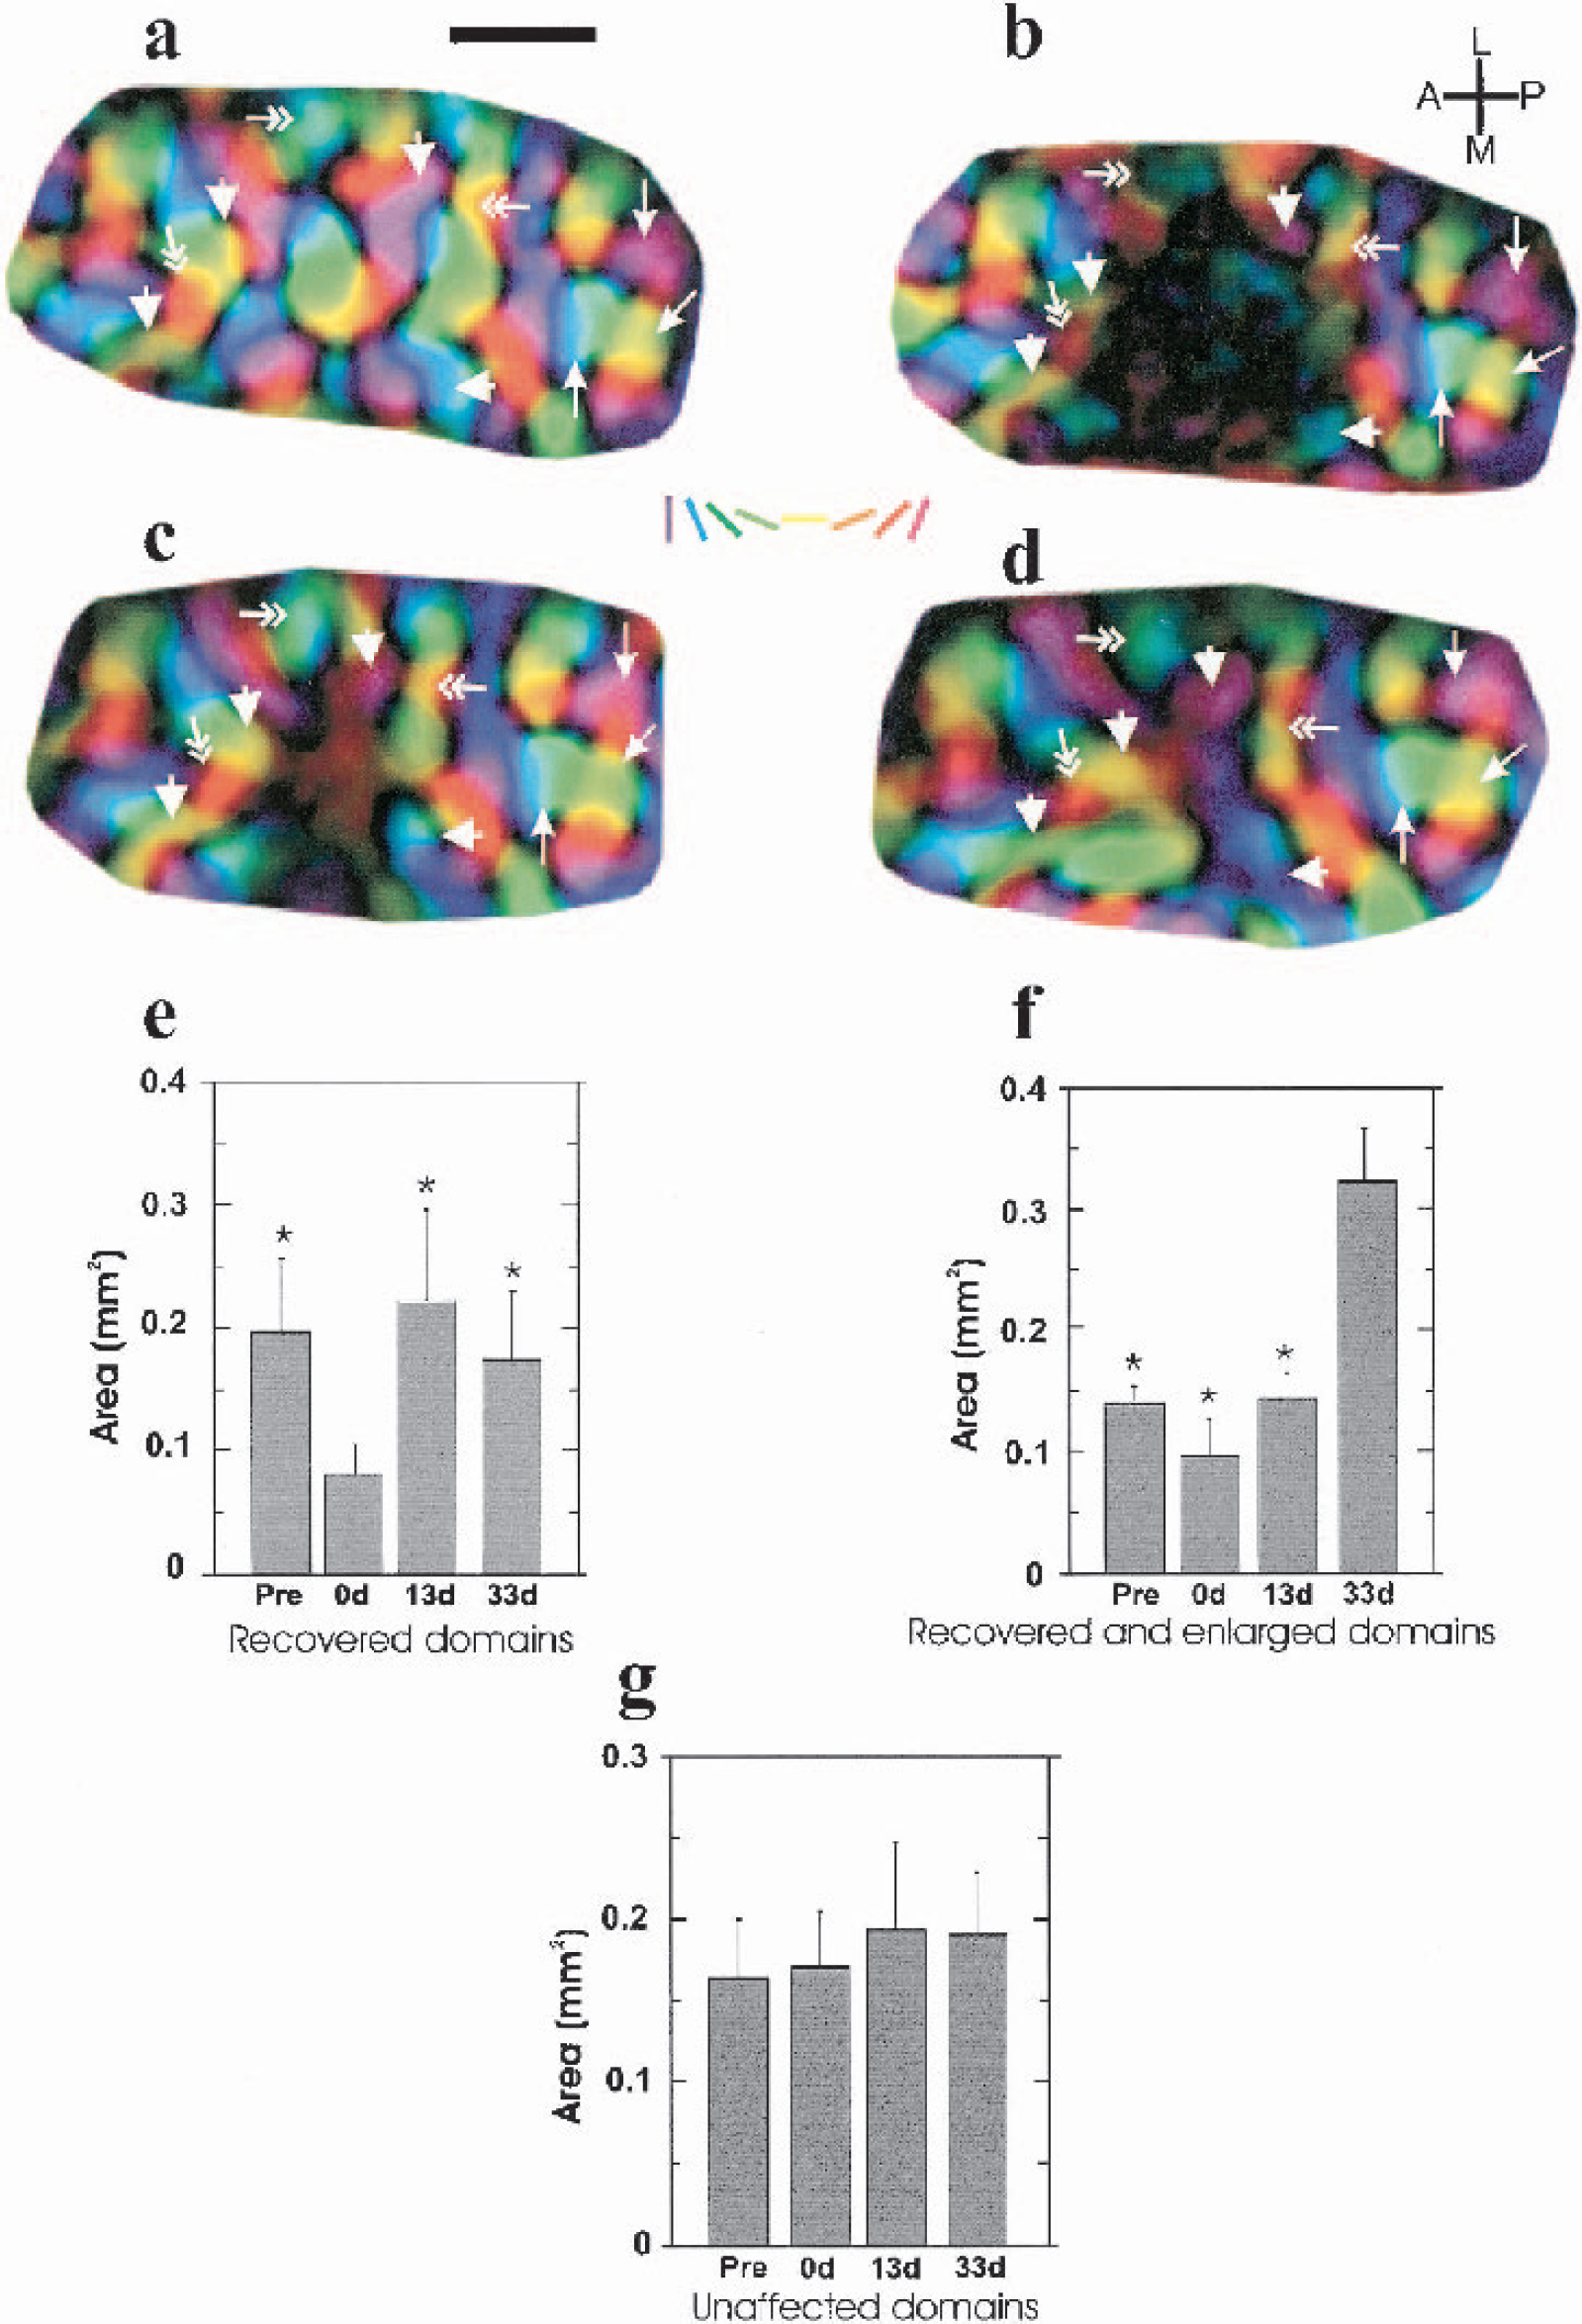
Temporal evolution of changes of orientation preference maps. (a-d) High magnification of polar maps of the imaged cortical area in one kitten
Effects of the photochemical lesion on the retinotopic maps
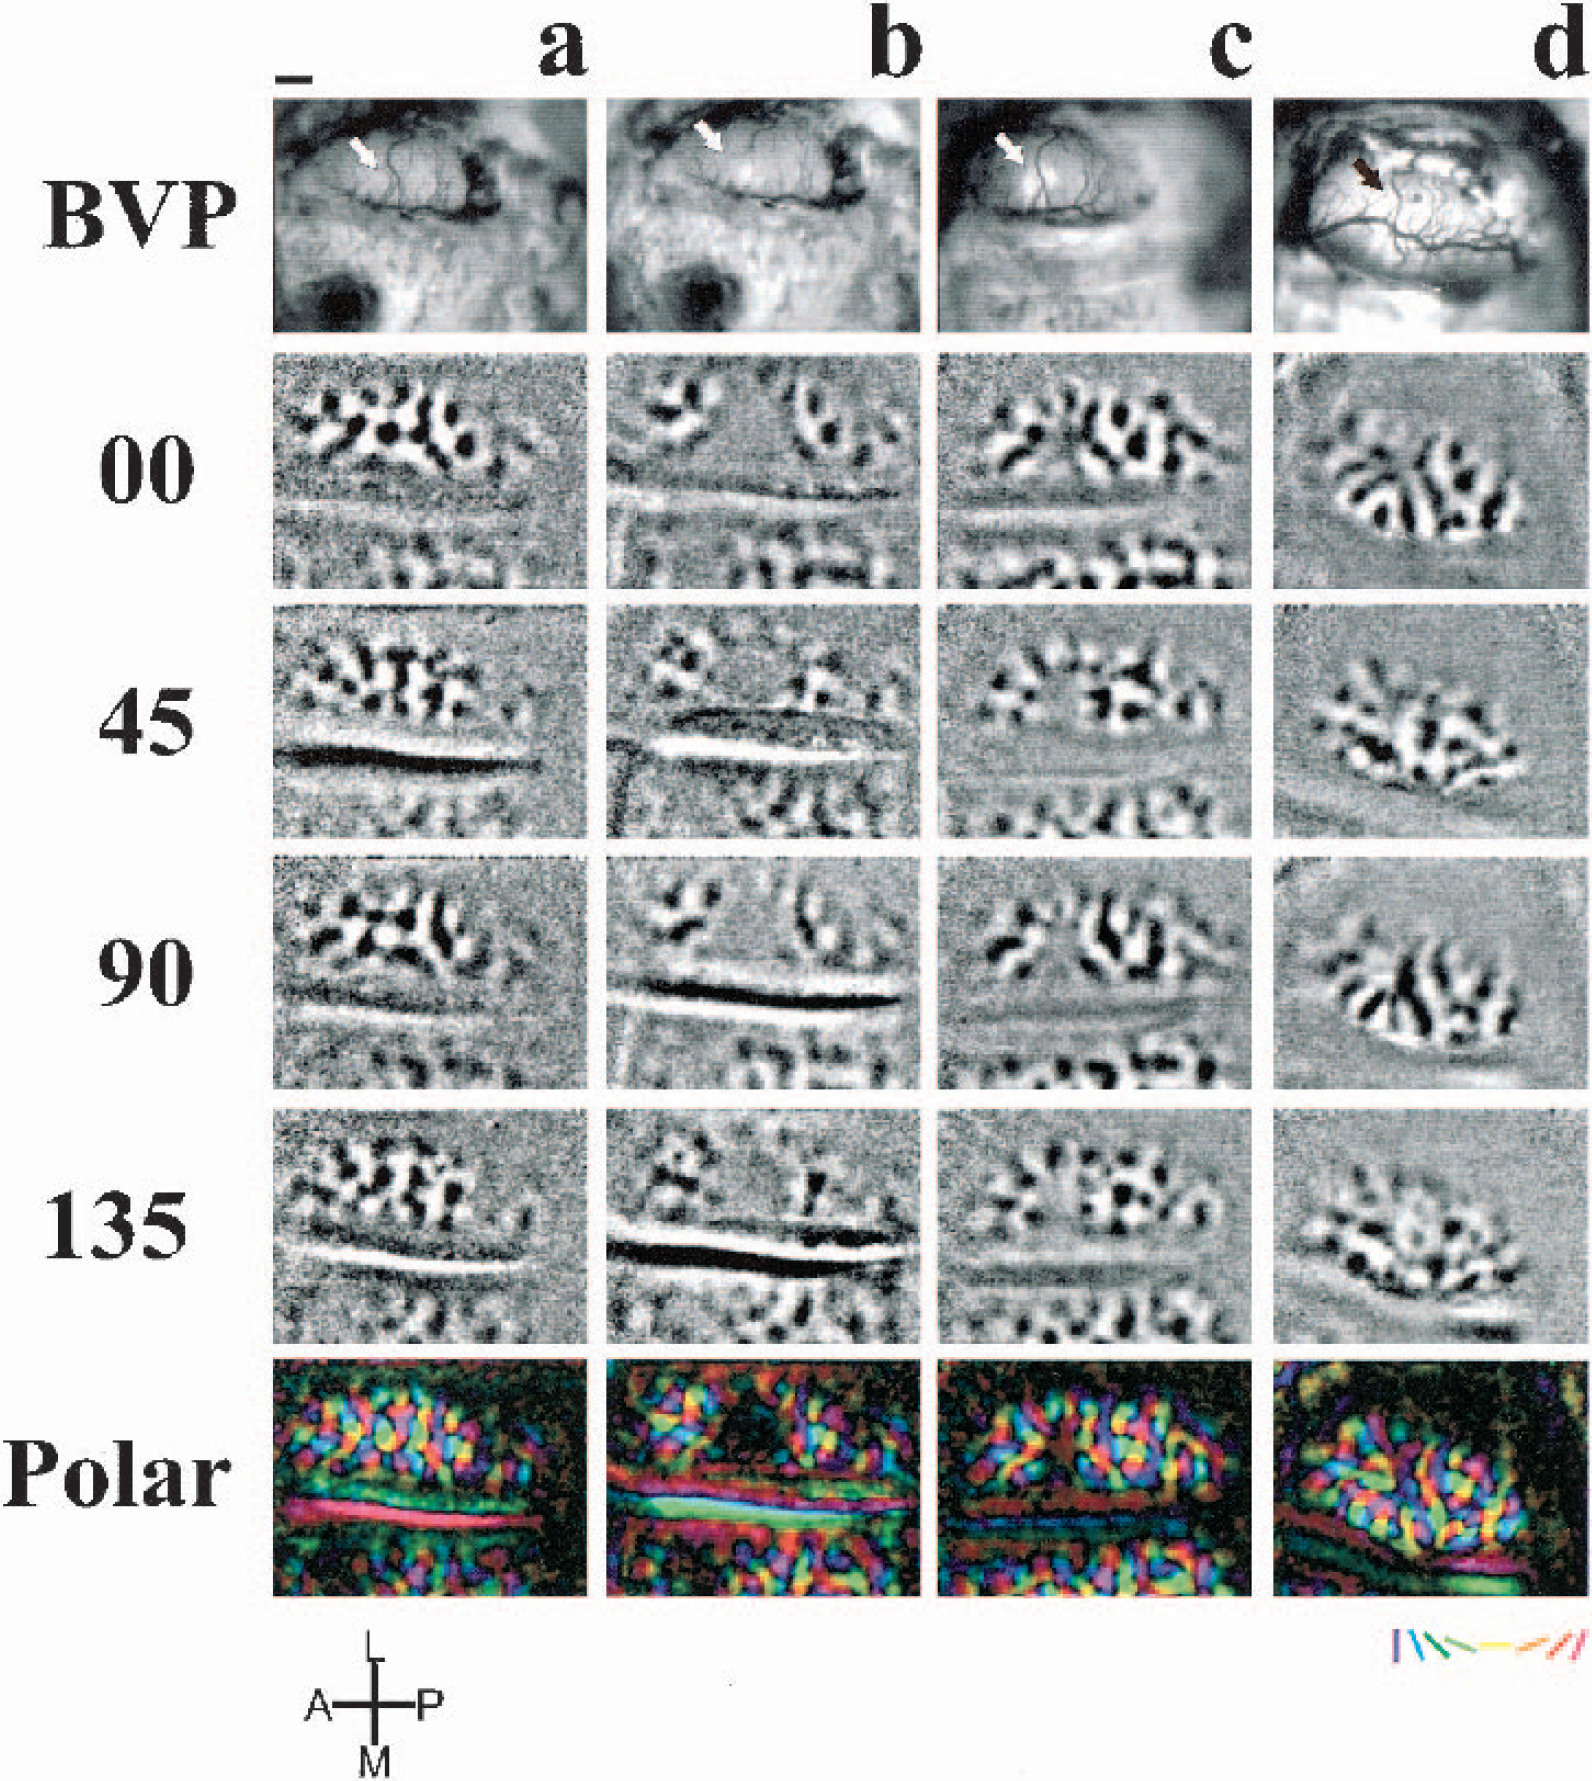
Typically, we found that before the lesion, two adjacent stimuli of 1° width each were sufficient for together eliciting responses in the complete imaged cortical area (4.42 × 3.32 mm2). The more dorsal (“upper”) stimulus evoked responses in the more posterior part and the more ventral (“lower”) stimulus responses in the more anterior part of the imaged region (Fig. 5a, c, d). In the example shown, the area of overlap between the two stimulus representations was 0.93 mm2 prelesion (Fig. 5e and 5f). Immediately after the photochemical lesion, the “upper” stimulus elicited activity only in the most posterior part of the imaged cortex, whereas the “lower” one evoked responses only in the most anterior region. Thus, there was virtually no overlap between the two stimulus representations (Fig. 5e and 5f). At 13 dPL, the cortical area covered by each of the stimuli was enlarged: the lesion area remained inactive, but each stimulus evoked responses in a larger cortical area, and an overlap zone of 0.24 mm2 of common activation was observed (Fig. 5e, f). The extent of cortical response evoked by each of the stimuli continued to grow in size, such that at 33 dPL the area of overlapping activation covered 0.46 mm2 and 0.59 mm2 at 40dPL (Fig. 5e–f). These results show that after a focal ischemic lesion, the retinotopic map reorganizes to some extent as the area responding to a stimulus of a given size increases, overlapping with adjacent, previously unresponsive areas. In other words, clusters of neurons near the lesion will respond to stimulation in an enlarged portion of the visual field, i.e., their aggregate receptive field size will have increased.
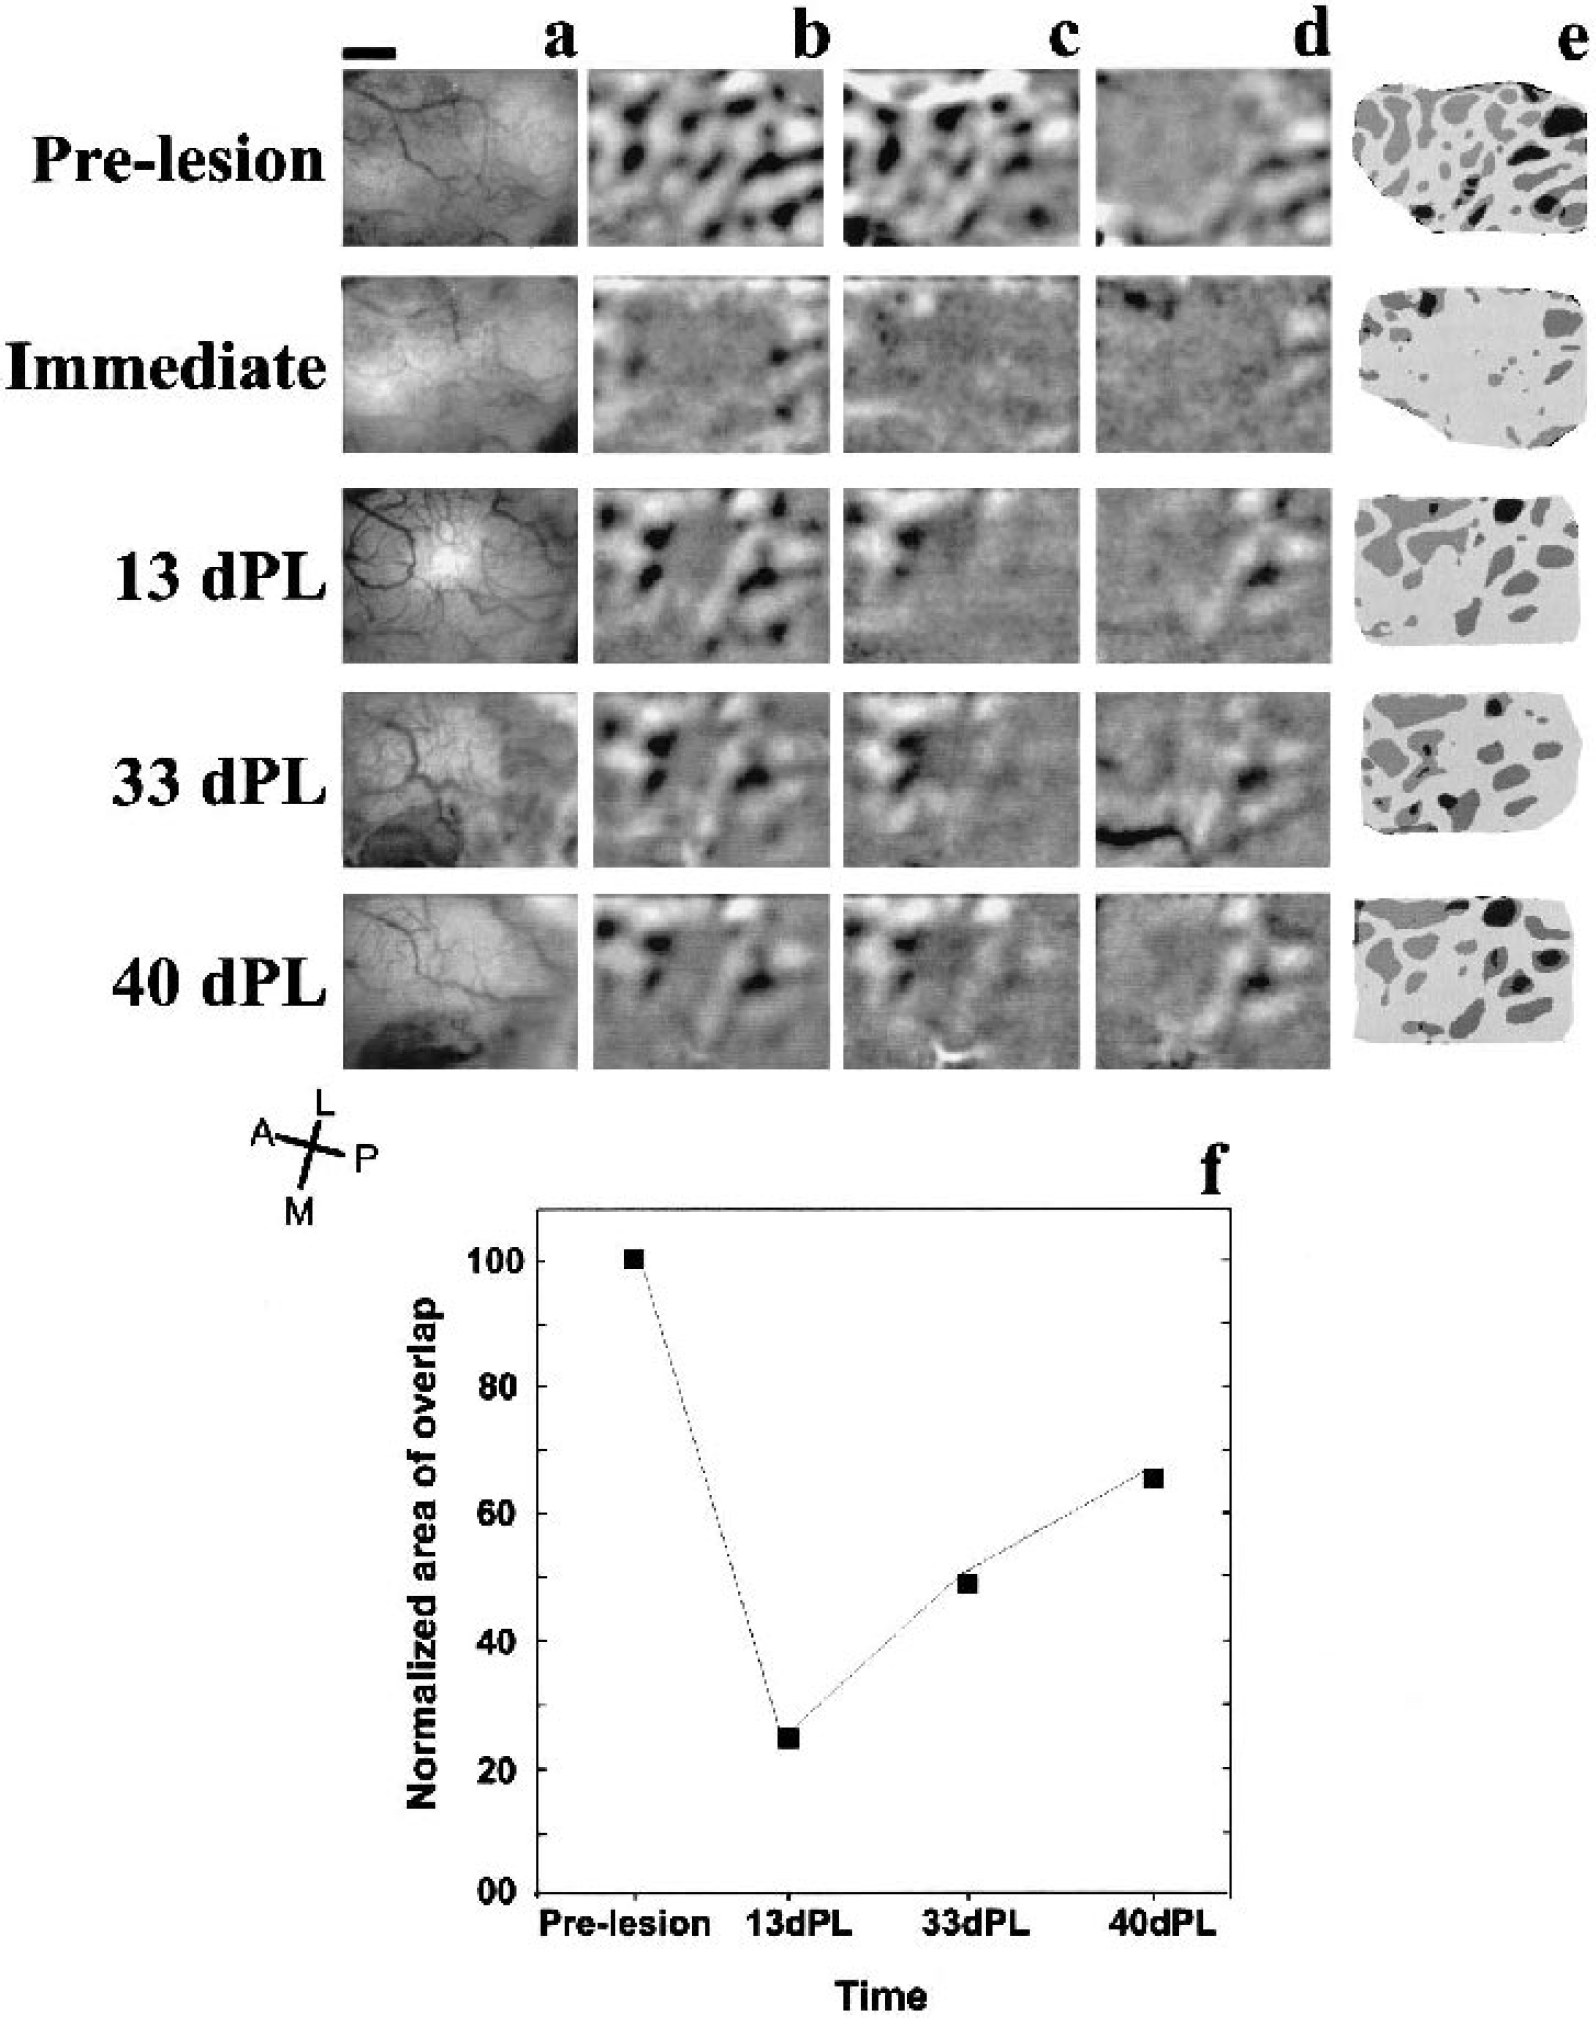
Longitudinal development of blood vessel patterns (BVP) and retinotopic maps in one kitten.
DISCUSSION
In the present study, we report functional reorganization at the borders of a focal ischemic lesion in the cat visual cortex within 5 weeks of recovery, in the absence of any training.
The visual cortex is arranged in columns, which are spatially and functionally interrelated. Given the retinotopic organization of V1, all the features in each point of the visual world must be represented and analyzed in a defined region of cortex, the so-called “hypercolumn” (Hubel and Wiesel, 1974).
The disruption or loss of one or more hypercolumns leads to the perception of a blind spot in the visual field (cortical scotoma). It has been shown that such scotomas can diminish over time after training, or to a lesser degree without, in adult humans (Kasten et al., 1998; Zihl and von Cramon, 1985).
Our results suggest a mechanism by which the reduction of the visual scotoma may occur. The “normal” overlap in cortical activation by two adjacent points in the visual field disappears after a focal lesion. However, the cortical area involved in the processing of information from one point in the visual field enlarges with time in such a way that areas initially not involved in the processing of information of that point in space now become activated.
Our results are in agreement with recent results from Eysel and Schweigart (1999), who report that 55 days after an excitotoxic lesion in cat V1, the receptive fields of cells surrounding the lesion were, on average, significantly enlarged. The technique used in the present study allowed us to monitor over time the responses of much larger groups of neurons, thus painting a more representative picture than that obtained through the recording of single neurons.
We show that a focal cortical lesion may also lead to the reorganization of the orientation preference map. Analysis of individual domains in the orientation maps revealed a two-step recovery process. First, some domains, which were immediately affected by the insult, recovered after 13 dPL. As has been previously suggested, this may rely on the metabolic reactivation of surviving cells after the ischemic shock (Sharp et al., 2000). The second process, which was observed at 33 dPL, involved the enlargement of previously existing domains and reflects a partial reorganization of the orientation preference map. At this time point, we observed some revascularization of the damaged zone only in some animals. Thus, even though perfusion could contribute to the cascade of events involved in the reorganization process, it does not seem to be a necessary condition for it to occur. The enlargement of cortical retinotopic representations and orientation domains observed in this study could represent a plastic mechanism common to different cortical areas (Doetsch et al., 1990; Eysel and Schweigart, 1999; Nudo et al., 1996). Therefore, our results suggest that mechanisms of cortical plasticity not only allow the reorganization of a topographic map but also of a stimulus feature map.
It is difficult to know why only some domains at the border of the original lesion expand, whereas others maintain their original size. It might simply reflect an anisotropy of the contraction of the scar. However, differential expansion of functional domains has been described previously in somatosensory cortex of enucleated animals (Bronchti et al., 1992; Rauschecker et al., 1992) and in subjects that had undergone whisker cauterization (Woolsey and Wann, 1976).
Plasticity of orientation preference maps has been well documented (Schuett et al., 2001; Sengpiel et al., 1999). However, despite this potential for experience-dependent modification of neuronal responses, the general layout of orientation maps seems remarkably robust. We, too, did not observe changes with respect to the number and position of pinwheel centers in the reorganizing visual cortex surrounding a focal lesion; therefore, any recovery appears to be limited to a restoration of responses that are very similar to those before the lesion.
The present work did not address the possible cellular mechanisms underlying the reorganization of the functional maps. However, plastic mechanisms involved in reorganization within the visual system are likely to depend on the level of the lesion. It has been suggested that early and long-term topographic remodeling of the visual cortex after retinal lesions (Gilbert and Wiesel, 1992; Kaas et al., 1990) is due to spared viable circuits providing cross-connectivity within the reorganized area (Calford et al., 1999), to functional reconnection at the level of the lateral geniculate nucleus (Eysel, 1982) and, to a greater extent, to axonal sprouting of lateral connections (Darian-Smith and Gilbert, 1994, 1995).
Several recent studies (Carmichael and Chesselet, 2002; Li et al., 1998; Stroemer et al., 1995) also describe axonal and dendritic sprouting in the border of ischemic cortical lesions. Axonal sprouting has been correlated with functional recovery (Stroemer et al., 1995) and has also been linked to enhanced synchronous neuronal activity in perilesion cortex (Carmichael and Chesselet, 2002). Another mechanism likely to contribute to the observed reorganization of functional maps is the increased propensity for synaptic long-term potentiation at the border of focal cortical lesions both in the somatosensory cortex (Hagemann et al., 1998) and in the visual cortex (Mittmann and Eysel, 2001). Experiments addressing modifications in cytoskeletal proteins and in the excitatory/inhibitory balance in our lesion model are currently being undertaken in our laboratory (A.Z. and C.A.).
Together with the observed functional changes, histologic results showed that the lesion, consisting of an area of pyknotic nuclei surrounded by anisomorphic astroglia, diminished over time. The temporal evolution of the histologic lesion in this study may be the result of a very localized and reproducible stroke induced by the photochemical procedure described here. This contrasts with other studies where functional deficits recovered within the penumbra area, while the structural lesion grew (Baird et al., 1997; see Dirnagl et al., 1999). The discrepancy may be the result of the focal lesion produced by our protocol, whereas in the above-mentioned studies, the initial lesion was extensive and not well defined.
It should be borne in mind that experiments described here were performed on kittens 8 to 12 weeks of age, within the latter part of the critical period of visual cortical plasticity during which manipulations of visual experience have the greatest effect on cortical representations of the visual input. Research on the molecular correlates of this increased susceptibility and on the reasons for its termination is still ongoing (for reviews see Katz, 1999; Sengpiel and Kind, 2002). Previous studies on visual cortical reorganization after more extensive lesions have shown that the scope for functional recovery in young animals is far greater than in adults (Payne and Lomber, 2002). This would suggest that the extent of recovery we observed in kitten visual cortex might represent an upper limit, unless the ability of the cortex to compensate focal lesions is not age dependent. Indeed, some functional reorganization of receptive fields after cortical lesions has been observed in adult cats, both within the first few days after the lesion (Schweigart and Eysel, 2002) and after 2 months of recovery (Eysel and Schweigart, 1999). This reorganization appears to be due to lesion-induced increases in excitability at the border of the lesion (Schweigart and Eysel, 2002).
One can only speculate as to why cortical reorganization is not more extensive in our model. It is possible that photochemical lesions (as opposed to thermal coagulation) do not allow synchronous neuronal activity to develop in the perilesion cortex, which appears to be a prerequisite for axonal sprouting (Carmichael and Chesselet, 2002). Furthermore, repeated anesthesia, which can prevent visual cortical plasticity during the critical period (Rauschecker and Hahn, 1987), may have also interfered with synaptic modifications necessary for a more extensive cortical reorganization. Finally, the ability to reorganize after lesions may simply be lower in the visual than in the motor or somatosensory systems. This is certainly true for peripheral nerve lesions, and it might also hold for the respective cortical areas.
The present results show that functional plasticity of retinotopic and orientation preference maps occur after a focal cortical lesion in V1. Reorganization of such representations suggests a mechanism by which the “filling in” process may occur, and may be the basis of functional recovery after a cortical scotoma in patients.
Footnotes
Acknowledgments:
We thank Tobias Bonhoeffer for generous support in the development of this project, and for providing animal and optical imaging facilities, Ulf Eysel for advice on the production of cortical lesions, Gerhard Brändle for developing image analysis software, Michael Abramoff for providing a copy of VolumeJ rendering engine, Iris Kehrer and Frank Brinkmann for technical assistance, and Gabriel Gutierrez for helpful comments on the manuscript.