
Abstract
Cerebral metabolic rate for oxygen (CMRO2) and cerebral oxygen extraction fraction (OEF) are some of the most fundamental parameters to characterize the pathophysiologic status of cerebral tissue. Although O-15-labeled gases inhalation method is performed in clinical studies, application of the inhalation method on small animals requires too many intensive procedures. On this basis, the development of a new method to measure CMRO2 and OEF in small animals is of interest. This study was aimed at developing a method to assess CMRO2 and OEF using intravenously injectable oxygen (injectable 15O–O2) for small animals such as rats. Injectable 15O–O2, 72 MBq/mL of radioactivity, was obtained after 15O–O2 gas circulation into the artificial lung. OEF after injection of injectable 15O–O2 was calculated using the same equation as that applied to the bolus inhalation of 15O–O2 gas method. Values of 44 ± 4.5 mL · min−1 · 100 g−1 of CBF and 0.54 ± 0.11 of OEF were obtained (n = 13). This OEF value was well accordance with OEF evaluated by arterial-venous difference of oxygen concentration (0.57 ± 0.13). This method is useful to study the CMRO2 and OEF in small animals using an animal positron emission tomography system. It may accelerate the basic research of several cerebral perfusion diseases.
Brain activity is maintained using energy produced by aerobic glycolysis, which occurs under consumption of glucose and oxygen as energy sources. These energy sources are transported into the brain through the blood–brain barrier. The condition of brain activity reflects the cerebral blood flow (CBF), cerebral oxygen extraction fraction (OEF), cerebral metabolic rate for oxygen (CMRO2), cerebral metabolic rate for glucose, and so on. It is useful to monitor these parameters to estimate the brain activity (Mintun et al., 1984). In particular, cerebral circulation diseases induce variations in OEF. Measurement of OEF is extensively carried out for diagnosis of cerebral lesions by positron emission tomography (PET) (Grubb et al., 1998; Yamauchi et al., 1996; Yamauchi et al., 1999a; Yamauchi et al., 1999b). Cerebral oxygen extraction fraction measurement by PET is generally performed by the inhalation method using positron-emitting nuclide, O-15-labeled oxygen gas for clinical use.
Cerebral oxygen extraction fraction measurement of small animals such as mice and rats is of great interest because many pathologic models using small animals can be obtained owing to the recent development of techniques for gene modification. Application of the inhalation method using 15O-oxygen to these small animals is technically complicated since the influence of high radioactivity in the inhalation tube on the rat brain data acquisition cannot be negligible. No OEF measurement using small living animals has been reported yet. Moreover, the inhalation method is very complicated in conscious monkey studies since it is necessary to have many training sessions to teach the animals to breathe in from the inhalation tube.
On this basis, the development of a new method to estimate OEF in small animals is of interest. For this purpose, intravenously injectable oxygen has a great advantage. We report on the development of an injection method for 15O-oxygen and the estimation of rat OEF using this method in this article. Thereafter, injection of 15O-oxygen is termed injectable 15O-O2.
MATERIALS AND METHODS
Male Wistar rats (250 to 350 g) were supplied by Japan SLC Co. (Hamamatsu, Japan). The animals were housed for 1 week under a 12-h light/12-h dark cycle and had free access to food and water. The animal experiments in this study were conducted in accordance with institutional guidelines and approved by the Kyoto University Animal Care Committee.
Production of O-15
Oxygen-15 was produced by the 14N(d,n)15O nuclear reaction with a 0.5% O2/N2 gas target at a 17-μA current of deuteron accelerated by an in-house cyclotron CYPIS-325 (Sumitomo Heavy Industries, Ltd., Tokyo, Japan). The bombarded target gas including the produced 15O-O2 in the target box was continuously transported to a CUPID system to obtain high radiochemical purity of 15O-O2. 15O-O2 gas was then transferred to an injectable 15O-O2 preparation system or 15O-water synthesizer.
Preparation of 15O-water
15O-water was synthesized by reduction of 15O-O2 with H2 gas (catalyzed by Pd black at 140°C). The synthesized 15O-water gas, trapped in a saline solution, was then used for animal experiments after passing through a 0.22-μm millipore filter.
Preparation of injectable 15O-O2
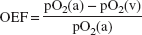
An infusion line kit (Terumo Corporation, Tokyo, Japan) was used as a blood reservoir. This line and an artificial lung (Senko Medical Instrument Mfg Co. Ltd., Tokyo, Japan) were connected through a peristaltic pump (EYELA roller pump RP-1000, Tokyo Rikakikai Co. Ltd., Tokyo, Japan) to make a closed system (Fig. 1). The artificial lung was specially designed for small animals such as the rat, which has an inner blood volume of 3.3 mL. To the artificial lung, an input line of 15O-O2 gas and a waste line were connected.
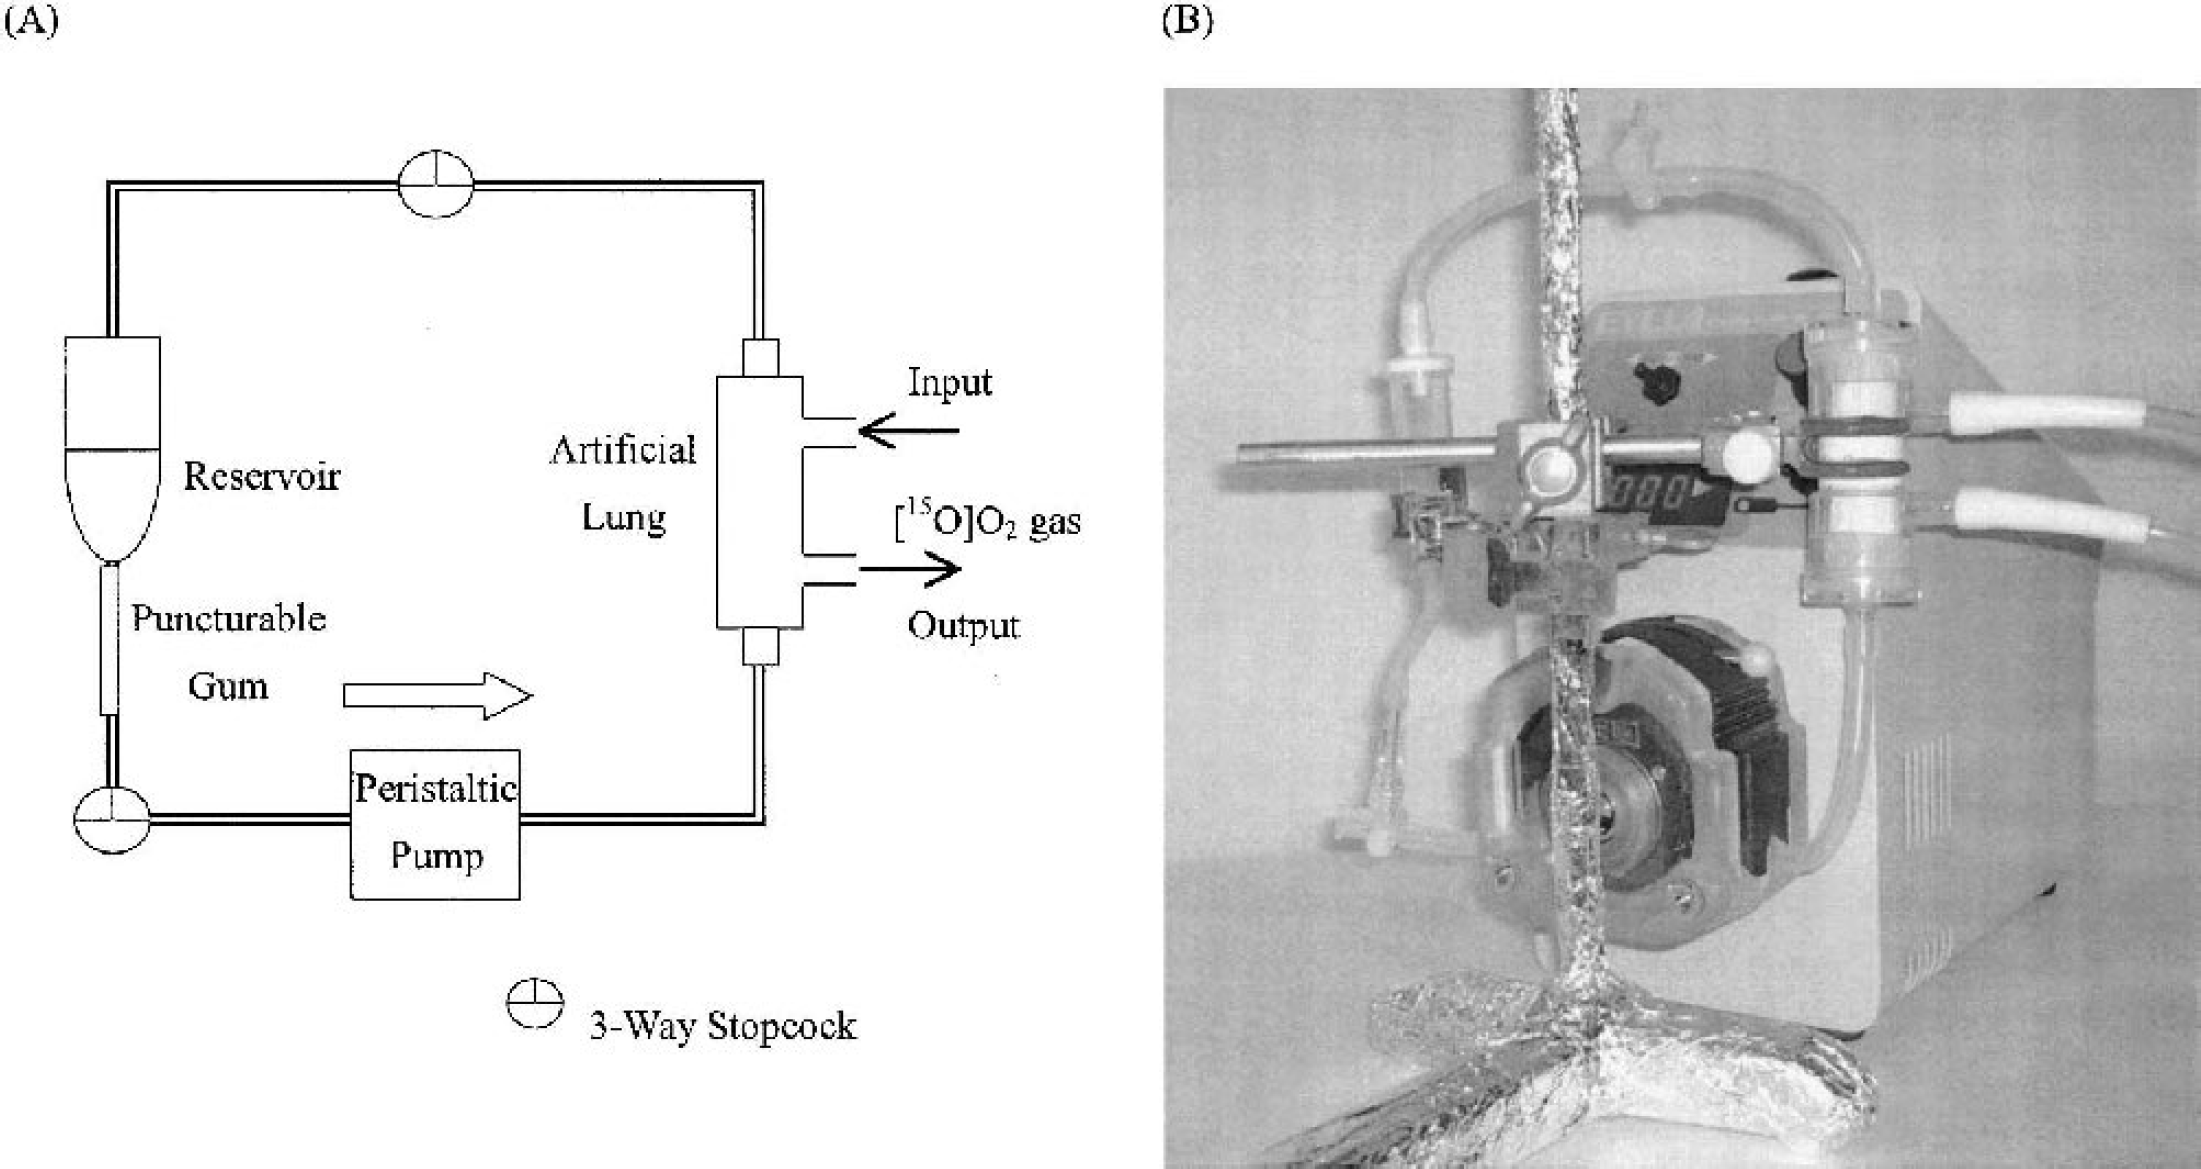
Injectable 15O-O2 preparation system.
Arterial blood was sampled into a plastic tube containing heparin from rats under diethyl ether anesthesia. Blood clots were removed by filtration using a gauze pad wetted with saline. Then, 10 mL of blood was circulated in the artificial lung to prepare injectable 15O-O2. 15O-O2 gas was circulated in the artificial lung at 4,700 MBq · 500 mL−1min−1.
Animal PET scanner
PET studies were performed with a multislice positron emission computer tomography scanner for animals (SHR-7700L, Hamamatsu Photonics, Hamamatsu, Japan). The scanner was designed for scanning a small animal. For a high-resolution animal study, the system was modified with compact PS-PMT detectors, achieving a spatial resolution of 2.7 mm in the plane and 3.3 mm in the axial direction as the full width at half maximum (Watanabe et al., 1997).
Animal preparation
The animals were starved for 6 h before radiopharmaceutical administrations. The rats were anesthetized with IP pentobarbital (50 mg/kg), and subsequent experiments were performed under pentobarbital anesthesia. A PE 20 catheter (i.d. 0.5 mm, o.d. 0.8 mm) was then inserted into the left femoral artery for blood sampling. After completion of the operation, the animals were administered IV with 100 IU heparin. The animal was placed in a supine position in a stereotaxic apparatus, and the head was restrained by mouth and ear bars. After acquisition of a blank scan for 180 minutes, the apparatus was placed in a PET camera. The position was standardized with the aid of a laser beam, and the desired cranial position in the camera was oriented.
H215O PET scan and blood sampling
After a 30-minute transmission scan for attenuation correction, dynamic PET scan was initiated after intravenous administration of H215O. The total scan acquisition period was 120 seconds and the injection dose was 111 to 148 MBq. The scan consisted of 12 10-second scans. Arterial blood sampling (10 μL) was performed at 4-second intervals for 2-minute postinjection of 15O-water. The radioactivity of each sample was counted with an NaI well scintillation counter (Packard Auto-Gamma 500, Packard Instruments, Meriden, CT, U.S.A.) calibrated by counting with a 22Na standard radioactive source. After PET data acquisition, 200 μL arterial blood was sampled and centrifuged at 1,500g, 4°C for 5 minutes to measure the radioactivity both in the plasma and in the whole blood.
15O2 PET scan and blood sampling
Cerebral blood flow measurement studies were followed by OEF measurement studies after the radioactivity had decayed in the bodies. After sampling 100 μL arterial blood to determine blood gas data, injectable 15O-O2 (37–74 MBq) was administered via the tail vein over a 30-second period. Dynamic PET scanning (10 seconds × 12 frames) was initiated at the time of injection. The starting time of the injection was defined as time 0. Arterial blood sampling (10 μL) was performed at 5-second intervals for 2 minutes after injection of injectable 15O-O2. At 30, 60, 90, and 120 seconds after injection, 200-μL samples of arterial blood were taken at each time point and centrifuged at 3,000g, 4°C for 5 minutes to measure the radioactivity both in the plasma and in the whole blood. 15O-H2O gradually appears in the arterial whole blood because of the metabolism of 15O-O2 in the body. The time activity curve of 15O-H2O in the arterial whole blood after injection of injectable 15O-O2 was estimated as follows. Radioactivity in the plasma (at 30, 60, 90, and 120 seconds after injection of injectable 15O-O2) was multiplied by 0.9, which is the remaining ratio of 15O-H2O in the whole blood versus that in the plasma, and the obtained values were linearly interpolated from 0 time to the end time point of the scan. Then, the time activity curve of 15O-O2 was obtained by subtraction of the radioactivity of 15O-H2O from the total radioactivity in the whole blood.
Measurement of arterial-venous difference in oxygen concentration
After the PET scan of injectable 15O-O2, venous blood was obtained from the superior sagittal sinus as soon as possible. Oxygen partial pressures of both the arterial blood [pO2(a)] and venous blood [pO2(v)] were measured using a blood gas analyzer (Rapidlab 348, Chiron Diagnostics Ltd., Essex, England). OEF was calculated using the following equation:
Data analysis
After the dead-time correction and attenuation correction, the images were reconstructed according to a standard filtered back projection method. Correction was made also for the radioactivity decay, back to the time of the PET scan initiation. The rat brain was visualized in four consecutive coronal slices using the PET scanner. Then, the region of interest (ROI) on the whole brain in each slice was visually chosen according to the magnetic resonance image, and time activity curve (TAC) of the brain was calculated by averaging of ROI data obtained from four slices. Activities in ROI were calibrated by the cross calibration factor (calculated by another phantom study with a 10-cm-diameter hollow phantom).
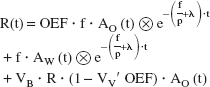
The CBF value was derived by numerically solving the equation shown in Eq. 1 (Iida et al., 1994). R(t), the tissue concentration of O-15 radioactivity, was measured by PET; and Aw(t), the arterial concentration of 15O-water radioactivity in the blood samples, was derived as an input function. The X in the circle is the convolution operator. The CBF (f), scan time immediately after injection of 15O-water (t), partition coefficient of water between the brain and blood (p), and physical decay constant of O-15 (λ) were used in the calculation.
It is assumed that the biodistribution of the radioactivity after injection of injectable 15O-O2 is equivalent to that of postbolus inhalation of 15O-O2 gas. Then, OEF was calculated using the same equation as that applied to the bolus inhalation of 15O–O2 gas method. A modified approach of Mintun et al. (1984) was used to calculate OEF as described previously (Eq. 2)(Shidahara et al., 2002). In the following equation, AO(t) is the arterial concentration of 15O–O2 radioactivity in arterial blood, VB is cerebral blood volume, R is the hematocrit ratio between central and peripheral regions, and VV′ is the effective venous ratio in the brain. Other symbols are mentioned above.
RESULTS
Preparation of injectable 15O–O2
The preparative conditions of the injectable 15O–O2 are summarized below. The most effective factor on the absorbency of 15O–O2 into the blood through an artificial lung is the circulation rate of blood in the preparation system. Figure 2 shows the effect of the circulation rate on the absorbency. The highest absorbency was observed at 100 mL/min. A peak value was obtained at 15 minutes after the start of circulation, and a plateau was observed after the peak. The experiment was performed in an air-conditioned room at 27°C. The radioactivity of injectable 15O–O2 was 72 MBq/mL under these preparation conditions. After the preparation of injectable 15O–O2, more than 98% of the radioactivity in the blood was observed in the red blood cells fraction (data not shown). This means the absorbed radioactivity of 15O–O2 bound to hemoglobin in the red blood cells.
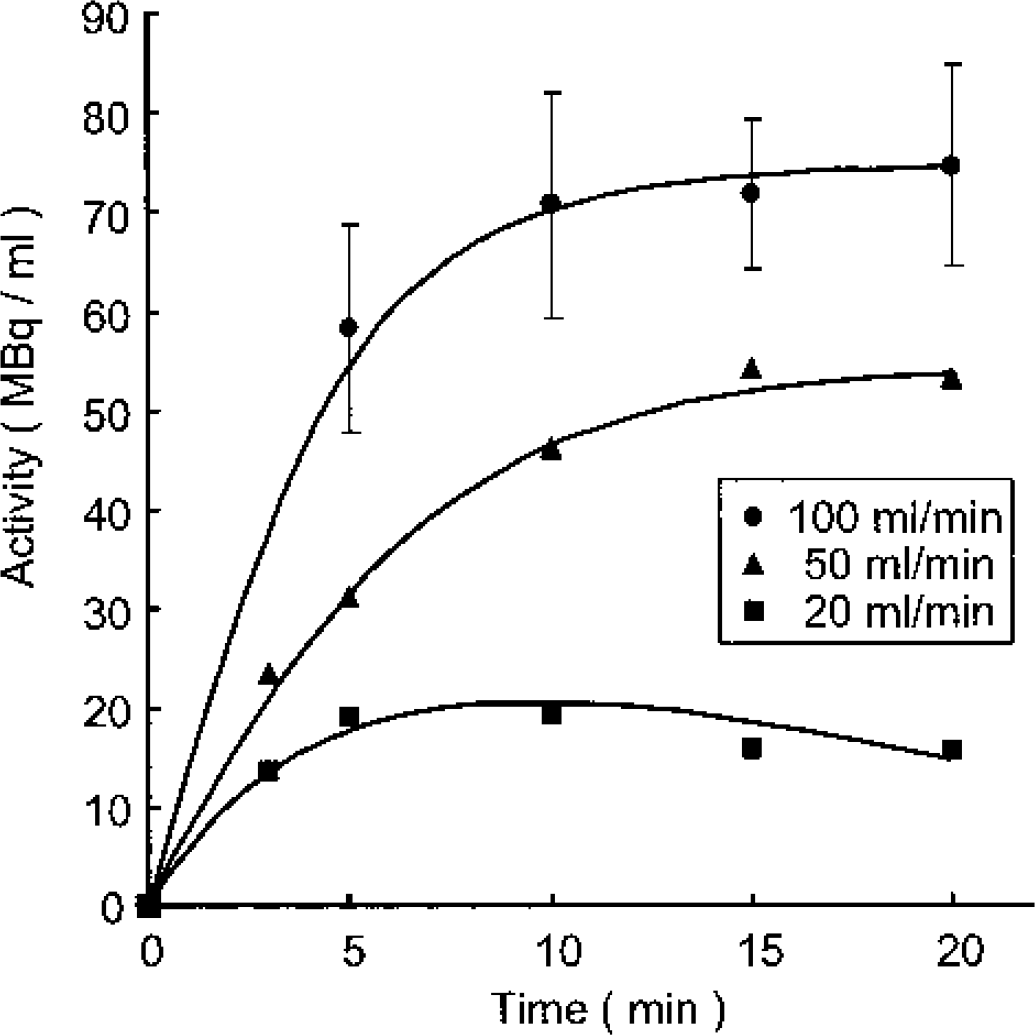
Effect of blood circulation rate in the artificial lung on the radioactivity of injectable 15O–O2. Number of experiments: 100 mL/min (n = 3), 50 mL/min (n = 1), 20 mL/min (n = 1). 15O–O2 gas flow rate was 500 mL/min, including 4,700 MBq/min of 15O–O2.
TAC of arterial blood after injection of injectable 15O–O2
Figure 3 shows the TAC of arterial blood after injection of 40 MBq of injectable 15O–O2. Although more than 90% of the total activity in the blood at 30 seconds after injection was derived from 15O–O2, almost 100% of the total activity at 90 seconds was derived from 15O-H2O. Similar values were observed between the radioactivity in the blood and that in the brain (Fig. 4A).
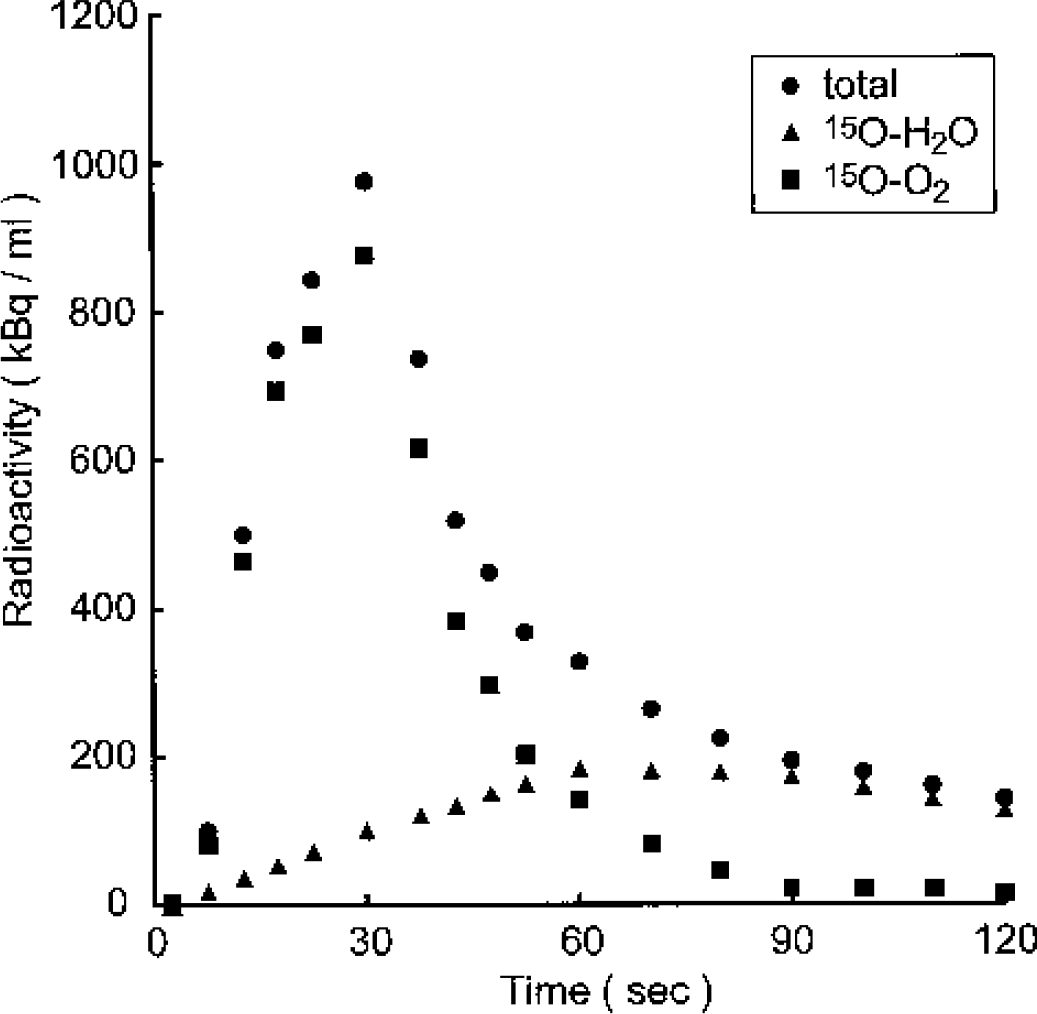
Time activity curve after injection of injectable 15O–O2 in the blood. Total: total radioactivity concentration in the blood; 15O-H2O: 15O-water fraction in the blood (0.9 × radioactivity concentration in the plasma); 15O–O2, 15O–O2 fraction in the blood.
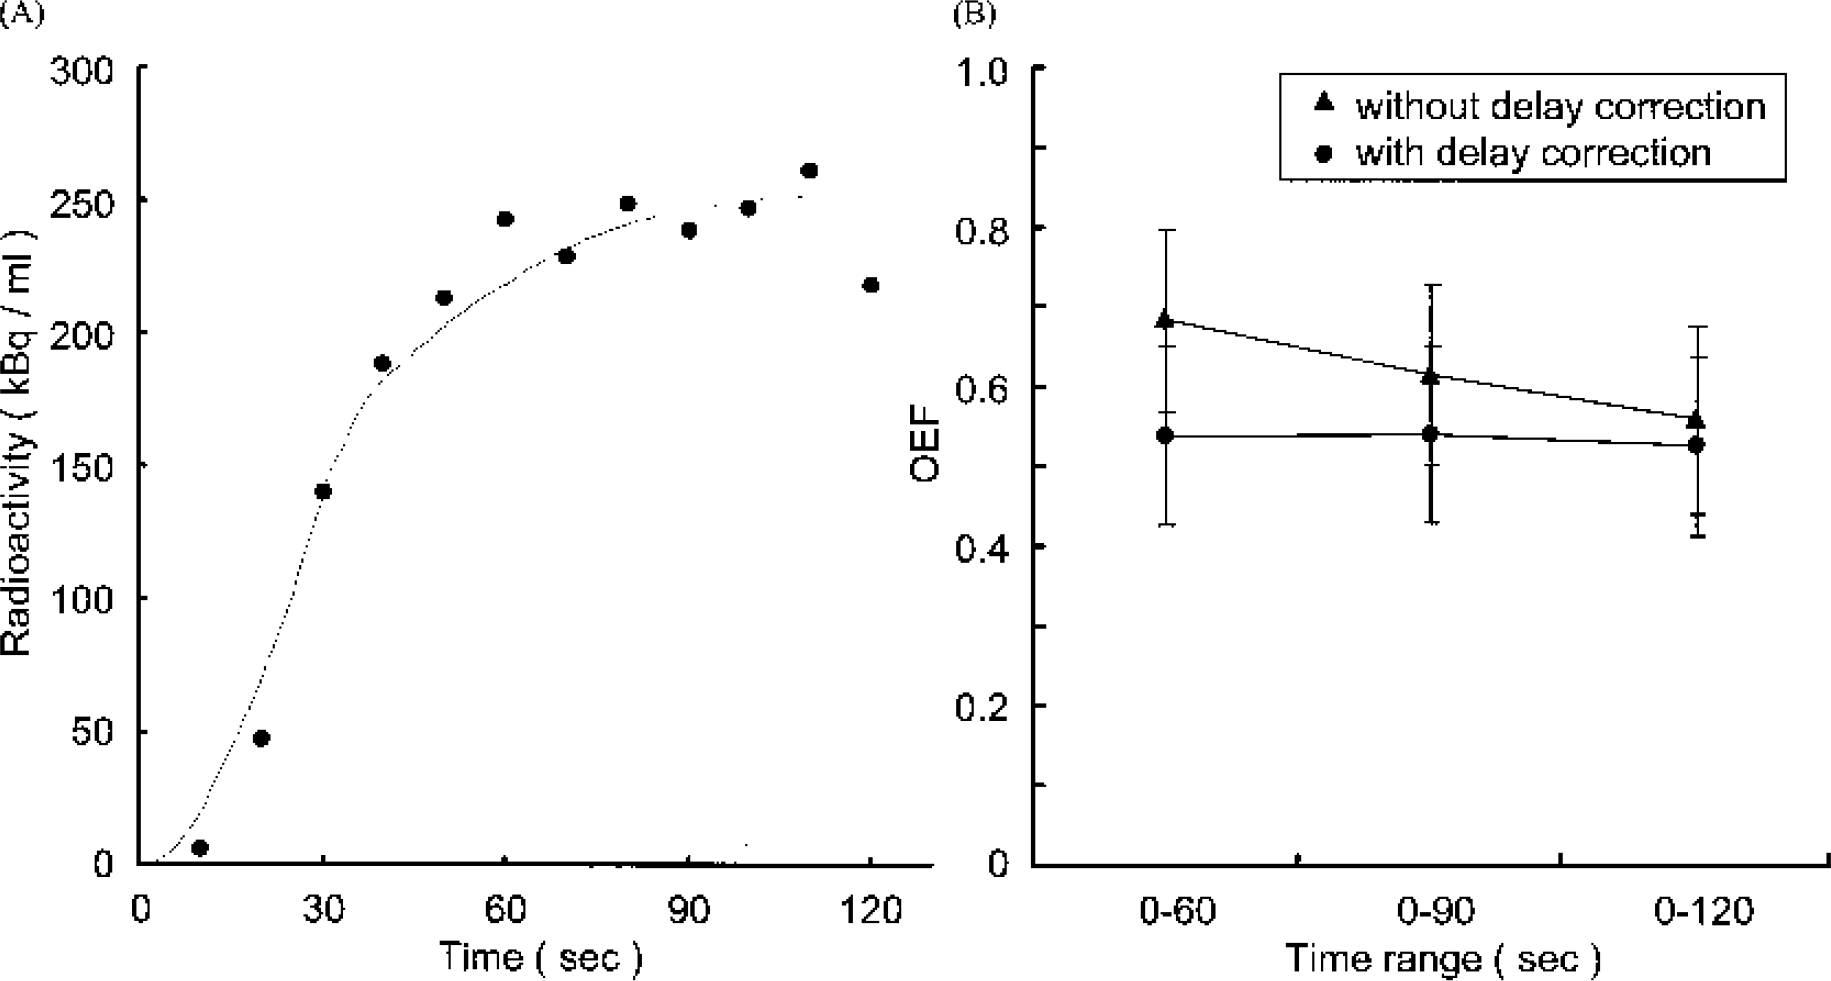
Simulated cerebral oxygen extraction fraction (OEF) evaluation in normal rat brains.
Measurement of CBF and OEF
The values of physiologic parameters in Eq. 1 and Eq. 2 were quoted from published literature, such as VB = 0.04 mL/g (Lammertsma et al., 1983), R = 0.85 (Grubb et al., 1978), VV′ = 0.835 (Mintun et al., 1984), P = 0.8 (Huang et al., 1983; Iida et al., 1994). A delay correction was simulated by computer software within a limit from 3 seconds to 7 seconds. First, the delay correction was evaluated by translation of the x-axis (time after injection) to obtain CBF. The simulation curve of the brain TAC after the delay correction correlated well with the raw data (Fig. 5A), and the analytical time range dependence on the estimated CBF diminished after an appropriate delay correction (Fig. 4B). The same delay correction was applied to estimate OEF, and the simulation curve of the brain TAC after delay correction also correlated well with the raw data (Fig. 5A). Moreover, no analytical time range dependence on the estimated OEF was observed after the delay correction (Fig. 5B).
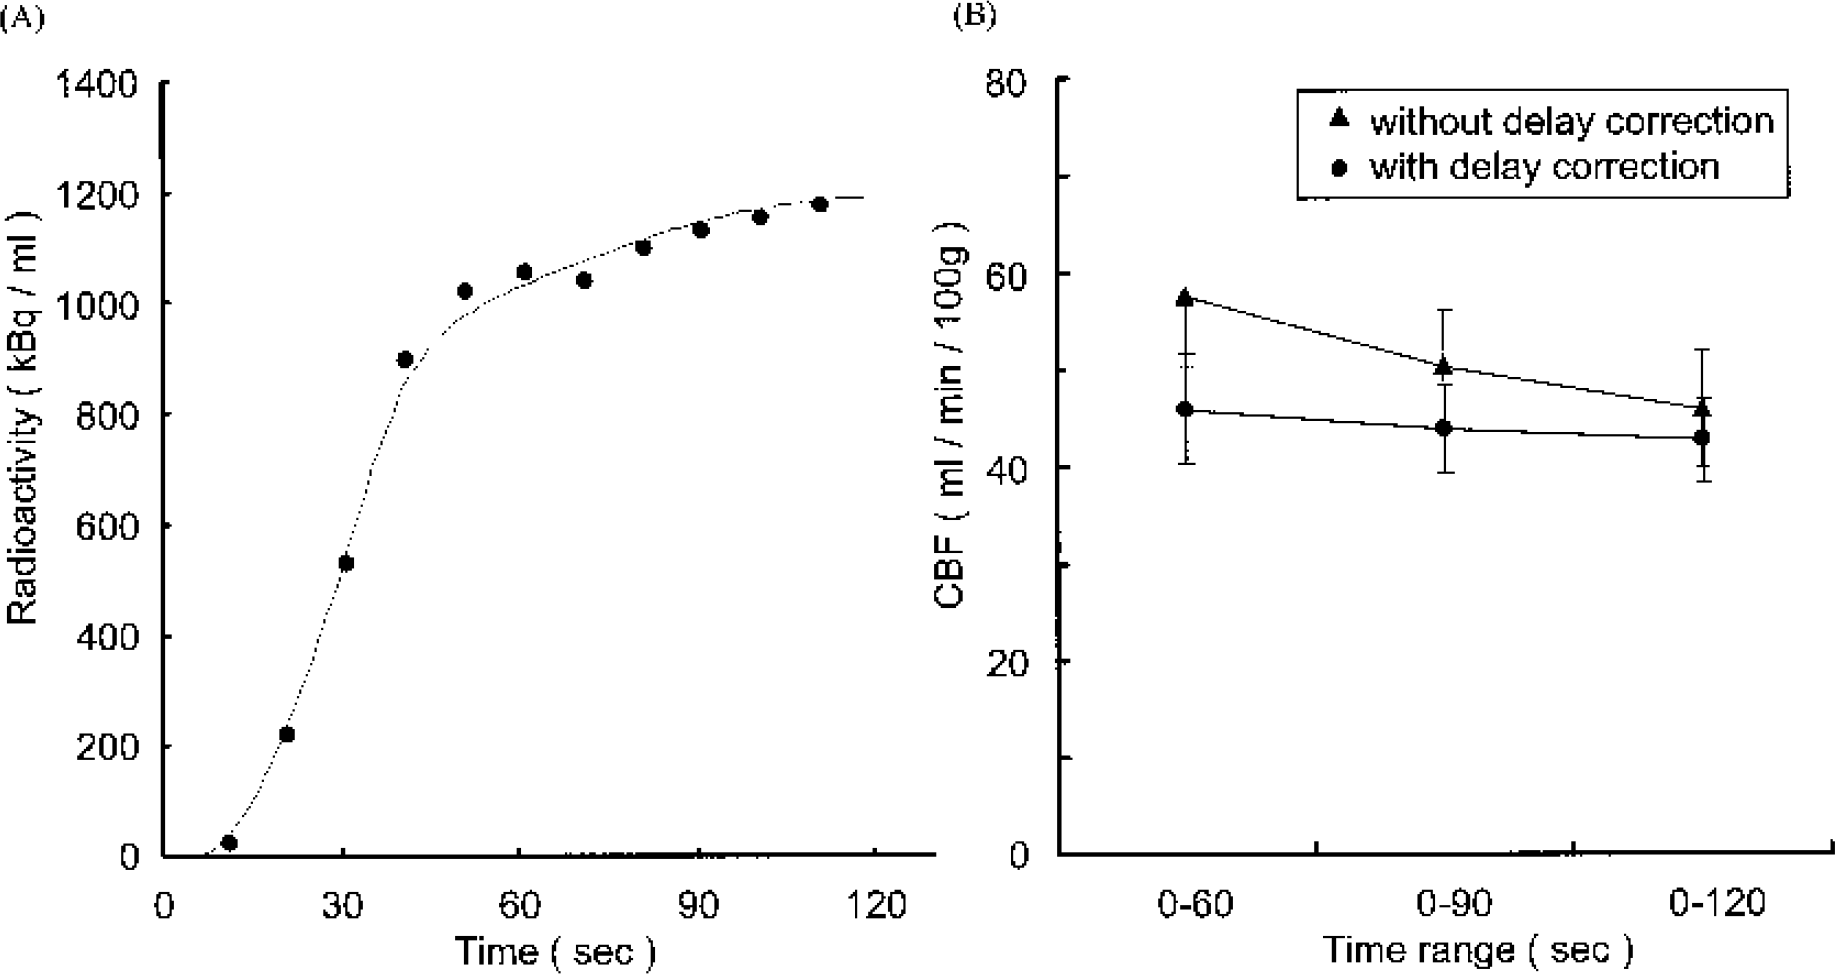
Simulated cerebral blood flow (CBF) evaluation in normal rat brains.
After computer simulation, 44 ± 4.5 mL · min−1 100 g−1 of CBF and 0.54 ± 0.11 of OEF were obtained (n = 13). On the other hand, OEF evaluated by the arterial-venous difference of oxygen concentration was 0.57 ± 0.13. These two methods gave similar OEF values.
Moreover, CMRO2 was calculated as follows:
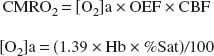
(Hb: gram hemoglobin/mL blood, %Sat: percent saturation of O2) 4.3 ± 1.3 mL · min−1100 g−1 of CMRO2 was obtained and this value was consistent with published data (Sinha et al., 1992).
DISCUSSION
The preparation of injectable 15O–O2 and its application to rat OEF evaluation are reported here. The faster the gas flow rate of 15O–O2 through the artificial lung, the better is the absorption efficiency of 15O–O2 into the blood. The gas flow rate was set at the highest value of the 15O–O2 gas supplying system, 500 mL/min. Oxygen is transferred to the red blood cells as soon as oxygen is dissolved in the plasma. A low temperature during the preparation of injectable 15O–O2 is considered to increase the yield. The solubility of 15O–O2 in water at 0°C is about 1.8 times higher than that at 25°C. However, temperature control was complicated and the temperature of the blood solution for injection was expected to be normal. The preparation was carried out at 27°C in this study.
The absorption fraction of oxygen in the red blood cells is known to depend on the partial pressure of oxygen. The oxygen concentration in the target gas in this study was 0.5%. It was expected that a higher oxygen concentration could achieve a higher yield of injectable 15O–O2. Therefore, nonradioactive oxygen was added to the 15O–O2 gas (20% to 50%, final concentration) just before the artificial lung was started. Unfortunately, an increased yield of injectable 15O–O2 was not observed; rather, the yield was diminished (data not shown). This was considered to be the result of a carrier effect.
The absorption efficiency of the O-15 radioactivity in the blood was not so high for the radioactivity of the 15O–O2 gas. This result could be accounted for by the configuration of the artificial lung. The shape of a large artificial lung for humans or large animals is different from that of the artificial lung used in this study; namely, oxygen gas passes through plastic fibers and blood circulates through the outside of the plastic fibers. Such a shape is considered to prolong the contact time between oxygen gas and red blood cells. Higher radioactivity may be obtained by improving the shape of the artificial lung used in this study for small animals.
Nevertheless, to use an artificial lung to prepare injectable 15O–O2 is useful in comparison with direct bubbling of 15O–O2 gas into the blood because direct bubbling into the blood causes foam degeneration of proteins in the blood. To prevent foam formation by bubbling of 15O–O2 into the blood, one option is to remove the protein fraction from the blood by washing the red blood cells. However, it is very troublesome to wash red blood cells many times, and handling during washing may affect the biologic function of the red blood cells.
Water is thought to diffuse freely through the blood–brain barrier, depending on the partition coefficient of water. At the equilibrium of the radioactivity in the blood and the brain after injection of 15O-H2O, the expected radioactivity is theoretically observed both in the blood and in the brain. Figure 3 shows TAC of the arterial blood and the brain after injection of 40 MBq of injectable 15O–O2. Similar radioactivity was observed in the arterial blood and the brain at 120 seconds after injection of injectable 15O–O2. The radioactivity in the blood existed as 15O-H2O at this time (Fig. 3). These results indicate that this system functioned well.
It was anticipated that there would be a lag time between the arrival time of the injected radioactivity at the brain and that at the point of the catheter for drawing the blood samples. It was very important to correct the lag time to carry out kinetic analysis (delay correction). Assuming that the resting heart rate of rats is 300 beats/min and the cardiac output is 1.7 mL/beat, rat heart ejects blood at 8.5 mL/s. The whole body blood volume was estimated to be about 24 mL since we used rats weighing about 300 g in this study. Then, the rate of systemic circulation in the rats was estimated to be 2.5 seconds under resting conditions. Moreover, the blood flow in the whole body might be reduced since this study was performed with the animals under pentobarbital anesthesia. The internal diameter of the catheter used in this study was 0.5 mm and the length was 20 cm. The blood flow rate at the end of the catheter was 2 mL/min. It may be considered, given the above, that the time lag between the TAC in the brain and the arterial input function obtained at the end of the catheter was from 3 to 7 seconds under these study conditions. As shown in Figs. 4A and 5A, the simulation curve of the brain TAC after the delay correction correlated well with the raw data and the analytical time range dependence on each estimated CBF and OEF was diminished after an appropriate delay correction, respectively. These results indicate that the delay correction and parameters used for the kinetic analysis were suitable.
Regions of interest were placed on the whole brain region in this study to avoid a partial volume effect. Local cerebral OEF could not be evaluated since the spatial resolution of the animal PET system used in this study was 2.7 mm at the center of the view. On the contrary, a direct comparison between OEF evaluated by the PET method and that by the arterial-venous difference of oxygen concentration method could be achieved in this study. These two methods gave similar OEF values, and the usefulness of the PET method was clearly indicated. The arterial-venous difference of oxygen concentration method can only evaluate whole brain OEF, and there are some limitations to repeat OEF evaluation in individual animals. Although repeat studies within animal were not carried out in this study, the PET method using injectable 15O–O2 has a great advantage in that repeat OEF evaluations can be performed. Moreover, it is expected that local cerebral OEF can be estimated with a higher resolution animal PET system, such as microPET.
CONCLUSIONS
In conclusion, (1) intravenously injectable 15O–O2 could be prepared with sufficient radioactivity for PET study using an artificial lung, and (2) the estimation of the OEF value of rat brain (0.54 ± 0.11) was achieved with the injectable 15O–O2 by dynamic PET study followed by kinetic analysis. This OEF value correlated well with that evaluated by the arterial-venous difference of oxygen concentration method.
This method is useful to study the OEF in small animals. It may accelerate basic research of several cerebral perfusion diseases. Moreover, this method can be applied to myocardial studies, although it was not estimated in this article.