
Abstract
This review analyzes, in some depth, results of studies on the effect of lowered temperatures on cerebral energy metabolism in animals under normal conditions and in some selected pathologic situations. In sedated and paralyzed mammals, acute uncomplicated 0.5- to 3-h hypothermia decreases the global cerebral metabolic rate for glucose (CMRglc) and oxygen (CMRO2) but maintains a slightly better energy level, which indicates that ATP breakdown is reduced more than its synthesis. Intracellular alkalinization stimulates glycolysis and independently enhances energy generation. Lowering of temperature during hypoxia–ischemia slows the rate of glucose, phosphocreatine, and ATP breakdown and lactate and inorganic phosphate formation, and improves recovery of energetic parameters during reperfusion. Mild hypothermia of 12 to 24-h duration after normothermic hypoxic–ischemic insults seems to prevent or ameliorate secondary failures in energy parameters. The authors conclude that lowered head temperatures help to protect and maintain normal CNS function by preserving brain ATP supply and level. Hypothermia may thus prove a promising avenue in the treatment of stroke and trauma and, in particular, of perinatal brain injury.
The importance in modern surgery of tissue protection by hypothermia cannot be overestimated. Since its application about half a century ago thousands of lives have been saved and even more have been improved in quality. It has also been noted (Busto et al., 1987) that even mild cooling by 3°C to 5°C exerts a powerful protective effect against brain damage caused by hypoxia–ischemia (Barone et al., 1997; Bernard et al., 2002; Colbourne et al., 1997; Ginsberg et al., 1992; Maher and Hachinski, 1993; The Hypothermia After Cardiac Arrest Study Group, 2002; Wagner et al., 1999), thus opening the possibility that lowered temperatures may be useful in treating the consequences of limitation in blood and/or oxygen supply to the central nervous system (CNS). However, despite intensive investigations, the mechanisms whereby hypothermia produces its neuroprotective effects have still to be elucidated. Moreover, no common, uniform strategy has yet emerged for the management either of patients subjected to cooling during surgery or undergoing postinsult hypothermic therapy.
Damage to the CNS in both newborns (perinatal hypoxia–ischemia) and adults (stroke, shock, trauma) is one of the commonest human pathologies. A likely mechanism whereby cooling could act beneficially, at least in part, is via its effects either on mitochondria or on energy metabolism. The reason for the viability of this idea is that, whatever may be its other protective actions, unless hypothermia also helps to maintain physiologic ATP concentrations, brain function will not be preserved. The latter statement is based on the common observation that CNS is extremely sensitive to even small limitations in energy production. This article, therefore, seeks to analyze critically and in some depth representative studies on the effects of hypothermia on brain ATP synthesis and turnover in mammals in vivo. It is not intended to be a comprehensive review of the literature; the sheer volume of experimental and clinical investigations during the past 50 years makes such an undertaking an almost insurmountable task. Rather, it aspires on the one hand to help in understanding the biologic changes induced by hypothermia and, on the other, to point out gaps and inadequacies in our knowledge, and thus aid with the design of new experiments and improved clinical strategies.
EFFECT OF SHORT-TERM HYPOTHERMIA ON PHYSIOLOGIC PARAMETERS AND LEVELS OF BLOOD GLUCOSE AND LACTATE
Most of the literature on the effects of lowered temperatures deals with short-term, whole-body hypothermia of a few hours' duration, performed under anesthesia or sedation and with muscle paralysis. Cooling to the desired temperature usually occurs within minutes and is carried out by external (cold air or water) or internal (cardiopulmonary bypass) means. In the past decade, selective cooling of the head has also been investigated in fetal, newborn, and young animals (Gelman et al., 1996; Gunn et al., 1997, 1998a, b ; Laptook et al., 2001; Tadler et al., 1998; Tooley et al., 2002; Walter et al., 2000) where brain can be maintained at a lower temperature than the rest of the body, thus reducing some detrimental consequences to other organs. There is very little information, if any, on the effects of the speed of cooling.
The “physiologic parameters” relevant to the objective of this review are the body temperature, MABP, PaO2, PaCO2 and pH. The body temperature of most homeotherms under physiologic conditions is very tightly controlled at between 37°C and 39°C, depending on the species. However, in the context of this review, temperature is the variable of interest which is set artificially to a desired value, or values, and then maintained within ± 0.5°C or less for the duration of the treatment. Mean arterial blood pressure decreases because of depression of cardiac function in anesthetized, cooled animals not on cardiopulmonary bypass. The temperature at which this begins depends on species; for example, rats have been reported to maintain unaltered blood pressure to 27°C (Hägerdal et al., 1975a), whereas in humans temperatures below 33°C to 34°C are considered unsafe. Hence, anesthetized experimental animals and patients subjected to moderate and deep hypothermia may require fluid replacement and even pharmacological support. By contrast, in conscious mammals such as humans (Frank et al., 1997) peripheral vasoconstriction caused by cold-triggered sympathetic stimulation may lead initially to an increase in blood pressure.
Numerous studies (most of those listed in the tables) have shown that if the composition of inspired gas is not altered in mild or moderate hypothermia (as, e.g., by replacing air with gas mixtures containing larger fractions of oxygen) and the animal exhibits no untoward reactions (e.g., a decrease in MABP), PaO2 remains either constant or changes very little, whereas the oxygen content of blood increases because of an increase in solubility of the gas (Keykhah et al., 1980; Ohta et al., 1995). Moreover, owing to the leftward shift of the oxygen–hemoglobin dissociation curve at lower temperatures (Astrup et al., 1965; Brown and Hill, 1923), even with air as the gas phase, arterial hemoglobin should be almost fully saturated with oxygen.
PaCO2 and pH are interrelated, and their values depend on the type of strategy used for the maintenance of acid–base balance (Reeves, 1969; Swan, 1982, 1984; White, 1981; White and Somero, 1982). In the so-called α-stat management, the PaCO2 is adjusted at a given lowered core temperature to a value which yields an arterial pH (pHa) of 7.35 to 7.45 when measured at 37°C. In vivo this blood is hypocapnic (PaCO2 of less than 4.61 to 5.92 kPa = 35 to 45 torr or mm Hg) and alkalotic (i.e., pH > 7.40) during hypothermia. The actual pHa (and PaO2) at the lowered temperature can be either measured directly or calculated from independently constructed correction tables available in the literature (Kelman, 1966; Severinghaus, 1966; Thomas, 1972). An alternative strategy, the “pH-stat,” is to adjust PaCO2 in such a manner that pHa is kept at 7.40 whatever the hypothermic temperature. This regime uses the addition of CO2 to the inspired gas during cooling to achieve a PaCO2 of about 5.26 kPa when read at, or corrected to, the patient's core temperature. When the same blood is measured at 37°C, it is acidotic (pH < 7.35 to 7.4) and hypercapnic (PaCO2 > 5.26 kPa), the magnitudes of changes in both parameters being directly related to the extent of reduction in body temperature. The issue of the maintenance of the proper acid–base balance is particularly important when body temperature is lowered by more than 3°C to 5°C degrees. According to the proponents of the α-stat management regime, pH-stat regulation causes stress by inducing respiratory acidosis (Swan, 1982, 1984; White, 1981; White and Somero, 1982).
In addition to the physiologic parameters, there are several other “indicators” of an organism's ability to maintain homeostasis; among those relevant to the present discussion are the concentrations of blood glucose and lactate. Glucose and lactate are normally kept within a relatively constant range of values: glucose in fed animals, including humans, is 80 to 180 mg dL (100 mL) or 4.5 to 10 mmol/L (the actual concentration and its range depending on the species of animal and its dietary state) and lactate is 1 to 2 mmol/L. The concentration of pyruvate is about 1/10 that of lactate, resulting in a lactate-to-pyruvate ratio of about 10 under physiologic conditions. Lactate level and lactate-to-pyruvate ratio are very sensitively regulated, and an increase in the latter may be an indicator of a deterioration in metabolic state or an organism's well-being.
The influence of short-term hypothermia (0.5 to 3 h) of varying degrees on blood glucose and lactate levels in different species of anesthetized animals, measured in various laboratories under one of the two strategies of acid–base balance maintenance, is shown in Table 1. It can be seen that lowering body temperature, in the absence of any other perturbation, has no consistent effect on the concentrations of these metabolites irrespective of species, depth of hypothermia, or mode of acid–base maintenance. This means that the combined action of a short-term lowering of temperature on catabolic and anabolic processes involving glucose and lactate is such that the constancy of their levels is highly guarded and there is no need for an extra supply of carbohydrate. Similarly, the lactate-to-pyruvate ratio remains unaltered.
Effect of acute hypothermia on concentrations of glucose and lactate and pH
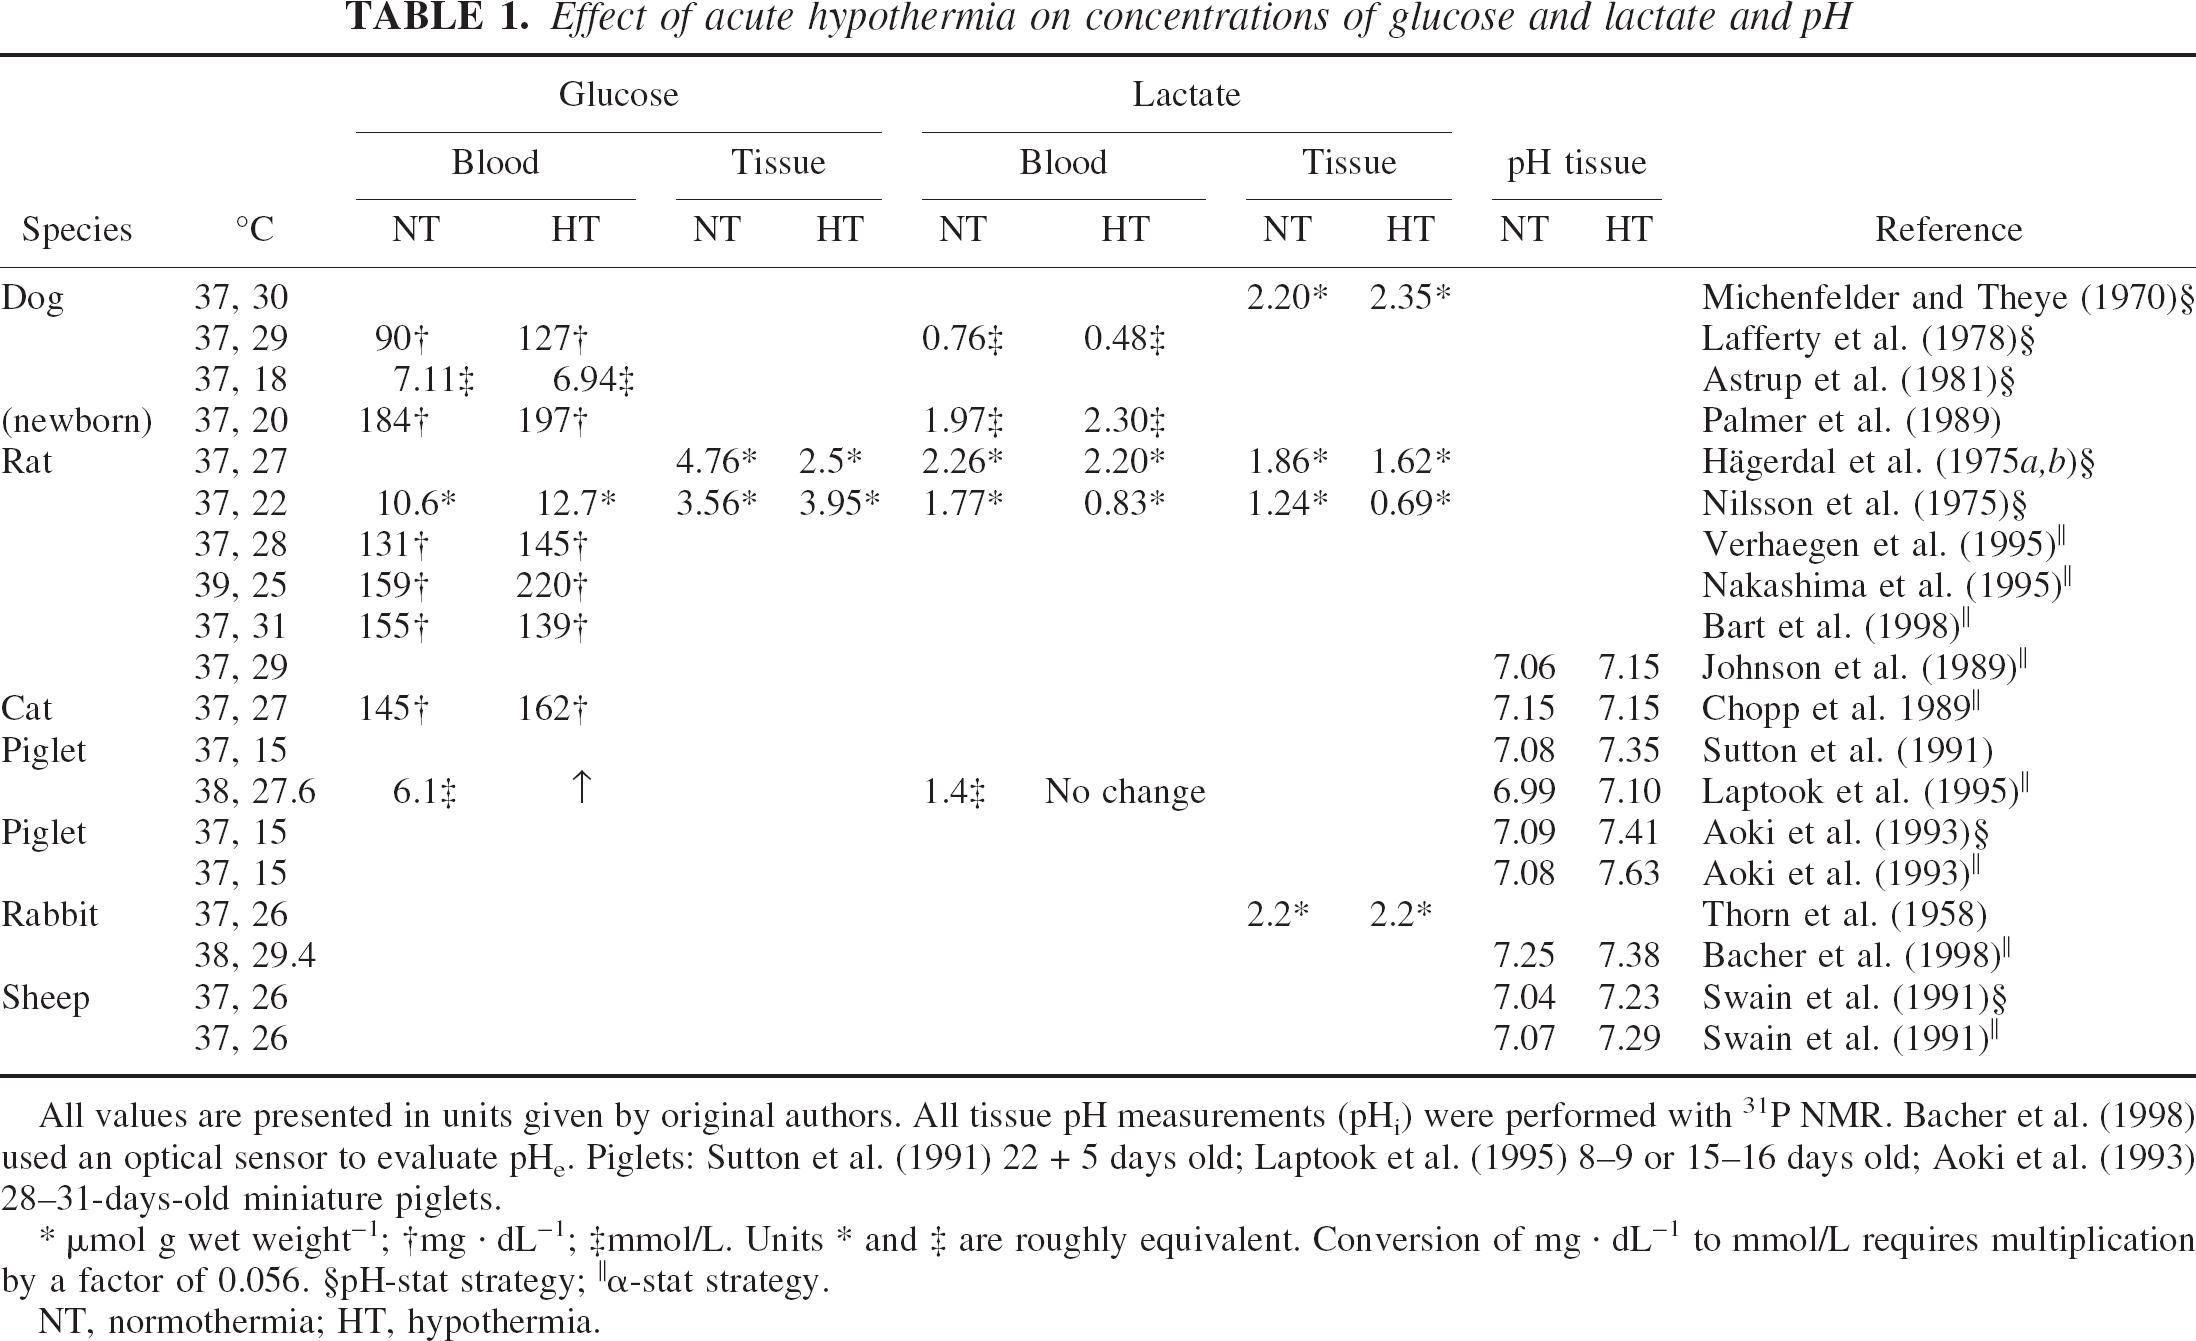
All values are presented in units given by original authors. All tissue pH measurements (pHi) were performed with 31P NMR. Bacher et al. (1998) used an optical sensor to evaluate pHe. Piglets: Sutton et al. (1991) 22 + 5 days old; Laptook et al. (1995) 8–9 or 15–16 days old; Aoki et al. (1993) 28–31-days-old miniature piglets.
μmol g wet weight−1
mg · dL−1
mmol/L.
Units * and ‡ are roughly equivalent. Conversion of mg · dL−1 to mmol/L requires multiplication by a factor of 0.056.
pH-stat strategy
α-stat strategy.
NT, normothermia; HT, hypothermia.
The situation is different in nonanesthetized, nonparalyzed animals where shivering and sympathetic arousal due to exposure to cold causes hyperglycemia and may even lead to lactacidemia (Close et al., 1985; Hetenyi and Cowan, 1981; Lossec et al., 1998; Prybilova and Znamenacek, 1966).
Conclusions
Short-term hypothermia in anesthetized, paralyzed, and ventilated animals does not influence PaO2, whereas arterial PaCO2 and pH are usually set artificially in accordance with one of two experimental strategies used for maintenance of acid–base balance. Stabilization of MABP in moderate and deep hypothermia may require fluid replacement and even pharmacological intervention. Blood glucose and lactate levels remain constant at values not significantly different from those in normothermia. In conscious awake animals, values of physiologic parameters are a balance between the direct effect of hypothermia and cold-induced sympathetic stimulation.
EFFECT OF SHORT-TERM HYPOTHERMIA ON BRAIN OXYGENATION, METABOLIC PARAMETERS AND pH
Oxygen
Brain oxygen tension depends on several factors: PaO2, oxygen delivery (which in turn is determined by cerebral blood flow, cardiac output, and peripheral vascular resistance) and oxygen utilization by the tissue. Cerebral PO2 is low and highly heterogeneous in all animal species investigated (Erecinska and Silver, 2001). There is very little published data on the effect of hypothermia on brain oxygen tension. Watanabe et al. (1989), using “a PO2 sensor,” saw an increase in cortical O2 level of mongrel dogs from 1.71 to 1.97 kPa at 37°C, to 2.63–5.26 kPa at 20°C, whereas Bacher et al. (1998), using a miniaturized Clark-type oxygen electrode, found no differences in the PO2 in the parieto-occipital cortex of rabbits at 38°C, 34.4°C, and 29.4°C. Unfortunately, the basal value for oxygen reported in the latter study, 6.58 to 7.89 kPa, was considerably higher than that (3.95 to 5.26 kPa) obtained by other workers (Erecinska and Silver, 2001) which suggest some technical problems with the measurement. Nevertheless, our own unpublished results obtained using the same method of measurement in dogs (Fig. 1) show that cerebral PO2 increases only slightly during hypothermia.
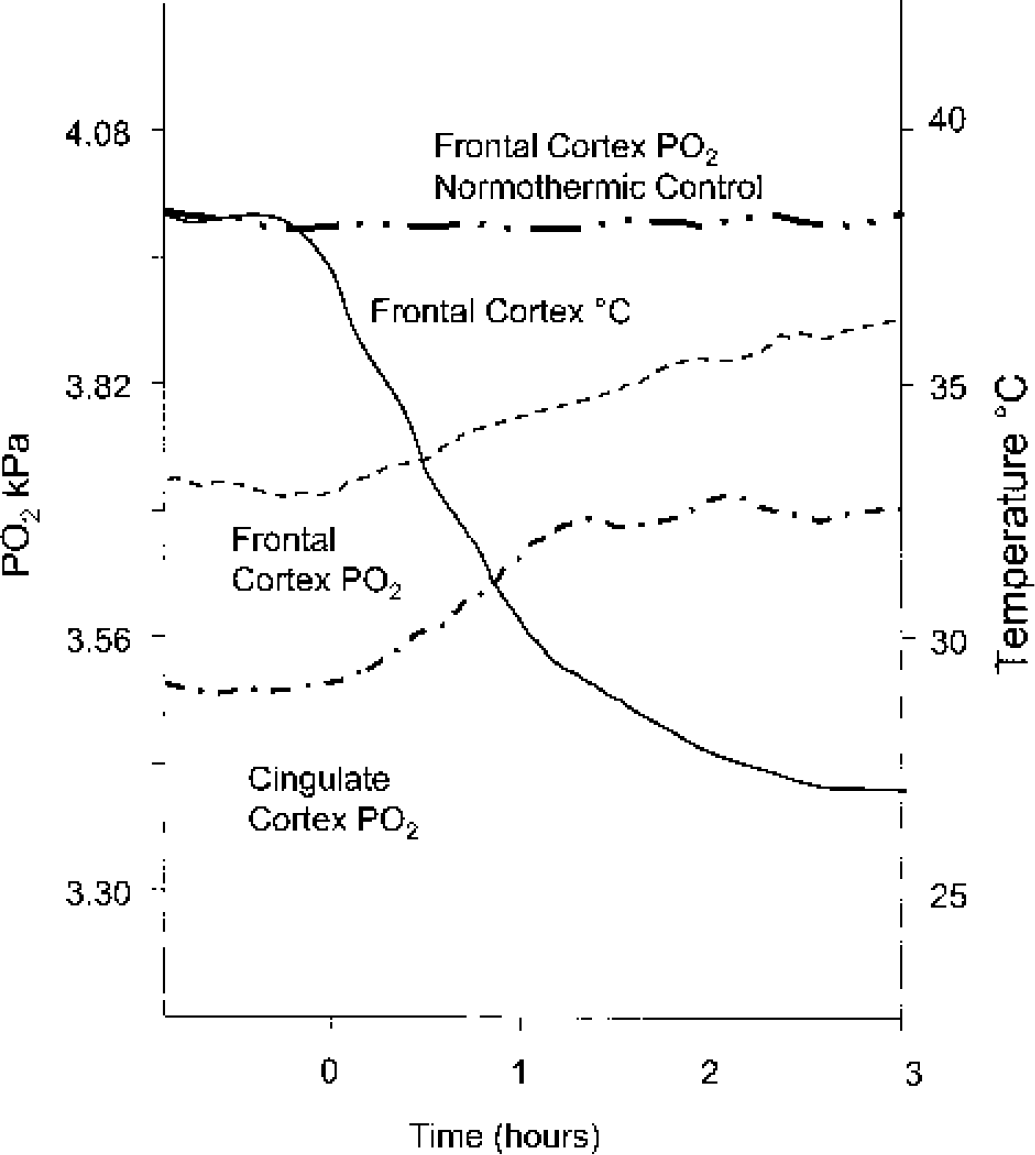
Effect of temperature on PO2 in two regions of dog brain cortex. Adult mongrel dogs were anesthetized with a mixture of halothane and nitrous oxide and gradually cooled by ice packs and via an extracorporeal circulation. Brain temperature was measured with a microthermistor probe inserted into the frontal cortex. PO2 was measured continuously in the frontal and cingulate areas with miniaturized Clark-type oxygen microelectrodes coupled to DC amplifiers through temperature compensating circuits. Traces shown in the figure are unedited experimental records (unpublished results of Silver, 1989).
Glucose and lactate
There are only a few and very early measurements of brain glucose and lactate content (Table 1) at lowered temperatures. Those in rat were performed at more than one hypothermic temperature, although for the sake of simplicity a single selected figure from each study is displayed in the table. Based on the results in rat, dog, and rabbit, one may conclude that levels of neither metabolite are influenced greatly by hypothermia per se. This means that glucose delivery to the brain under such conditions does not limit the breakdown rate of the sugar. The situation may be different, however, when utilization of glucose is enhanced during pathologic conditions such as hypoxia–ischemia.
Intermediates of glycolysis and the tricarboxylic acid cycle
There have been very few studies (for summary see Siesjö, 1978) on the behavior of intermediates of either glycolysis or the tricarboxylic acid cycle during hypothermia, the most extensive being that by Hägerdal et al. (1975b). In the latter work the metabolites were trapped by in situ freezing, which preserves their original concentrations. The results showed a general decline in the levels of glycolytic intermediates (by on average 30%), with the exception of glucose-6-phosphate, and in the tricarboxylic acid cycle intermediates (30% to 70%), with the exception of citrate. The authors suggested that lowered temperature reduces the flux at the level of the phosphofructokinase (glycolysis) and isocitrate dehydrogenase (tricarboxylic acid cycle) steps. Consistent with this suggestion, a more recent investigation (Kaibara et al., 1999), which combined proton nuclear magnetic resonance (1H–NMR) spectroscopy with 13C–labeled glucose infusion, showed that a decrease in temperature from 37°C to 31.5°C depresses tricarboxylic acid cycle activity by 30% to 40%.
High-energy phosphate compounds
Analytical measurements (Hägerdal et al., 1975b; Nilsson et al., 1971), because of their complexity and the number of steps involved (freezing in situ, tissue sample processing and assays), are prone to be affected by some, albeit very small, hydrolysis of the labile high-energy phosphate compounds. Nevertheless, they did indicate an increase in phosphocreatine ([PCr]) and its ratio to creatine concentration ([PCr]/[Cr]) when temperature was lowered (Hägerdal et al., 1975b). More recent phosphorus 31 (31P) NMR measurements on brains of hypothermic animals in vivo (Aoki et al., 1993; Johnson et al., 1989; Laptook et al., 1995; Swain et al., 1991a) have provided much more conclusive evidence that PCr/ATP and PCr/inorganic phosphate (Pi), and even ATP/Pi, are all elevated owing to increases in PCr and ATP and a decline in Pi. For example, Johnson et al. (1989) reported a PCr/Pi of 1.53 at 37°C and 2.28 at 28°C, whereas Swain et al. (1991a), who measured PCr/Pi as well as PCr/ATP and ATP/Pi, obtained figures for the three ratios of 1.74, 1.19, and 2.24, respectively in normothermia and of 2.10, 2.37, and 3.23, respectively at 18°C. The magnitudes of these changes correlate positively with the depth of hypothermia, despite the laboratory-to-laboratory variations for the value of PCr/Pi measured at 37°C.
pH
Several studies from various laboratories and in different animal species (Table 1) show, with one exception (cat: Chopp et al., 1989), an increase in intracellular pH of brain (pHi), that is, intracellular alkalinization, during hypothermia. Among those listed, only Swain et al. (1991b) and Laptook et al. (1995) used more than one hypothermic temperature; hence most conclusions rest on the validity and accuracy of a single experimental (i.e., hypothermic) point.
From results in Table 1, one can calculate the difference (Δ) in pH/°C determined by each group of investigators and compare its dependence on the acid–base management strategy. The three values for pH-stat [two are listed in the table (Aoki et al., 1993; Swain et al., 1991b) and the third can be found in Swain et al. (1991b)] give a mean of 0.0163 U/°C (SD of ± 0.001; range 0.015—0.017) and five values for α-stat [(Aoki et al., 1993; Johnson et al., 1989; Laptook et al., 1995; Swain et al., 1991b) which include the figure for 20°C (Swain et al., 1991b) not shown in the table], yield a mean of 0.0164 U/°C (SD of ± 0.006; range 0.011—0.025). Thus the means for the two strategies are identical, which could lead to the conclusion that there is no straightforward relation between changes in blood pH and those in brain cells. Furthermore, the calculated means are very close to the temperature dependence of both the blood pH in poikilotherms (−0.015) and the pH of neutrality of water (−0.017) (Kent and Peirce, 1967; Malan et al., 1976; Volkert and Musacchia, 1970), which suggests that brain follows the α-stat strategy during hypothermia. Because of the large spread in the data and laboratory-to-laboratory variations, the aforementioned calculation may hide real differences and produce results that are a gimmick of mathematical manipulations. Thus despite the firm basis for the conclusion that hypothermia induces an increase in brain pHi, more work is needed to establish the precise dependence of pHi on the acid–base management.
The only study in which the extracellular pH during hypothermia was measured (Bacher et al., 1998) was carried out with α-stat management. The recorded ΔpH was −0.015 U/°C, which is identical to that in blood (Rosenthal, 1948).
Conclusions
Glucose and lactate concentrations in brains of anesthetized animals appear to change little under the influence of short-term hypothermia per se, and there is no experimental evidence for tissue hypoxia. Flux through glycolysis and the tricarboxylic acid cycle declines. The energy state of brain, as measured by PCr/Pi or ATP/Pi, increases somewhat, which suggests that, with the decrease in temperature, energy-consuming reactions are reduced more than ATP synthesis. Both intra- and extracellular pH in brain become more alkaline with a decrease in temperature.
EFFECT OF TEMPERATURE ON CEREBRAL ATP PRODUCTION AND CEREBRAL BLOOD FLOW
In this section we shall discuss the effects of hypothermia on energy-producing pathways, glycolysis, and oxidative phosphorylation, by evaluating the behavior of the cerebral metabolic rate for glucose (CMRglc), lactate (CMRlac), and oxygen (CMRO2). There are several questions that require answers: (1) Is ATP production reduced when brain temperature is lowered? (2) If it is, what is the form of its temperature dependence; is it linear or exponential? Is it important? (3) Is the temperature dependence uniform throughout the range used clinically, that is, from mild to deep hypothermia, or are there zones of higher and lower dependency? (4) Is the supply of substrates in hypothermia adequate to maintain full cellular activity? (5) Is cerebral ATP production affected by the type of acid–base management used to maintain the acid–base balance in hypothermia?
Temperature dependence of CMRglc and CMRO2
Table 2 presents a selection of results from studies carried out since 1954 in which the rates of reactions relevant to ATP production in brain were measured as a function of temperature. Results are from six mammalian species and for newborn as well as adult animals. To establish the type of temperature dependence of any reaction with a reasonably high degree of certainty at least two decades of temperature change must be examined with 6 to 8 temperature points. Moreover, for the results of different studies to be strictly comparable, similar if not identical experimental conditions and techniques of measurements should be used. Finally, it may also be important to make determinations at the same, or similar, time after “equilibration” at the chosen hypothermic temperatures.
Temperature dependence of cerebral blood flow and metabolic rates
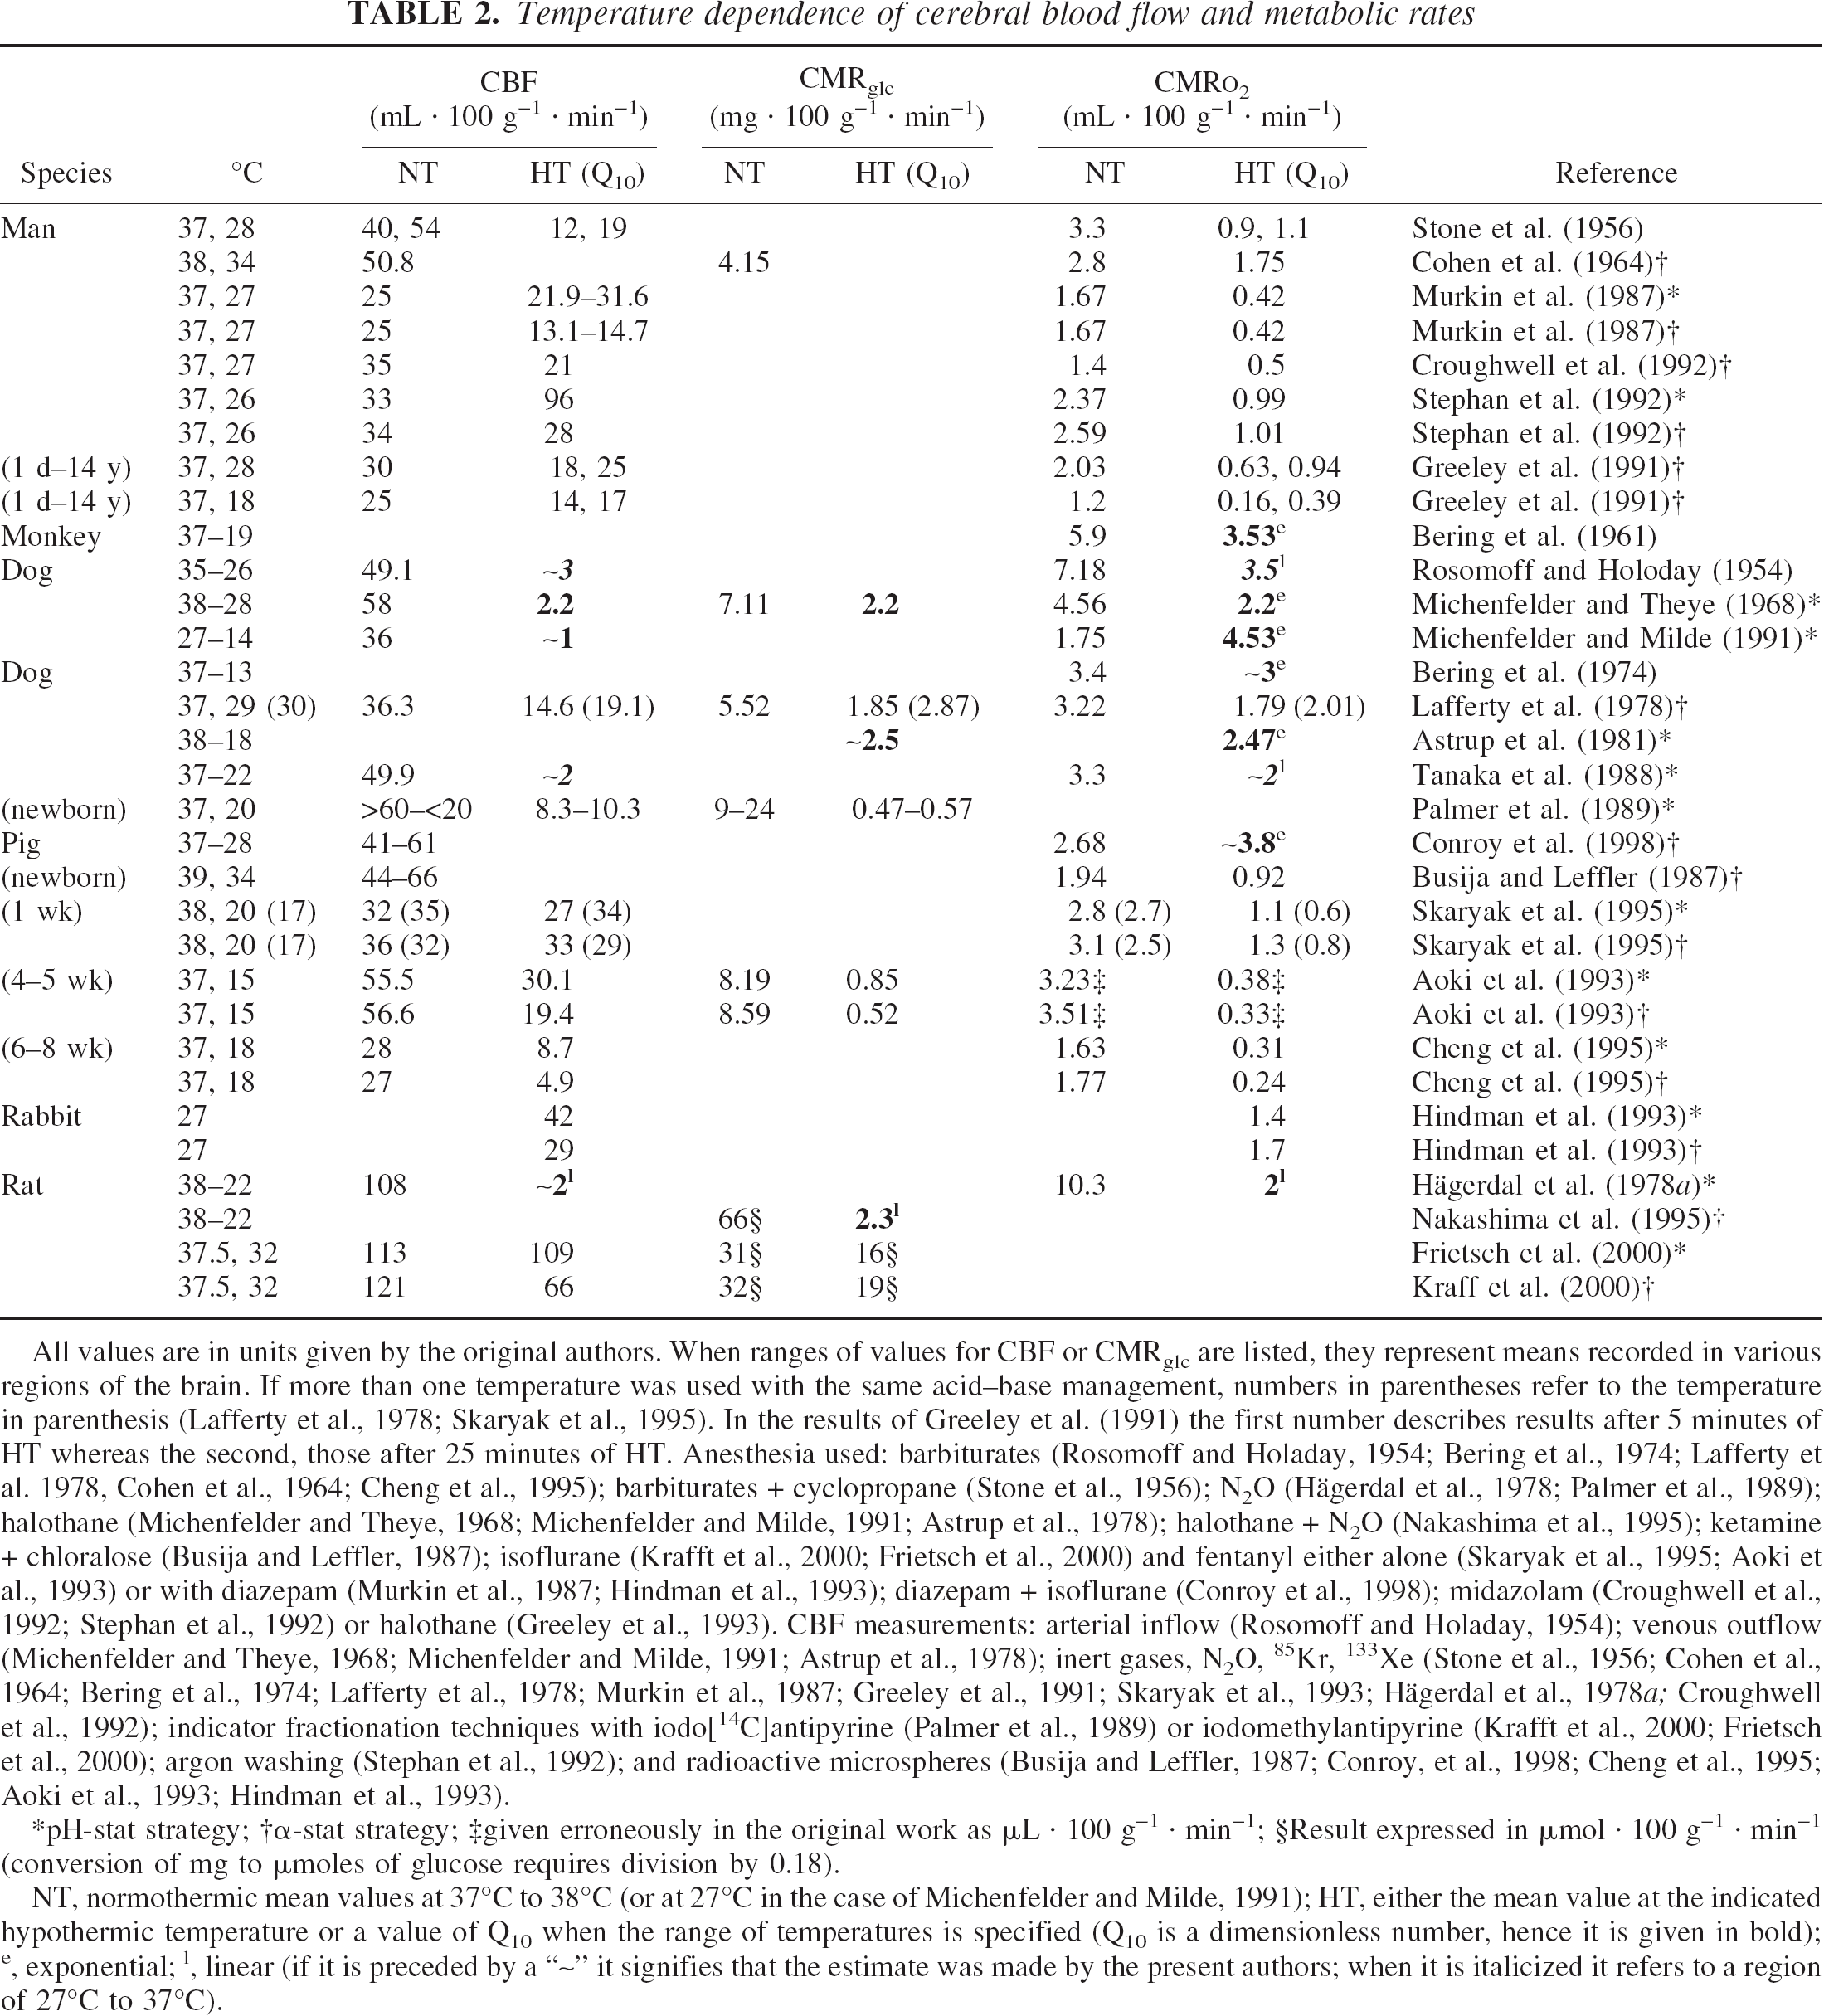
All values are in units given by the original authors. When ranges of values for CBF or CMRglc are listed, they represent means recorded in various regions of the brain. If more than one temperature was used with the same acid–base management, numbers in parentheses refer to the temperature in parenthesis (Lafferty et al., 1978; Skaryak et al., 1995). In the results of Greeley et al. (1991) the first number describes results after 5 minutes of HT whereas the second, those after 25 minutes of HT. Anesthesia used: barbiturates (Rosomoff and Holaday, 1954; Bering et al., 1974; Lafferty et al. 1978, Cohen et al., 1964; Cheng et al., 1995); barbiturates + cyclopropane (Stone et al., 1956); N2O (Hägerdal et al., 1978; Palmer et al., 1989); halothane (Michenfelder and Theye, 1968; Michenfelder and Milde, 1991; Astrup et al., 1978); halothane + N2O (Nakashima et al., 1995); ketamine + chloralose (Busija and Leffler, 1987); isoflurane (Krafft et al., 2000; Frietsch et al., 2000) and fentanyl either alone (Skaryak et al., 1995; Aoki et al., 1993) or with diazepam (Murkin et al., 1987; Hindman et al., 1993); diazepam + isoflurane (Conroy et al., 1998); midazolam (Croughwell et al., 1992; Stephan et al., 1992) or halothane (Greeley et al., 1993). CBF measurements: arterial inflow (Rosomoff and Holaday, 1954); venous outflow (Michenfelder and Theye, 1968; Michenfelder and Milde, 1991; Astrup et al., 1978); inert gases, N2O, 85Kr, 133Xe (Stone et al., 1956; Cohen et al., 1964; Bering et al., 1974; Lafferty et al., 1978; Murkin et al., 1987; Greeley et al., 1991; Skaryak et al., 1993; Hägerdal et al., 1978a; Croughwell et al., 1992); indicator fractionation techniques with iodo[14C]antipyrine (Palmer et al., 1989) or iodomethylantipyrine (Krafft et al., 2000; Frietsch et al., 2000); argon washing (Stephan et al., 1992); and radioactive microspheres (Busija and Leffler, 1987; Conroy, et al., 1998; Cheng et al., 1995; Aoki et al., 1993; Hindman et al., 1993).
pH-stat strategy
α-stat strategy
given erroneously in the original work as μL · 100 g−1 · min−1
Result expressed in μmol · 100 g−1 · min−1 (conversion of mg to μmoles of glucose requires division by 0.18).
NT, normothermic mean values at 37°C to 38°C (or at 27°C in the case of Michenfelder and Milde, 1991); HT, either the mean value at the indicated hypothermic temperature or a value of Q10 when the range of temperatures is specified (Q10 is a dimensionless number, hence it is given in bold);e, exponential;l, linear (if it is preceded by a “∼” it signifies that the estimate was made by the present authors; when it is italicized it refers to a region of 27°C to 37°C).
However, live animals are infinitely more complex than test tube experiments, and metabolic rates for glucose, oxygen, or lactate are not single reactions but products of multistep processes. Hence feasibility of approach and availability of methodology rather than strict procedural rules usually determine the course of a study. Of the 25 investigations listed in Table 2, 14 were carried out at 2 temperatures, one of which was a normothermic control, and only 5 (Bering, 1961, 1974; Michenfelder and Theye, 1968; Nakashima et al., 1995; Tanaka et al., 1988) involved 4 or more lowered temperatures; 5 studies (Astrup et al., 1981; Bering, 1961, 1974; Hägerdal et al., 1975a; Nakashima et al., 1995) with more than 2 hypothermic points covered a larger span than 10°C. Twelve different types of anesthesia or sedation were used (see Table 2 legend) and some investigators did not use any anesthetic at temperatures below 25°C to 27°C (e.g., Hägerdal et al., 1975a). Similarly large is the number of techniques for measuring CBF, which is necessary for determination of metabolic rates (legend to Table 2). Finally, the “hypothermic” measurements were taken after “equilibration” periods ranging from 5 to 60 minutes. Therefore, discrepancies in the results that such studies produce may not always be “real” but rather arise from limitations in experimental design and differences in technologies, each with potential for individual errors. Moreover, the values for basal (normothermic) rates can be affected by the type of anesthetic used, age of animal, and environmental factors.
The relevant information is compiled in Table 2. Each study (except that of Hindman et al. [1993] which investigated only hypothermia) is represented by the basal rate, usually at 37°C, for one or more of the following: CMRglc, CMRO2, or CMRlac and either another rate, when a single hypothermic temperature was investigated, or a value of Q10 (change in rate for a 10°C difference in temperature), when data are available for more than one temperature within the range listed.
The largest experimental basis for evaluating the temperature dependence of ATP production is from CMRO2. All results, without exception, show that total body hypothermia in anesthetized (or sedated) and paralyzed animals reduces the metabolic rate for oxygen, as would be expected for any chemical reaction. Of the 22 studies listed in Table 2, approximately half provided measurements at more than 2 temperatures and therefore allowed construction, by either the original or present authors, of relevant plots of oxygen consumption rate versus temperature. Five studies (Astrup et al., 1981; Bering, 1961, 1974; Conroy et al., 1998; Michenfelder and Theye, 1968) yielded an exponential relation with calculated Q10 values of between 2.2 and 3.8. Greeley et al. (1991) also found that their combined data after 5 minutes at 18°C and 28°C fell on a straight line in the Arrhenius plot and gave an overall Q10 of 3.65. By contrast, the results of Rosomoff and Holaday (1954) and Hägerdal et al. (1975a) follow a linear relation, with changes calculated by the authors for a 10°C decrease in temperatures of 3.5 and 2.0, respectively. Tanaka et al. (1988) also plotted their results on a linear scale (the change was about 2-fold for a 10°C lowering of temperature), although the data did not follow a strictly linear relation. It may be relevant to mention that detailed in vitro measurements in rat brain slices carried out by Field et al. (1944) showed that the log of oxygen consumption was linearly related to temperature over the range 10°C to 37°C with a calculated van't Hoff temperature coefficient of 2.13.
Based on the 8 more-detailed studies listed in Table 2, one can calculate that CMRO2 decreases by between 2- and 4-fold (mean 2.81 ± 0.7) with a 10°C reduction in temperature from 37°C–38C° to 27°C−28°C. Estimates from the investigations using a single hypothermic point lead to a very similar conclusion, although they do not allow determination of the form of the relation. The almost twofold difference in Q10 among various studies is neither species- nor age-dependent; there is as much variation within a single species as there is among species. Newborns, young animals, and adults exhibit similar variations. Interestingly, the strategy of acid–base management has no significant effect on the hypothermic decrease in CMRO2 [piglet (Aoki et al., 1993; Cheng et al., 1995), rabbit (Hindman et al., 1993), and man (Murkin et al., 1987; Stephan et al., 1992)]. An exception is the study by Skaryak et al. (1995) in piglets that found a somewhat lower metabolic rate for oxygen with pH-stat as compared with α-stat management.
There are a few points that are not immediately obvious from the data in Table 2 but merit discussion. (1) In several studies (Astrup et al., 1981; Bering, 1961, 1974; Greeley et al., 1991; Hägerdal et al., 1975a; Tanaka et al., 1988) the plots of temperature versus CMRO2 show no evidence of discontinuity even down to 13°C−18°C, which suggests a single Q10 value. However, Michenfelder and Milde (1991, 1992) reported that in dogs exposed to hypothermia between 27°C and 14°C, the Q10 was much higher, 4.53 (which is twice the value they found between 27°C and 37°C), but it decreased again to 2.2 between 13°C and 7°C. This complex and rather unusual behavior lacks support from other experimental studies even in the same species. (2) The measurements of CMRO2 by Greeley et al. (1991) in newborn infants and children were made after 5 and 25 minutes at both 18°C and 28°C, whereas those in dog, by Lafferty at al. (1978), were after 30 minutes and 4 h at 29°C−30°C (there was a 0.6°C difference in temperature between the latter two time points). At all temperatures, the changes were much smaller at the later than at the early time points, which suggests that some metabolic adaptation may occur. Whether this behavior contributes to the differences in temperature dependencies reported by various laboratories for very similar conditions is not clear at present but should be taken into account in future experimental designs. (3) One of the earliest studies, that of Stone et al. (1956), involved three patients. Values for two are listed in Table 2 whereas the third, who was only very lightly anesthetized, shivered during cooling and his cerebral CMRO2 did not decrease but increased substantially. This observation indicates that the effects of hypothermia per se can be overridden by other factors that independently activate metabolism, such as sympathetic stimulation (Carlsson et al., 1977; Frank et al., 1997). (4) During selective brain surface cooling (Laptook et al., 2001) and after bicarotid perfusion of the head with extracorporally cooled blood (Walter et al., 2000) CMRO2 was reported to decrease with a Q10 very similar to that with whole-body cooling. However, because selective surface hypothermia creates relatively large temperature gradients within brain (Laptook et al., 2001; Tooley et al., 2002), there may be regional, temperature-dependent variations in oxygen consumption.
Not much is known about regulation of cellular respiration in hypothermia; one would assume that the same mechanisms as those in normothermia would apply (Erecinska and Silver, 1989, 2001). The increase in phosphorylation state seen with P NMR (Aoki et al., 1993; Johnson et al., 1989; Swain et al., 1991a) in the presence of a reduced CMRO2 should be accompanied by an oxidation of cytochrome aa3. It is, therefore, very surprising that a change in the redox state in the opposite direction (i.e., a reduction) was measured by near-infrared spectroscopy by Hiramatsu et al. (1995) and Nomura et al. (1996). These authors interpreted their findings as evidence for “a net cellular oxygen deficit,” although this suggestion is at variance with their own previous results (Aoki et al., 1993) on the increased levels of cerebral high-energy phosphate compounds in hypothermia, which are incompatible with tissue hypoxia. Moreover, because the energy state and the CMRO2 were essentially the same in the two acid–base management strategies (Aoki et al., 1993), there is no obvious reason for the greater reduction of cytochrome aa3 reported with α-stat management (Hiramatsu et al., 1995). However, the technique of near-infrared spectroscopy does not yield quantitative results and is prone to multiple interferences (Sakamoto et al., 2001); hence it is possible that these observations do not reflect the true behavior of cytochrome oxidase but are an experimental artifact.
Table 2 also presents results on the effect of temperature on cerebral metabolic rate for glucose. In the range 41 to 18°C, global CMRglc decreases in a manner similar to that seen with CMRO2 (Astrup et al., 1981; Lafferty et al., 1978; Michenfelder and Theye, 1968; Nakashima et al., 1995); the relation with respect to temperature has been found to be either exponential (Astrup et al., 1981) or linear (Nakashima et al., 1995). The Q10 values in studies in which both the CMRO2 and CMRglc were measured (Astrup et al., 1981; Michenfelder and Theye, 1968) are comparable. A plot by Astrup et al. (1981) of the two rates against each other yielded a straight line with a constant ratio of 5.8 between 18°C and 38°C.
Temperature seems to affect global cerebral metabolic rate for lactate in a manner similar to that for CMRglc, although this conclusion is far from being solid because of the paucity of studies (Lafferty et al., 1978).
The use of 2-[14C]-deoxyglucose allows determination of CMRglc in the entire brain as well as in its different parts. Measurements in 16 CNS regions of newborn dogs (Palmer et al., 1989) and approximately 40 areas in rat brain (Frietsch et al., 2000; Krafft et al., 2000; McCulloch et al., 1982) showed that there were regional variations in response to hypothermia. In dogs the large differences in local glucose consumption seen at 37°C between, for instance, cerebellar or cortical gray matter on the one hand and cortical white matter on the other, almost disappeared at 20°C, when the rates in all areas became very similar (Table 2). Consequently, the effects of hypothermia were much greater in regions with large numbers of active cell bodies and lower in those where neuropil predominates. By contrast, moderate hypothermia (32°C) in rats reduced local CMRglc slightly more in the white than in the gray matter (Frietsch et al., 2000; Krafft et al., 2000; McCulloch et al., 1982). Whether this difference in response is due to the degree of hypothermia (32°C vs. 20°C), to animal species (dog vs. rat), or age (newborn vs. adult) is not known at present.
The regional studies in rats cited previously are of special interest because all three used the same methodology for CMRglc measurement and an identical hypothermic temperature, 32°C. However, McCulloch et al. (1982) studied conscious animals, whereas Frietsch et al. (2000) and Krafft et al. (2000) used isoflurane anesthesia. Moreover, the German laboratory carried out their experiments with either α-stat (Krafft et al., 2000) or pH-stat (Frietsch et al., 2000) acid–base management strategy. Therefore, a comparison of the results of McCulloch et al. (1982) with those of Krafft et al. (2000) allows insight into the effect of anesthesia during hypothermia, while that between the work of Krafft et al. (2000) and Friesch et al. (2000) evaluates the impact of acid–base management. All three papers provide normothermic rates in conscious animals that can serve as a check for laboratory-to-laboratory variation in the use of the same technology. The values from the two laboratories are very close, with those from Germany being about 10% lower, a negligible difference.
Detailed analysis of results in the three studies leads to the following conclusions: (1) temperature does not seem to exert a larger effect in conscious animals, whereas variations in responses seem to be somewhat greater in anesthetized animals. Conscious rats exposed to hypothermia were hyperglycemic and shivered continuously, signs of sympathetic arousal. This would have stimulated their metabolism and opposed reductions in metabolic rate caused by lowering of temperature, thus resulting in an overall smaller effect than in the absence of sympathetic stimulation. Whether the same explanation accounts for the decreased regional heterogeneity in awake animals is not clear. (2) The acid–base management strategy has no effect on the degree of reduction in CMRglc. A puzzling finding from the German laboratory (Krafft et al., 2000) is that a change in temperature from 37°C to 35°C produced no significant effect on CMRglc whereas a further reduction by only 3°C decreased rates by almost 50% (i.e., a 2-fold change). Such behavior does not conform to either a linear or a logarithmic relation and is at variance with the detailed study of Nakashima et al. (1995).
Temperature dependence of cerebral blood flow in relation to metabolic rates
There is a large body of often-conflicting work on the behavior of CBF during hypothermia. Because the prime objective of the present review is an understanding of the relation between CBF and energy metabolism at lowered temperatures, our discussion will focus on those studies that have simultaneously evaluated both of these parameters (Table 2), whereas only brief reference will be made to other selected investigations which are considered relevant.
Careful inspection of results from experiments in different animal species shows that when total body temperature is decreased from 38°C to 28°C−30°C, CBF declines almost in parallel with either CMRO2 [(Busija and Leffler, 1987; Hägerdal et al., 1975a; Lafferty et al., 1978; Michenfelder and Theye, 1968; Rosomoff and Holaday, 1954; Stone et al., 1956; Tanaka et al., 1988) see also Murkin et al. (1987) on α-stat strategy)] or CMRglc (Krafft et al., 2000). This suggests that, in the temperature range described, autoregulation is largely maintained. Data from adult [pH-stat management (Murkin et al., 1987), α-stat management (Croughwell et al., 1992), and both types of acid–base management (Stephan et al., 1992)] and “immature” (Greeley et al., 1991) human patients maintained on a cardiopulmonary bypass provide exceptions to this general observation. Some clinical studies, for example, Henriksen (1986), even report increases in CBF during cooling, which suggests that there may be reactive hyperemia to localized tissue hypoxia caused by microemboli (Blauth et al., 1988, 1990; Brown et al., 2000; Clark et al., 1995; Kern et al., 1991; Moody et al., 1990). Whether loss of correlation between metabolism and blood flow in subjects undergoing cardiac surgery is caused and/or exacerbated by some preexisting medical condition is impossible to decide at present.
Below 28°C to 30°C the general consensus is that decreases in metabolic rate are larger than those in blood flow (Aoki et al., 1993; Cheng et al., 1995; Greeley et al., 1991; Michenfelder and Theye, 1968; Palmer et al., 1989; Perna et al., 1973; Skaryak et al., 1995), although Hägerdal et al. (1975a) and Tanaka et al. (1988) found that autoregulation was maintained down to 20°C−22°C. Uncoupling between CBF and metabolism occurs with both acid–base management strategies, but is much greater with the pH-stat regime, where PaCO2 is increased. Such behavior is consistent with the known role of CO2 as a powerful independent effector of CBF, responses to which seem to be maintained in hypothermia in both strategies of acid–base management (Busija and Leffler, 1987; Cheng et al., 1995; Govier et al., 1984; Hägerdal et al., 1975a; Henriksen, 1986; Murkin et al., 1987; Prough et al., 1986). However, what mechanisms cause the apparent hypothermic hyperemia that is seen even in hypocapnia (α-stat) is not clear. Since the same phenomenon is also observed in healthy animals subjected to deep hypothermia (Skaryak et al., 1995), it is obvious that preexisting medical conditions cannot be the reason. Whatever its cause, this apparent excess of blood flow in the presence of low oxygen utilization should raise oxygen tension. Yet this would be of no additional benefit to cytochrome c oxidase because the latter is fully saturated with O2 at low micromolar levels (Vanderkooi et al., 1991). By contrast, increase in oxygen tension could stimulate the production of free radicals, including nitric oxide (NO), since their synthesizing enzymes have very high Km values for oxygen (Abu-Soud et al., 1996). Whether such postulated enhanced production of NO, a potent vasodilator, may contribute to the increase in CBF is an attractive but unproven possibility.
Despite obvious decreases in CBF at lowered temperatures, oxygen consumption at 20°C to 22°C remained stable when flow rate was reduced even further, either directly (Fox et al., 1984) or by hypocapnia (Hägerdal et al., 1975c). Even when brain perfusion declined to only 15% of its normothermic value, cerebral energy level remained undiminished (Hägerdal et al., 1975c). This indicates that at a global level the blood flow in hypothermia is adequate and there is no evidence of brain hypoxia.
Cerebral blood flow, like CMRglc can also be measured at a regional level. In 16 areas of the canine brain (Palmer et al., 1989) CBF fell in hypothermia, but the large differences among various regions seen in normothermia, which are well known, became much smaller at 20°C, a situation similar to that mentioned previously for CMRglc. Consequently, regions with higher flow (e.g., cerebellum, gray matter of cortex) experienced larger reductions than those with lower flow rates (white matter). In 41 structures of rat brain investigated at 32°C, regional blood flow was reduced almost in parallel with local CMRglc when α-stat acid–base management strategy was used (Krafft et al., 2000) but remained unaltered, or even increased, with the pH-stat strategy (Frietsch et al., 2000). Moreover, in contrast to the situation in newborn dogs (Palmer et al., 1989) the responses of gray and white matter to moderate hypothermia in rats were identical. Whether these distinct behaviors are caused by differences in species or age, or by some other factors, is not known at present.
There are a few other points related to CBF that require comment. (1) When measurements were made at the same hypothermic temperature but at two different times after onset (Greeley et al., 1991; Lafferty et al., 1978), flow rates were faster at the later time point and accompanied higher metabolic rates. This indicates that CBF and metabolism react in concert but also reinforces the practical issue of the importance of the length of hypothermic “equilibration.” (2) During selective brain surface cooling in rats (Kuluz et al., 1993) cortical blood flow measured by laser-Doppler (i.e., a method which yields information on relative changes only) doubled when temperature was lowered from 37°C to 33.4°C and then remained elevated despite further cooling to 30.9°C. However, this is contradicted by two recent studies in piglets that showed that after selective lowering of brain temperature to either 34°C (Laptook et al., 2001) or 25°C (Walter et al., 2000), CBF declined substantially and almost in parallel with CMRO2. It may be important to investigate further whether animal species, age, or depth of anesthesia (very light in rats) is responsible for this disparate behavior. (3) Evaluation of the effect of arterial carbon dioxide tension on cerebral perfusion during hypothermic cardiopulmonary bypass in dogs (Johnston et al., 1991) showed that although cortical blood flow after 30 minutes at 28°C was higher with pH-stat than α-stat management, after 90 and 150 minutes it was essentially the same, irrespective of the acid–base management strategy. This indicates that the influence of CO2 on vasculature at lowered temperatures may be short lived. (4) It has been shown that the vasoconstrictive effect of high PaO2 is maintained at 25°C to 27°C (Henriksen, 1986). This means that the oxygen-sensing mechanisms in cerebral arteries remain intact in moderate hypothermia. However, the observation that perfusion with 100% oxygen during cardiopulmonary bypass almost always leads to vasodilatation seems to suggest that other mechanisms (e.g., increased production of vasodilatory substances such as NO or decreased synthesis of vasoconstrictive factors) must be able to overcome the direct effect of O2 on the smooth muscle of blood vessels under particular conditions. (5) The effect of acid–base management strategy on neurologic outcome in patients maintained on hypothermic cardiopulmonary bypass during surgery depends on their age; in adults α-stat, and, in children, pH-stat strategy seem to produce fewer complications (duPlessis et al., 1997; Hickey, 1998; Hindman, 1998). It has been shown that the latter are caused in part by lipid microemboli generated in bone marrow (Brown et al., 2000). It is possible that, in adults, the higher blood flow to the brain during pH-stat management strategy carries more droplets from the yellow bone marrow and, hence, increases the number of blocked cerebral blood vessels. By contrast, newborn babies and children have mostly red bone marrow, with much lower fat content; therefore, the danger from microemboli becomes less and benefits arising from high CBF predominate.
Temperature dependence of cerebral oxygen extraction
Cerebral oxygen extraction [calculated as (arterial oxygen content – sagittal sinus oxygen content)/arterial oxygen content] at 28°C decreases to near half that at 37°C (Conroy et al., 1998) which is in agreement with the observation that cortical oxygen saturation, measured with near-infrared spectroscopy, increases at lower temperatures (Kurth et al., 1998). This would be expected from the previously mentioned findings that oxygen utilization by brain tissue declines in hypothermia, whereas PaO2 remains unaltered. Cortical oxygen saturation was greater in pH-stat (higher CO2) than α-stat (lower CO2) management of acid–base regulation (Kurth et al., 1998), consistent with the higher CBF in the former.
Conclusions
The activities of energy-producing pathways in brain, CMRglc, CMRO2 and CMRlac, are reduced 2- to 4-fold by a 10°C decrease in temperature; the type of dependence, linear or exponential, is difficult to establish. If the relation is exponential, it would mean that relatively small changes in temperature yield relatively large alterations in metabolic reactions. No consistent discontinuities in the temperature dependence have been found. Acid-base management strategy has no effect on metabolic rate for either oxygen or glucose. Autoregulation appears to be maintained between 38°C and 28°C−30°C, although human patients may be an exception. Uncoupling of flow and metabolism occurs below 28°C and is greater with the pH-stat strategy because of larger increases in CBF caused by addition of CO2. Cerebral oxygen extraction decreases when temperature is lowered, whereas oxygen saturation increases, particularly with the pH-stat regime. The ability to maintain constant CMRO2 and energy level during hypothermia, when blood flow is artificially reduced to 15% of the normothermic value, indicates that at lowered temperatures provision of substrates to the brain is more than sufficient, at least at a global level. Factors that independently stimulate metabolism, such as sympathetic arousal, may modify these responses to cooling.
PROLONGED UNCOMPLICATED HYPOTHERMIA
In contrast to the abundant literature on acute (short-term) hypothermia, very little is known about effects of cooling for longer than 3 h. Lafferty et al. (1978) noted that in anesthetized mongrel dogs maintained at 30°C, blood lactate increases from 0.48 mmol/L at 1 h (Table 1) to 2.08 mmol/L after 4 h. Similarly, McArthur et al. (1992) reported that in conscious rats kept at 19°C there was a sharp increase in the level of lactate during later periods of hypothermia, from 1.8 mmol/L at 12 h to about 6 mmol/L at 24 h. These findings, suggestive of metabolic acidosis, receive support from the work of Steen et al. (1979, 1980) who observed a significant decline in blood pH in paralyzed, sedated cats and monkeys subjected to 48 h of hypothermia at 29°C and dogs maintained at the same temperature for 24 h. Most animals survived 24 h, but not 48 h, of cooling. By contrast, Morray and Pavlin (1990) using the same model in dogs described only a slight arterial acidification, which was not statistically significant. There were, however, differences between experimental protocols in the two investigations: Steen et al. (1980) used 30%, whereas Morray and Pavlin (1990) used 100%, oxygen in the inspired gas. Consequently, PaO2 was 145 to 167 mm Hg in animals of the former study, and 400 to 500 mm Hg in the latter. Moreover, MABP decreased significantly in animals ventilated with gas containing the lower O2 concentration but increased in those on pure oxygen. During rewarming, one of the dogs in the study of Steen et al. (1980) died, whereas the remainder became progressively more acidotic and their blood pressure continued to decrease, even after infusion of epinephrine. By contrast, all animals investigated by Morray and Pavlin (1990) survived without need for ionotropic support and their MABP returned to the control value.
Conclusions
The currently available results are both insufficient and too conflicting to allow the drawing of meaningful conclusions either on the safety or the effectiveness of long-term moderate to deep whole-body hypothermia.
HYPOTHERMIA AND DISEASE STATES
There are several disease states in which delivery of substrates to the brain is disturbed; they include perinatal asphyxia, shock, stroke and cardiac arrest. All these states decrease the rate of ATP formation in brain, and hypothermia has the same effect. Therefore, a close scrutiny of the behavior of cerebral energy level and related parameters at lowered temperature is crucial for our understanding of the mechanisms that are responsible for the overall beneficial outcome of hypothermic therapy during or after pathologic insult.
Energy parameters during hypothermic hypoxia–ischemia
Since the early observations of Thorn et al. (1958) and Kramer et al. (1968) and as illustrated in Fig. 2, it has been shown repeatedly in various animal species, in different models and with two techniques of measurement, that hypothermia slows the rate of breakdown of the “high energy” phosphate compounds (PCr, ATP, ADP and AMP), as well as the rate of formation of inorganic phosphate and lactate (Berntman et al., 1981; Brunner et al., 1971; Chopp et al., 1989; Hägerdal et al., 1975b; Johnson et al., 1989; Katsura et al., 1992; Kramer et al., 1968; Laptook et al., 1995; Lin et al., 1995; Michenfelder and Theye, 1970; Natale and D'Alecy, 1989; Nedelcu et al., 2000; Nilsson et al., 1971; Stocker et al., 1986; Sutton et al., 1991; Swain et al., 1991a; Thoresen et al., 1995; Thorn et al., 1958; Verhaegen et al., 1995; Williams et al., 1997; Yager and Asselin, 1996). The lower the temperature the greater the effect, as expected. Unfortunately, very few studies have used more than one hypothermic point and measured kinetics of reactions, hence calculations of precise relations between the temperature and changes in energetic parameters are seldom possible. There is, moreover, no agreement whether this relation is exponential or linear. Michenfelder and Theye (1970) measured ATP hydrolysis in dog brain at 30°C and 37°C and, based on the decline in rate, concluded that it was consistent with the Arrhenius relation. In a more detailed investigation in rabbit brain, Stocker et al. (1986) determined decay half-times for PCr and ATP and accumulation of Pi at three temperatures, 35°C, 24°C, and 21°C and constructed the corresponding Arrhenius plots from which they calculated activation energies of 70, 61.2, and 62.4 kJ/mol, respectively. These energies of activation correspond to Q10 values of 2.6, 2.3, and 2.4, respectively. The rather long half-times for the normothermic decline in PCr and ATP (19 and 35 minutes, respectively) suggest, at variance with the authors' claim, that the experiments were performed in partial and not total ischemia. By contrast, a linear relation between brain temperature in the range 27.6°C to 41°C and the rate of energy utilization was described in piglets by Laptook et al. (1995). The decline was about 5.3% per 1°C, which corresponds to an approximately 2-fold change in rate between 37° and 27°C. Notwithstanding these differences in the type of relation, it seems that, as is the case with CMRO2, the breakdown of high-energy phosphate compounds is slowed by 2- to 3-fold for a 10°C decline in temperature. Neither animal species nor age, nor the type of acid–base management, influences this relation.
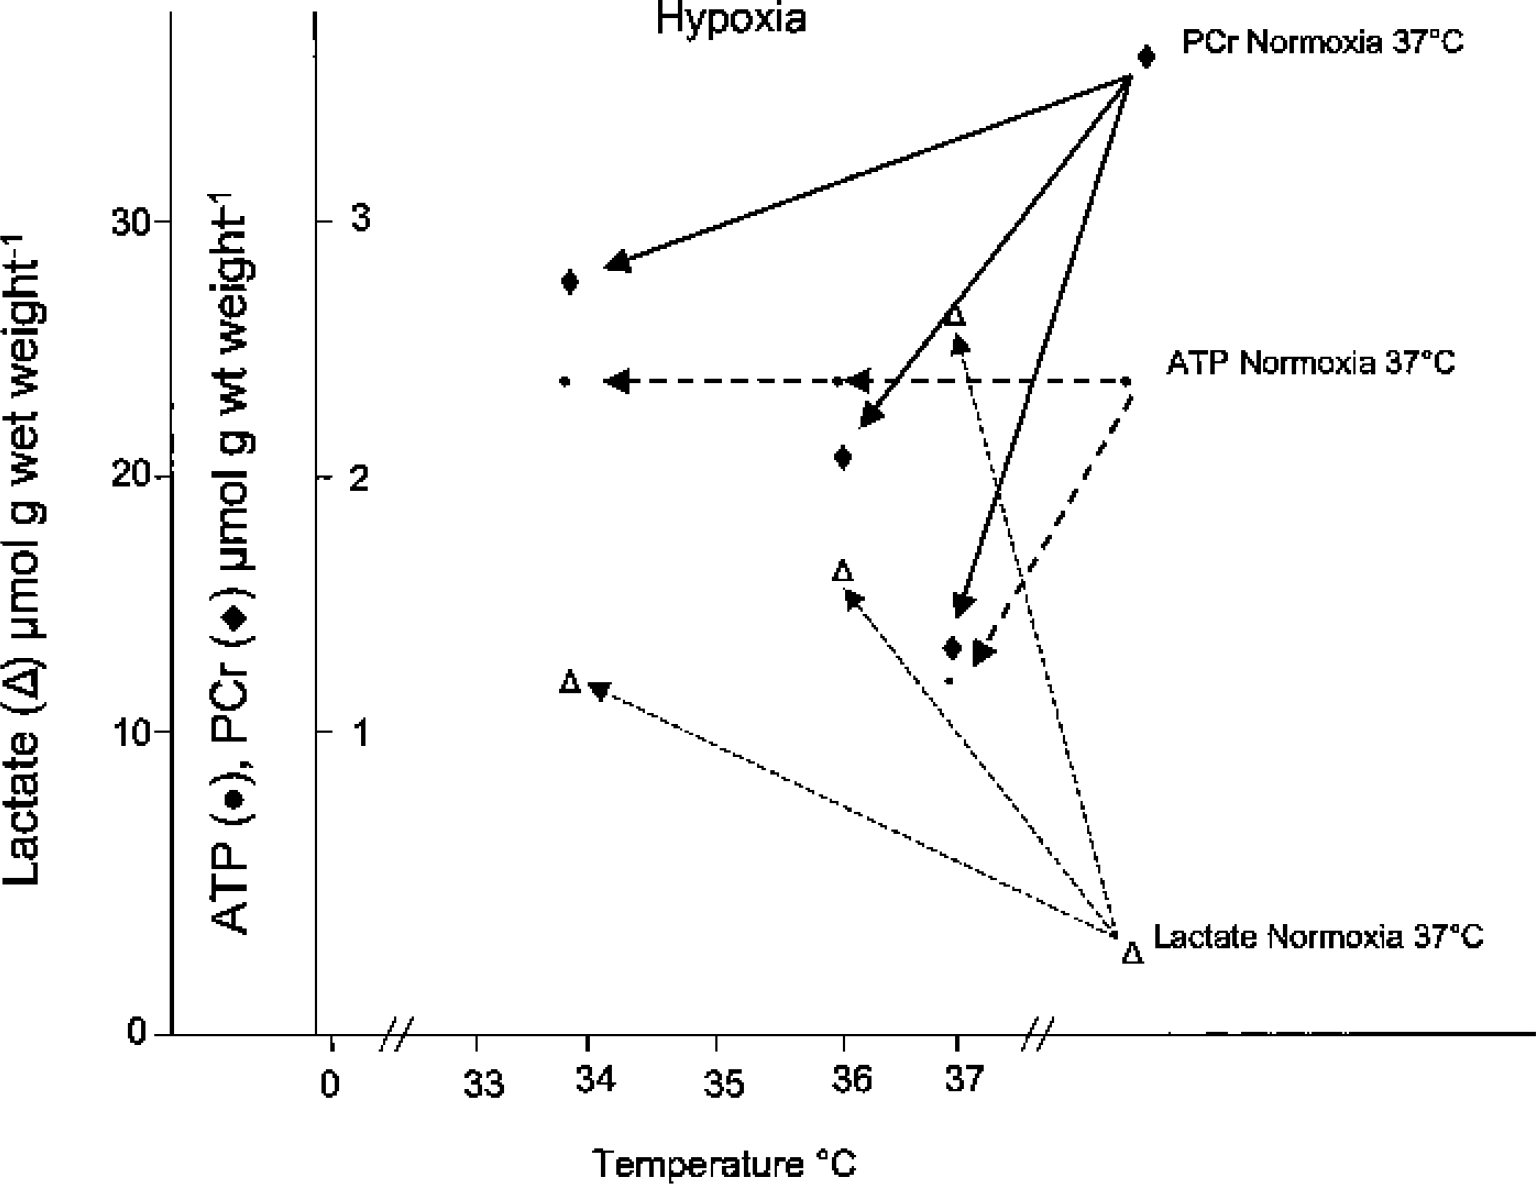
Protective effect of mild hypothermia on the breakdown of phosphocreatine (PCr) and ATP and the formation of lactate. Halothaneanesthetized, fed rats underwent unilateral ligation of the common carotid artery and were then subjected to 20 minutes of breathing in nitrous oxide and nitrogen (70:30) either at 37°C, 36°C, or 34°C. At the end of the experiment, brains were frozen in situ in liquid nitrogen, and the levels of the compounds of interest were measured by standard enzymatic methods in the ipsilateral hemisphere. (Data from Berntman et al., 1981.)
All studies in which the rate of lactate production was measured have found that hypothermia retards glycolysis by slowing glucose breakdown and lactate formation. However, reports by Lin et al. (1995) and Natale and D'Alecy (1989) concluded that “brain temperature modulations during global ischemia fail to influence extracellular lactate levels” [from the title of the article by Lin et al. (1995)]. This conclusion was based on determinations of the metabolite level at a single time point, 10 minutes, of ischemia. Although the statement correctly reflects the experimental findings, it gives a misleading message. Complete ischemia eliminates the supply of glucose to the brain via the circulation and very rapidly depletes the extremely meager internal stores of the sugar within the tissue. Hence, despite the reduced velocity of glycolysis, at some stage of the insult the amount of lactate accumulated will perforce become identical in normothermia and hypothermia owing to lack of substrate. At that moment, high-energy reserves also become exhausted owing to the loss of mechanisms responsible for their generation in the face of continuing ATP utilization (Sutton et al., 1991). The time at which this stage is reached will be inversely related to the hypothermic temperature and directly related to the metabolic rate of the animal. The same reason can explain the lack of temperature effect on the levels of high-energy phosphates after 20 minutes of total brain ischemia, reported by Busto et al. (1987).
Tissue pH is also related to energy metabolism because the key reaction producing protons in cells is ATP hydrolysis (Alberti and Cuthbert, 1982; Hochachka and Mommsen, 1983; Krebs et al., 1975). Therefore, not unexpectedly, acidification that accompanies brain hypoxia–ischemia is slowed during hypothermia (Aoki et al., 1993; Chopp et al., 1989). Unfortunately, because NMR estimates pH from the shift in the position of the Pi peak relative to that of the PCr peak, and the latter declines to noise levels within a few minutes of oxygen–glucose deprivation, only the information gained with this technique about the initial pH change during an insult is reliable. One of the disconcerting features of the study by Chopp et al. (1989), which is difficult to explain, is that gradual lowering of temperature had no graded effect on changes in either pH or energetic parameters: the differences between 38.4°C and any of the three hypothermic points (34.6°C, 32.1°C, and 26.8°C) were identical. This is at variance with the large body of results from other laboratories discussed previously.
Information on the changes in CBF during hypothermic ischemia is very limited. Laser-Doppler measurements in rats (Jenkins et al., 2001) showed that after 6 minutes of bilateral carotid artery occlusion accompanied by severe hypotension the residual flow to hippocampus, presumably via vertebral and ascending laryngeal arteries, was 17% higher at 34°C than at 38°C. Whether this increase was due to a redistribution of blood flow among various brain regions caused by mild hypothermia, or to an increase in total flow to the organ [due to redistribution of flow in the whole body (Fox et al., 1984)] was not addressed in the study. The authors argued that the enhancement of blood flow during insult could have been responsible for the reduction in damage measured 7 d later. This postulate is in disagreement with the generally accepted notion that incomplete ischemia (some residual CBF) can be more damaging than short-term complete cessation of flow, because continued delivery of even small amounts of glucose to tissue allows a much greater reduction in intracellular pH.
Influence of hypothermia on hypoglycemia-induced brain damage and survival
Surprisingly, very little is known about the effects of lowered temperature in hypoglycemia and hypoglycemic coma, although hypothermia is a well-known concomitant in mammals in these situations. Buchanan et al. (1991) found that rats that were maintained at 22°C to 25°C during infusion of insulin with glucose clamp returned to normal behavior after euglycemia was restored, whereas none of the animals maintained at a core temperature of 37°C survived more than 7 h. The beneficial action of hypothermia in rats subjected to a 30-minute period of hypoglycemic coma at 33°C versus a normothermic control (Agardh et al., 1992) was much less convincing and depended on the type of anesthesia and brain region. In histologic studies, no influence of temperature on the degree of injury was seen in neocortex, although fewer injured neurons were present in caudoputamen. More work is needed to determine whether hypothermia could become a useful adjunct therapy in the management of hypoglycemic coma.
Effect of temperature on the recovery of brain energy parameters after periods of substrate deprivation
Recovery of oxygen consumption during reperfusion and warming after a hypoxic–ischemic insult during hypothermia is faster and more complete than after resuscitation from a similar insult at normothermia. The magnitude of the protective effect increases with the depth of cooling (Aoki et al., 1993; Conroy et al., 1998), but acid–base management strategy has no influence (Aoki et al., 1993). Similarly, postinsult restoration of PCr and ATP levels (measured by NMR) occurred sooner and was more complete in gerbils made ischemic for 15 minutes at 34°C (Kimura et al., 2002) and in piglets subjected to hypoxia–ischemia at 15°C (Chopp et al., 1989; Sutton et al., 1991) than at 37°C. It is interesting (Sutton et al., 1991) that the almost complete recovery of ATP and other energetic parameters, seen after 1 h of normothermic reperfusion in piglets subjected to cardiac arrest in hypothermia, occurred despite the fact that the period during which [ATP] remained below the level of detection was the same (21 minutes) and the total duration of insult substantially longer (48 minutes at 15°C) than in normothermic controls (31 minutes at 37°C). By contrast, analytical measurements (Conroy et al., 1998) failed to detect any differences between the nucleotide levels in brain samples from groups of adult pigs subjected to either normothermic or hypothermic (34°C, 31°C, or 28°C) hypoxic–ischemic insults and evaluated after termination of cardiopulmonary bypass. Greater sensitivity of adult animals to periods of glucose–oxygen deprivation and thus the possibility for more severe pathologic changes, on the one hand, and the use of only moderate hypothermia on the other, may explain at least in part the apparent lack of beneficial effect of cooling. Nevertheless, the general balance of evidence indicates that postischemic recovery of energy parameters is better when an insult occurs at lowered temperatures. Several factors are likely to modulate the magnitude of this beneficial effect: animal species and age, severity and type of insult, and depth of hypothermia, to mention just a few. Consistent with this suggestion are the observations that even mild intraischemic hypothermia can reduce postischemic hyperperfusion, delayed postischemic hypoperfusion, blood–brain barrier disruption and brain edema (Karibe et al., 1994).
Two other observations deserve mention: (1) the recovery of ATP and PCr during the first 30 minutes of postischemic reperfusion has been reported to be much faster in pH-stat than in α-stat management of acid–base balance (Aoki et al., 1993) and (2) the beneficial effect of even mild intrainsult hypothermia (32.5°C to 34°C) may be long-lived because ATP levels higher than those in noncooled controls were still maintained in cooled gerbils 1 week after total cerebral ischemia (Kimura et al., 2002; Welsh et al., 1990).
Return of tissue pH to physiologic values is improved in animals subjected to hypoxic–ischemic insult in hypothermia (Chopp et al., 1989) and is faster with pH-stat management (Aoki et al., 1993), possibly because high PaCO2 ensures generalized high blood flow with few or no underperfused areas.
Effects of post-ischemic hypothermia on energetics
Much less is known about the effects of hypothermia initiated after a hypoxic–ischemic insult. Medium to long-term experiments in anesthetized newborn piglets (Amess et al., 1997; Thoresen et al., 1995) showed the animals to be prone to hypotension, which required fluid replacement (often with glucose) and, in some cases, pharmacological intervention. The situation may be similar in sedated and paralyzed adult humans subjected to hypothermia after traumatic brain injury (Marion et al., 1997).
With respect to the influence of postinsult cooling on cerebral energy metabolism, it was reported that synaptic and free mitochondria isolated from brains of rats which had undergone 30 minutes of normothermic ischemia followed by 2-h recovery at 30°C showed no decrease in activities of complexes II-III and IV, whereas reductions of 15 to 30% occurred in animals which had recovered at 37°C (Canevari et al., 1999). Baldwin et al. (1991) investigated the effects of cooling at 30°C for 60 minutes (initiated immediately after 20 minutes of complete brain ischemia) on CMRO2, CBF, and cerebral vascular resistance in dogs. During reperfusion for 240 minutes, CMRO2 and CBF/CMRO2 recovered much better in hypothermic than in normothermic animals, despite the occurrence of delayed hypoperfusion of the same magnitude in the cerebrum of both groups. Cerebral vascular resistance returned to preischemic values after 120 minutes of reperfusion in all dogs but remained at this level 2 h later only in animals subjected to cooling. Hypothermia also decreased intracranial pressure, which might well be owing to the reduction in brain water content recorded by other authors in animals subjected to an ischemic insult at lowered temperatures (Aoki et al., 1993; Kurth et al., 1998). By contrast, Yager and Asselin (1996) did not see any beneficial effect of 4-h whole-body cooling to either 34°C (brain temperature 34.8°C) or 31°C (brain temperature 33.9°C) after 3 h of normothermic brain hypoxia–ischemia in 7-day-old rats. However, using the same model albeit in 14-day-old animals Taylor et al. (2002) obtained PCr/Cr ratios identical to those of control brain after 6 h of hypothermia at 30°C delayed by 6 h after insult; this was considered indicative of neuroprotection.
Twelve hours of mild hypothermia (35°C) initiated in newborn piglets immediately after a severe transient hypoxic-ischemic insult at 39°C (Thoresen et al., 1995) ameliorated the delayed cerebral energy failure measured as the PCr/Pi and the ratio of nucleotide triphosphates/“exchangeable phosphate pool” ([Pi] + [PCr] + [(γ + α + β)-nucleotide triphosphate]) and reduced the delayed increase in cerebral lactate (Amess et al., 1997). Both studies involved NMR technology and used apparently the same, or a very similar, animal model. The differences between hypothermia-treated piglets and those maintained in normothermia were statistically significant, although some results showed very large SD values. A similar beneficial effect on the PCr/Pi of a 24-h recovery at 30°C as compared with that at 37°C was seen in a rat neonatal hypoxic–ischemic model (Nedelcu et al., 2000). Interestingly, sedation and paralysis may be necessary to achieve beneficial effects of lowering the temperature. Prolonged (24 h) mild hypothermia after an ischemic–hypoxic insult was not neuroprotective in unsedated newborn pigs (Thoresen et al., 2001), whereas a marked positive effect was seen after 3 to 12 h of cooling in anesthetized animals (Haaland et al., 1997).
Conclusions
In sedated, paralyzed mammals hypothermia delays breakdown of high-energy phosphate compounds and reduces the rate of Pi and lactate formation during periods of oxygen–glucose deprivation. However, if the insult is sufficiently prolonged, there will eventually be no difference in the values of energy parameters between the brains of hypo- and normothermic animals. Better maintenance of ATP in the face of decreased glycolytic rate under conditions when the latter is the only source of energy indicates that some ATP-consuming reactions have very high temperature coefficients. Acidification that accompanies hypoxia is also slowed by hypothermia. Lowering temperature during insult improves recovery of all parameters during the reperfusion–rewarming phase, and the effect may last for days. Limited experimental evidence suggests that mild, short-term postinsult hypothermia accelerates normalization of CMRO2 and minimizes mitochondrial damage whereas longer periods (12–24 h) may ameliorate and/or prevent secondary changes in energy parameters.
A SPECIAL CASE
Our considerations in the preceding sections of this review have covered information on both the mature and immature brain. No differences in responses of various parameters to hypothermia, or the consequences thereof, that could have been attributed to age were found between newborn and young animals on the one hand and adult on the other. This is perhaps surprising because brains of immature mammals are highly dynamic entities that differ in many respects from their mature counterparts. These differences are not the subject of this review, but two points are worth mentioning. The first is that rates and times of growth and maturation are species specific; some animals such as guinea pigs or sheep are born very mature whereas others like rats or mice are very immature. Human neonates are between these extremes. Rats take days to reach adulthood, humans take years. Thus the choice of an animal as an appropriate experimental model has to take into account the goal that the study is supposed to achieve. The second point is that, whereas almost all of the ATP in adult brain is used to support its major function (i.e., generation and transmission of impulses), in immature brain a portion of it is directed to producing large quantities of macromolecules, such as DNA, RNA, protein, and lipid. Hence, whereas damage to an adult brain may impair its function, that to an immature brain will disturb not only function but also growth and maturation.
GENERAL SUMMARY AND CONCLUSIONS
Considerable knowledge has accumulated about the effects on brain of acute 0.5- to 3-h hypothermia in sedated and paralyzed animals. It has been established that when MABP is maintained, PaO2, blood glucose, and lactate are not significantly altered and pH, if uncorrected, increases. At the level of whole brain, glucose and lactate remain constant and intermediates of the TCA cycle are somewhat reduced, whereas the high-energy phosphate compounds and pH increase in a direct relation with the degree of hypothermia; there is no evidence for the occurrence of tissue hypoxia. Global CMRglc and CMRO2 decrease in parallel, 2- to 4-fold per 10°C reduction in temperature; flux through the TCA cycle declines. Species, sex, and age of the animal make no difference, and the acid–base management strategy exerts no significant or consistent effect except, as would be expected, on blood pH. Heterogeneity in responses of CMRglc to lowered temperatures occurs at a regional level. In a substantial proportion of studies on experimental animals, autoregulation has been found to be maintained down to 28°C, in particular when the α-stat strategy of acid–base management is used, whereas uncoupling of flow and metabolism occurs below this temperature. Unfortunately, there are large differences in findings concerning CBF.
Hypothermia during periods of oxygen–glucose deprivation, such as occur in hypoxia–ischemia, consistently slows the rate of glucose, PCr, and ATP breakdown and Pi and lactate formation, as well as improving recovery of energetic parameters during the reperfusion phase. The magnitude of these effects depends on the temperature itself, severity of insult, animal species, and perhaps its age.
In sedated and paralyzed newborn animals, periods of mild hypothermia for 12 h or more after normothermic insults seem to prevent or ameliorate the secondary changes in energetic parameters that occur in normothermic animals within hours of reperfusion.
There are several conclusions that can be drawn from the observations summarized: (1) Temperature reduction slows ATP generation by a direct effect on rates of synthetic reactions. However, hypothermia also decreases velocities of energy-consuming processes, and the effect on the latter must be greater than the “inhibition” of production because levels of high-energy phosphate compounds increase in uncomplicated hypothermia and decrease more slowly during hypoxia–ischemia. (2) The concentrations of high-energy phosphate compounds are better maintained after periods of both hypothermic hypoxia–ischemia and postinsult hypothermia. This suggests that one of the targets for the “beneficial” actions of hypothermia are mitochondria themselves because they are the main producers of ATP in brain. (3) Intracellular alkalinization which follows reductions in temperature should stimulate glycolysis (Erecinska and Silver, 1989, 1994, 2001) and hence increase ATP supply, irrespective of changes in other regulatory factors of the pathway. (4) The strategy of acid–base management during hypothermia seems to have no significant influence on brain energy synthesis (i.e., on the behavior of CMRglc and CMRO2). Nevertheless, there are indications from studies on newborn and young animals that recovery of pH and energetic parameters after hypothermic hypoxic–ischemic insult is better with pH-stat management. (5) CBF in hypothermia is more than sufficient to ensure an adequate supply of substrates for ATP production.
In summary, it is the opinion of the present reviewers that hypothermia during and after hypoxic–ischemic insults helps to preserve brain ATP supply and level which is a sine qua non for the maintenance of normal CNS function (Fig. 3). This does not mean, however, that the beneficial actions of hypothermia may not extend beyond this simple metabolic effect.
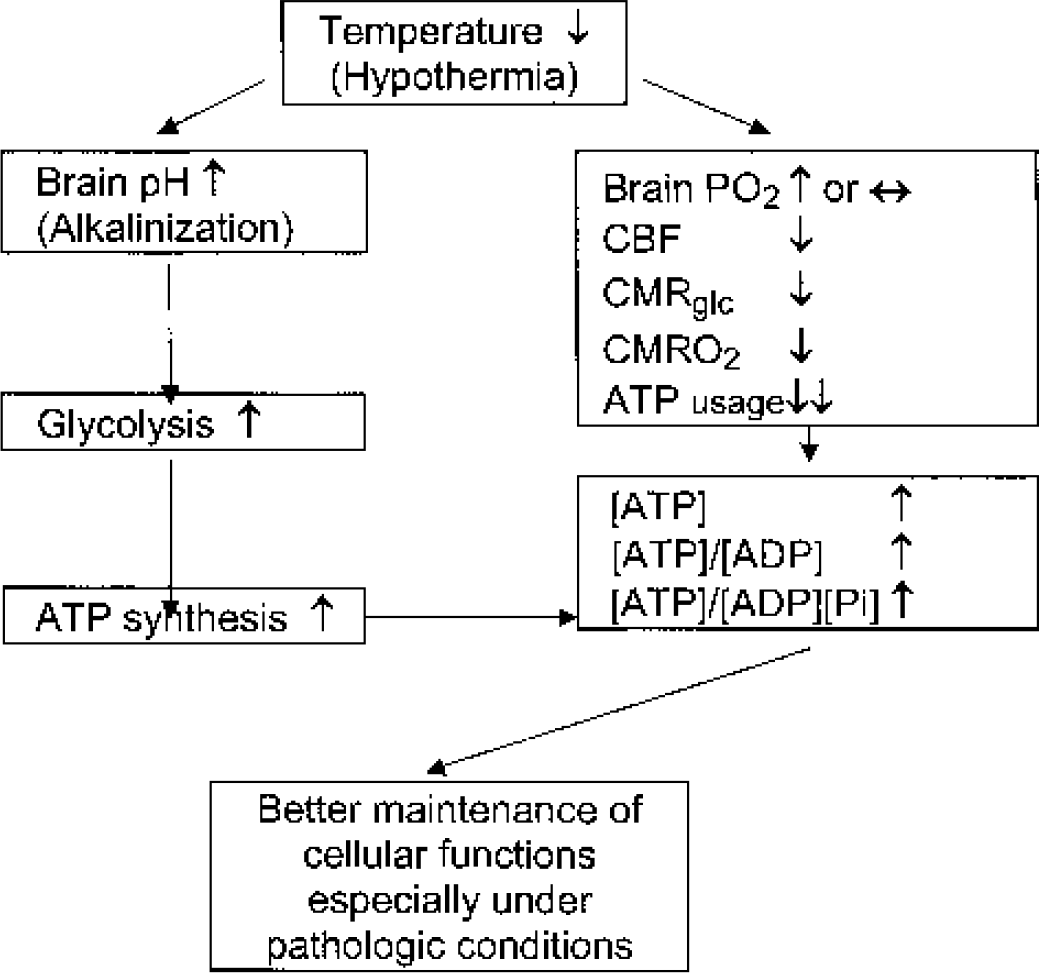
A diagram illustrating the effects of hypothermia on brain energy metabolism. Pi, inorganic phosphate; CMRglc, cerebral metabolic rate for glucose; CMRO2, cerebral metabolic rate for oxygen.
CLINICAL IMPLICATIONS AND SUGGESTIONS FOR THE FUTURE
This review has provided ample evidence that hypothermia exerts multiple effects on brain energy metabolism, which should prove beneficial in the treatment of two major human clinical problems, brain trauma and perinatal hypoxia–ischemia. The temporary setbacks such as the apparent lack of effect in some of the recent clinical trials (Clifton et al., 2001) may be due to factors that arise from our present lack of detailed understanding of the mechanisms involved. Therefore, we have identified areas that in our opinion need addressing urgently: (1) Choice of the proper experimental model. Serious consideration should be given as to what species best represents changes that occur in humans of a particular age and which model most faithfully reflects the commonest human pathologies. This is a difficult problem because of the costs involved, the amount of background information available (the most commonly used model is the rat, for which there is a plethora of basic information), and the high level of expertise required for working with larger animals. It is worth mentioning that the dog, with its high susceptibility to infections during hypothermia, is not an ideal candidate. Selective brain versus total-body cooling, which may prove particularly relevant for treatment of perinatal damage, has to be evaluated stringently. (2) The role of age and maturity. Although several studies have been performed in newborn or young animals, the impact of age as such has not been explored. There is a great potential in using hypothermia to prevent or ameliorate CNS damage caused by perinatal hypoxia–ischemia, and there are substantial differences between mature and immature brain that could affect the outcome. (3) Heterogeneity in tissue responses. Different regions of the brain exhibit different metabolic rates, activities, and vulnerabilities to insults. How does temperature influence the balance? Which type of injury may respond favorably to a hypothermic intervention? Both CMRglc and CBF can be measured at a local level, and the results produced thus far hardly give a consistent picture. (4) Length and depth of intervention as a function of time after insult. Although the effects of an acute reduction in temperature (a few hours) have been widely explored, the consequences of periods of hypothermia longer than 12 h have hardly been addressed. Efforts should center on mild hypothermia because smaller decreases in temperature are likely to minimize deleterious consequences on circulation and kidneys. Selective head cooling or a combination thereof with only slight total-body cooling may even help to eliminate the latter. Experimental designs should include further evaluation of the preferred type of acid–base management strategy, the role of compounding factors such as sympathetic stimulation or preexisting medical conditions, and long-term (weeks to months) consequences of reductions in temperature. (5) Identification of reactions that are highly temperature dependent. The final goal of any research is elucidation of the mechanisms responsible for observed changes. It is the belief of the present authors that a full understanding of the beneficial effects of hypothermia will probably require a combination of studies on whole animals with those in much simpler systems, such as cells or perfused organs.