
Abstract
The recent introduction of a number of new radiotracers suitable for imaging the serotonin transporters (SERT) has radically changed the field of SERT imaging. Whereas, until recently, only one selective SERT radiotracer was available ([11C]McN 5652) for SERT imaging with positron emission tomography (PET), several new C-11-labeled radiotracers of the N,N-dimethyl-2-(arylthio)benzylamine class have been described as appropriate imaging agents for the SERT. The aim of this study was to conduct a comparative evaluation of four of the most promising agents in this class ([11C]ADAM, [11C]DASB, [11C]DAPA, and [11C]AFM) with the reference tracer [11C]McN 5652 under standardized experimental conditions. This evaluation included in vitro measurements of affinity and lipophilicity, and in vivo PET imaging experiments in baboons. In vitro, DASB displayed significantly lower affinity for SERT than the other four tracers. In the blood, [11C]DASB and [11C]AFM display faster clearance and higher free fractions. Brain uptake was analyzed with kinetic modeling using a one-tissue compartment model and the metabolite-corrected arterial input function. The kinetic uptake of [11C]DASB was significantly faster compared with the other compounds, and the scan duration required to derive time-independent estimates of regional distribution volumes was shorter. [11C]DAPA exhibited the slowest brain kinetic. Regional-specific-to-nonspecific equilibrium partition coefficient (V3“) was the highest for [11C]AFM, followed by [11C]DASB and [11C]DAPA, which in turn provided higher V3” values than [11C]ADAM and [11C]McN 5652. From these experiments, two ligands emerged as superior radiotracers that provide a significant improvement over [11C]McN 5652 for PET imaging of SERT: [11C]DASB, because it enables the measurement of SERT availability in a shorter scanning time, and [11C]AFM, because its higher signal-to-noise ratios provide a more reliable measurement of SERT availability in brain regions with relatively low density of SERT, such as in the limbic system.
Alterations of serotonin (5-HT) transmission have been implicated in a wide variety of psychiatric conditions, such as mood and anxiety disorders. The 5-HT transporter (SERT) is a critical protein for the regulation of 5-HT function and the site of action for most commonly used antidepressants. Because of their localization on the 5-HT nerve terminals, the density of SERT sites is a marker for the number or integrity of the 5-HT terminals. Therefore, in vivo imaging of SERT with positron emission tomography (PET) or single photon emission computed tomography (SPECT) provides a unique tool to study 5-HT function in health and disease.
Several postmortem studies have documented the distribution of SERT cells in the human brain (Cortes et al., 1988; Laruelle et al., 1988; Backstrom et al., 1989; Plenge et al., 1990; Rosel et al., 1997). High SERT density is observed at the level of the midbrain nuclei, reflecting the presence of SERT on both the 5-HT cell body (raphe nuclei) and on terminals of the dense 5-HT innervation of the adjacent structures (substantia nigra, nucleus interpeduncularis, locus ceruleus, nucleus nervi hypoglossi, nucleus nervi facialis). High SERT density is also observed in the thalamus (especially in the superior and inferior colliculi and the midline nuclei, with lower density in the anterior nuclei of the thalamus), the hypothalamus, and the striatum. Intermediate levels are found in the limbic and paralimbic structures, including the hippocampus, parahippocampal gyrus, entorhinal cortex, amygdala, and cingulate cortex. In humans, low levels of SERT are observed in the neocortex, and very low to negligible levels have been reported in the cerebellum.
The development of radiotracers for in vivo imaging of SERT has been long and difficult. A large number of radioligands such as [11C]cyanoimipramine, [11C]sertraline, [11C]dapoxetine, [11C]fluoxetine, [11C]citalopram, [11C]cis-DDPI, [11C]LY257327, [11C]venlafaxine, [11C]nor-β-CIT, [123I]5-iodo-6-nitroquipazine, and [76Br]5-bromo-6-nitroquipazine have been evaluated as potential PET or SPECT radiotracers and found to be unsuitable due to high lipophilicity and/or high nonspecific binding (Hashimoto et al., 1987; Lasne et al., 1989; Dannals et al., 1990; Hume et al., 1991; Nelson et al., 1991; Livni et al., 1994; Scheffel et al., 1994; Jagust et al., 1996; Bergstrom et al., 1997; Smith et al., 1997; Zea-Ponce et al., 1997; Lundkvist et al., 1999).
The SPECT radiotracer [123I]β-CIT, which exhibits similar affinity for dopamine transporters (DAT) and SERT (Neumeyer et al., 1991), was the first radioligand successfully used to image SERT in the living human brain. [123I]β-CIT labels predominantly DAT in the striatum and SERT in the midbrain (Laruelle et al., 1993b). This regional selectivity stems from the abundance of DAT relative to SERT in the striatum, and of SERT relative to DAT in the midbrain. Thus, the midbrain uptake of [123I]β-CIT has been studied in several pathologic conditions (Tiihonen et al., 1997; Heinz et al., 1998; Malison et al., 1998; Jacobsen et al., 2000; Laruelle et al., 2000; Willeit et al., 2000). While these studies yielded interesting findings regarding associations between low midbrain SERT density and depression, alcoholism, and impulsive behavior, they are limited by the fact that [123I]β-CIT allows the measurement of SERT binding only in the midbrain region.
[11C]McN 5652 was the first PET radiotracer successfully developed and used to image SERT density in humans (Suehiro et al., 1993a,b; Szabo et al., 1995a; Szabo et al., 1999; Buck et al., 2000; Parsey et al., 2000; Ikoma et al., 2002). For example, [11C]McN 5652 has been used to study 5-HT innervation in MDMA (“ecstasy”) abusers (McCann et al., 1998) and patients with mood disorders (Ichimiya et al., 2002). However, [11C]McN 5652 as a PET radiotracer is associated with some limitations (Parsey et al., 2000): (1) the brain uptake is protracted, and thus at least 120 minutes of data acquisition in humans is required to yield time-independent measures of SERT binding potential (BP) in regions with high SERT density, such as the midbrain; (2) the nonspecific binding is relatively high, thus precluding the reliable quantification of SERT in regions of relatively low density such as the limbic system; and (3) the plasma free fraction is too low to be measured with accuracy using the conventional ultracentrifugation method, thus making it impossible to control for this variable in clinical studies.
More recently, a new series of SPECT SERT radiotracers from the diarylsulfide class of compounds has been introduced and evaluated by Kung and co-workers: [123I]IDAM (Acton et al., 1999a; Kung et al., 1999; Oya et al., 1999) and [123I]ADAM (Choi et al., 2000; Oya et al., 2000; Acton et al., 2001). The C-11-labeled counterpart of [123I]ADAM, [11C]ADAM, has recently been reported (Vercouillie et al., 2001). A number of compounds in this same class were also developed by Wilson et al. (Wilson and Houle, 1999; Wilson et al., 2000) as potential PET radiotracers. Among these, [11C]DASB has been evaluated in rats and humans (Houle et al., 2000; Ginovart et al., 2001; Meyer et al., 2001). We recently introduced several new C-11-labeled derivatives of these structures, including [11C]DAPA (Huang et al., in press) and [11C]AFM (Huang et al., 2001), as selective PET radiotracers to image SERT (Fig. 1). All of these compounds showed in vivo distribution in rat brain consistent with the known regional density of SERT, and their specific binding was blocked by pretreatment with selective 5-HT reuptake inhibitors (SSRIs). Therefore, all appeared to be suitable candidate radiotracers to label SERT in vivo with PET or SPECT.
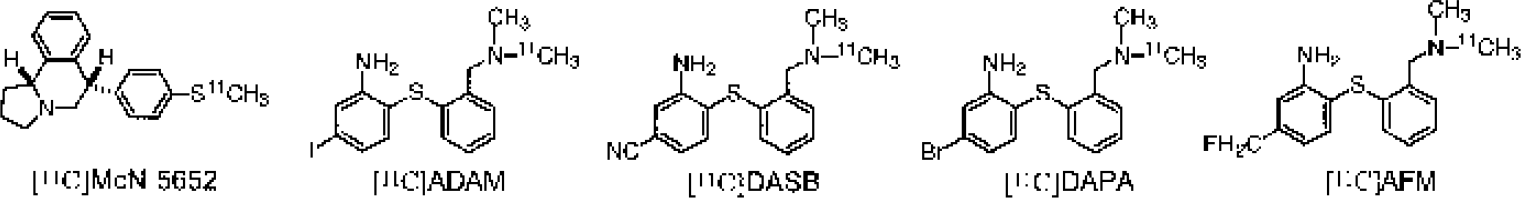
Chemical structures of the ligands evaluated in this study as imaging agents for the serotonin transporters.
The aim of the present investigation was to compare four of these new C-11 -labeled candidate SERT radiotracers ([11C]ADAM, [11C]DASB, [11C]DAPA, and [11C]AFM) with the current reference tracer, [11C]McN 5652. Characterization of these five tracers was conducted under standardized conditions to facilitate an unbiased comparison. In vitro characterization included measurement of affinity for SERT (at room and body temperatures) and lipophilicity. In vivo evaluation was carried out with PET experiments in baboons: two baboons were studied twice with each of the radiotracers. The central goal of this investigation was to assess whether any of these new tracers provides a substantial improvement over [11C]McN 5652 as imaging agent to quantify SERT availability in vivo with PET. Given the limitations of [11C]McN 5652 discussed above, the most critical improvement criteria included a faster kinetics of uptake and higher target-to-background ratio, as the former would enable time-independent derivation of SERT parameters in shorter scanning sessions, while the latter would improve the reliability in the quantification of SERT availability in regions of relatively low SERT density, but of great significance in psychiatric conditions, such as the limbic system.
MATERIALS AND METHODS
Chemistry
The standard and radiolabeling precursors of ADAM and DASB were synthesized at the University of Pennsylvania and the University of Toronto, respectively (Oya et al., 2000; Wilson et al., 2000). The standard and radiolabeling precursors of McN 5652, DAPA, and AFM were synthesized at Columbia University (Huang et al., 1998, 2001, 2002). Radiolabeling procedures were performed as previously described (Parsey et al., 2000; Wilson et al., 2000; Huang et al., 2001, 2002; Vercouillie et al., 2001). For the preparation of [11C]ADAM, [11C]DASB, [11C]DAPA, and [11C]AFM, the following procedure was used: radiolabeling precursor (0.3–0.5 mg) was dissolved in N,N-dimemylformamide (DMF, 0.4 mL) in a 1.0-mL reaction vial. [11C]Methyl iodide was bubbled through the precursor solution. When maximum radioactivity was reached in the reaction vial, the bubbling and vent needles were removed and the reaction solution was heated in a water bath (85° to 90°C) for 5 minutes. The crude product was purified using a semipreparative HPLC system (HPLC column: Phenomenex Prodigy C18 ODS-Prep, 10 μ,10 × 250 mm; Eluent: mixture of MeCN and 0.1 mol/L ammonium formate, pH 6.5, with composition depending on the particular tracer; Flow rate: 8–10 mL/min). The product fraction was collected, diluted with water (100 mL) and passed through a Waters classic C18 Sep-Pak. After washing with water (10 mL), the Sep-Pak was eluted with EtOH (1 mL) to recover the radiolabeled product. The EtOH solution was then mixed with sterile normal saline (9 mL), filtered through a 0.22-μm membrane filter and the filtered solution collected in a sterile vial. The radiolabeled products (25–100 mCi) were obtained in more than 95% chemical and radiochemical purity.
In vitro binding assays
Measurements of the inhibition constants (Ki) of the five compounds were performed at Columbia University on rat frontal cortex homogenates using [3H]paroxetine, as previously described (Laruelle et al., 1988). Briefly, male Sprague-Dawley rats (250–300 g) were killed by decapitation. Dissection of the brain was carried out on ice and samples of the frontal cortex were stored at −40°C until the time of binding assay. After thawing, samples were homogenized in 10 volumes of buffer (50 mmol/L Tris-HCl, pH 7.4, 120 mmol/L NaCl, and 5 mmol/L KCl). The homogenates were centrifuged at 10,000 g for 10 minutes. Pellets were resuspended in 10 volumes of the buffer, incubated at 37°C for 10 minutes, and centrifuged again. This procedure was then repeated a third time.
For the binding assay, membranes were suspended in the buffer at a final protein concentration of 5 mg/mL. Unlabeled drugs were dissolved in dimethyl sulfoxide in borosilicate glass tubes to yield a 1-mmol/L stock solution, from which subsequent serial dilutions were performed with the buffer. Aliquots of tissue preparation were incubated with [3H]paroxetine (0.1 nmol/L) at 22°C or 37°C for 60 minutes in the absence or presence of unlabeled drug (10−5 to 10−12 mol/L) to yield a final volume of 0.5 mL (borosilicate glass tubes). Nonspecific binding was defined by incubation with 10 μmol/L of citalopram. Each concentration was performed in triplicate. After incubation, the mixture was rapidly filtered through Whatman GF/B glass fiber filters using a 48-channel cell harvester (Bran-del, Gaithersburg, MD, U.S.A.). The filters were washed three times with 4 mL each of ice-cold buffer, placed in vials with 4 mL Ultima Gold solvent (Packard Instrument Co., Downers Grove, IL, U.S.A.), and counted the following day for radioactivity in a liquid scintillation counter (Tricarb 1500, Packard Instrument Co.). This experiment was performed three times at 22°C and 37°C, on three different days. New solutions of the test compounds were prepared on each experiment day. Ki values were derived using GraphPad Prism software (San Diego, CA, U.S.A.).
In vitro log P measurement
Octanol/water partition coefficients of the radiolabeled compounds were measured at Columbia University, using the method of Wilson et al. (2001), with some modifications. Briefly, 300 to 500 μCi of radiotracer in EtOH was added to a separatory funnel containing octanol (20 mL) and 0.02 mol/L phosphate buffer (20 mL, pH 7.4). The mixture was shaken mechanically for 3 minutes and the layers were separated. The octanol layer (15 mL) was transferred to a second separatory funnel containing 15 mL of the phosphate buffer. The mixture was shaken mechanically for 3 minutes and the layers were separated. This second octanol layer was then partitioned into four test tubes (2 mL each) and the phosphate buffer (2 mL each) was added. The test tubes were vortexed for 10 minutes, and then centrifuged for 10 minutes at 1,000 g to separate the layers. The octanol and aqueous layers (1.0 mL each) were transferred into counting tubes and counted with a gamma counter (Wallac 1480 Wizard 3M Automatic Gamma Counter; Perkin-Elmer, Boston, MA, U.S.A.). The radioactivity counts were decay-corrected and the partition coefficient was calculated as P = counts in octanol/counts in buffer. Eight separate measurements were preformed for each tracer.
Positron emission tomography imaging protocol
PET experiments (n = 20) were performed at Columbia University. Two adult male baboons (baboon A and B) were studied twice with each of the five radiotracers (four experiments per radiotracer). All experiments took place within a 9-month period. Baboons A and B weighed 31 kg and 21 kg at the beginning of the experiment period and 28 and 22 kg at the end, respectively. Test and retest experiments with the same radiotracer were performed on different days, with an average interval of 117 ± 53 days.
Experiments were performed according to protocols approved by the Columbia-Presbyterian Medical Center Institutional Animal Care and Use Committee. Fasted animals were immobilized with ketamine (10 mg/kg intramuscularly), and anesthetized with 1.8% isoflurane via an endotracheal tube. Vital signs were monitored every 10 minutes and the temperature was kept constant at 37°C with heated water blankets. An intravenous perfusion line was used for hydration and injection of the radiotracer. A catheter was inserted in a femoral artery for arterial blood sampling. The head was positioned at the center of the field of view as defined by imbedded laser lines.
PET imaging was performed with the ECAT EXACT HR+ PET scanner (Siemens/CTI, Knoxville, TN, U.S.A.). In 3D mode, this camera provides an in-plane resolution of 4.3 mm, 4.5 mm, 5.4 mm, and 8.0 mm full width at half maximum (FWHM) at a distance of 0, 1, 10, and 20 cm from the center of the field of view, respectively (Brix et al., 1997). A 15-minute transmission scan was obtained before radiotracer injection for attenuation correction. Activity was injected intravenously over 30 seconds. The injected mass and radioactivity had an upper limit of 6 μg and 6 mCi, respectively. Emission data were collected in the 3D mode for 91 minutes as 21 successive frames of increasing duration (6 * 10 seconds, 2 * 1 minute, 4 * 2 minutes, 2 * 5 minutes, 7 * 10 minutes).
Input function measurements
Arterial blood samples were collected every 5 seconds with an automated system for the first 2 minutes and manually thereafter at various intervals. A total of 28 samples were collected. After centrifugation (10 minutes at 1,800 g), plasma was collected and activity measured in 200-μL aliquots on a gamma counter (Wallac 1480 Wizard 3M Automatic Gamma Counter, Perkin-Elmer).
Selected plasma samples (n = 6 per study, collected at 2, 4, 12, 30, 60, and 90 minutes after radiotracer administration) were further processed by extraction with methanol (MeOH) followed by HPLC analysis to measure the fraction of plasma activity representing unmetabolized parent compound. The parent fraction was measured as follows: plasma (0.5 mL) was pipetted into a centrifuge tube containing MeOH (1.0 mL). The content in the tube was mixed and centrifuged (3.5 minutes at 15,000 g). The liquid phase was separated from the precipitate. Activity in 0.1 mL of the liquid phase was counted and the rest was injected onto the HPLC. The HPLC eluate was fraction-collected in six counting tubes (4.0 mL each). The HPLC system consisted of a Waters 510 isocratic pump, a Rheodyne injector equipped with a 2-mL sample loop, a C18 analytical column (Phenomenex ODS-prep, 10 μm, 4.6 × 250 mm), a Bioscan Flow Cell gamma detector (Bioscan, Washington, DC, U.S.A.), and a fraction collector. The column was eluted with a mixture of acetonitrile and aqueous 0.1 mol/L ammonium formate (composition depending on the tracer being analyzed) at a flow rate of 2 mL/min. Before plasma sample analysis, the retention time of the parent compound was established by injection of a small amount of the tracer and detection of the peak using the Bioscan gamma detector.
The parent fraction was calculated as the ratio of activity in the fractions containing the parent compound to the total activity collected. A biexponential function was fitted to the six measured parent fractions and was used to interpolate values between and after the measurements. The smallest exponential of the parent fraction curve, λpar, was constrained to the difference between λcer, the terminal washout rate of the cerebellar activity, and λtot, the smallest elimination rate constant of the total plasma (Abi-Dargham et al., 1999). The input function was then calculated as the product of total counts and interpolated parent fraction at each time point. The measured input function values were fitted to a sum of three exponentials, and the fitted values were used as input for the kinetic analyses. The clearance of the parent compound (CL, L/h) was calculated as the ratio of the injected dose to the area under the curve of the input function (Rowland and Tozer, 1989; Abi-Dargham et al., 1994). The initial distribution volume (Vbol, L) was calculated as the ratio of injected dose to peak plasma concentration.
For the determination of the plasma free fraction (f1), triplicate 200-μL aliquots of plasma, separated from blood collected before tracer injection and spiked with the radiotracer, were pipetted into ultrafiltration units (Amicon Centrifree; Millipore, Bedford, MA, U.S.A.) and centrifuged at room temperature (20 minutes at 4,000 g) (Gandelman et al., 1994). Plasma and ultrafiltrate activities were counted, and f1 was calculated as the ratio of the ultrafiltrate activity to the total plasma activity. Triplicate aliquots of the radiotracer in pH 7.4 Tris bufer were also processed to determine the filter retention of the free tracer.
Image analysis
A magnetic resonance image (MRI) of each baboon's brain was obtained to identify the regions of interest (ROI) (T1-weighted axial MRI sequence, acquired parallel to the anterior-posterior commissure, repetition time 34 milliseconds, echo time 5 milliseconds, flip angle of 45°, slice thickness of 1.5 mm, zero gap, matrix 1.5 mm x 1 mm x 1 mm voxels). The following regions were drawn on the MRI images: cerebellum, midbrain, thalamus, striatum, hippocampus, temporal cortex, cingulate cortex, and occipital cortex.
PET emission data were attenuation corrected using the transmission scan, and frames were reconstructed using a Shepp filter (cutoff 0.5 cycles/projection rays). Reconstructed image files were then processed using the image analysis software MEDx (Sensor Systems, Sterling, VA, U.S.A.). An image was created by summing all the frames, and this summed image was used to define the registration parameters with the MRI image, using between-modality automated image registration algorithm (Woods et al., 1993). Registration parameters were then applied to the individual frames for registration to the MRI data set. Regional boundaries were transferred from the MRI to the individual registered PET frames, and time-activity curves were measured and decay corrected. Right and left regions were averaged. For a given animal, the same regions were used for all radiotracers.
Brain uptake
Total brain uptake was expressed as the percentage of the injected dose per gram of tissue (% ID g−1) in a region encompassing the entire brain. Regional peak times were defined as the midtime of the frame associated with the highest activity value. To estimate the degree of washout from the brain captured during the scan interval (91 minutes), the decrease in activity from the peak to that recorded during the last frame of acquisition was calculated and expressed in percentage of the peak activity.
Kinetic analysis
Regional total distribution volumes (VT,mL g−1) were derived with kinetic analysis of the regional time-activity curves, using the arterial plasma concentrations as input function. For each tracer, the use of a two-tissue compartment model was associated with an unacceptable number of nonconvergences, convergences with negative rate constants, and convergences with large error in the estimates of VT (data not shown). In contrast, a one-tissue compartment model converged in all cases and generally provided good fit to the data. Therefore, the one-tissue compartment model was selected for this investigation. In the one-tissue compartment model, VT is derived as the K1/k2 ratio, where K1 (mL g−1 min−1) and k2 (min−1) are the unidirectional fractional rate constant for the transfer of the tracer in and out of the brain, respectively.
The contribution of blood activity to the regional activity was removed, assuming a 5% blood volume in the ROI and a plasma-to-cell partition coefficient of 1 (Mintun et al., 1984). Kinetic parameters were derived by nonlinear regression using a Levenberg-Marquart least-squares minimization procedure implemented in MATLAB (The Math Works, South Natick, MA, U.S.A.) as previously described (Laruelle et al., 1994c). Given the unequal sampling over time (increasing frame acquisition time from the beginning to the end of the study), the least-squares minimization procedure was weighted by the square root of the frame acquisition time. No correction was applied for the delay between the arrival of activity in the femoral artery and the brain.
The minimal scanning time required to achieve time-independent derivation of regional VT was evaluated by fitting the time–activity curves to shorter data sets, representing total scanning time of 81, 71, 61, 51, and 41 minutes, respectively. The resulting estimates of VT were normalized to the VT derived with the 91 minutes data set. For each region and each tracer (n = 4 observations per scan duration), the average and standard deviation of the normalized VT were calculated. Time independence was considered to be achieved at time t, if, for the frame ending at time t and all subsequent frames, the following two criteria were fulfilled: (1) the average normalized VT was between 95% and 105% of the reference VT (small bias), and (2) the SD of the normalized VT was less than 10% (small error).
Derivation of serotonin transporter parameters
Because of the low-to-negligible levels of SERT in the cerebellum, the cerebellar distribution volume (VT CER) was used as an estimate of the nonspecific distribution volume (including free and nonspecific binding) in the ROIs. Therefore, binding potential (BP; mL g−1) was derived as the difference between VT in the ROI (VT ROI) and VT in the cerebellum (VT CER). Under these conditions, BP is equal to (Laruelle et al., 1994b):
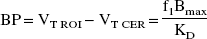
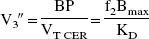
For between-tracer comparison, the main outcome measure of interest was the specific-to-nonspecific equilibrium partition coefficient (V3″). V3” was calculated as the ratio of BP to VT CER. Under these conditions, V3” is equal to (Laruelle et al., 1994b)
The test–retest reproducibility of V3” was calculated as the absolute difference between test and retest values normalized to the average V3” of the test and retest.
Statistical analysis
Values are given as mean ± SD. Dependent variables were analyzed using analysis of variance (ANOVA) or repeated-measures ANOVA, when appropriate. Post hoc tests were performed using Fisher PLSD. A two-tailed probability value of 0.05 was selected as the significance level.
RESULTS
In vitro experiments
Affinities for serotonin transporters and lipophilicities
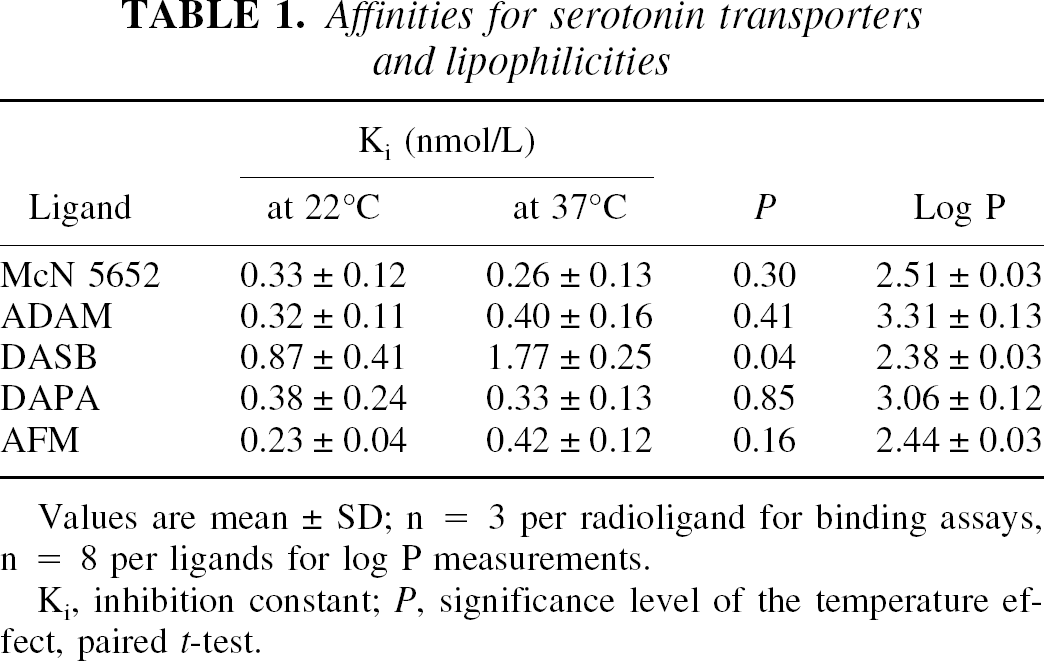
Values are mean ± SD; n = 3 per radioligand for binding assays, n = 8 per ligands for log P measurements.
Ki, inhibition constant; P, significance level of the temperature effect, paired t-test.
Positron emission tomography experiments
Injected doses
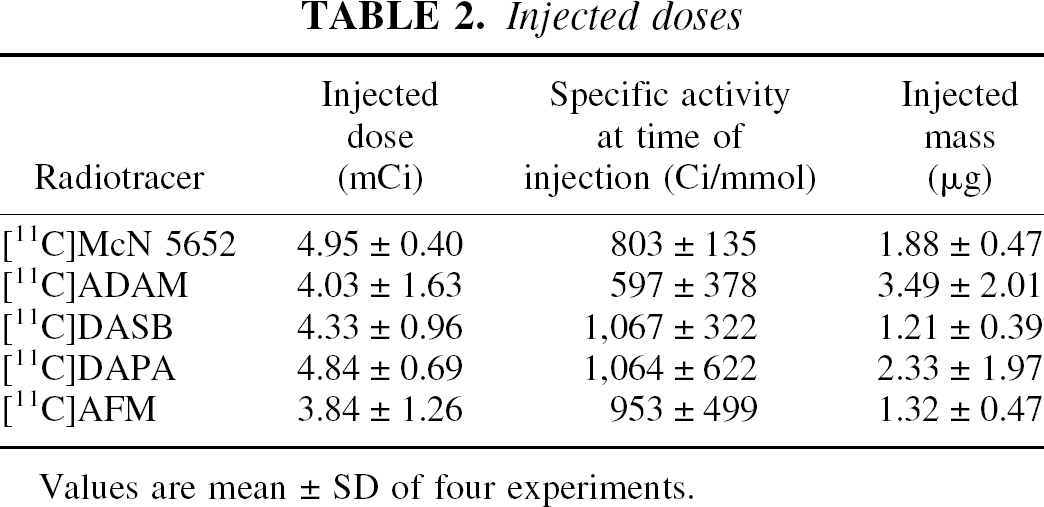
Values are mean ± SD of four experiments.
Plasma analysis
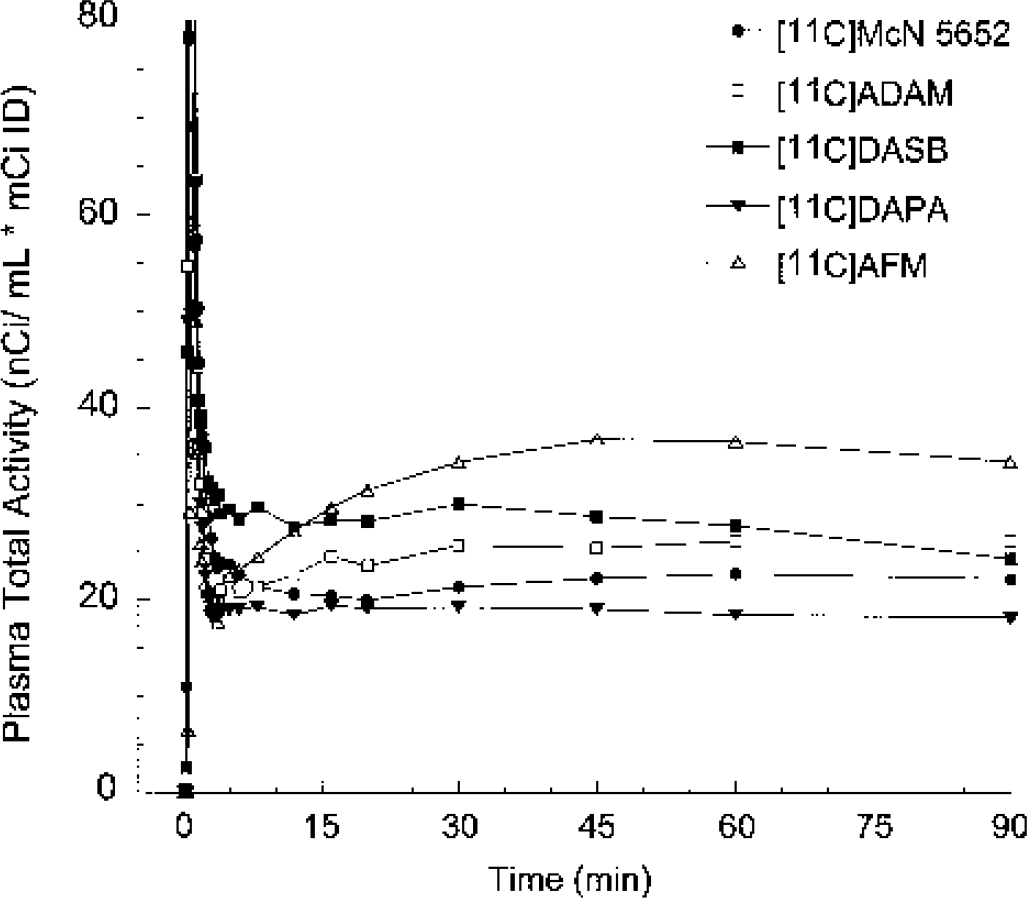
Mean total plasma activity normalized to injected dose [nCi/(mL * mCi ID)] after injection of [11C]McN 5652, [11C]ADAM, [11C]DASB, [11C]DAPA, and [11C]AFM. Each point is the mean of four experiments performed in two baboons. After a rapid distribution phase, total activities stabilized at relatively constant levels. For [11C]AFM and, to a lower extent, [11C]ADAM, total plasma activity actually increased after the initial distribution phase, suggesting that the body distribution volume of the parent is larger than that of the metabolites.
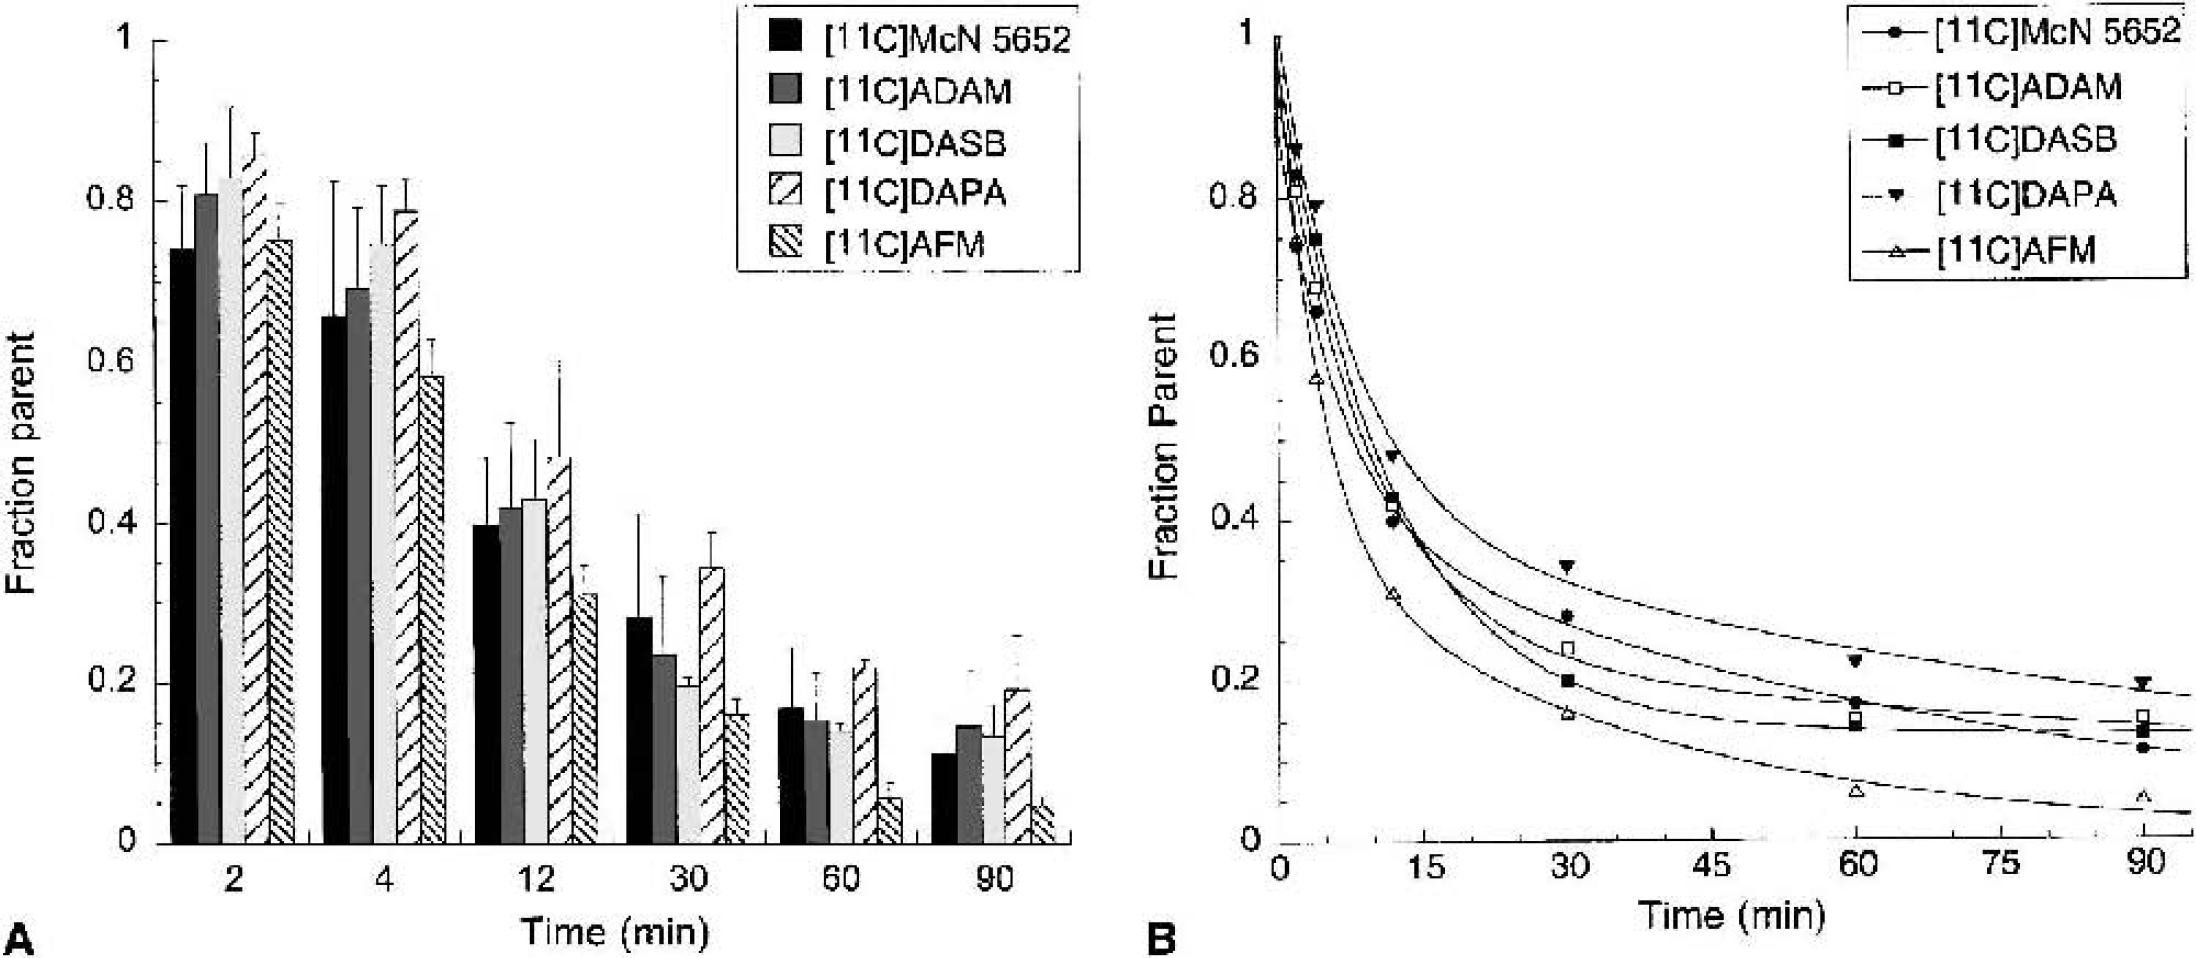
Mean ± SD of the fraction of plasma activity corresponding to the parent compound at 2, 4, 12, 30, 60, and 90 minutes after injection of [11C]McN 5652, [11C]ADAM, [11C]DASB, [11C]DAPA, and [11C]AFM. [11C]AFM exhibited significantly faster metabolism rate compared with the other four radiotracers (P < 0.05).
Plasma analysis of parent compound: initial distribution volume, clearance, retention on filter, and plasma free fraction
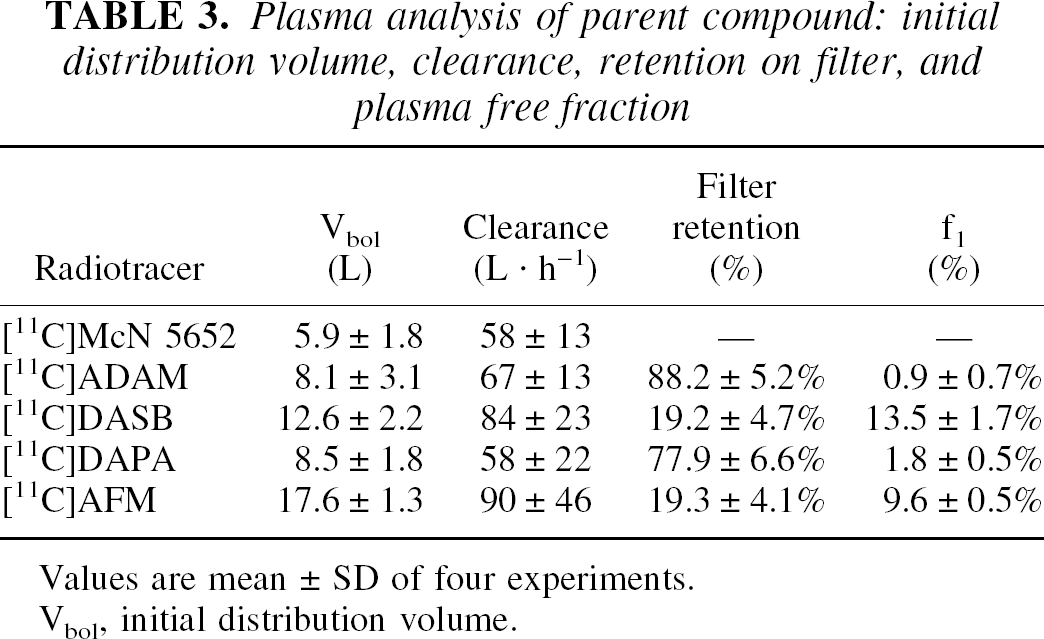
Values are mean ± SD of four experiments.
Vbol, initial distribution volume.
Brain analysis
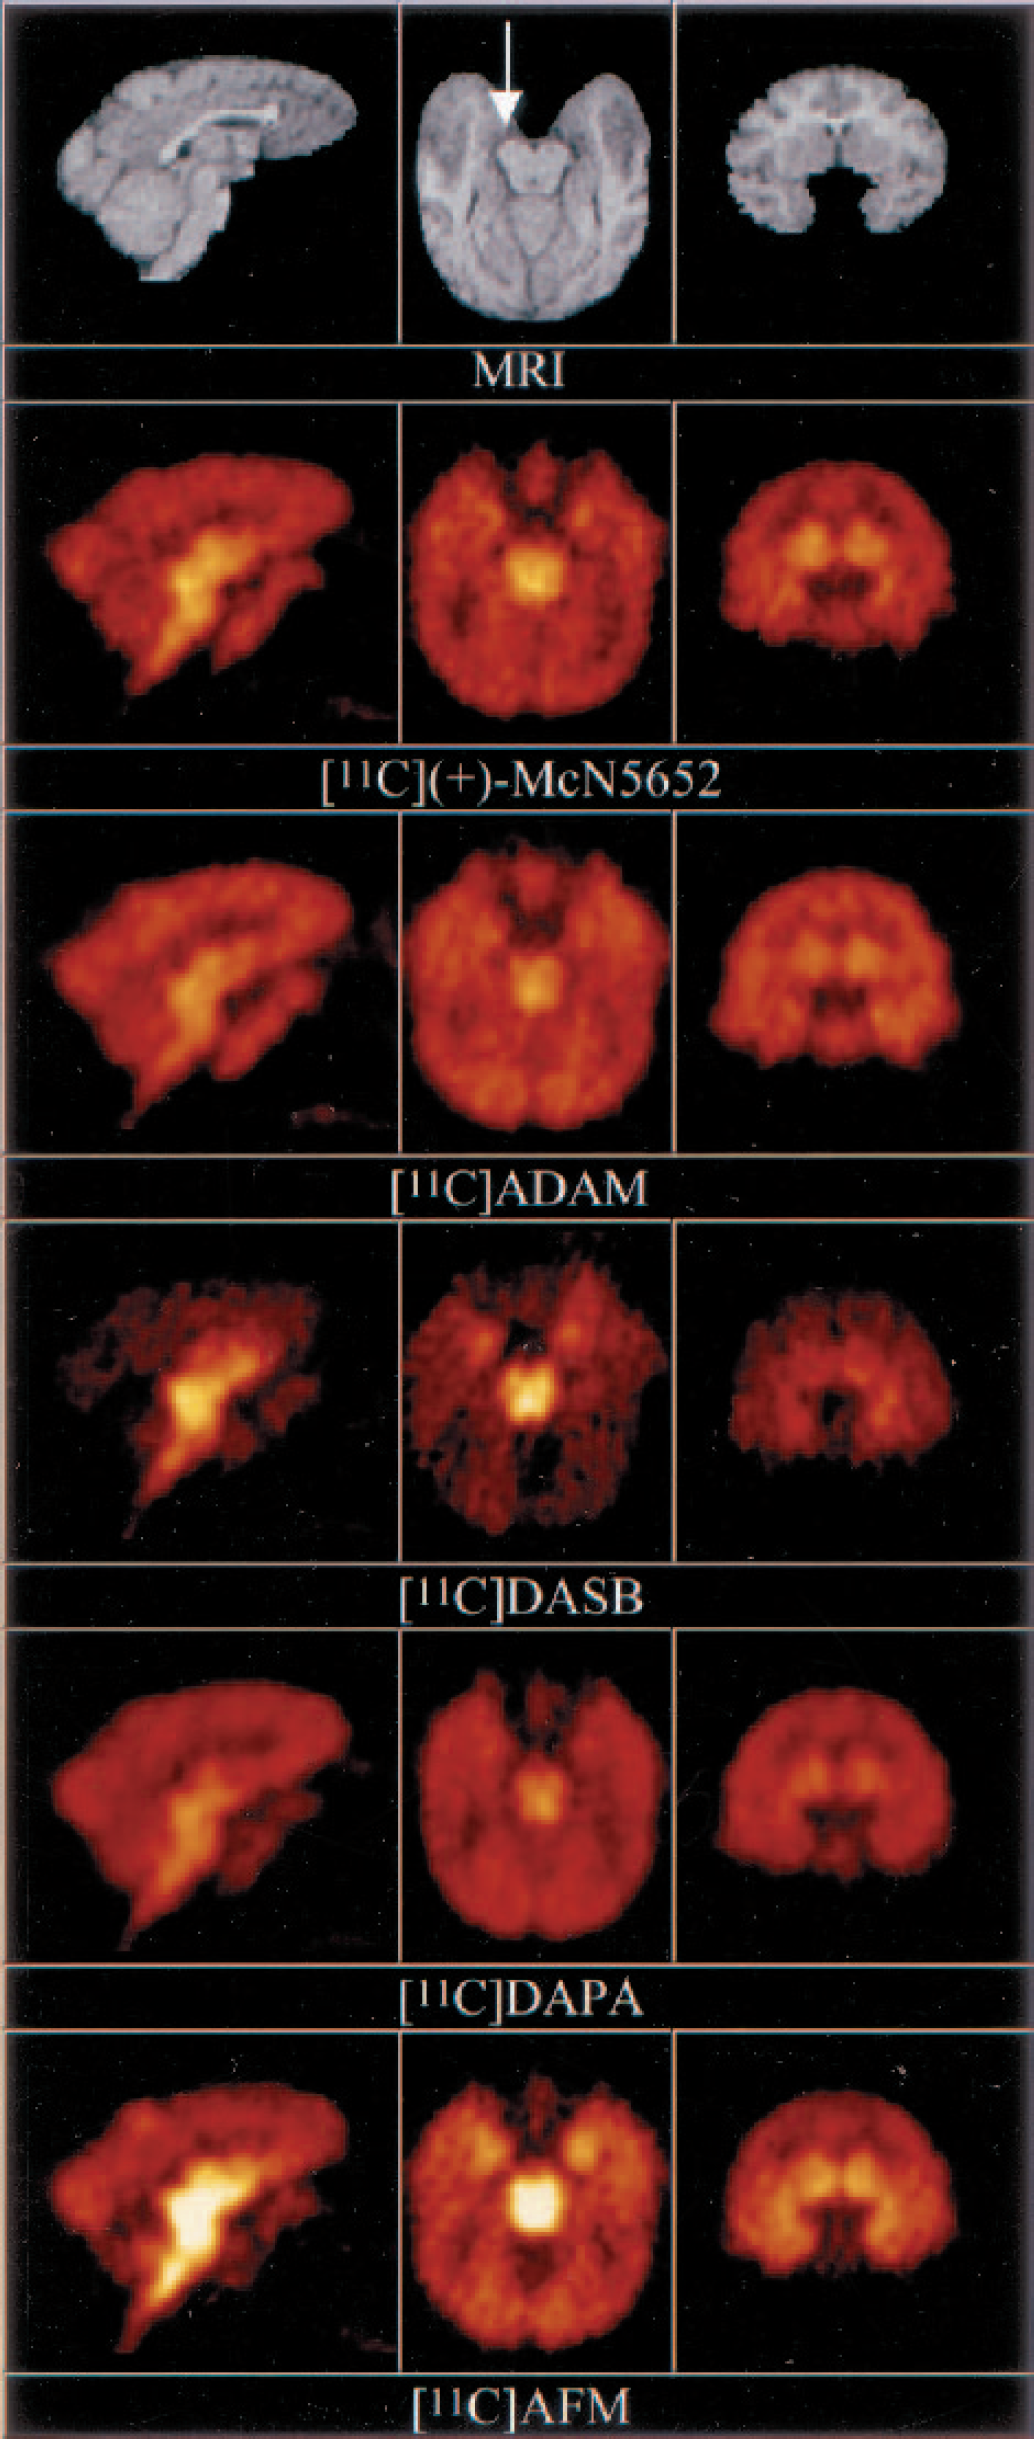
Coregistered magnetic resonance imaging (MRI) and positron emission tomography (PET) images for the five serotonin transporter radiotracers in baboon A. PET images are derived from activity collected between 41 and 91 minutes after injection. Image intensities were normalized to the injected doses. The sagittal plane shows high activities in the midbrain and thalamus, as well as low levels in the cerebellum. The transaxial plane shows the activity accumulation in the midbrain and hippocampi. Hippocampi are particularly noticeable on the [11C]DASB and [11C]AFM images (right hippocampus is indicated by an arrow on the MRI image). The coronal plane is at the level of the striatum. Activity concentrations in the structures of the medial temporal lobes are again more visible on the [11C]DASB and [11C]AFM images.
Figures 5 to 9 present time–activity curves for each ligand in the plasma (corrected for metabolites) and in the brain, where time–activity curves for a subset of representative regions (thalamus, striatum, temporal cortex, and cerebellum) are displayed. To facilitate comparison between ligands, experiment results presented in the figures were acquired in the same animal (baboon A), activities were normalized to the injected doses, and scales of the axes were kept constant. It can be appreciated from these figures that [11C]McN 5652 (Fig. 5) and [11C]ADAM (Fig. 6) displayed a similar pattern of brain kinetics: the uptake was relatively slow and protracted (peak uptake is smooth), the washout was slow, and only modest differences were observed between the regions. In contrast, [11C]DASB (Fig. 7) presented an initial rapid uptake, an early and sharp peak, a rapid washout, and larger differences between regions. [11C]DAPA kinetic profile in the brain (Fig. 8) was similar to those of [11C]McN 5652 and [11C]ADAM, in that the uptake showed a smooth and protracted peak, but differed from these two tracers in that the differences in activity between regions were larger. [11C]AFM (Fig. 9) shared with [11C]DASB a sharp peak and faster washout, but the peak occurred later and the differences in activity between regions were more marked.
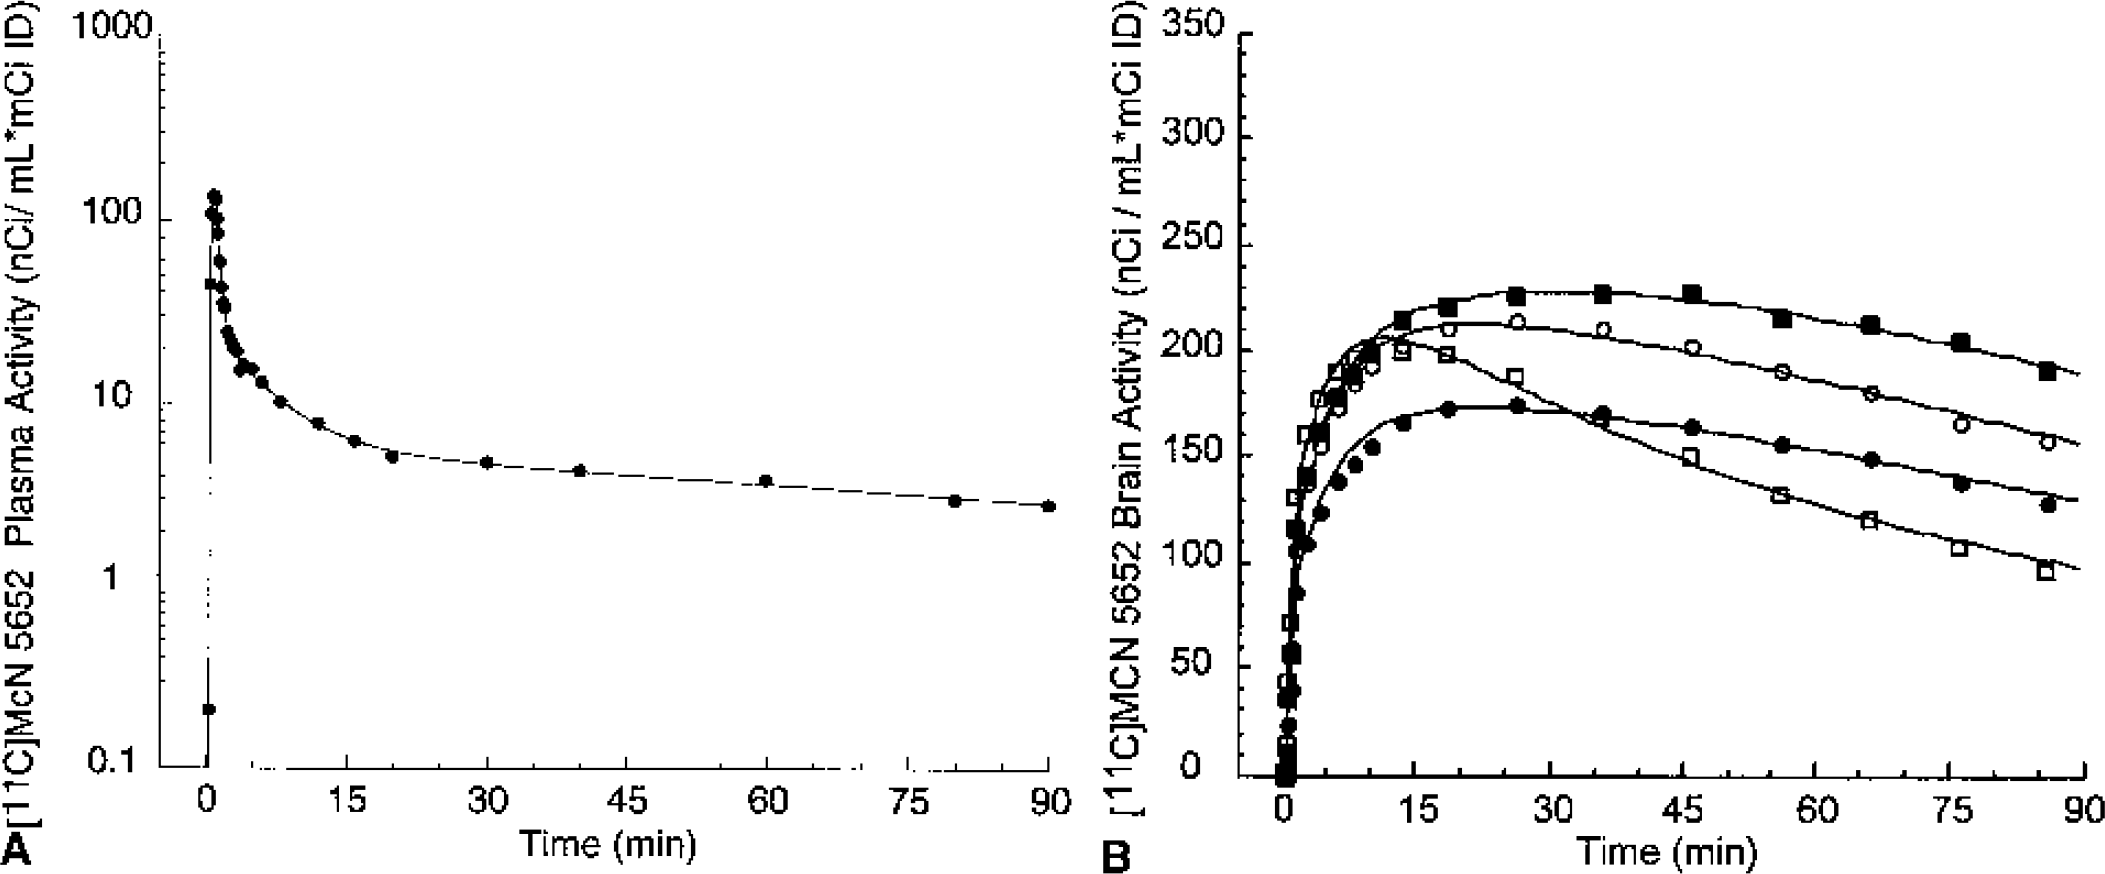
[11C]McN 5652 concentrations in the arterial plasma
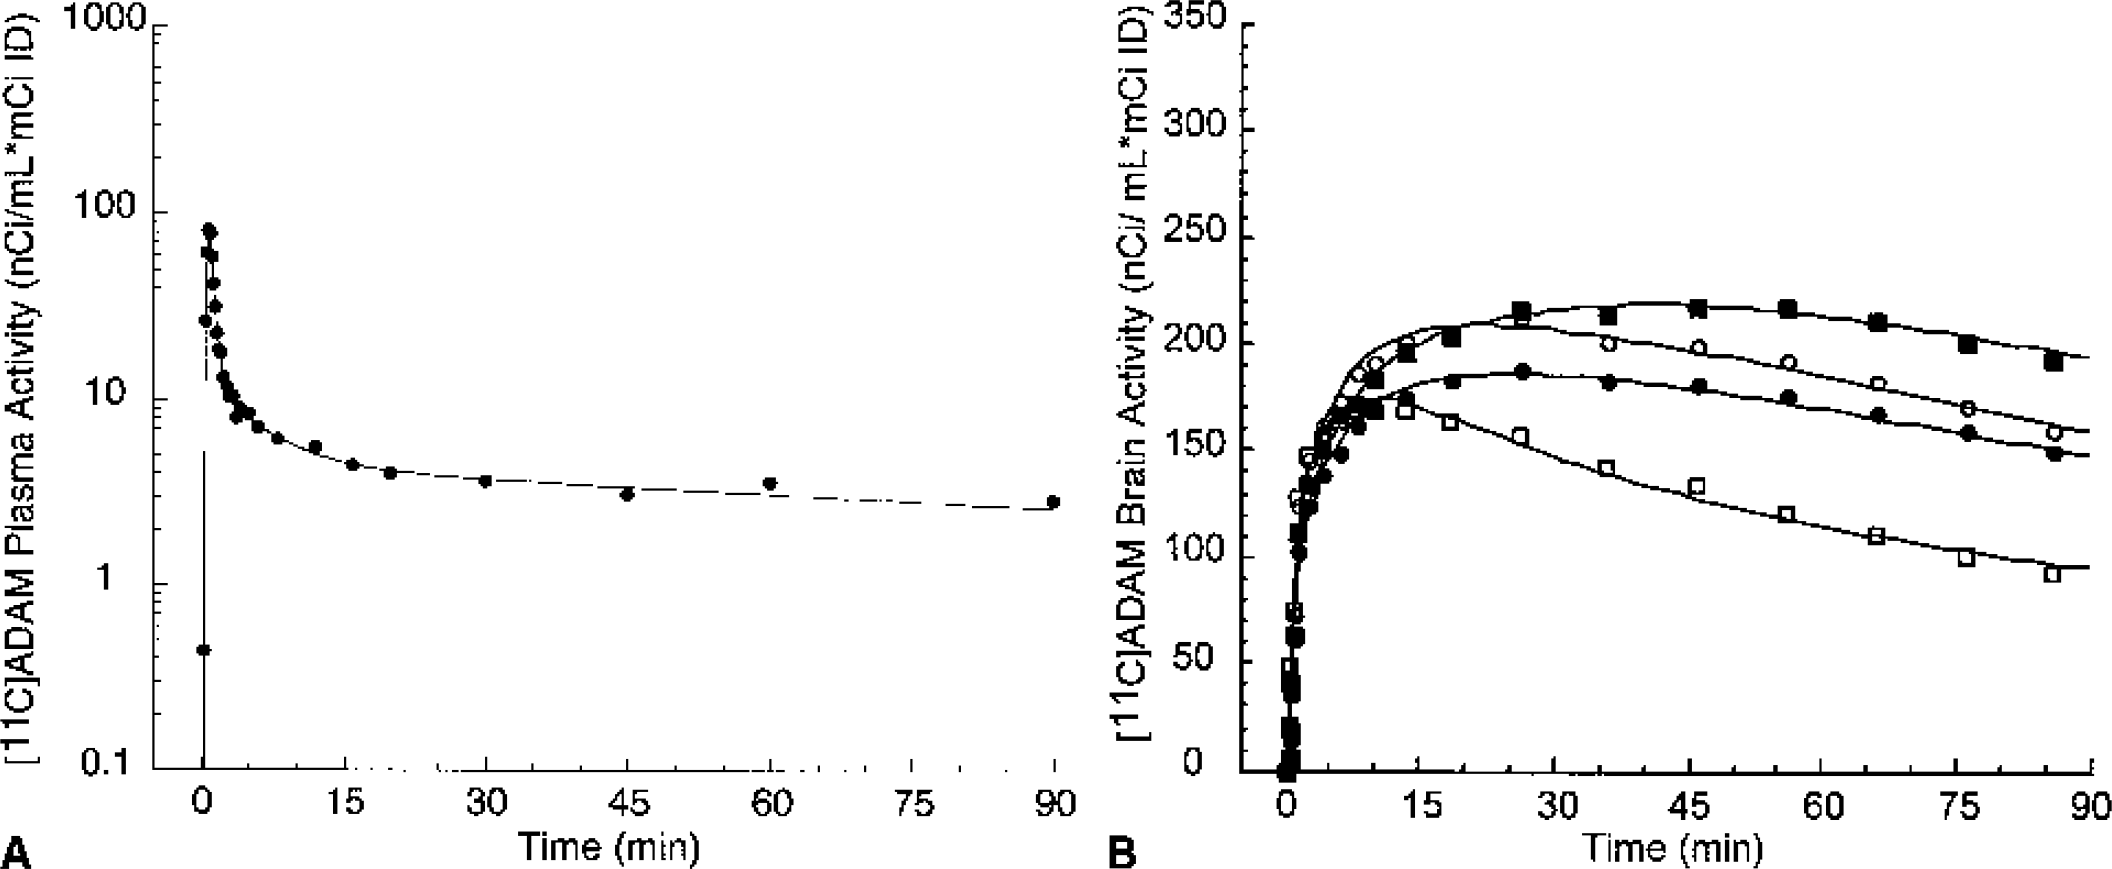
[11C]ADAM concentrations in the arterial plasma
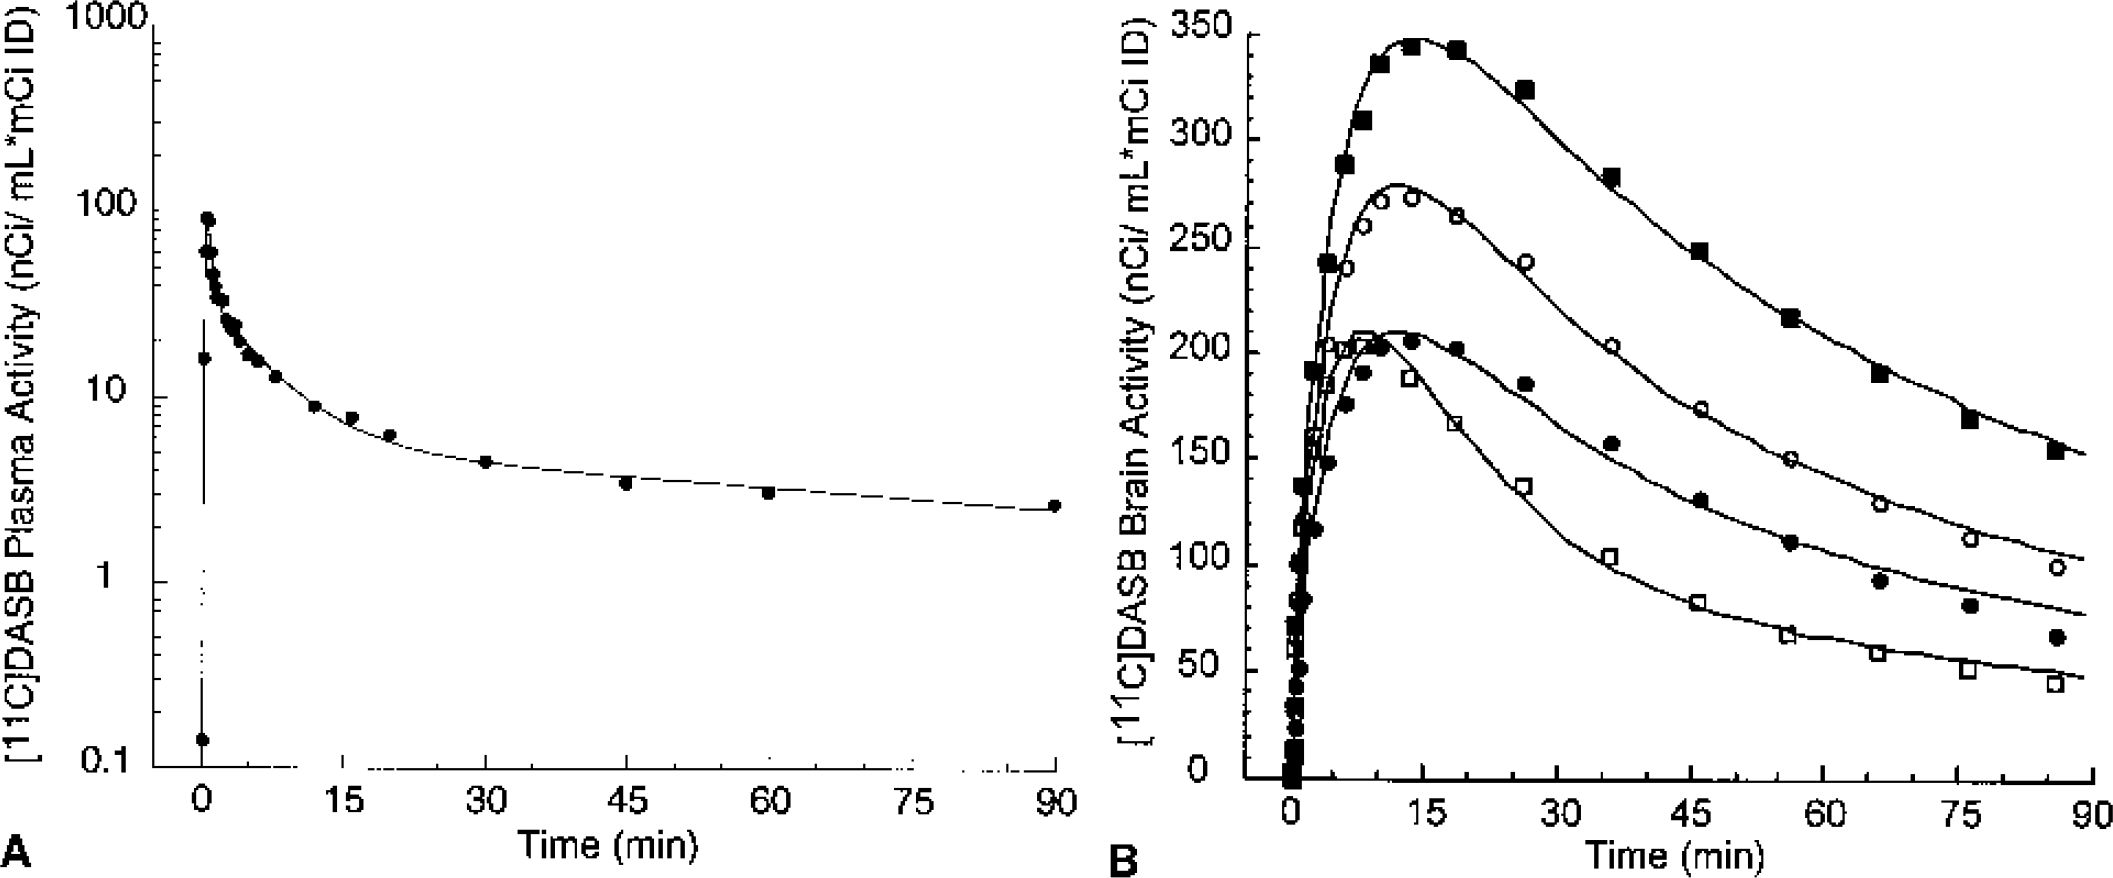
[11C]DASB concentrations in arterial plasma
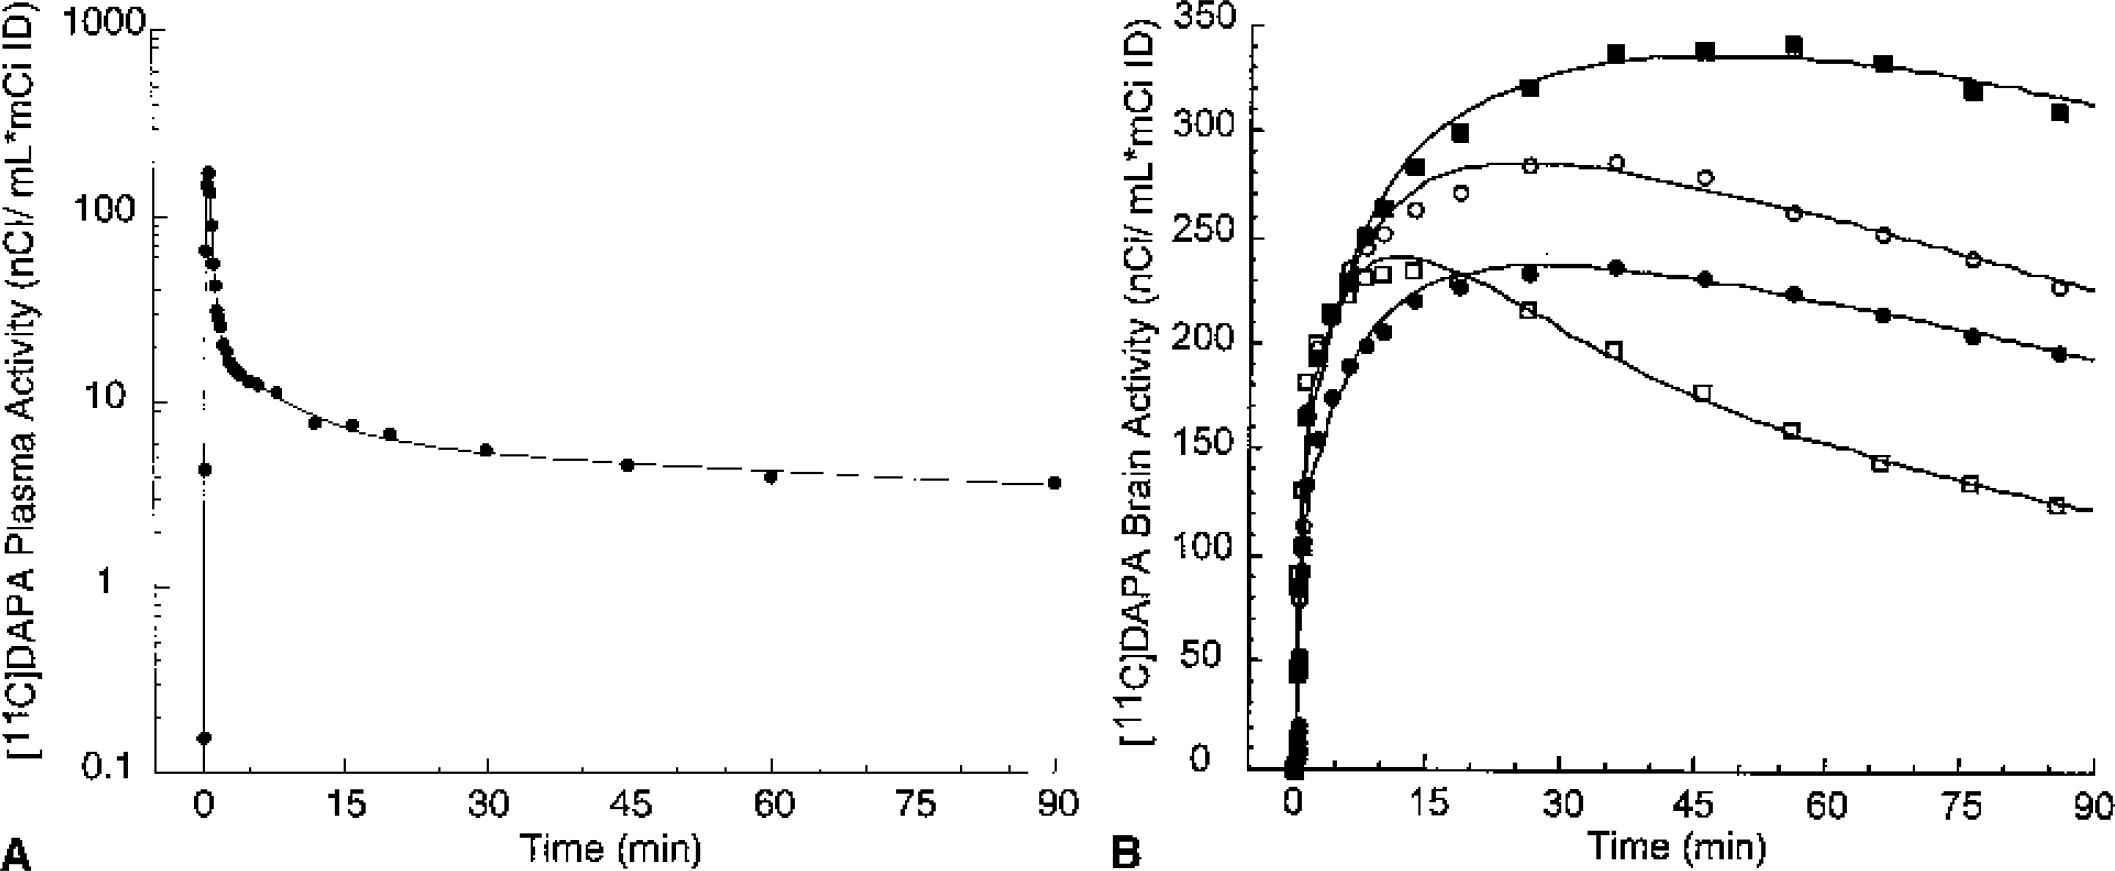
[11C]DAPA concentrations in arterial plasma
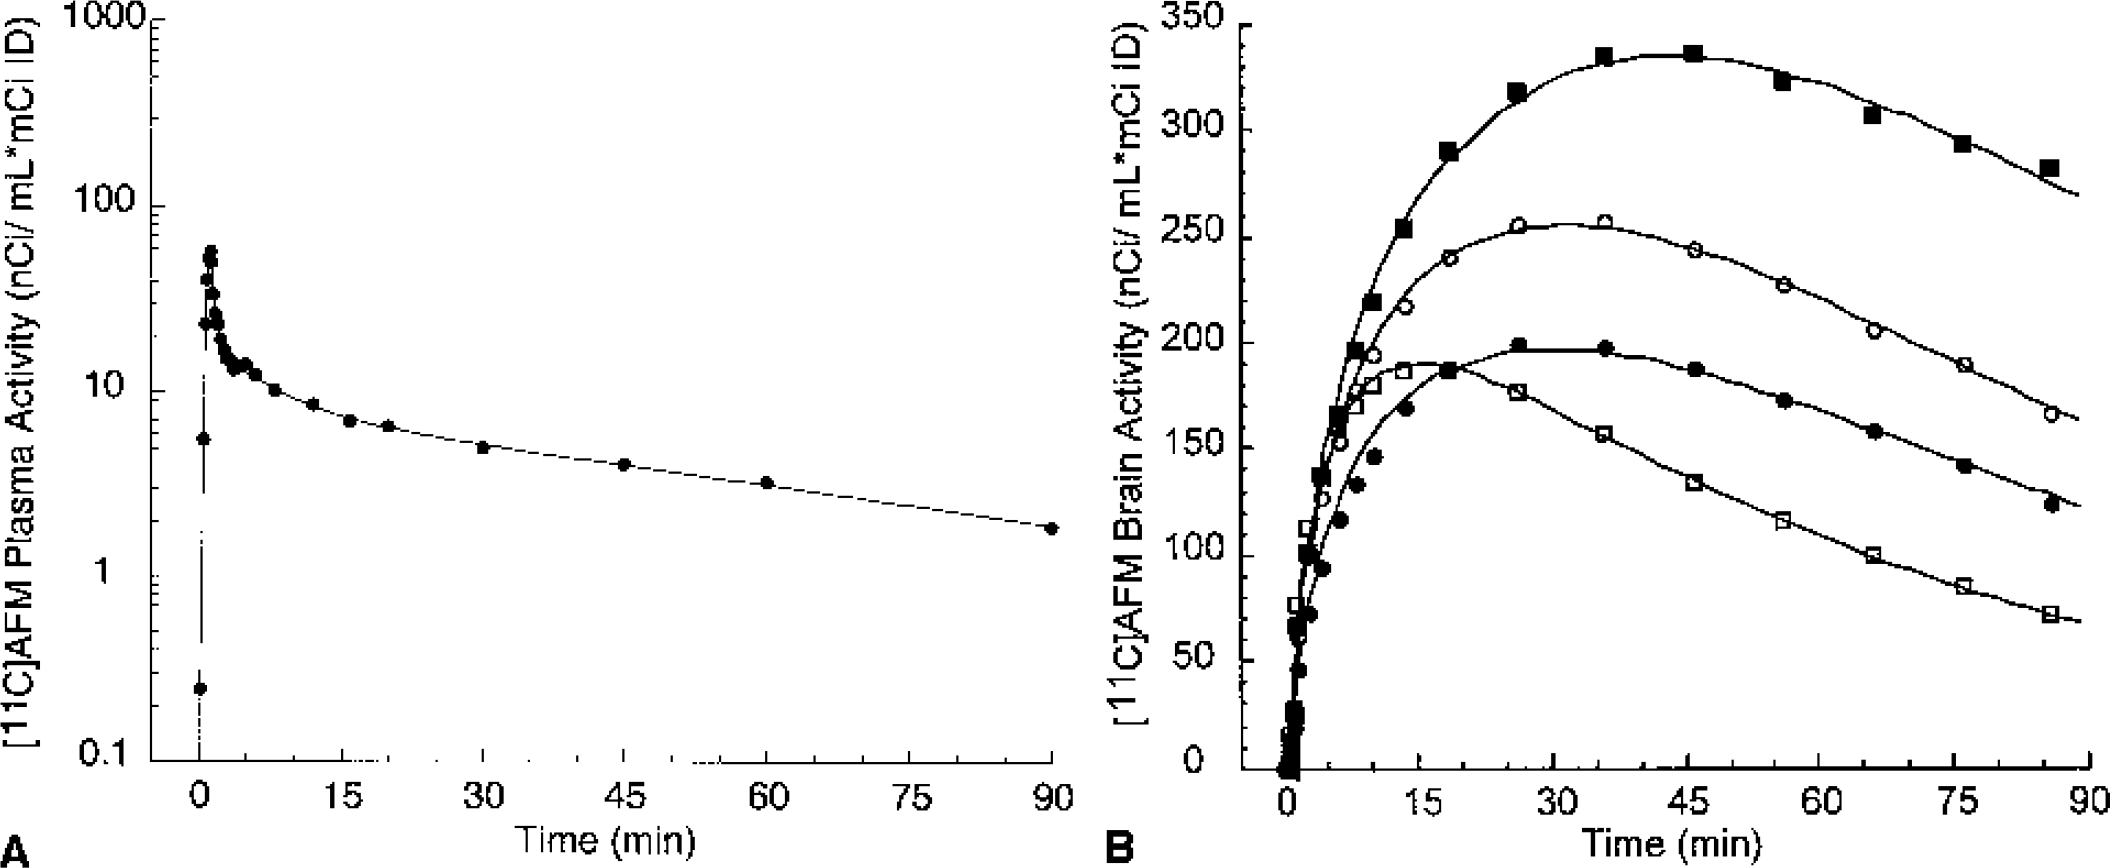
[11C]AFM concentrations in arterial plasma
Regional uptake peak times (minutes)
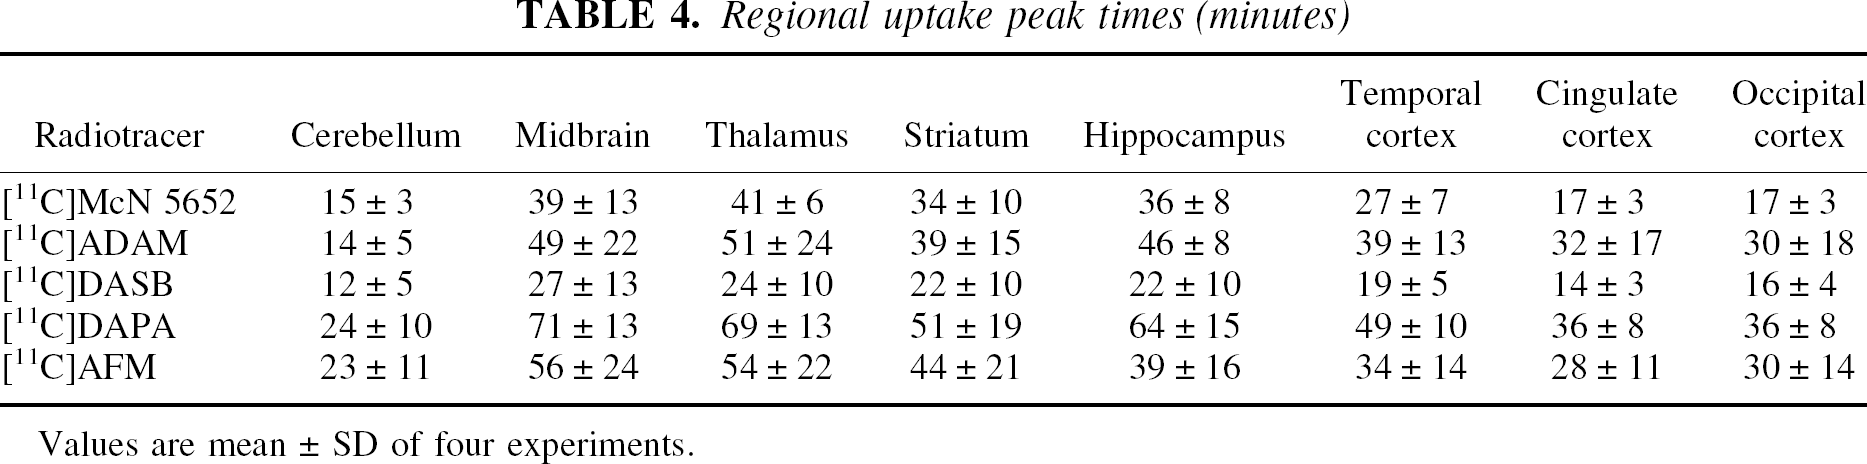
Values are mean ± SD of four experiments.
After the peak, ligands showed differences in the rate of washout (Table 5). Washout was estimated by calculating the relative decrease in regional activity captured during the time frame of the scan (relative decrease from peak time to the last frame). Variability in the decrease in regional activity was evaluated with repeated-measure ANOVA, with regions as repeated measure and baboons and ligands as cofactors. Significant differences in activity washout were observed between regions (P < 0.0001), between tracers (P = 0.002) and, at trend level, between baboons (P = 0.08). Rank order for the mean regional washout was [11C]DASB (52 ± 19% decrease between peak time and last scan) > [11C]AFM (32 ± 26%) > [11C]ADAM (25 ± 14%) ã [11C]McN 5652 (24 ± 13%) > [11C]DAPA (12 ± 11%). Post hoc analysis showed that [11C]DASB washed out significantly faster than all the other ligands, and that [11C]AFM washed out significantly faster than [11C]DAPA. Baboon A showed significantly more washout than baboon B during the time frame of the scan.
Regional activity washout: percent decrease from peak to last scan (90 minutes)
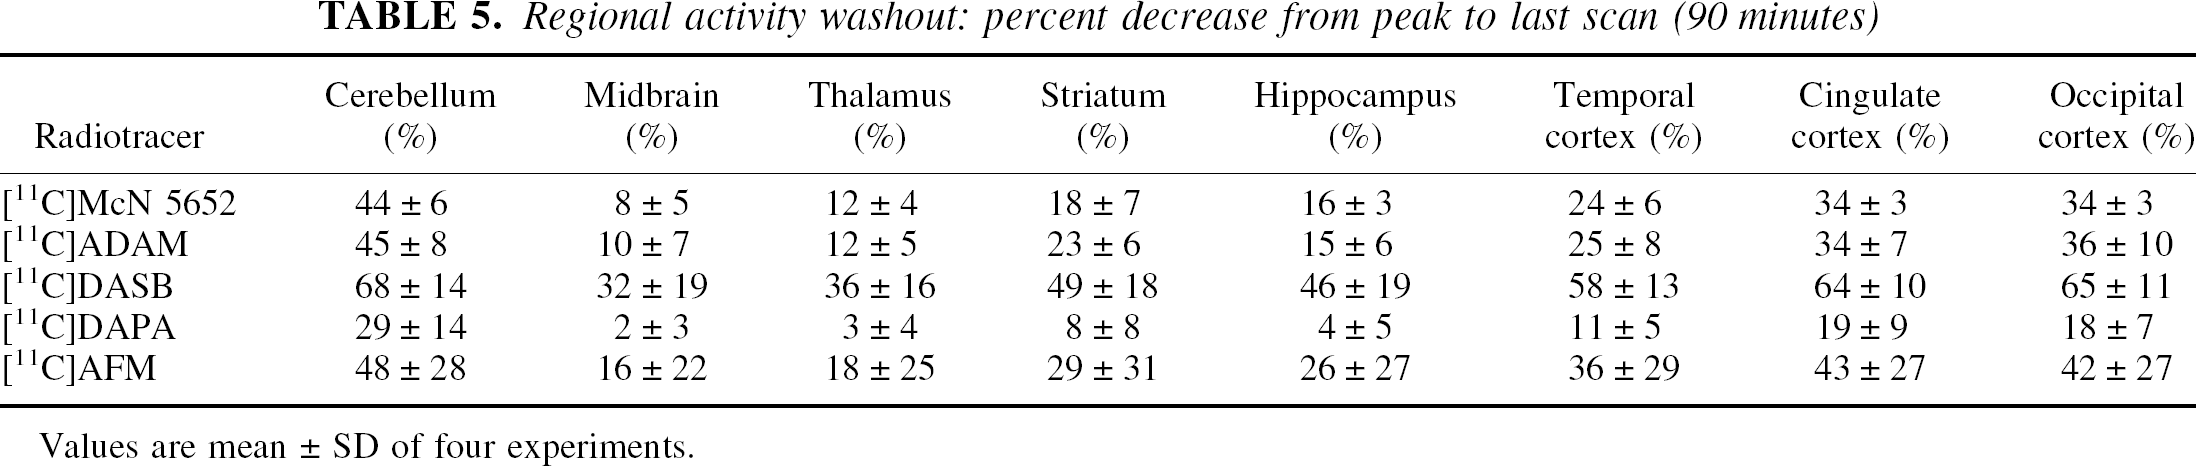
Values are mean ± SD of four experiments.
Region-of-interest to cerebellum activity ratios at 90 minutes
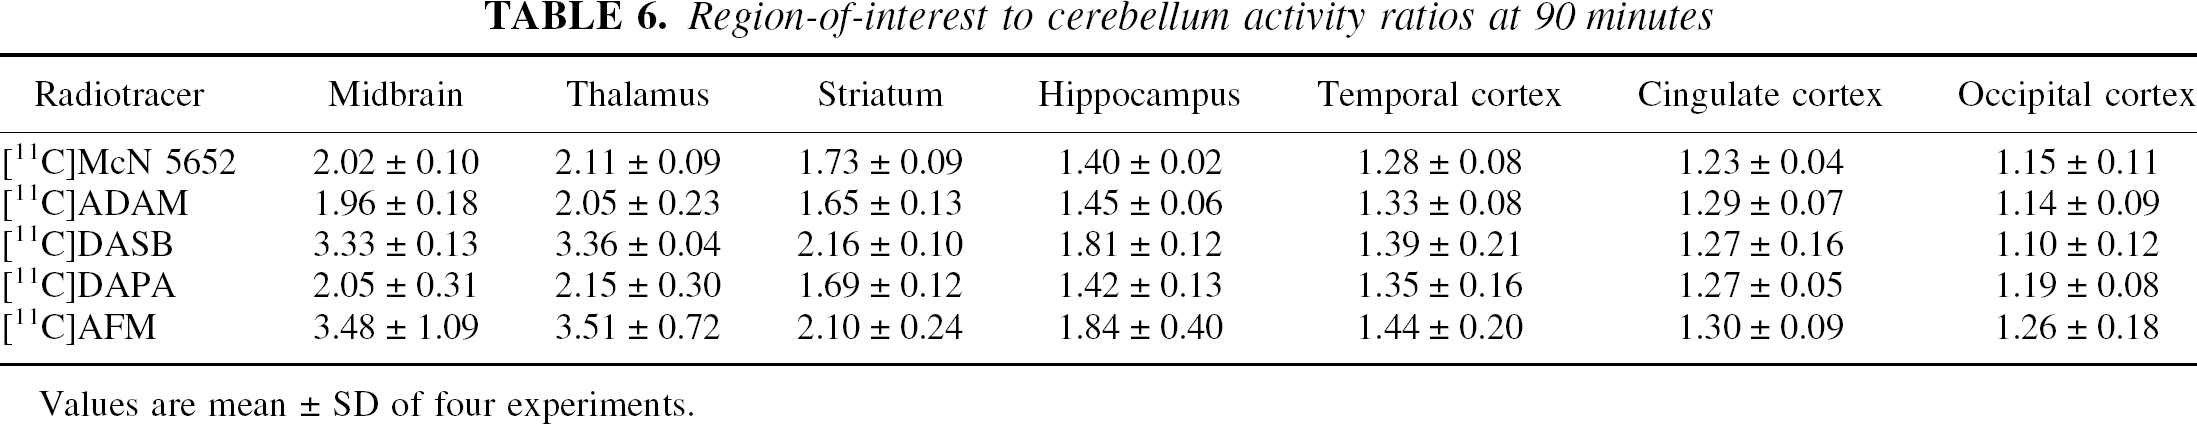
Values are mean ± SD of four experiments.
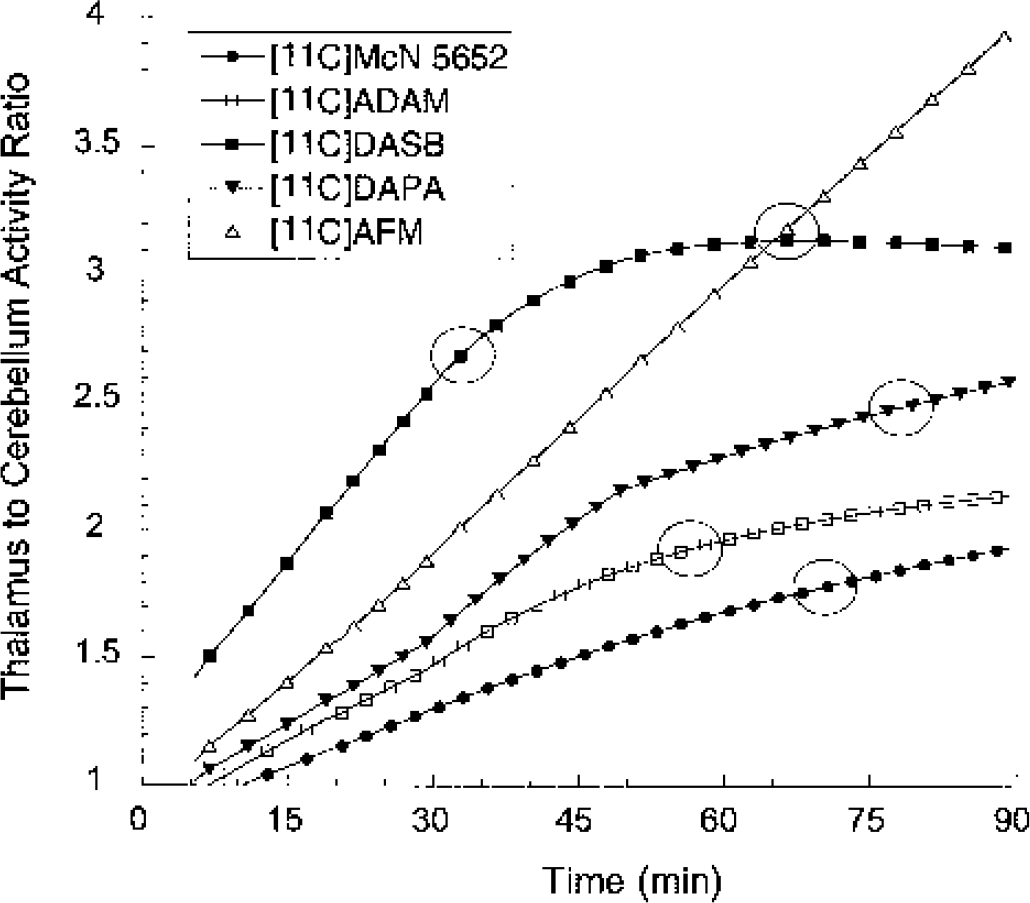
Ratios of fitted activities between the thalamus and cerebellum, calculated every 2 minutes, for experiments depicted in Figs. 5 to 9. The thalamus-to-cerebellum ratios increase continuously during the time frame of the experiments for [11C]McN 5652, [11C]ADAM, [11C]DAPA, and [11C]AFM. In contrast, [11C]DASB reaches a state of transient equilibrium at about 50 minutes (thalamic and cerebellar activities decrease at a similar rate). The circles identify the times and levels at which the measured thalamus to cerebellum ratio is equal to the true equilibrium ratio (equal to V3” +1). These values were (time, ratio): [11C]McN 5652: 70 minutes, 1.78; [11C]ADAM: 55 minutes, 1.92; [11C]DASB: 32 minutes, 2.68; [11C]DAPA: 80 minutes, 2.49; [11C]AFM: 64 minutes, 3.10. These times provide an estimate of the points at which the specific binding peaks. Ratios measured before or after represent an under- or overestimation of the true equilibrium ratios, respectively.
Kinetic analysis: rate constants and total distribution volumes
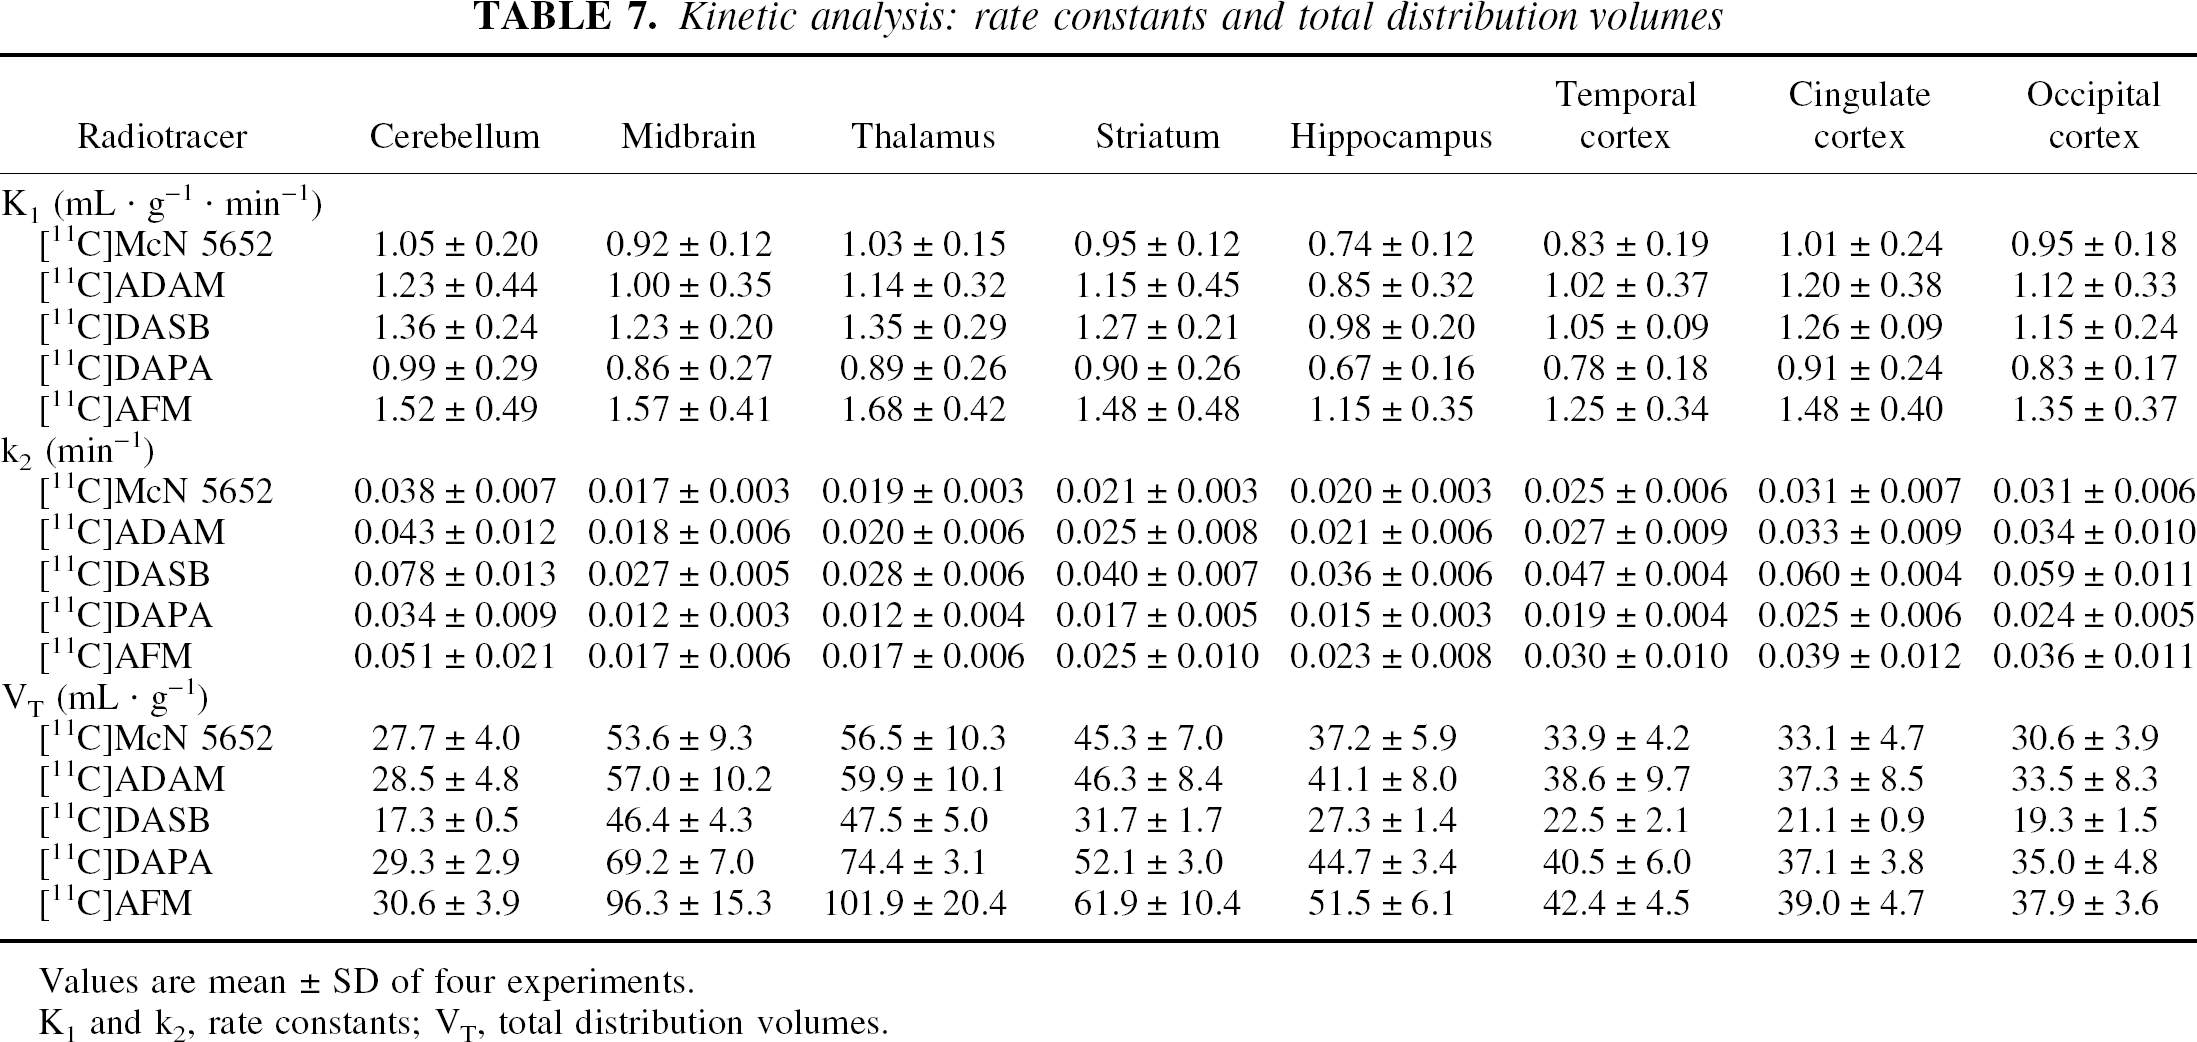
Values are mean ± SD of four experiments.
K1 and k2, rate constants; VT, total distribution volumes.
Significant differences in k2 were observed between regions (P < 0.0001), between tracers (P = 0.0013) but not between baboons (P = 0.23). [11C]DASB had the highest k2 (average of all regions and all animals of 0.047 ± 0.018 min−1), followed by [11C]AFM (0.030 ± 0.015 min−1), [11C]ADAM (0.028 ± 0.011 min−1), [11C]McN 5652 (0.025 ± 0.008 min−1) and [11C]DAPA (0.020 ± 0.008 min−1). Post hoc analysis showed that [11C]DASB k2 was significantly higher than those of the other ligands, and that [11C]AFM k2 was higher than that of [11C]DAPA.
Minimal scanning time (minutes) to reach time-independent measurement for total distribution volumes
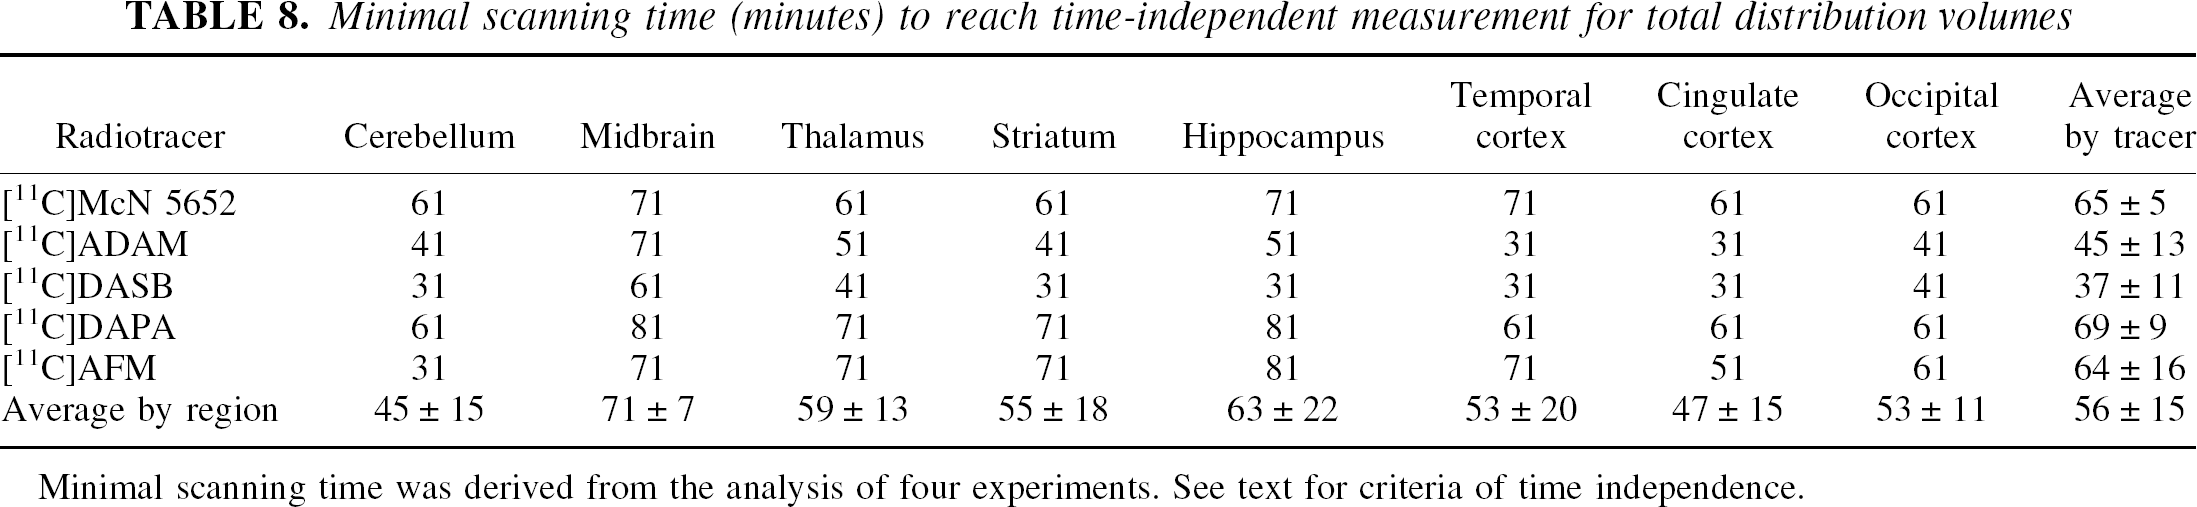
Minimal scanning time was derived from the analysis of four experiments. See text for criteria of time independence.
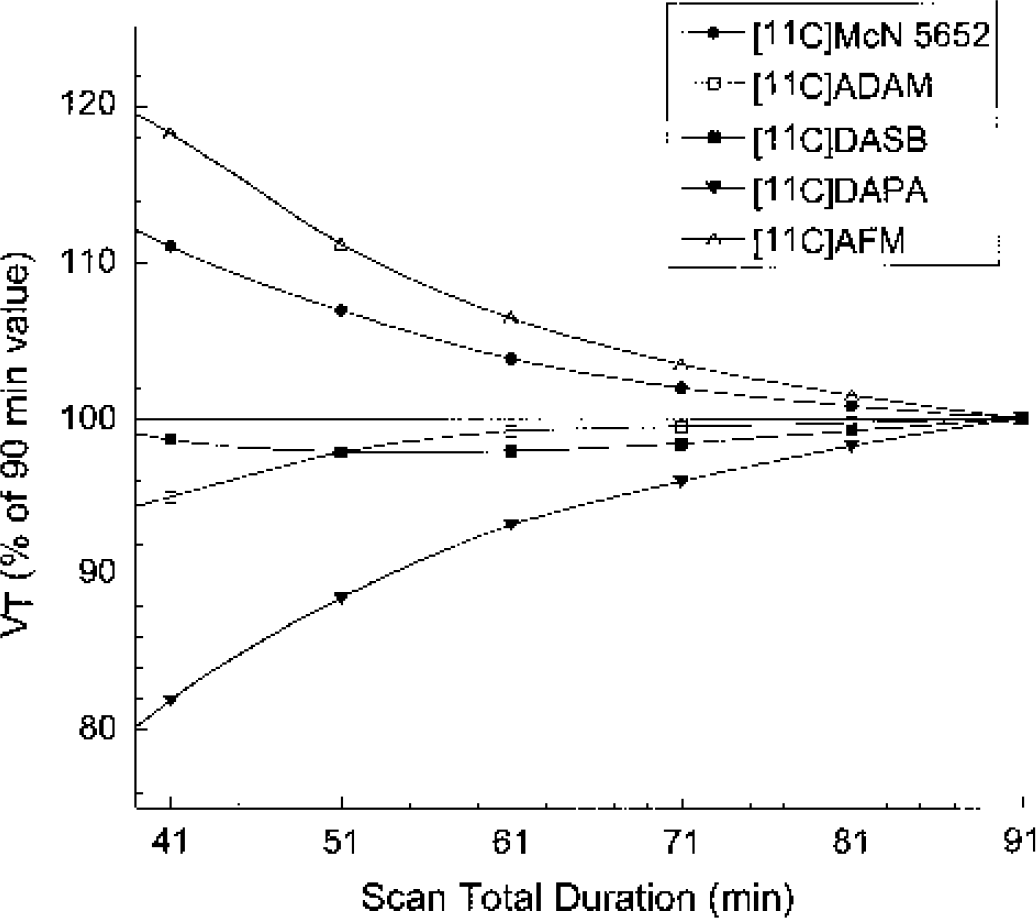
Relation between total duration of scan and estimates of VT. Data-sets of shorter duration (41, 51, 61, 71, and 81 minutes) were analyzed, and estimated VT were expressed in percentage of the value derived with the complete data set (91 minutes). Each point is the average of four data sets and eight regions. Decreasing the duration of the experiment would result in overestimation of VT for [11C]AFM and [11C]McN 5652 and underestimation of VT for [11C]DAPA, while reducing the scanning time from 91 to 41 minutes would induce little biases on the VT estimates for [11C]DASB and [11C]ADAM.
Binding potential (mL · g−1)
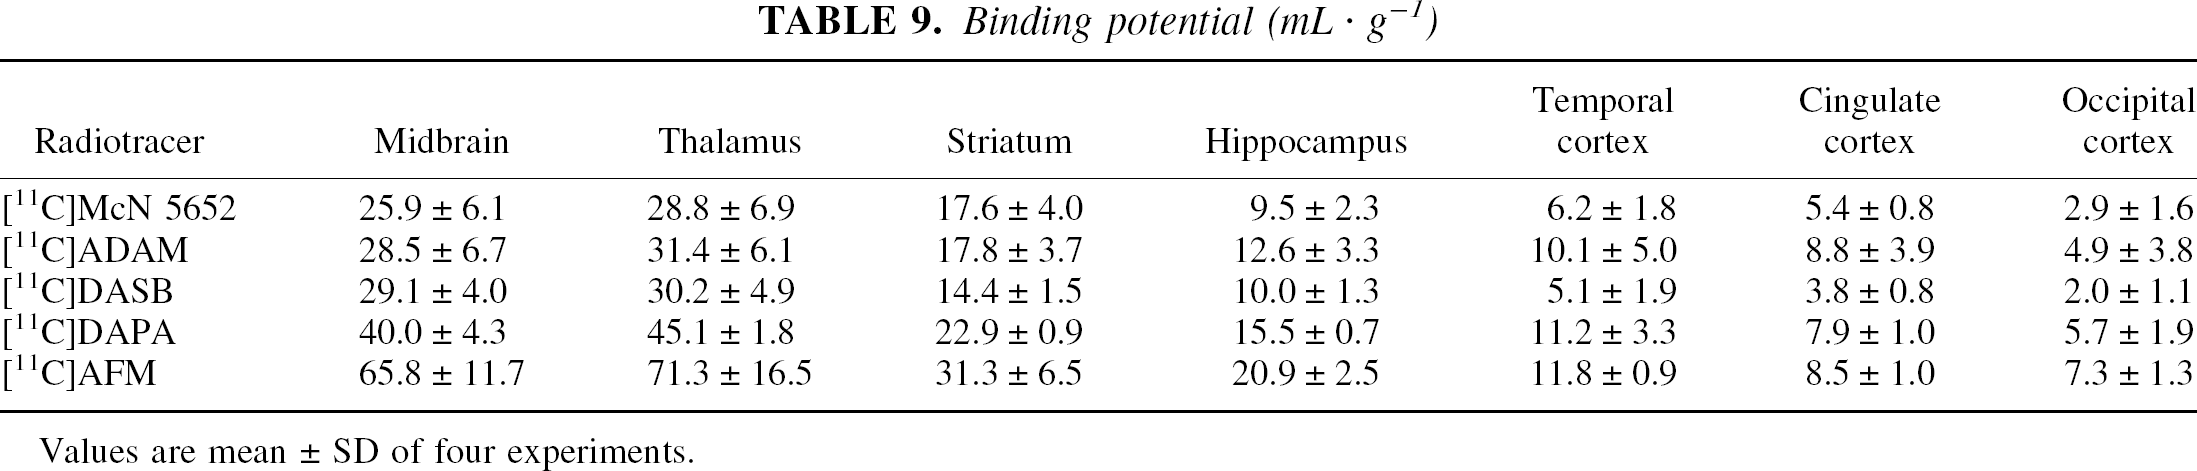
Values are mean ± SD of four experiments.
The Bmax/KD ratios could be calculated only for [11C]AFM and [11C]DASB, but not for the other three ligands, given that their free fractions could not be measured with accuracy. In the thalamus, the Bmax/KD values for [11C]AFM and [11C]DASB were 742 ± 168 mL g−1 and 225 ± 30 mL g−1, respectively. Assuming that these tracers bind to the same number of binding sites, these data indicate that the in vivo affinity of [11C]AFM is 3.3 times higher than that of [11C]DASB.
Equilibrium specific-to-nonspecific partition coefficient
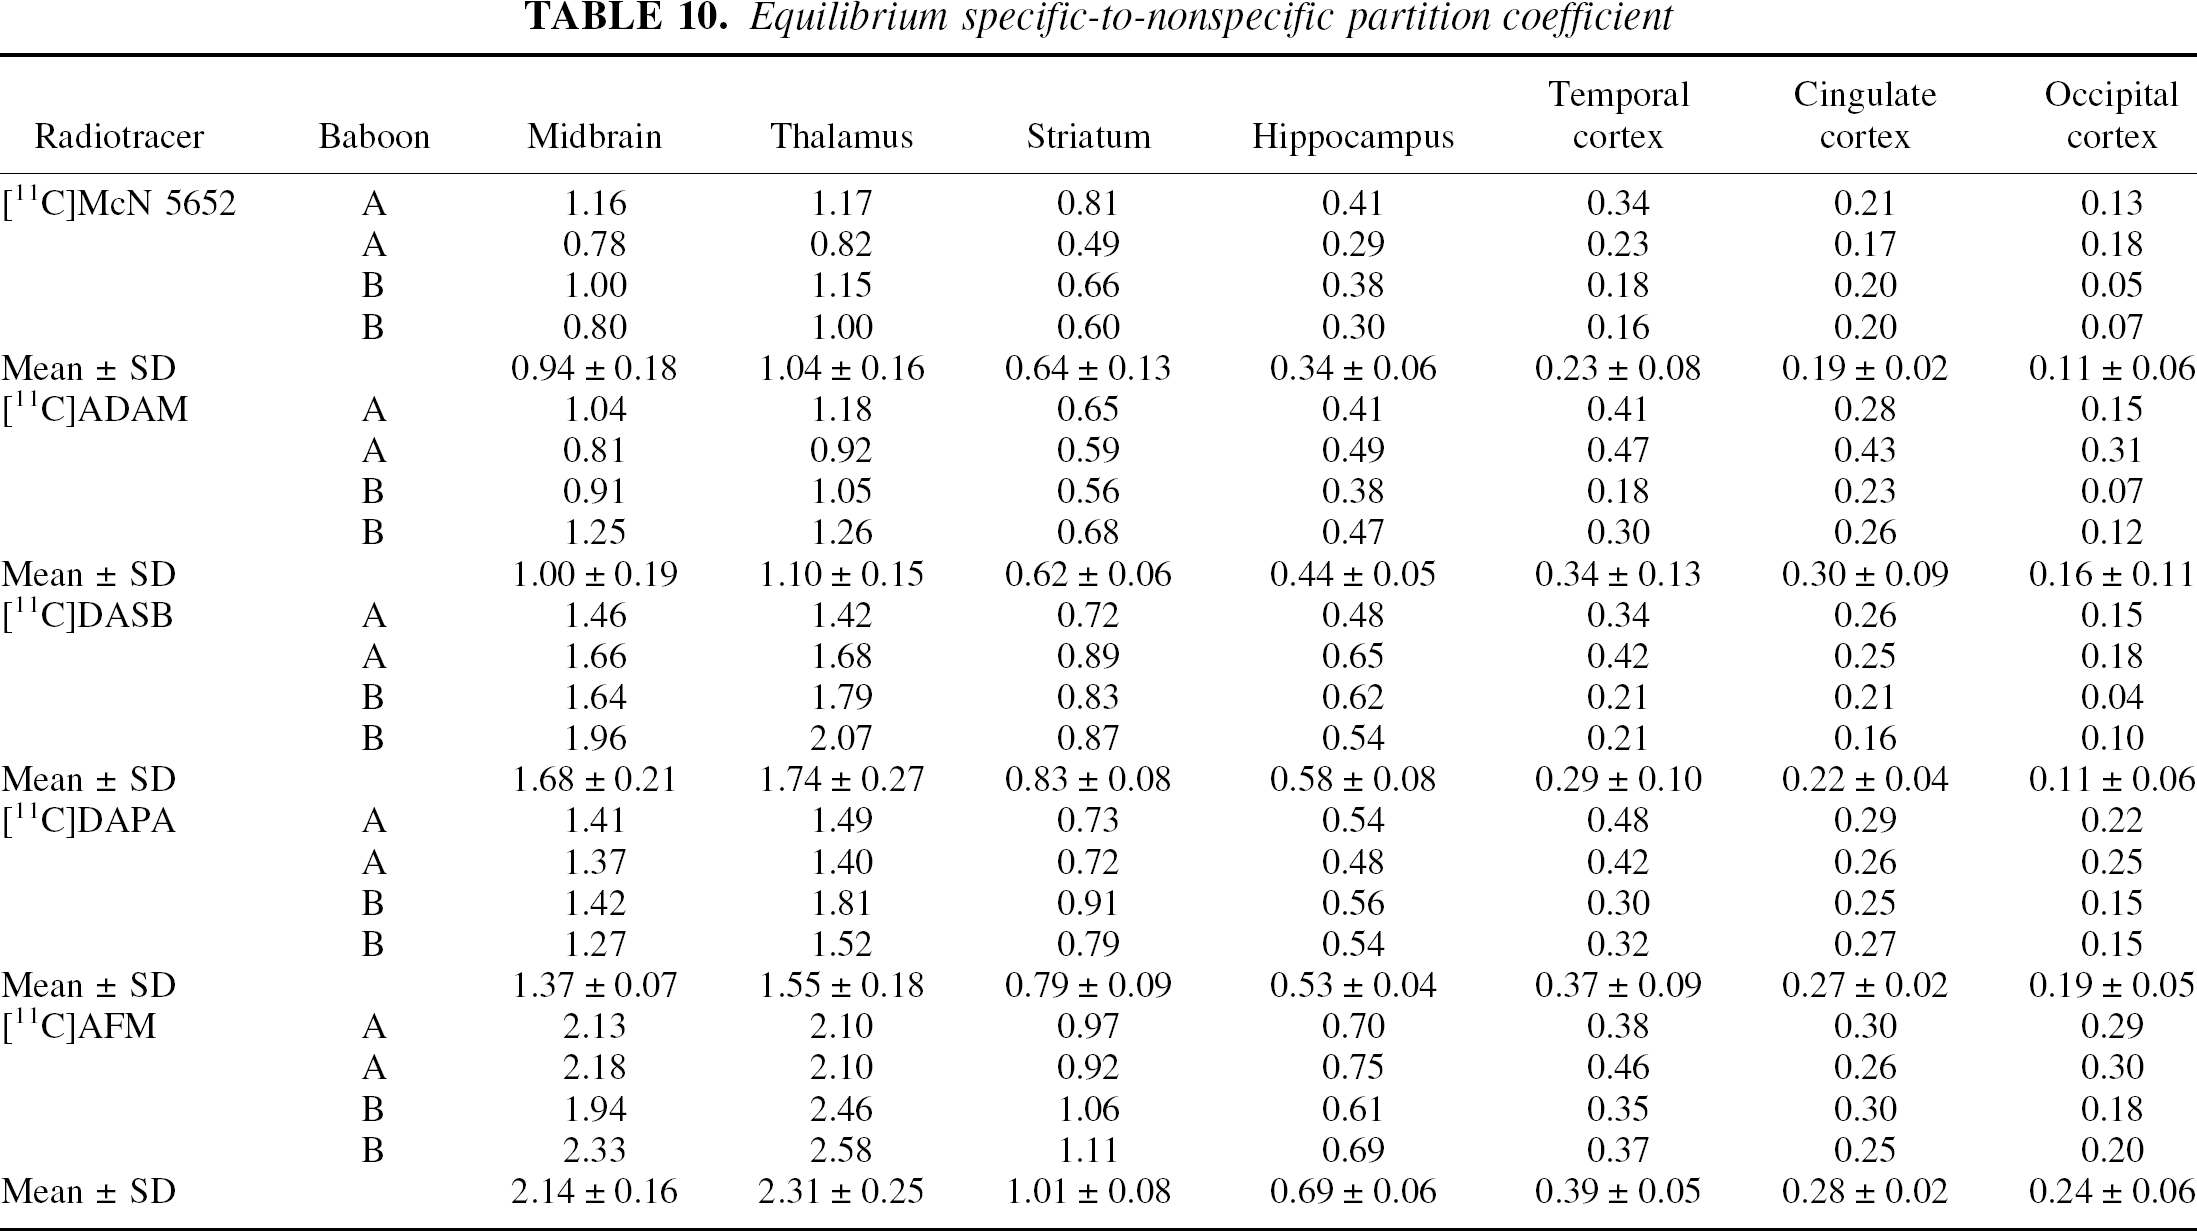
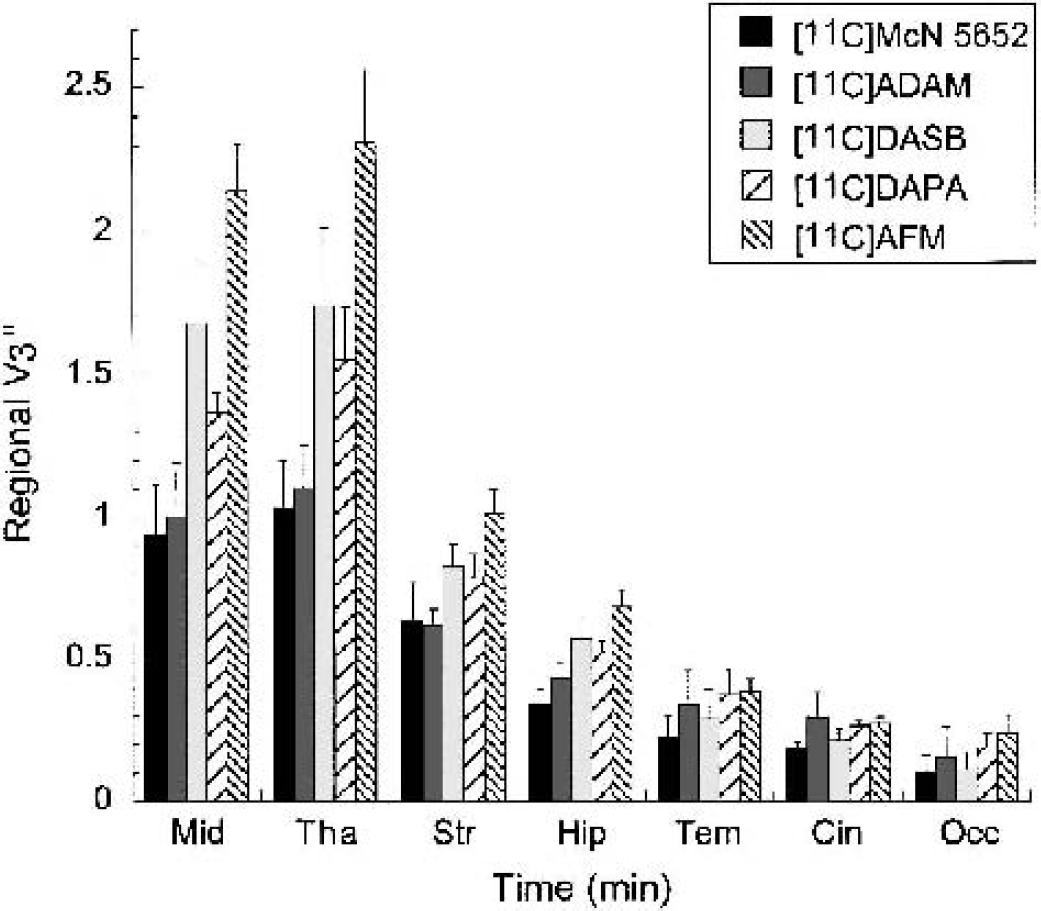
Equilibrium specific-to-nonspecific partition coefficient (V3″) measured with [11C]McN 5652, [11C]ADAM, [11C]DASB, [11C]DAPA, and [11C]AFM in the midbrain (Mid), thalamus (Tha), striatum (Str), hippocampus (Hip), temporal cortex (Tem), cingulate cortex (Cin), and occipital cortex (Occ). Each value is the mean ± SD of four experiments (two experiments each performed in each of two baboons). Significant differences in V3” were observed between regions (P < 0.0001), between tracers (P < 0.0001), but not between baboons (P = 0.75). Radiotracer rank order of V3” values was [11C]AFM > [11C]DASB ã [11C]DAPA > [11C]ADAM ã [11C]McN 5652.
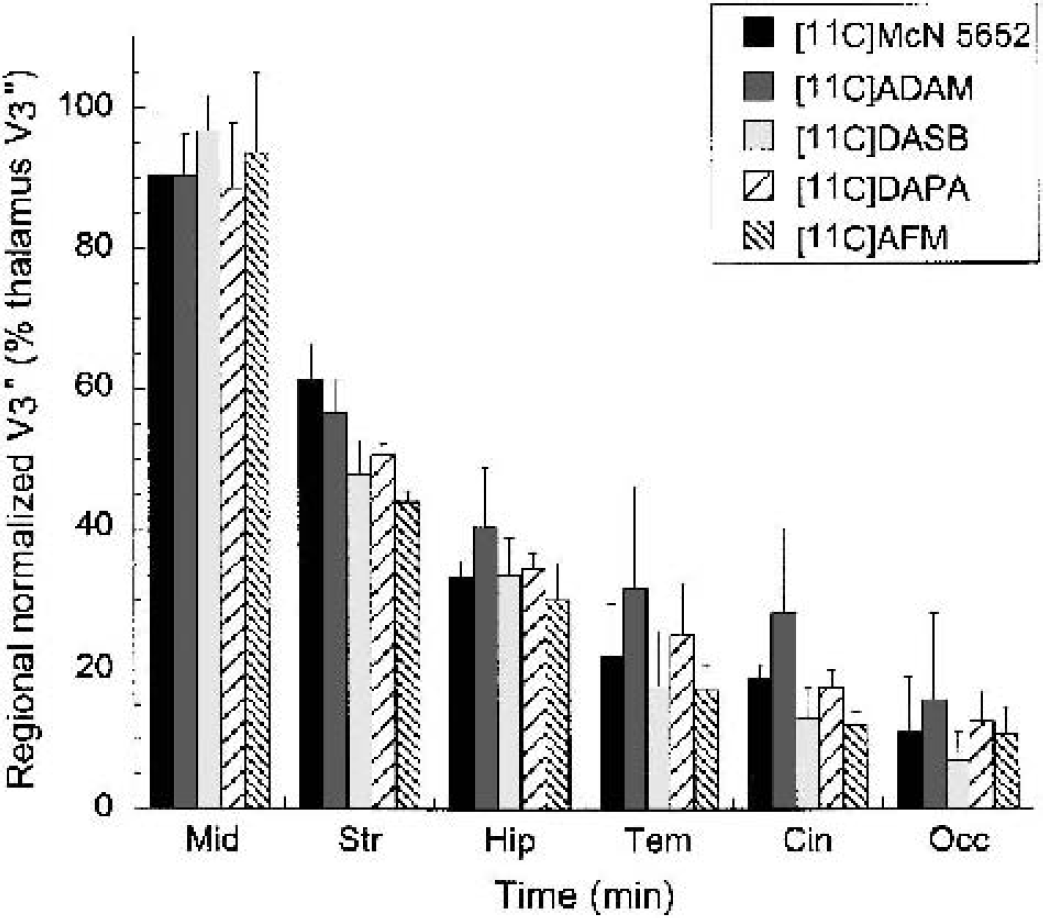
Regional V3” normalized to the thalamic V3” measured w1i1th [11C]McN 5652, [11C]ADAM, [11C]DASB, [11C]DAPA, and [11C]AFM in the midbrain (Mid), striatum (Str), hippocampus (Hip), temporal cortex (Tem), cingulate cortex (Cin), and occipital cortex (Occ). Under the hypothesis that all tracers bind to the same population of sites, it is anticipated that the normalized V3” values would be similar across tracers. This prediction was generally confirmed, with the exception that greater than expected V3” values are observed in the striatum for [11C]McN 5652 and in the striatum, hippocampus, and neocortical regions for [11C]ADAM.
Reproducibility of measurement of specific-to-nonspecific equilibrium partition coefficient
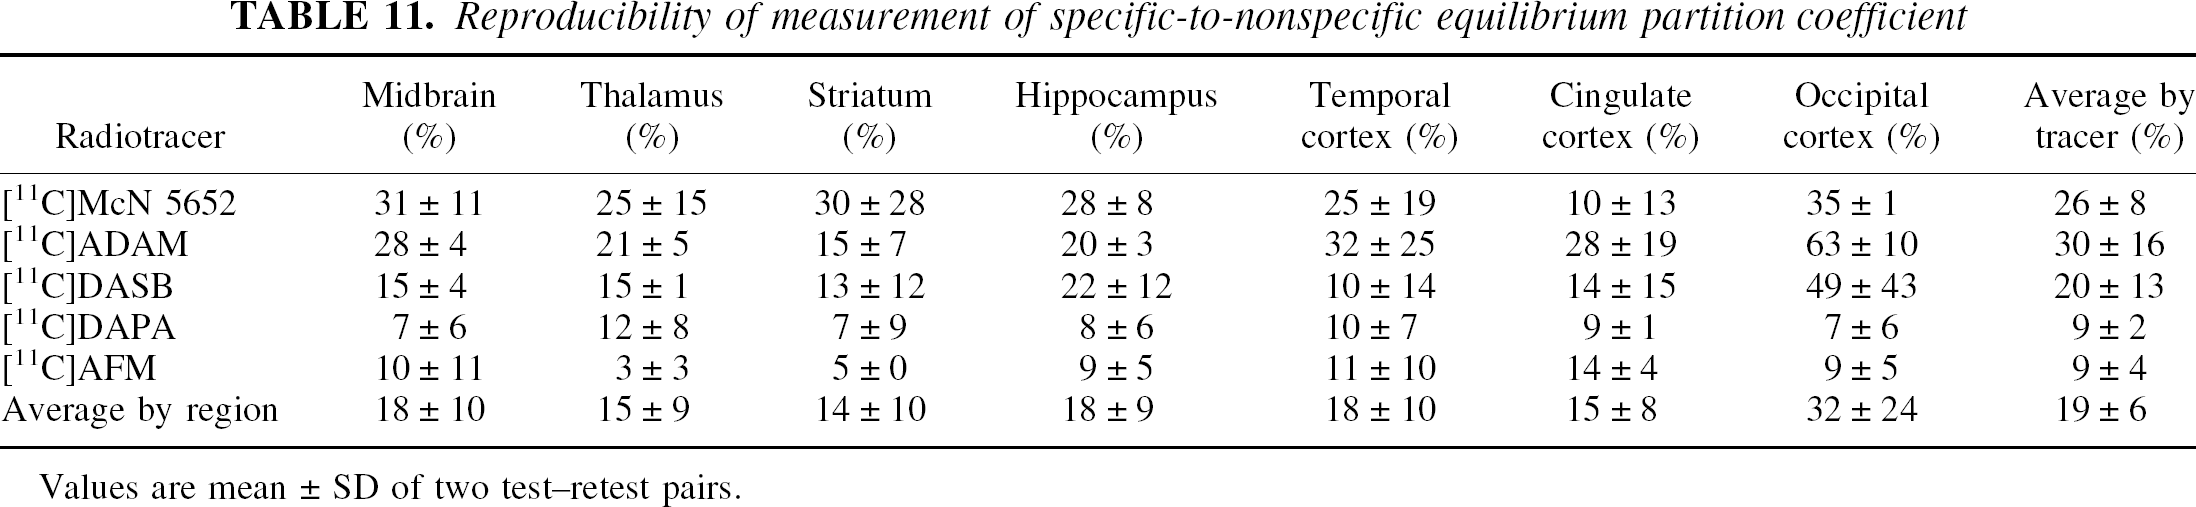
Values are mean ± SD of two test–retest pairs.
DISCUSSION
In this study, the imaging qualities of four new PET radioligands for the SERT, [11C]ADAM, [11C]DASB, [11C]DAPA, and [11C]AFM, were compared in baboons to the reference tracer, [11C]McN 5652. The results indicate that both [11C]DASB and [11C]AFM provide a significant improvement over [11C]McN 5652 for in vivo SERT imaging.
The introduction of [11C]McN 5652 in the mid-1990s represented an important advance, as this radiotracer was the first imaging agent successfully used to image SERT in baboons (Szabo et al., 1995a) and humans (Szabo et al., 1995b) in vivo with PET. The significance of this achievement must be appreciated in the context of years of failed attempts to develop a suitable radioligand for SERT (see Introduction). Before [11C]McN 5652, only [123I]β-CIT was available for the in vivo visualization of SERT in the human brain, and the use of this ligand for SERT imaging was restricted to the midbrain region only (Laruelle et al., 1993b). [11C]McN 5652, being more selective than [123I]β-CIT, was suitable to image SERT, not only in the midbrain, but also in the thalamus and striatum. The modest selectivity of [11C]McN 5652 relative to the norepinephrine transporters (Shank et al., 1988) did not appear to create a significant problem in vivo, at least in mice, where 5 mg/kg of desipramine failed to affect the specific binding of [11C]McN 5652 (Suehiro et al., 1993b).
However, [11C]McN 5652 provides a relatively low signal-to-noise ratio, thus precluding the reliable quantification of SERT in regions of the limbic system, where the concentrations of SERT are lower than those in the midbrain, striatum, and thalamus. In addition, the uptake of [11C]McN 5652 is protracted in humans. As a result, at least 120 minutes of data acquisition time is required to obtain time-independent estimates of VT in regions of high SERT density, such as the midbrain. Finally, the free fraction of [11C]McN 5652 in plasma is too low to be measured accurately using the standard ultracentrifugation technique. Thus, while [11C]McN 5652 is suitable to image SERT in humans, the limitations of this ligand have also been acknowledged (Szabo et al., 1999; Buck et al., 2000; Parsey et al., 2000).
Kung et al. (1999) reported the synthesis and characterization of a new radioiodinated compound, [123I]IDAM (Ki for SERT of 0.25 nmol/L), based on a new class of selective serotonin reuptake inhibitors (Acton et al., 1999a; Oya et al., 1999). [123I]IDAM was the first selective radiotracer to image SERT with SPECT. In the same year, this group also reported [123I]ODAM, a phenoxy derivative of [123I]IDAM, that was more resistant to metabolism but had a slightly lower affinity for SERT, and lower midbrain to cerebellum ratio (Acton et al., 1999b; Zhuang et al., 2000). Later, Kung et al. reported a third ligand, [123I]ADAM, an amino derivative of [123I]IDAM (Choi et al., 2000; Oya et al., 2000; Acton et al., 2001). In vitro Ki of [125I]ADAM in rat brain membranes (0.15 nmol/L) was comparable to that of [125I]IDAM (0.25 nmol/L). However, [123I]ADAM displayed four times higher target-to-background ratios in vivo compared with [123I]IDAM, thus making it a radiotracer of choice for imaging SERT with SPECT. In 2001, Vercouille et al. (2001) reported the labeling of ADAM with C-11. However, the properties of [11C]ADAM as a PET imaging agent have not yet been reported.
At about the same time, Wilson et al. (Wilson et al., 2000; Wilson and Houle, 1999) synthesized and evaluated a number of compounds in this same series as C-11-labeled candidate PET radioligands. Among these, [11C]DASB (Ki = 1.10 nmol/L for SERT) emerged as the most promising agent, based on the fast washout kinetics in rats. Furthermore, two of these new compounds, [11C]DASB and [11C]DAPP, were evaluated in humans (Houle et al., 2000). In humans, [11C]DASB displayed higher brain uptake than [11C]DAPP. Additional characterization of [11C]DASB in humans revealed that its binding was inhibited by pretreatment with paroxetine and citalopram (Houle et al., 2000). Kinetic analysis of [11C]DASB uptake in humans demonstrated that a one-tissue compartment model was appropriate to derive [11C]DASB distribution volumes (Ginovart et al., 2001).
We have prepared and characterized several derivatives in this diarylsulfide series of compounds. [11C]DAPA, the bromo analog of ADAM, displayed promising properties in rodent studies (Huang et al., 2002). Two fluorinated analogs were also prepared and evaluated, [11C]AFA and [11C]AFM, both suitable for potential labeling with F-18 (Huang et al., 2001). [11C]AFM displayed superior in vivo binding properties in rodents and baboons compared with [11C]AFA, and was selected for further development.
Consequently, over the last 3 years, the portfolio of available SERT imaging agents was dramatically changed. Until recently, only one selective tracer was available, whereas there are now several highly selective and promising candidate PET radiotracers. Owing to differences in methodologies between laboratories and the limited nature of outcome measures used in the initial evaluation of tracers (tissue-to-cerebellum ratio at one time-point), it was difficult to compare the potential of these new radiotracers based on published literature. Therefore, this study was conducted as a collaborative effort to evaluate the imaging qualities of these new tracers under identical experimental conditions. This evaluation included in vitro measurement of affinity and lipophilicity, and in vivo PET imaging experiments in two baboons.
For each parameter, a desired property was a priori defined as providing improvement over [11C]McN 5652. Among these, the most critical elements include: (1) higher V3″, to provide better signal-to-noise contrast for the quantification of SERT in regions of relatively low SERT densities, such as the regions in the limbic system; (2) reduced scanning time required to derive time-independent estimate of VT, to improve subject compliance and reduce noise associated with C-11 decay; and (3) increased plasma free fraction, to be able to control for this parameter in clinical studies. Note that properties 1 and 2 are essentially conflicting: everything else being equal, a higher in vivo affinity generally results in higher V3” values but also longer time required to reach equilibrium.
Table 12 summarizes the rank order of the tested compounds for each parameter. The symbol > or < denotes statistically significant differences, and ã denotes differences that are not statistically significant.
Comparative evaluation of tested radiotracers
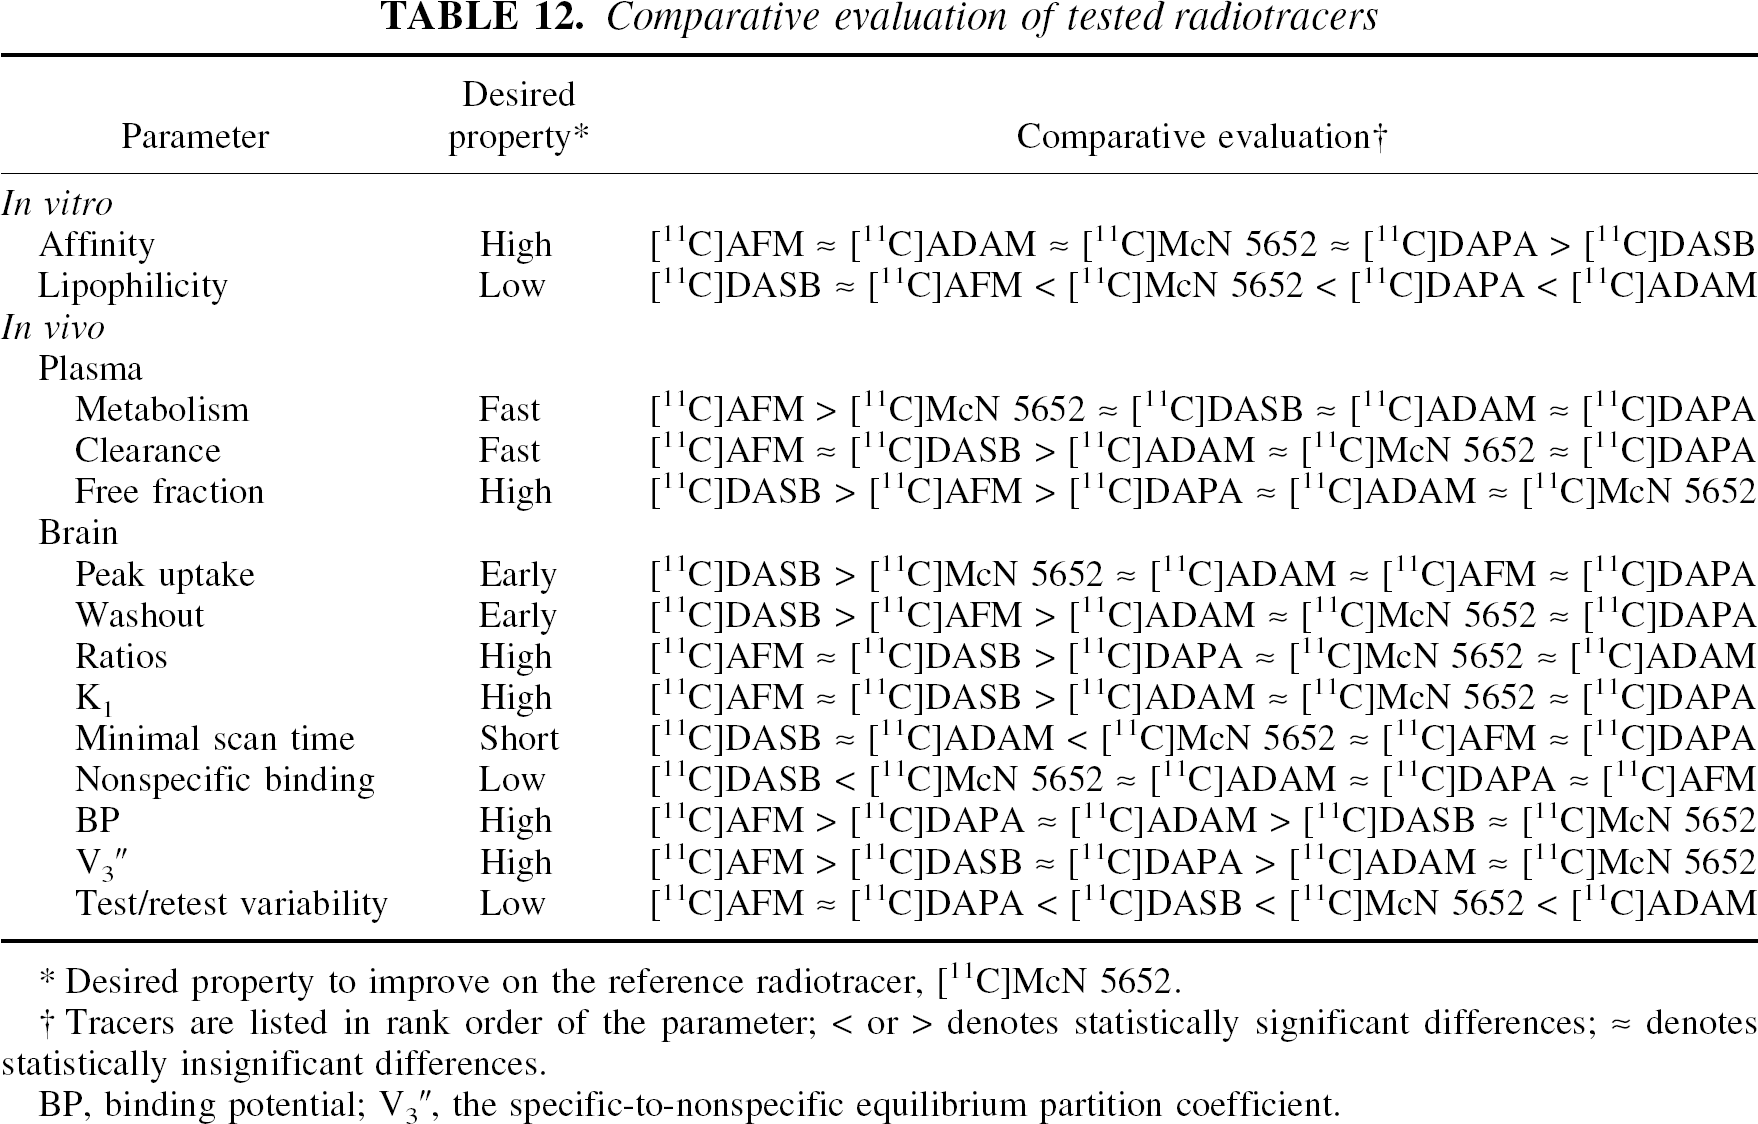
Desired property to improve on the reference radiotracer, [11C]McN 5652.
Tracers are listed in rank order of the parameter; < or > denotes statistically significant differences; ≈ denotes statistically insignificant differences.
BP, binding potential; V3″, the specific-to-nonspecific equilibrium partition coefficient.
In vitro evaluation
The in vitro evaluation of affinity yielded values generally comparable to those reported in the literature: ADAM and DASB were previously reported to have Kis of 0.15 nmol/L (Choi et al., 2000) and 1.10 nmol/L (Wilson et al., 2000). The McN 5652 IC50 for 5-HT uptake blockade (0.4 nmol/L) (Shank et al., 1988) was also consistent with the Ki value measured here. The comparative evaluation performed in our laboratories indicated that DASB had significantly lower affinity for SERT than the other four compounds, and that this difference was magnified as temperature increased. In agreement with the results of Elfving et al. (2001), increasing the assay temperature from 22°Cto37°C had variable effects on the affinities of these SSRIs. In the present study, the increase in temperature did not significantly affect the Kis of McN 5652, ADAM, DAPA, and AFM, but decreased significantly that of DASB.
The test compounds showed significant differences in lipophilicity, with [11C]DASB and [11C]AFM displaying lower lipophilicity than [11C]ADAM and [11C]DAPA, with [11C]McN 5652 occupying an intermediate position. It is generally assumed that higher lipophilicity of a ligand will translate into higher nonspecific binding to the plasma proteins and brain membranes (low f1 and f2, respectively). This prediction was borne out in part here: [11C]DASB and [11C]AFM were less lipophilic than [11C]ADAM and [11C]DAPA, and showed higher f1 compared with [11C]ADAM and [11C]DAPA. The lipophilicity of [11C]McN 5652 was not significantly different from that of [11C]AFM, and significantly but only slightly higher than that of [11C]DASB. However, [11C]McN 5652 free fraction was not measurable using the conventional ultracentrifugation technique. These observations illustrated that the predictive value of relative lipophilicity measurement for in vivo properties is restricted to compounds with similar chemical structures.
Integrating affinity and lipophilicity information for the four new compounds, and keeping in mind that low lipophilicity and high affinity are desirable, it appears that AFM provides the best combination of both parameters (Fig. 14). Compared with ADAM and DAPA, the lower lipophilicity of DASB is achieved at the price of a lower affinity. In contrast, the lower lipophilicity of AFM is achieved without a decreased affinity.
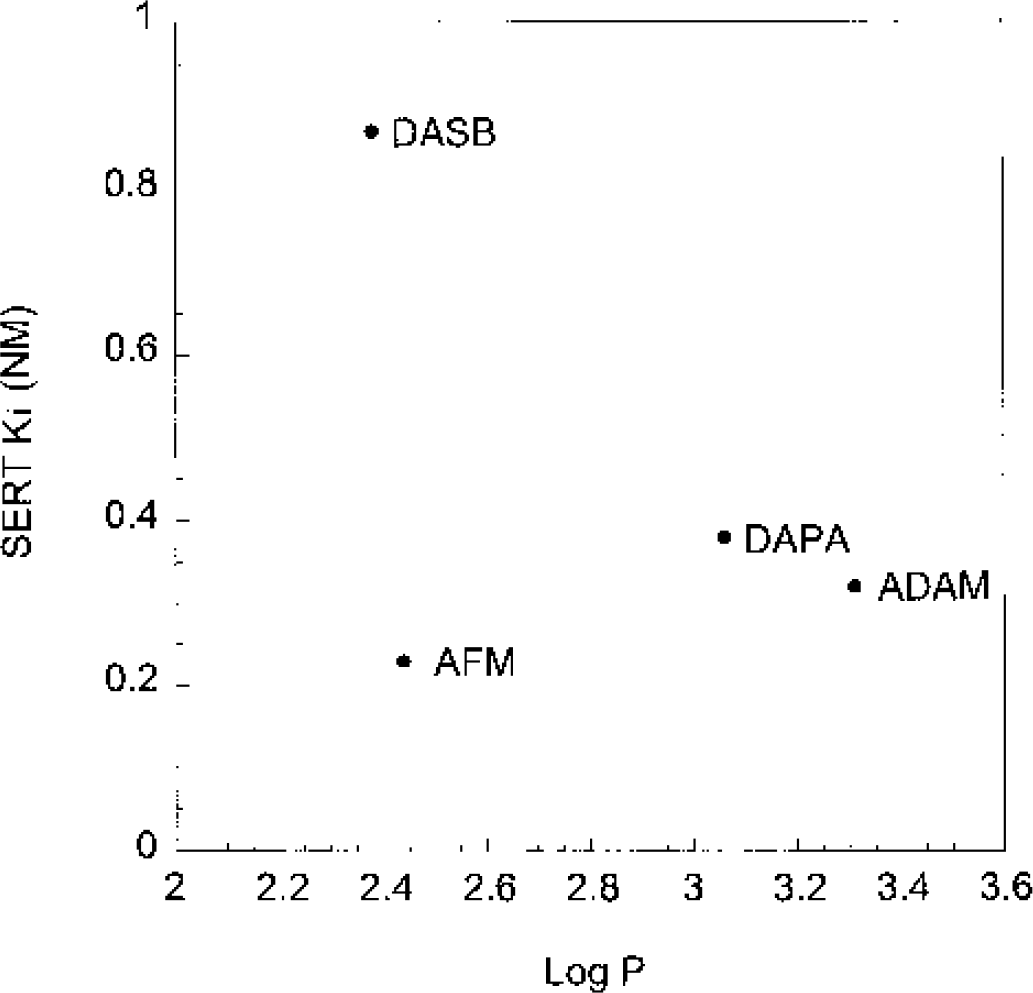
Affinity (Ki for serotonin transporters at room temperature) and lipophilicity (log P) of the four new compounds (ADAM, DASB, DAPA, and AFM) evaluated in this study. This figure illustrates that ADAM and DAPA are relatively similar, that the lower lipophilicity of DASB is associated with a lower affinity, and that AFM provides both a lower lipophilicity and a higher affinity. The predictions based on these data are generally confirmed in this study. [11C]DASB and [11C]AFM are the only ligands with measurable f1 and f2 fractions in vivo. [11C]DASB, combining low affinity and low lipophilicity, displays a fast kinetic of uptake and washout, and shorter scanning time required to derive time-independent distribution volumes. [11C]AFM, displaying high affinity and low lipophilicity, provides the best specific to nonspecific contrasts. [11C]McN 5652 is not presented in this figure, because predictions based on the in vitro lipophilicity are of limited value for compounds belonging to different classes of chemical structures.
Plasma analysis
Given that [11C]McN 5652 is associated with high but protracted brain uptake, the desired properties of the new tracers would include a faster rate of metabolism and plasma clearance. Everything else being equal, faster clearance from the plasma should result in decreased scanning time. This rule was actually confirmed by serendipity in this study: baboon A displayed a faster clearance than baboon B (presumably due to its greater weight), but identical SERT availability. Betweenbaboon differences predictable by this scenario were also confirmed: compared with baboon B, baboon A displayed a lower total brain uptake at 45 minutes, an earlier peak time, a faster brain washout, and higher ROI-to-cerebellum ratios at 90 minutes. The difference in ROI-to-cerebellum ratios between baboon A and B is a good illustration of the dependence of these ratios on the plasma clearance, and of the problem associated with the use of tissue ratios as outcome measures to estimate target site availability (see discussion in Carson et al., 1993). For between-tracer differences, [11C]AFM exhibited a faster metabolism rate, and both [11C]AFM and [11C]DASB exhibited faster plasma clearances.
The plasma free fraction of [11C]McN 5652 is not measurable with the conventional ultracentrifugation method, owing to its high retention on the ultracentrifugation filters (Parsey et al., 2000). The same situation was encountered with both [11C]ADAM and [11C]DAPA. In contrast, filter retention was modest with [11C]AFM and [11C]DASB. [11C]DASB f1 measured in this study in baboons was similar (13.5 ± 1.7%, n = 4) to that reported in humans (11.0 ± 1.2%, n = 5) (Ginovart et al., 2001). [11C]AFM f1 was of a comparable magnitude (9.6 ± 0.5%). Both values were lower than the plasma free fraction of [123I]β-CIT (40 ± 5%) (Laruelle et al., 1994a). The ability to measure the free fractions in the plasma is critical for clinical studies involving conditions in which this parameter might have been changed, such as in alcoholism (Abi-Dargham et al., 1998). Without a measurement of f1, the significance of a difference in brain distribution volumes might be difficult to interpret.
In conclusion, the faster plasma clearance and measurable free fractions associated with [11C]DASB and [11C]AFM are two factors that favor these two ligands over [11C]McN 5652, [11C]ADAM and [11C]DAPA.
Image analysis
A simple inspection of the brain images (Fig. 4) and time–activity curves (Figs. 5 to 9) reveals the major features that differentiate these ligands from one another. Figure 5 illustrates the limitations of [11C]McN 5652: the brain uptake is protracted, the regional peak activities are poorly defined, and the differences between cerebellum and ROI activities are modest. The PET images show a specific accumulation in the midbrain and thalamus, while the striatum barely emerges from the neocortical activity, and the hippocampus is not detectable. [11C]ADAM time–activity profile (Fig. 6) and images are similar to [11C]McN 5652 (with the exception of a relatively higher uptake in the temporal cortex). The uptake of [11C]DASB (Fig. 7) is very different from that of [11C]McN 5652, in that it shows a fast uptake, well-defined peaks, and appreciable washout. On the [11C]DASB images, the cerebellum is darker, the contrast better, and the hippocampus detectable. [11C]DAPA presents a time–activity profile similar to those of [11C]McN 5652 and [11C]ADAM, with the exception that the differences between regions appear to be more pronounced (Fig. 8). In terms of contrast, the PET images of [11C]DAPA are also similar to those of the [11C]McN 5652 and [11C]ADAM. Finally, [11C]AFM shares with [11C]DASB well-defined peaks, and appreciable washout (Fig. 9). On the images, [11C]AFM displays a superior contrast, the concentrations of activity in the midbrain and thalamus are very high, and the striatum and most remarkably the hippocampus clearly emerge from the neocortical background. The quantitative analysis confirms the impression gained by a simple examination of the time–activity curves. Overall, when compared with [11C]McN 5652, [11C]ADAM, and [11C]DAPA, [11C]DASB exhibits earlier activity peaks, faster washout, and higher ROI-to-cerebellum ratios at the end of the experiment. [11C]AFM shares with [11C]DASB the higher ratios, but peak activities occurred later than those of [11C]DASB, and less washout was observed during the time frame of the scan.
Uptake kinetics
Kinetic analysis was performed using a one-tissue compartment model. The better performance of the one-versus the two-tissue compartment model has been previously noted for [11C]McN 5652 by several groups (Szabo et al., 1999; Buck et al., 2000; Parsey et al., 2000) and for [11C]DASB by Ginovart et al. (2001). Values of K1 reported in this study were high, indicating excellent extraction and brain penetration. The higher K1 values displayed by [11C]AFM and [11C]DASB might be related to higher free fractions in the plasma.
Not surprisingly, given its faster kinetic, the average regional minimal scanning time required to derive time-independent estimates of VT was the shortest for [11C]DASB. The midbrain was the region in which a larger data set was required to derive time-independent estimates. In this region, 71 minutes were required for [11C]McN 5652, [11C]ADAM, and [11C]AFM. [11C]DASB required only 61 minutes, and [11C]DAPA required 81 minutes.
It is difficult to predict how these values would extrapolate to humans. The rate of metabolism for [11C]McN 5652 is slower in humans than in baboons: at 30 minutes, the [11C]McN 5652 parent fraction was 59 ± 10% in humans (Parsey et al., 2000), compared with 28 ± 13% measured here in baboons. The same was true for [11C]DASB: in humans, [11C]DASB parent fraction at 30 minutes was 40 ± 7% (Ginovart et al., 2001), versus 20 ± 1% measured here. The slower metabolism rate observed in humans might translate into slower brain uptake kinetics. Supporting this prediction, we observed that at least 120 minutes of data were required to derive stable [11C]McN 5652 VT estimates in the human mid-brain (Parsey et al., 2000), versus 71 minutes in baboons (49-minute difference). On the other hand, Ginovart et al. (2001) determined that no more than 80 minutes of data acquisition was required to derive stable VT values in all regions with [11C]DASB: this is only 19 minutes more than in baboons. A fair conclusion would be that, with the exception of [11C]DASB, the new ligands evaluated here are unlikely to allow for a substantial reduction in scanning time in humans compared with [11C]McN 5652. However, a great uncertainty is associated with this prediction.
Nonspecific binding
The cerebellum distribution volume was uniformly high for all of the test ligands (a range of 10 to 30 mL g−1). The [11C]McN 5652 VT CER measured in this study (27.7 ± 4.0 mL g−1) was comparable to values reported for humans by our group (17.8 ± 1.9 mL g−1, n = 6) (Parsey et al., 2000) and others (11.9 ± 3.3 mL g−1, n = 8) (Buck et al., 2000). The [11C]DASB VT CER measured here (17.3 ± 0.5 mL g−1) was also comparable to that reported for humans (11.8 ± 1.5 mL g−1, n = 5) (Ginovart et al., 2001). However, the [11C]ADAM VT CER measured in this study (28.5 ± 4.8 mL g−1) was much higher than that measured in baboons with SPECT and [123I]ADAM (2.25 ± 0.46 mL g−1) (Acton et al., 1999a).
The VT CER values of these five SERT ligands are about one order of magnitude higher than those measured for other commonly used PET radiotracers such as [11C]raclopride, [18F]fallypride, [11C]WAY 100635, and [11C]NNC 112 (Lammertsma et al., 1996; Abi-Dargham et al., 2000a,b; Mawlawi et al., 2001a). However, they are comparable to values measured in humans for the DAT/SERT ligand [123I]β-CIT (28 ± 3 mL g−1) (Laruelle et al., 1994a) and for the 5-HT2A receptor ligand [11C]MDL 100907 (18 ± 4 mLg−1) (Mawlawi et al., 2001b). These high levels of nonspecific distribution volumes represent a major handicap to achieve high signal-to-noise ratios (V3″= BP/VT CER). In this regard, the significantly lower VT CER value of [11C]DASB compared with the other four tracers provides an appreciable advantage for this ligand.
Receptor parameters
[11C]AFM has the highest BP of the five ligands tested in this study. The magnitude of BP per se is not critical in defining the imaging qualities of a tracer. BP provides a measure of the signal, but the quality of the signal can only be appreciated in relation to the noise. The ratio of BP to VT CER, namely V3″, is thus more related to the imaging characteristics of a ligand than BP itself. The main interest of calculating BP in this context is to relate this value to the Bmax/KD ratio. Under the assumption that the tracer crosses the blood–brain barrier by passive diffusion (a widely accepted assumption that may not be correct for all SSRIs, see Rochat et al., 1999), BP as defined here is equal to f1Bmax/KD. The derivation of the Bmax/KD ratio requires the knowledge of f1; and therefore this derivation was only feasible for [11C]DASB and [11C]AFM. Assuming that both ligands bind to the same population of serotonin transporter sites, this calculation suggests that the in vivo affinity of [11C]AFM is 3.3 times higher than that of [11C]DASB. This conclusion is consistent with the in vitro data, which indicate a lower Ki for [11C]AFM than [11C]DASB, by a factor of 2.8 at room temperature and 4.4 at body temperature (Table 1).
As stated previously, V3” (= f2Bmax/KD) is a decisive outcome measure of the present study for comparing these SERT ligands. In a given region (Bmax being constant), higher V3” means higher affinity (lower KD) and/or lower nonspecific binding (higher f2), improved signal-to-noise ratio and better measurement reliability. To increase V3” to above the values observed with [11C]McN 5652 may not be critical (or even desirable) to measure SERT in regions of high density, such as the midbrain. However, it is essential for the measurement of SERT availability in regions of lower densities, such as the neocortex and the limbic system. The vast majority of postmortem findings implicating alterations of SERT densities in psychiatric disorders have been observed in the neocortex and the limbic system. For example, in schizophrenia, abnormalities of SERT density in postmortem studies appear to be localized to the prefrontal cortex and hippocampus, while other areas of the neocortex are preserved (Joyce et al., 1993; Laruelle et al., 1993a; Dean et al., 1995; Gurevich and Joyce, 1997). Using [123I]β-CIT, we observed normal SERT level in the midbrain of patients with schizophrenia (Laruelle et al., 2000). Thus, schizophrenia is an example of a condition in which a SERT ligand capable of quantifying the SERT concentrations in regions of relatively low density is desirable.
[11C]McN 5652 V3” values measured in baboons in this study are consistent with those measured in six healthy humans by our group (Parsey et al., 2000), with some noticeable differences, presumably due to species differences. In humans, [11C]McN 5652 V3” in the mid-brain was much higher than in the thalamus (1.63 vs. 0.92, respectively), but this is not the case in baboons (0.94 vs. 1.04). In humans, striatal V3” was comparable to thalamic V3” (1.03 versus 0.92, respectively), but in baboons, striatal V3” was lower than thalamic V3” (0.64 versus 1.04). However, hippocampus, temporal cortex, cingulate cortex, and occipital cortex showed comparable and low [11C]McN 5652 V3” in both humans (0.49, 0.22, 0.21, and 0.17, respectively) and baboons (0.34, 0.23, 0.19, and 0.11). Thus, based on the data acquired with [11C]McN 5652 in the same laboratory, cortical V3” values measured in baboons appear to be a fair predictor of the values observed in humans. On the other hand, the [11C]DASB V3” value reported by Ginovart et al. in the occipital cortex in humans (0.51 ± 0.09) was higher than that measured in baboons in this study (0.11 ± 0.06), using a similar modeling strategy. At this point, it is unclear if this discrepancy reflects species difference or methodological difference in image analysis between laboratories.
Compared with [11C]McN 5652, [11C]ADAM provides a modest improvement in V3″. Combining all regions, the [11C]ADAM V3” expressed as percentage of the [11C]McN 5652 V3” is only 128 ± 24%. In this regard, [11C]DASB and [11C]DAPA provide a more significant improvement over [11C]McN 5652, with [11C]DASB and [11C]DAPA V3” values at 142 ± 29% and 151 ± 18% of that for [11C]McN 5652, respectively. Finally, [11C]AFM provides the most significant improvement, with V3” value almost twice of that for [11C]McN 5652 (193 ± 35%). These results suggest that, among the ligands tested in this study, [11C]AFM should be the ligand of choice to measure SERT availability in the limbic and neocortical regions, where SERT densities are low.
The present study does not include examination of the prefrontal cortex. Because of the close proximity of this structure to the striatum in the baboon brain, counts in the prefrontal cortex are contaminated by spillover from the striatum. In humans, [11C]McN 5652 V3” values were not significantly different from zero in the dorsolateral prefrontal cortex and the orbitofrontal cortex, and barely above background in the medial prefrontal cortex (V3” = 0.08) (Parsey et al., 2000). This observation does not indicate that SERT is absent in these regions, but that the specific binding of the radiotracer was negligible compared with the nonspecific binding. Thus, while data from the present study suggest that [11C]AFM will provide adequate specific signals in the hippocampus, temporal cortex, and cingulate cortex, studies in humans are required to assess the ability of this tracer to visualize and quantify SERT in the prefrontal cortex.
The observation that the relative improvement in V3” of the new ligands over [11C]McN 5652 is not uniform across regions was unexpected. Under the assumption that the nonspecific binding and the affinity for SERT of a given ligand are constant across regions, V3” should be related to Bmax in a region-independent manner. Therefore, if all tracers bind to the same population of transporter sites, relative regional differences in V3” should be constant across tracers. To test this prediction, V3” values are normalized to the thalamus V3” and compared. As expected, the absence of significant between-tracer differences in normalized V3” is generally confirmed. However, the presence of a significant tracer by region interaction in this test suggests that in some regions, significant between-tracer differences are encountered in the normalized V3″. In fact, normalized [11C]ADAM and [11C]McN 5652 V3” values are greater than expected in the striatum, and normalized [11C]ADAM V3” values are also greater than expected in the limbic and temporal cortical regions (Fig. 13). This observation is reminiscent of the observation reported by Choi et al. (2000) in rats with [123I]ADAM: in the hippocampus, the nonspecific binding, measured by [123I]ADAM accumulation in rats pretreated with 2 mg/kg of unlabeled ADAM, was much higher than in other regions. Similarly in baboons, interregional differences in nonspecific binding might affect V3” values, especially in regions with low V3″. Homologous blocking experiments are required to further clarify this issue.
As two scan experiments were obtained with each ligand in each of the two baboons, an estimate of the reproducibility in V3” measurement could be calculated. These estimates should be taken with caution, because they are derived from a limited data set. Nonetheless, the relative variability between regions and tracers in reproducibility is relatively consistent with what could be predicted from the respective characteristics of the regions and tracers. Thus, regions of large size and greater V3” (e.g., the thalamus and striatum) generally showed a better reproducibility compared with the regions of smaller size (midbrain) or V3” (cortex). Tracers with higher V3” values such as [11C]AFM and [11C]DAPA behave better than those with lower V3” such as [11C]McN 5652 and [11C]ADAM, with [11C]DASB occupying an intermediate position.
Overall evaluation
Examination of Table 12 shows that, for parameters evaluated in vivo, [11C]DASB and [11C]AFM emerge as superior radioligands. When compared with [11C]McN 5652, [11C]ADAM does not appear to provide a clear advantage as a PET imaging agent. However, [123I]ADAM is a very useful and advantageous SPECT radioligand when compared with [123I]β-CIT. [11C]DAPA provides some advantage over [11C]McN 5652 in terms of V3” and reproducibility, but these improvements are countered by slower kinetics and longer scan duration required to derive time-independent measurement of VT. Compared with [11C]McN 5652, [11C]DASB is clearly a superior ligand, because it provides higher V3” values in a shorter scanning time. For studies in which measurement of the limbic and cortical regions are not essential, such as in drug occupancy studies, [11C]DASB is clearly the tracer of choice among the ones tested here. In addition, [11C]DASB has already been evaluated in humans (Houle et al., 2000; Ginovart et al., 2001; Meyer et al., 2001), and as such the excellent imaging qualities of this tracer observed in animal studies have been confirmed in humans. On the other hand, [11C]AFM may offer distinct advantages for the measurement of SERT in regions of relatively low densities. [11C]AFM V3” is significantly higher than all the other tracers evaluated here. The key factor to determine the usefulness of [11C]AFM in human studies will be the scan duration required to reach time-independent estimate of VT. Another attractive feature of [11C]AFM is that this ligand can be radiolabeled with F-18. The use of [18F]AFM might make the issue of scan duration less critical, and thus make it possible to take full advantage of the higher V3” offered by this ligand. In addition, [18F]AFM would make SERT imaging available in PET centers without an on-site cyclotron, given that the distribution network for F-18-labeled PET radioligands is already in place. For all these reasons, further evaluation of [11C]AFM and [18F]AFM in humans is warranted.
CONCLUSIONS
Four newly developed SERT radiotracers were evaluated and compared with the reference tracer [11C]McN 5652 under identical experiment conditions. Overall, [11C]ADAM and [11C]DAPA do not appear to present a clear advantage over [11C]McN 5652 as PET imaging agents. On the other hand, [11C]DASB, because of its fast kinetic, and [11C]AFM, because of its higher signal-to-noise ratio, appear to be superior radiotracers for the imaging of SERT in baboons using PET. Studies in humans comparing [11C]McN 5652, [11C]DASB, and [11C]AFM are warranted to confirm the results of the present study.
Footnotes
Acknowledgments:
The authors thank Samir Abdelhadi, Mohammed Ali, Elizabeth Hackett, Kimchung Ngo, Van Phan, and Lyudmilla Savenkova for their excellent technical assistance.