
Abstract
Measurement of cerebrovascular reserve capacity predicts the risk of ischemic insult in patients with major vessel occlusion. Blood oxygenation level-dependent (BOLD) imaging has the potential to estimate reserve capacity of the cerebral circulation noninvasively based on changes in the signal that reflect differences in the magnetic susceptibility of intravascular oxyhemoglobin and deoxyhemoglobin. The authors examined the feasibility of using the BOLD technique to assess cerebrovascular reserve capacity in patients with cerebrovascular occlusive disease by comparing results with an established method of measuring CBF. Ten patients with severe or complete occlusion of the internal carotid artery were compared with 17 healthy subjects to evaluate regional differences and identify variables that indicate a change in the BOLD signal. Dilation of cerebral vessels was induced by breath holding, and the R2* change was examined with gradient-echo, echo-planar imaging. Before measuring the regional change in the BOLD signal, actual timing of “activated” and “rest” periods was corrected by shifting the phase of a sine-wave template to obtain the largest correlation coefficient. Percent signal change was calculated on a pixel-by-pixel basis and was compared with CBF measured by single-photon emission computed tomography (SPECT) before and after acetazolamide challenge. The degree of impairment and the distribution of impaired areas detected by the BOLD study correlated with the results of SPECT. Overall sensitivity and specificity of the BOLD technique by visual inspection were 100% and 98.4%, respectively. A negative response (decreased CBF) frequently was observed in areas of exhausted reserve capacity, suggesting that a “steal” phenomenon exists. The percent change and the ΔCBF were well correlated (P < 0.01). The mean percent change in most areas of impaired reserve capacity was more than 2 SD below the mean values in healthy subjects. The present method of semiquantitative BOLD analysis can be used to create a map of the cerebral hemodynamic state. Furthermore, the development of reliable, generally accessible techniques for evaluating cerebral hemodynamics opens the door for clinical studies to monitor and treat patients with compromised reserve. This study is an attempt to develop such analysis.
Keywords
Direct measurement of CBF fails to detect the reduction in cerebral perfusion pressure that occurs when CBF is maintained by compensatory vasodilation (Powers et al., 1987). Knowledge of regional blood flow is clinically important because functioning areas or vascular territories whose flow is maintained by compensatory changes might have reached the limit of autoregulation, making them vulnerable to ischemic injury (Schmiedek et al., 1994; Yonas et al., 1993; Kleiser and Widder, 1992). Cerebrovascular reserve capacity is impaired by risk factors such as hypertension and diabetes, and can be an etiologic factor in ischemic stroke (Fulesdi et al., 1997; Strandgaard and Haunso, 1987; Fujii et al., 1990).
Positron emission tomography (PET) is the gold standard for assessing cerebral perfusion because of its ability to quantify regional CBF, cerebral blood volume (CBV), and oxygen extraction fraction. The expense and technical complexity, however, preclude its routine clinical use. In contrast, single-photon emission computed tomography (SPECT) and xenon-enhanced computed tomography have been used widely to assess cerebral perfusion and cerebral reserve. The drawback to these modalities is the need for repeated measurements with and without acetazolamide administration, resulting in increased radiation exposure and prolongation of the examination time. Furthermore, the test-retest protocol introduces error because of the heterogeneous washout of tracer and head motion artifact resulting from the length of time in the scanner (Moretti et al., 1995).
Blood oxygenation level-dependent (BOLD) imaging reflects the difference in the magnetic susceptibility between oxyhemoglobin and deoxyhemoglobin in blood vessels (Ogawa et al., 1990, 1992; Kwong et al., 1992). Signal changes in magnetic resonance imaging (MRI) of T2*-weighted or BOLD-weighted images correlate well with changes in the total amount of oxygenated hemoglobin (Jezzard et al., 1994), which is affected by blood flow and oxygen metabolism in the brain. In functionally activated areas, CBF augmentation exceeds the small increases in oxygen utilization (Fox and Raichle, 1986; Fox et al., 1988), and the concentration of deoxyhemoglobin is relatively low. Thus, this excess supply of oxygen in response to a demand stimulus may reflect the cerebral perfusion reserve capacity (Bruhn et al., 1994; Graham et al., 1994; Rostrup et al., 1994; Kleinschmidt et al., 1995; Hedera et al., 1996; Ono et al., 1997; Harris et al., 2001). Because hypercapnia is assumed to have little effect on cerebral oxygen utilization (Cohen et al., 1964; Artru and Michenfelder, 1980), CBF is the main factor affecting changes in the BOLD signal. In fact, an increase in the BOLD signal in the human brain has been observed after acetazolamide challenge and the CO2-loading test in healthy volunteers (Bruhn et al., 1994; Hedera et al., 1996; Rostrup et al., 1994). Similar phenomena also have been reported in the rat brain (Graham et al., 1994; Ono et al., 1997; Harris et al., 2001). Lythgoe et al. (1999) studied the BOLD response to a CO2 challenge in the middle cerebral artery (MCA) of patients with occlusion or severe stenosis of the internal carotid artery, and compared these results with the velocity change in the MCA using transcranial Doppler ultrasound. They found a correlation between the interhemispheric difference in MCA reactivity and the BOLD signal change. Their report encouraged the development of BOLD-MRI as a new technique to assess reserve capacity in patients whose CBF is compromised. The regional distribution of the reactivity difference, however, cannot be interpreted by measuring the vascular response using transcranial Doppler ultrasound alone, and the feasibility of using the BOLD-MRI technique is not determined.
Therefore, we studied the dynamics of changes in regional BOLD signals produced by breath holding in patients with internal carotid artery occlusion or severe stenosis, and compared the results with CBF obtained by SPECT with and without acetazolamide administration. The aim of this study was to determine whether this BOLD-MRI is suitable for assessing CBF reserve capacity. Regional BOLD signal changes were semiquantitatively measured by comparing regions of interest (ROIs) for several brain areas in the patients and healthy subjects. Furthermore, we have devised a method to activate the vascular response and developed the technology for postprocessing the BOLD analyses.
SUBJECTS AND METHODS
Seventeen volunteers (age range, 22 to 43 years; mean ± SD, 31.1 ± 7.4 years) who had no history of cerebrovascular disease or no abnormality on cerebral magnetic resonance (MR) angiography or fluid-attenuated inversion-recovery images were enrolled in the BOLD study. For investigation of clinical feasibility, 10 patients with complete or near-complete obstruction of the internal carotid artery, including two patients with moyamoya disease, were recruited. The patients had either a history of transient ischemic attack (TIA) or a stroke with no or only mild neurologic deficits and a good quality of life. Digital subtraction angiography was performed in all patients to confirm vascular changes. The study protocol for the BOLD examination was approved by the Ethics Committee of our university, and subjects were informed of the nature of the study before giving consent.
The duration of the procedure was 10 minutes. During this period, all subjects were instructed via intercom, and were asked to keep their eyes closed and to hold their breath for 24 seconds after the end of normal expiration; this maneuver was repeated three times. For pacing, the subjects were instructed to exhale, inhale, and then exhale for 3 seconds each. Between periods of breath holding, subjects were instructed to breathe normally. Before and between breath-holding intervals, subjects inhaled 100% oxygen administered by mask at a flow rate of 5 L/min. A pulse oximeter was applied to the right index finger to monitor changes in arterial oxygen saturation.
BOLD imaging and semiquantitative analysis
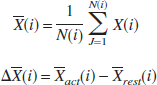
Blood oxygenation level-dependent images were acquired with a Signa Advantage 1.5-T MR system (General Electric Medical Systems, Milwaukee, WI, U.S.A.), with a standard quadrature head coil. The T2*-weighed gradient-recalled echo, echo planar imaging, was performed using the following parameters: repetition time (TR)–echo time (TE), 3,000/50 ms; flip angle, 60°; receiver bandwidth, 100 kHz; field of view, 24 cm; matrix, 128 × 128; slice thickness, 5 mm; slice gap, 7 to 10 mm; and imaging time, 5 minutes 2 seconds. Three-dimensional MR images fitted to the coordinates of the BOLD imaging were acquired for anatomic registration: TR/TE, 9.3/2 ms; matrix, 256 × 256; slice thickness, 1 mm; slice gap, −0.5 mm (overlapped). Data were sent to a workstation, and image analyses software (Dr. View, version 5.07; Asahi Kasei Joho Systems, Tokyo, Japan) was used for data processing. A paradigm was established as follows: “rest” was the period of normal breathing, whereas “activated” was the period of breath holding. Smoothing was carried out with full-width at half-maximum taken to be 10 mm while the homogenizing signal weight was within this range. The images of the first three cycles were discarded from the analysis. The remaining images of each slice were used for the time-series analyses. Images were realigned using a general linear model to correct for head movement. Pixel-by-pixel correlation coefficient analysis was performed to evaluate the hemodynamic response to the breath holding using a sine wave as the template function. To minimize the error generated by the time-gap between the predicted template function and the actual BOLD signal changes, which may vary between subjects, automated data analyses were performed that incrementally phase-shifted the images until the best correlation coefficient was obtained (Fig. 1). This phase-shift corrects the timing of “activated” and “rest,” and then the optimal percent signal change was calculated from the differences in the mean values of “activated” and “rest” for each pixel. A color scale was used to demonstrate the mean percent change. The percent change was calculated using the following equations:
where the subscripts “act” and “rest” denote parameters of the activated condition induced by breath holding and
resting condition during normal breathing, respectively. X is the mean signal intensity, N(i) is the acquisition number, and NT is the frequency of activation.
Schematic drawing of the time-intensity curve of the blood oxygenation level-dependent (BOLD) signal during three cycles of breath holding and the template function. The template is shifted until the best correlation is obtained, and then mean percent change is calculated. Schema shows “activated” (light gray) and “rest” (dark gray) periods.
For the sake of convenience for semiquantitative estimation of the regional percent change, the ROI was set bilaterally on the thalamus, territories of the MCA, ACA, posterior cerebral artery, and centrum semiovale by one interpreter (Y. M.) who was masked to the patients' medical status (Fig. 2). The criteria for setting the ROIs on the arterial territories were based on the anatomic atlas of Tatu et al. (1998). The ROI for the territory of the ACA was set on the medial surface of the superior frontal gyrus and adjoining the anterior cingulate gyrus on section VII or VIII in Tatu' s atlas. Similarly, the ROI for the MCA was set from the precentral sulcus to the superior temporal sulcus on section VII or VIII. The ROI for the posterior cerebral artery was set from the intraoccipital sulcus on section VII or the intraparietal sulcus on section VIII, to the posterior cingulate gyrus and adjoining gyri of the medial surface.
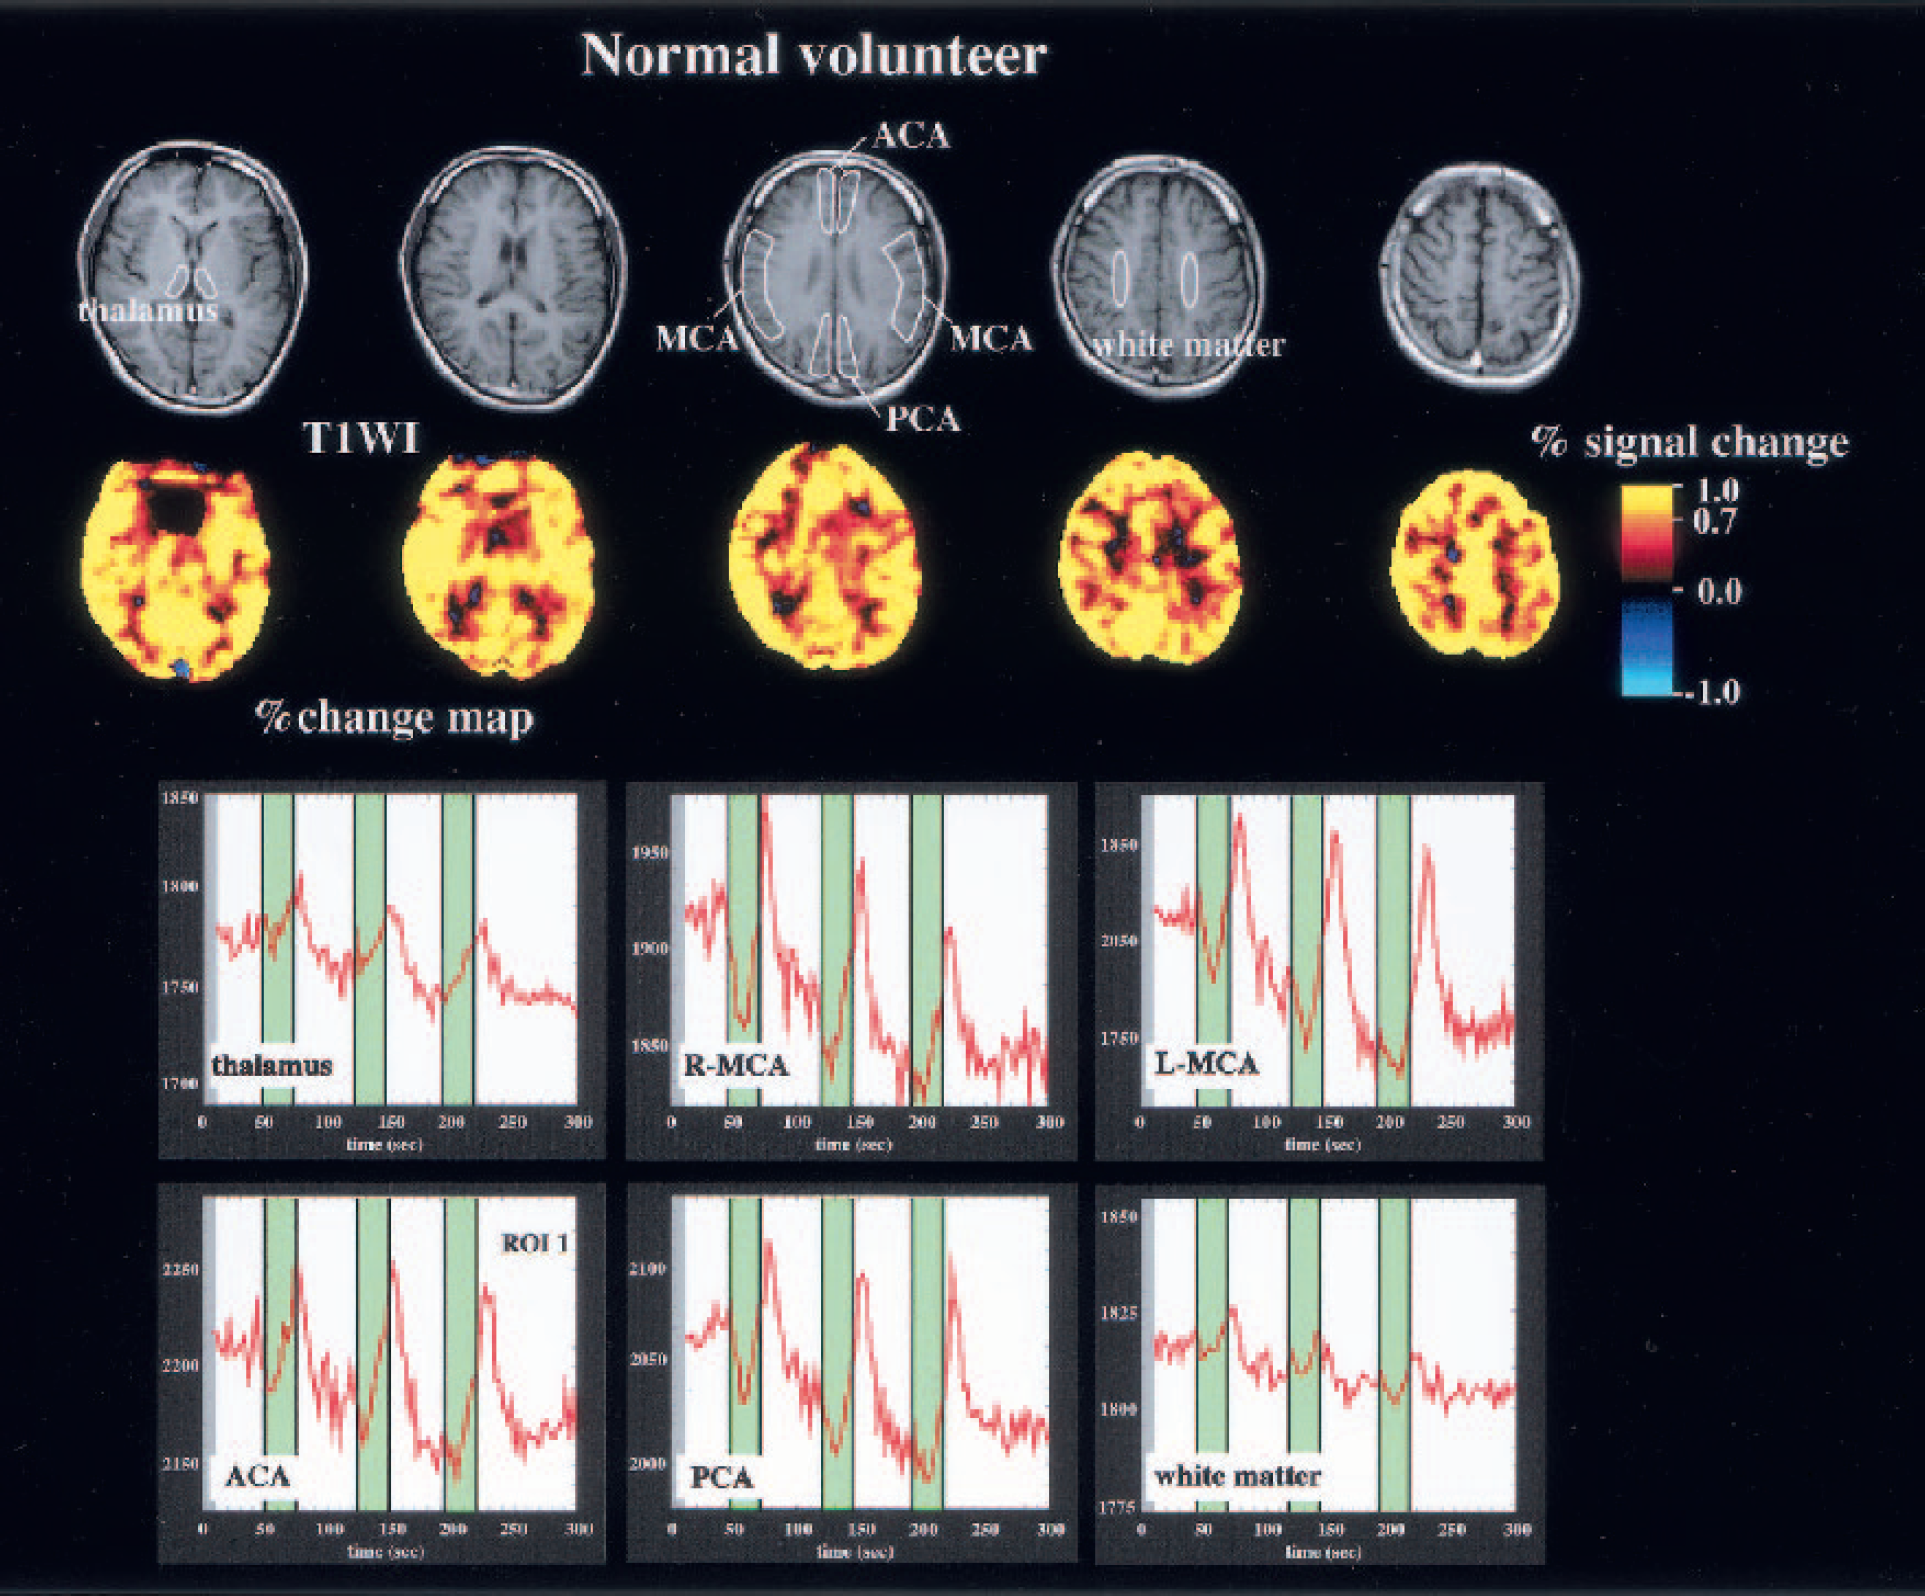
Representative T1-weighted magnetic resonance image, percent change map, and time-intensity curves of a healthy subject. The percent change in the blood oxygenation level-dependent (BOLD) signal is higher in the gray matter than in the white matter. The BOLD signal also is different in the choroid plexus of the lateral ventricle. Regions of interest are drawn manually over 10 brain regions, and time-intensity curves are obtained for each area. The translucent mask indicates the periods of breath holding. During breath holding, the BOLD signal intensity increases, and the intensity rises further immediately after resumption of breathing. ACA, MCA, and PCA are anterior, middle, and posterior cerebral artery, respectively.
To further study the effects on the BOLD signal change provoked by breath holding, 6 of the 17 volunteers were subsequently examined using the same protocol 15 minutes after intravenous administration of 1 g of acetazolamide. The reduction rate of the percent change value due to the acetazolamide administration was calculated using the same ROIs.
Single-photon emission computed tomography study
Absolute regional CBF was measured in the 10 patients with internal carotid occlusion or stenosis by a split-dose SPECT technique to determine cerebral perfusion reserve capacity. We used a GCA-9300A triple-head system (Toshiba, Tokyo, Japan). Three-time acquisition with a high-speed, 7 minutes for 360° acquisition each on a 128 × 128 matrix was performed. A low-energy, super-high-resolution fan-beam collimator was used, resulting in a transaxial resolution of 7.8 mm full-width at half-maximum. During dynamic SPECT, 111 MBq (3 mCi) of 123I-iodoamphetamine was injected intravenously at the beginning of imaging and again at the start of the 10th frame of acquisition. Ten minutes after the first injection of 123I-iodoamphetamine, one arterial blood sample was taken, and its whole blood radioactivity concentration was measured using a well counter that was cross-calibrated to the SPECT scanner. One gram of acetazolamide was injected slowly intravenously over 1 minute at the start of the fourth frame of acquisition. The resting CBF image was reconstructed from the summation of the second-to-ninth-frame data. The acetazolamide challenge CBF image was reconstructed from the summation for the 11th-to-16th-frame data, with subtraction of the remaining brain activity due to the first 123I-iodoamphetamine injection. The three-dimensional SPECT data were coregistered with the three-dimensional MR images and resliced along with the same slice position and thickness of the BOLD data. As a result, the ROIs on the BOLD and the SPECT images were set automatically in the same anatomic locations. The correlation coefficient of the values obtained from the 10 ROIs of the two modalities was calculated for each patient.
Comparison between BOLD and single-photon emission computed tomography
Two neuroradiologists (R.I. and A.F.), who were masked to patients' medical status, judged the concordance of the results in the SPECT and BOLD studies. They were instructed to compare the extent and degree of impairment by visual inspection. In addition to the visual interpretation, the degree of reserve capacity calculated from the SPECT studies was classified into four groups for statistical analysis: A, slightly impaired; CBF response to acetazolamide was impaired, but CBF increased more than 10% from the basal CBF. B, moderately impaired; the increase in CBF was less than 10%. C, severely impaired; no vascular response was detected. Lesions were classified as C if a steal phenomenon was observed. N, unaffected areas, that is, thalamus, hemisphere contralateral to the side of occlusion, and posterior cerebral artery territory were classified as normal.
Arterial gas sampling and blood pressure measurement
In a separate study, a catheter was inserted into the radial artery in 10 patients and in 10 of 17 healthy subjects. Arterial gas parameters were measured before and immediately after the end of breath holding. The six volunteers who underwent the acetazolamide test were excluded from the arterial blood sampling. The subjects were instructed to hold their breath for 24 seconds in the same way as in the BOLD study to measure changes in oxygen, carbon dioxide, and pH of arterial blood. Systolic and diastolic blood pressure were measured continuously via a transducer connected to the catheter.
Statistical analysis
Data are reported as the mean ± SD. A software program (StatView 4.0, Abacus Concepts, Inc., Berkeley, CA, U.S.A.) was used for statistical analysis. Statistical significance was determined by the Wilcoxon signed rank sum test for paired sample, and by the Mann-Whitney U test for nonparametric unpaired samples. One-way analysis of variance was performed for multiple comparisons using the Kruskal-Wallis test. Results were considered significant when the P value was < 0.05.
RESULTS
Breath holding-induced changes in arterial blood gas content
After 24 seconds of breath holding, the Paco2 in the 10 patients increased by 4.2 to 8.0 mm Hg (5.7 ± 1.4 mm Hg, P = 0.0117), and the pH decreased by 0.013 to 0.064 (0.035 ± 0.015 mm Hg, P = 0.0117). The Pao2 showed a mean decrease of 20.1 ± 6.2 mm Hg (P = 0.0584), but the change in the hemoglobin saturation was less than 1%. While BOLD imaging was performed, the arterial O2 saturation, as monitored by pulse oximetry, was 100% at all points, including the end of breath holding. Systolic blood pressure did not change significantly (Table 1). Similar results were obtained from the 10 healthy subjects, and rest-breath-holding differences in the arterial blood content between patients and the healthy subjects were not significant. The baseline disparity in the Pao2 between the two groups may have been due to a difference in the design of the O2 mask, that is, the mask used for the patients was more open.
Percent change in BOLD signal in healthy volunteers
Breath holding-induced BOLD signal changes were seen in all healthy individuals. Immediately on initiation of breath holding, BOLD signal transiently decreased, but then increased while the breath was being held. Immediately after breathing resumed, the BOLD signal increased further (Fig. 2). Changes in the BOLD signal resulting from breath holding were greater in the gray matter than in the white matter. The results of the percent change in each area are shown in Table 2 (lower column). As expected, the percent change was almost sixfold higher in the gray matter than in the white matter.
Arterial blood gas variables before and at the end of breath holding for 24 seconds in patients and healthy subjects
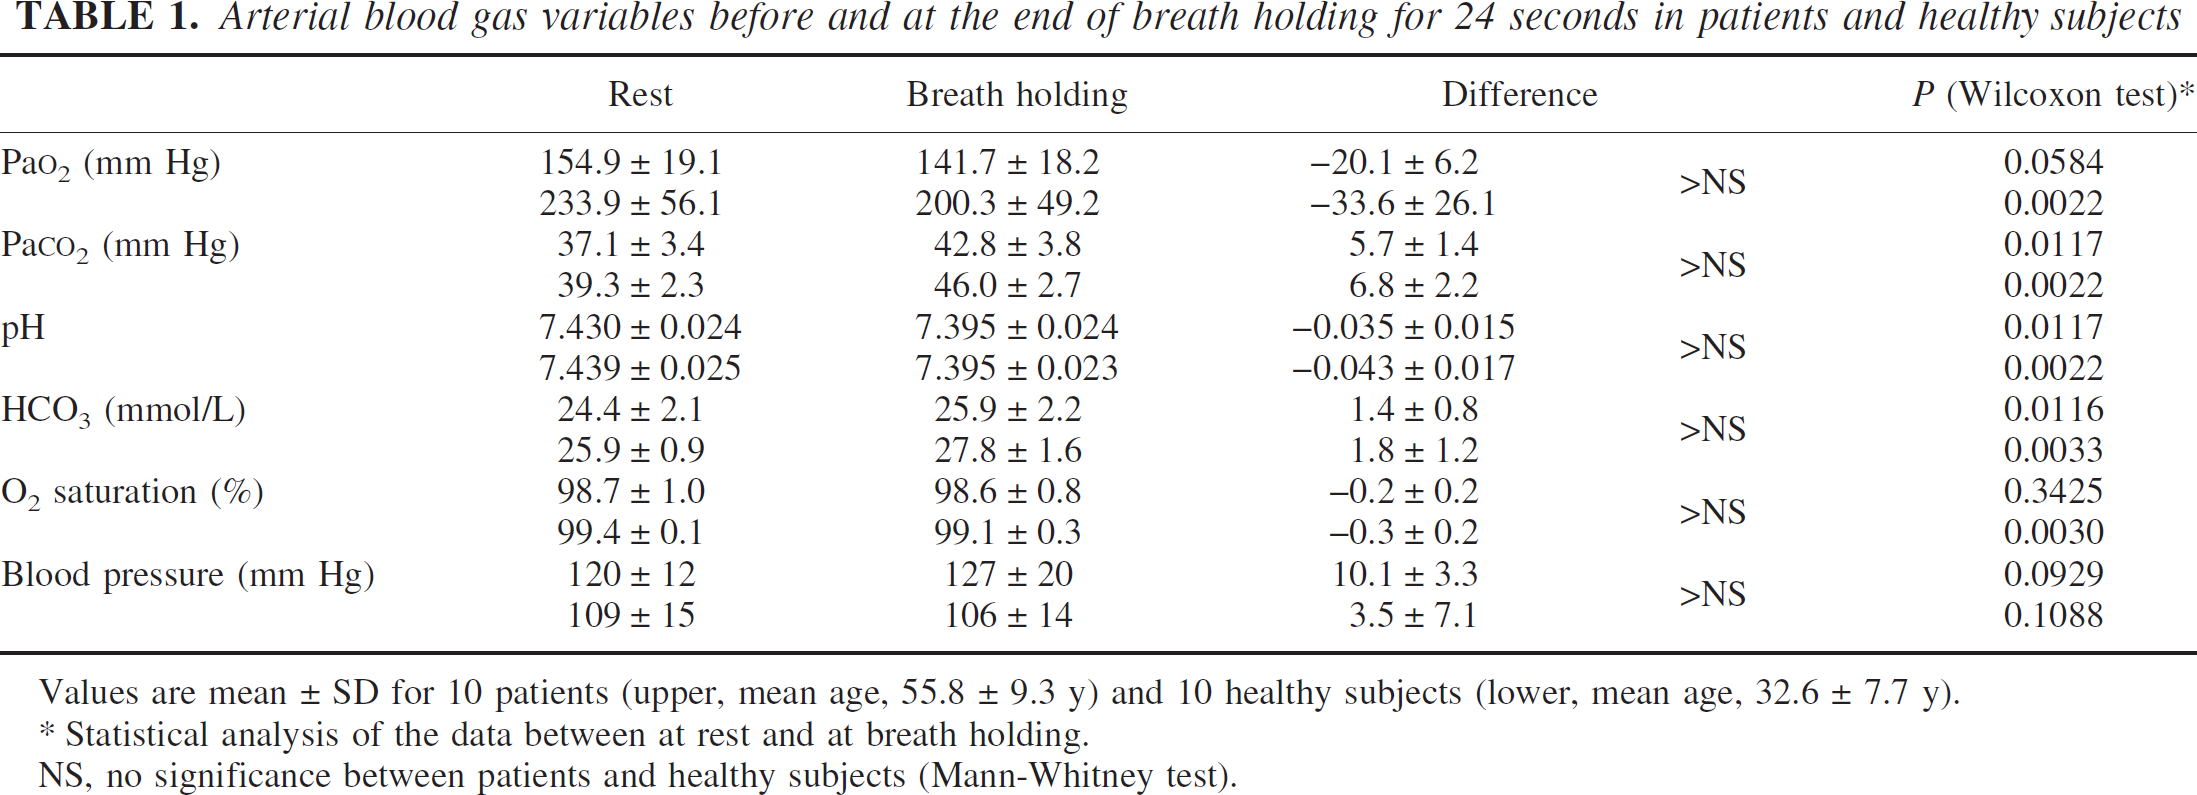
Values are mean ± SD for 10 patients (upper, mean age, 55.8 ± 9.3 y) and 10 healthy subjects (lower, mean age, 32.6 ± 7.7 y).
Statistical analysis of the data between at rest and at breath holding. NS, no significance between patients and healthy subjects (Mann-Whitney test).
A representative study showing the effects of oxygen inhalation is presented in Fig. 3. Inhalation of oxygen enhanced an increase in the BOLD signal during and immediately after breath holding, resulting in more dynamic changes in the BOLD signals. The calculated value of the percent signal change was much higher with than without oxygen inhalation. Of note, all subjects reported that it was easy to hold their breath when requested to do so during the examination.
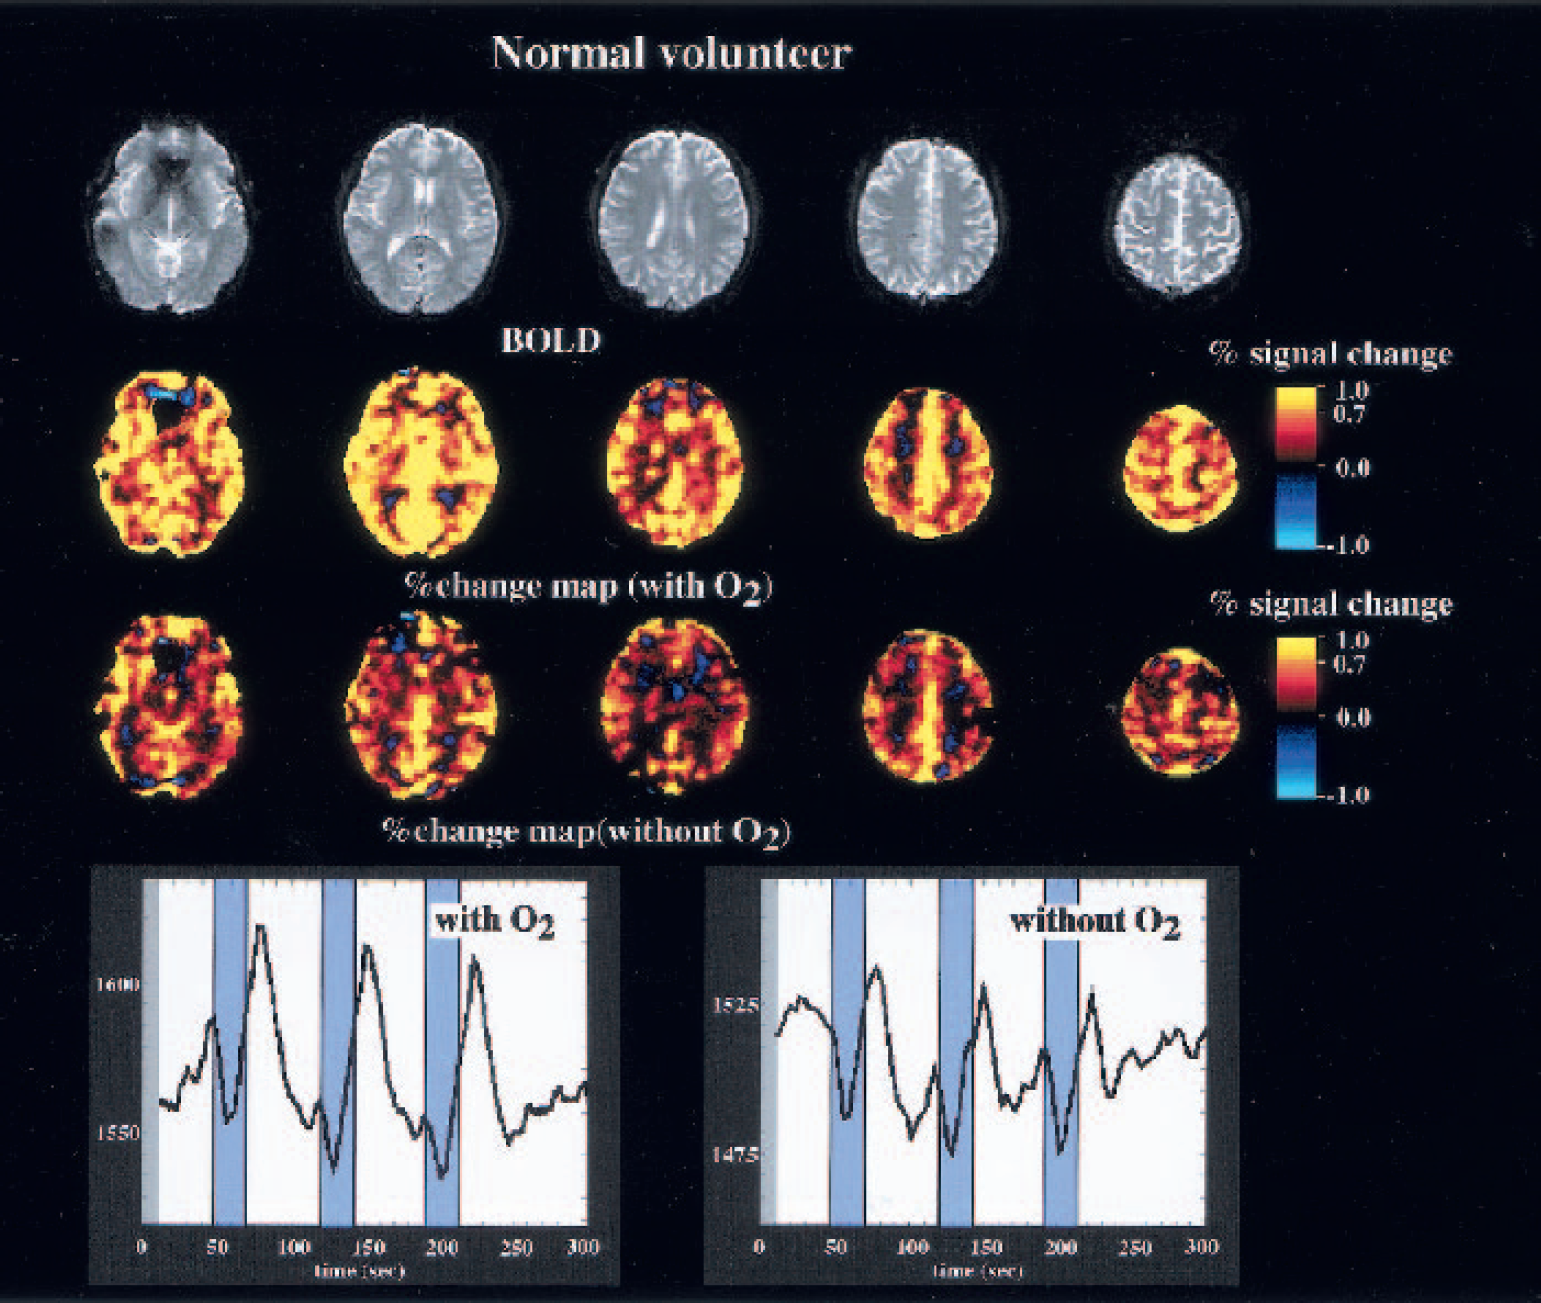
Representative maps of the correlation coefficient and time-intensity curves obtained from a healthy subject. Dynamic change in the blood oxygenation level-dependent (BOLD) signal is enhanced by oxygen inhalation.
Effects of acetazolamide on signal change during breath holding
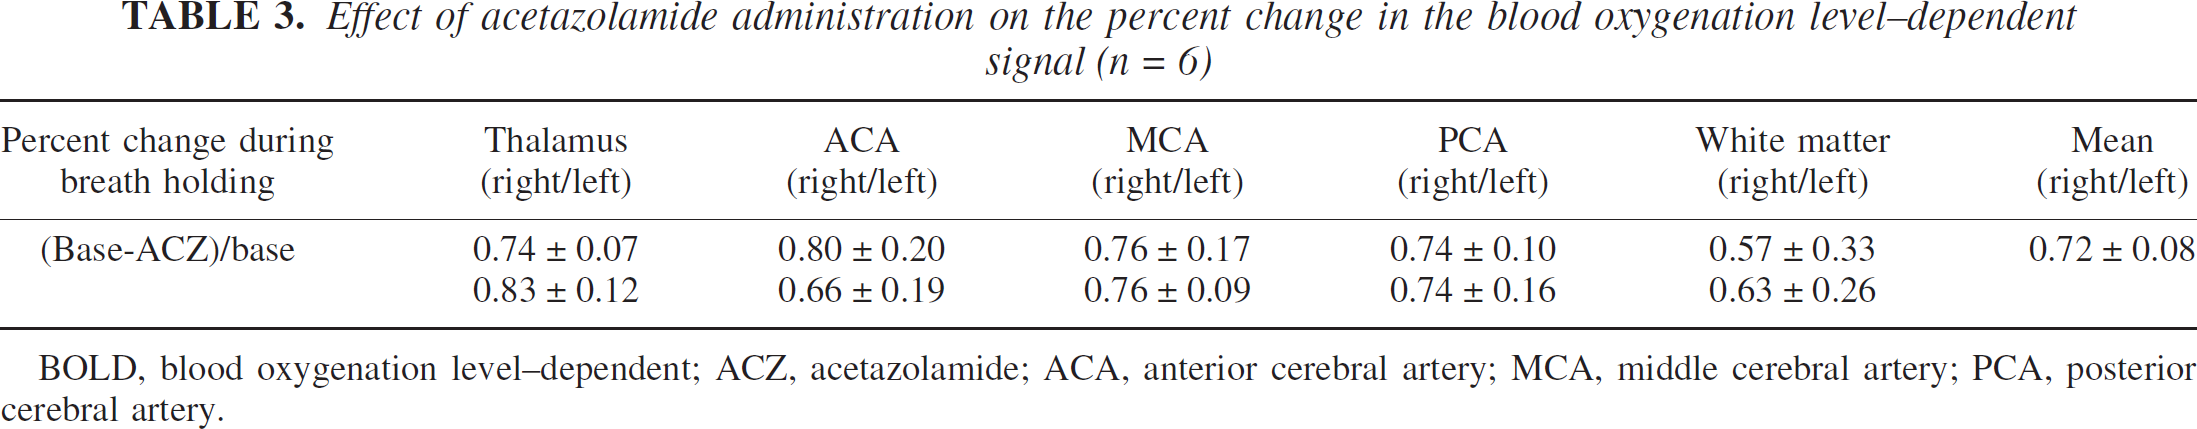
Acetazolamide inhibited the BOLD signal change induced by breath holding, but the inhibition was not complete (Fig. 4). The mean inhibition rate on the percent signal change induced by acetazolamide loading was 72.7 ± 7.5% in the 10 healthy subjects (Table 3). The inhibition rate was similar in all ROIs.
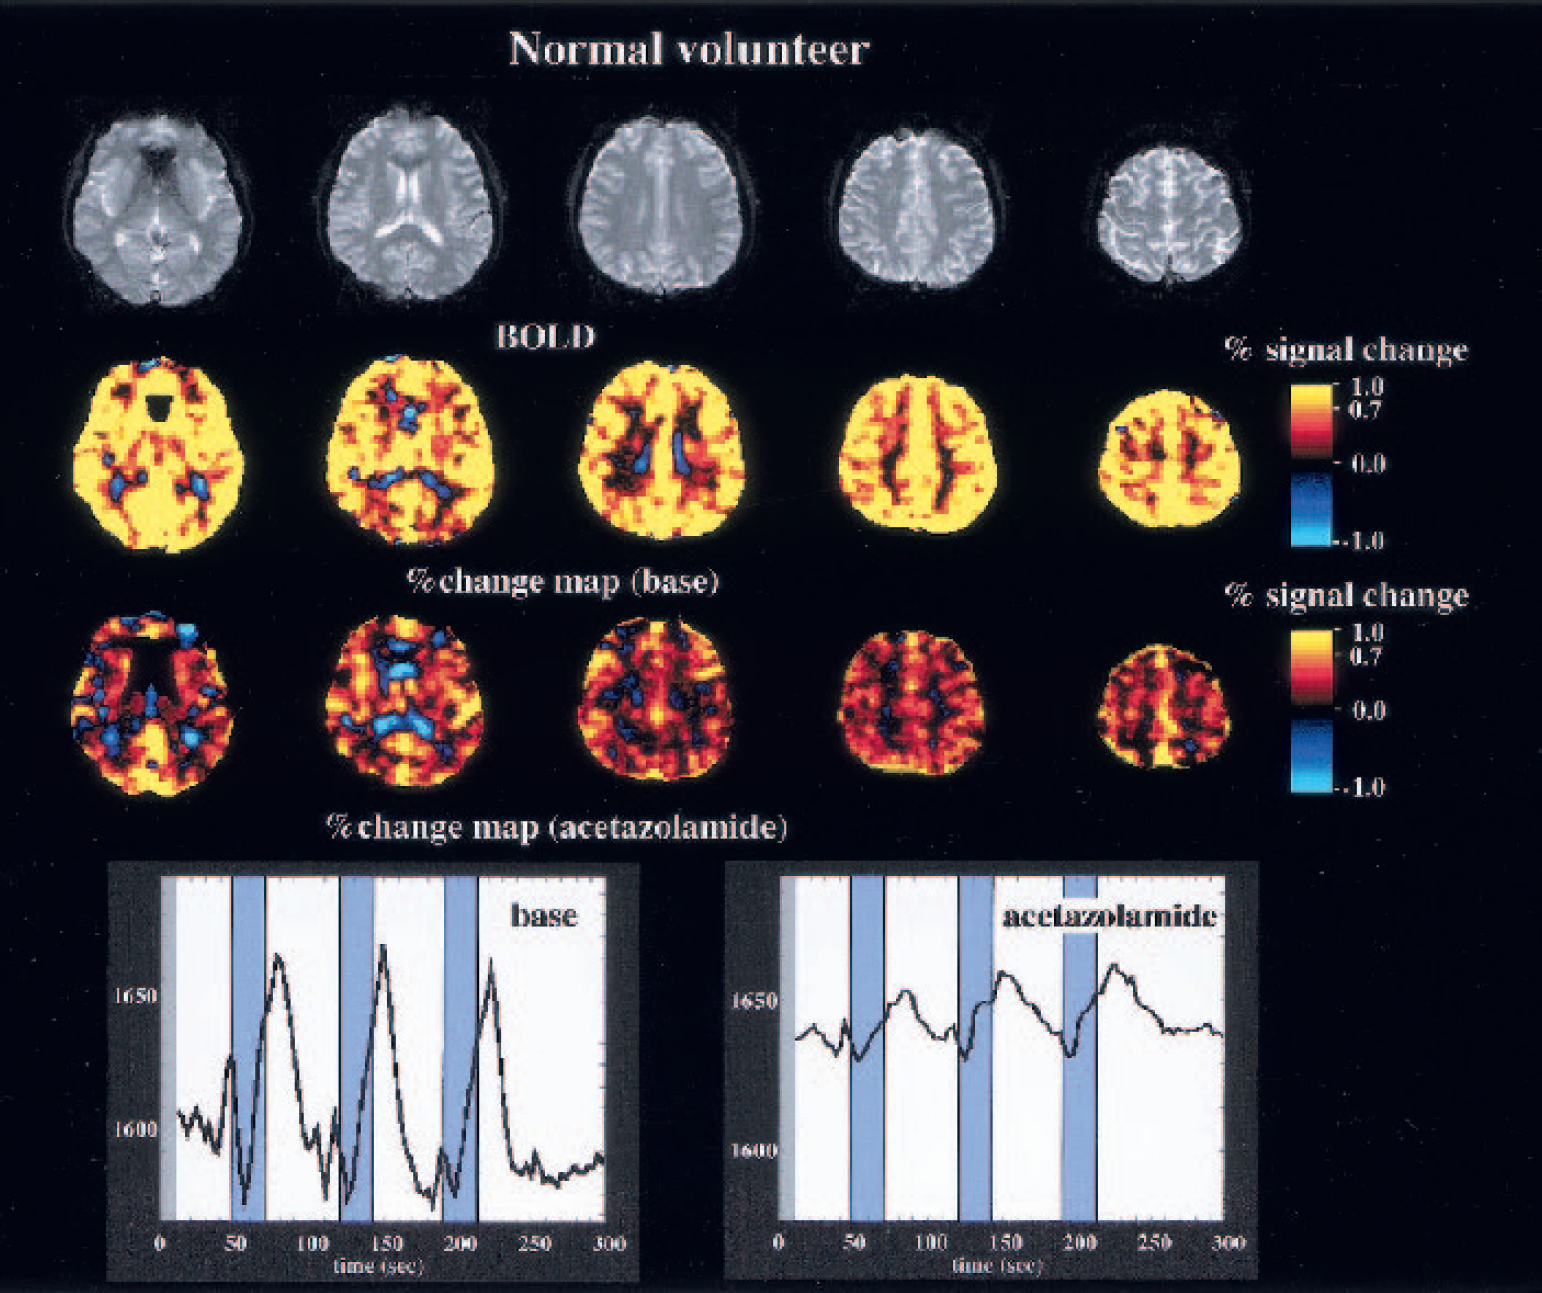
Representative maps of percent change and time-intensity curve obtained from the middle cerebral artery territory bilaterally before and 15 minutes after acetazolamide administration in a healthy subject. Acetazolamide administration suppresses mean percent increase in the blood oxygenation level-dependent (BOLD) signal by 76%. The time-intensity curve shows a higher baseline and remnant response of the cerebral vessels to breath holding.
Changes in the BOLD signal in patients with cerebrovascular disease
The results from the 10 patients with cerebrovascular disease are summarized in Table 2. The mean percent change was calculated for each area, a total of 100 ROIs in the 10 patients. In these 100 ROIs, the percent change in 19 areas in the gray matter and 10 areas in the white matter was more than 2 SD lower compared with those in healthy subjects. In these 29 areas, the values were negative at 8 ROIs in gray matter and at 8 ROIs in white matter, all of which represented the expected areas of pathophysiology.
Summary and percent change in the blood oxygenation level-dependent signal in patients with occlusive cerebrovascular disease
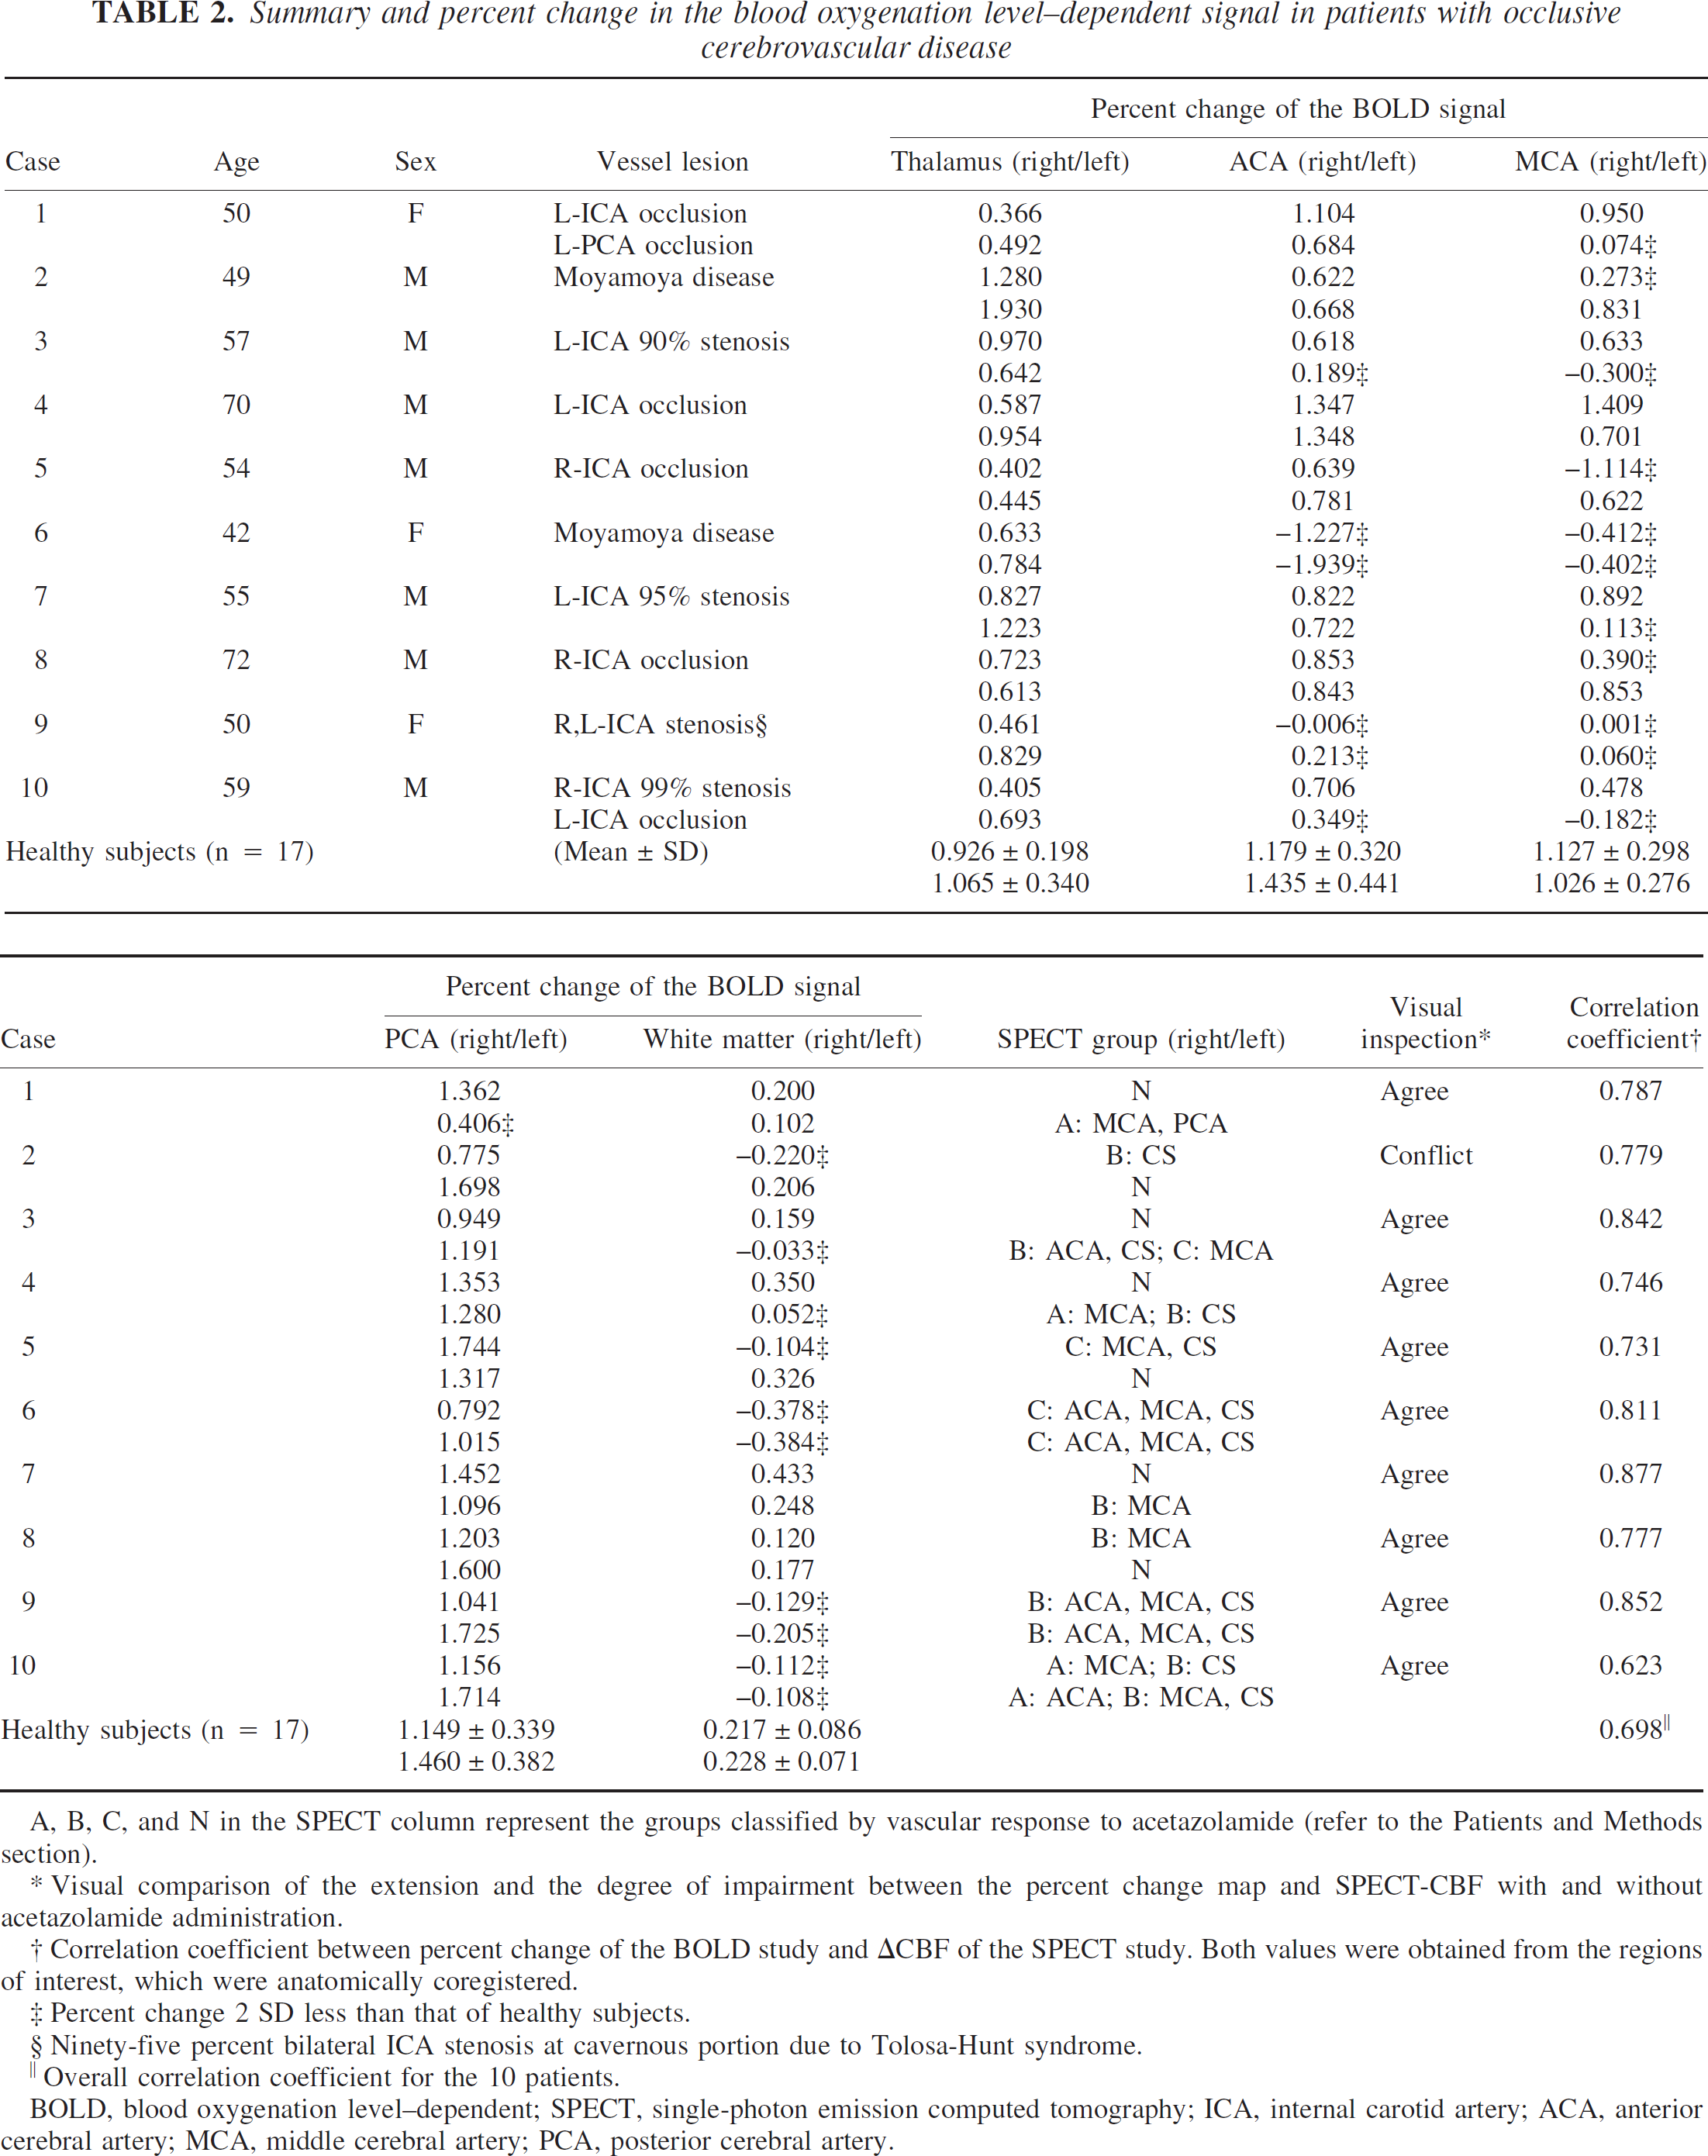
A, B, C, and N in the SPECT column represent the groups classified by vascular response to acetazolamide (refer to the Patients and Methods section).
Visual comparison of the extension and the degree of impairment between the percent change map and SPECT-CBF with and without acetazolamide administration.
Correlation coefficient between percent change of the BOLD study and ΔCBF of the SPECT study. Both values were obtained from the regions of interest, which were anatomically coregistered.
Percent change 2 SD less than that of healthy subjects.
Ninety-five percent bilateral ICA stenosis at cavernous portion due to Tolosa-Hunt syndrome.
Overall correlation coefficient for the 10 patients.
BOLD, blood oxygenation level-dependent; SPECT, single-photon emission computed tomography; ICA, internal carotid artery; ACA, anterior cerebral artery; MCA, middle cerebral artery; PCA, posterior cerebral artery.
Gray matter ROIs were classified into groups A (n = 5), B (n = 8), and C (n = 6) based on the results of the SPECT study. The percent change in three of the five areas in group A and all areas in group B was more than 2 SD lower compared with healthy subjects. In two of the eight areas in group B and all six areas classified as C, the percent change was negative. White matter ROIs also were classified into groups A (n = 0), B (n= 7), and C (n = 3) based on the results from the SPECT study. The percent change in all these ROIs was more than 2 SD below corresponding ROIs in healthy subjects. The percent change in the white matter in six of the seven areas in group B and all three areas in group C was negative. In the affected areas, the white matter tended to be more likely to be negative than the gray matter. There was a significant difference in the percent change between groups A, B, C, and N by one-way analysis of variance (Kruskal-Wallis) test (P < 0.0001). A significant difference was observed between all pairs of groups except between groups A and B by Fisher's post hoc test. The correlation coefficient for the results of BOLD and SPECT studies was highly significant in each patient, and the overall correlation coefficient for the 10 patients was 0.698 (Table 2, Fig. 5).
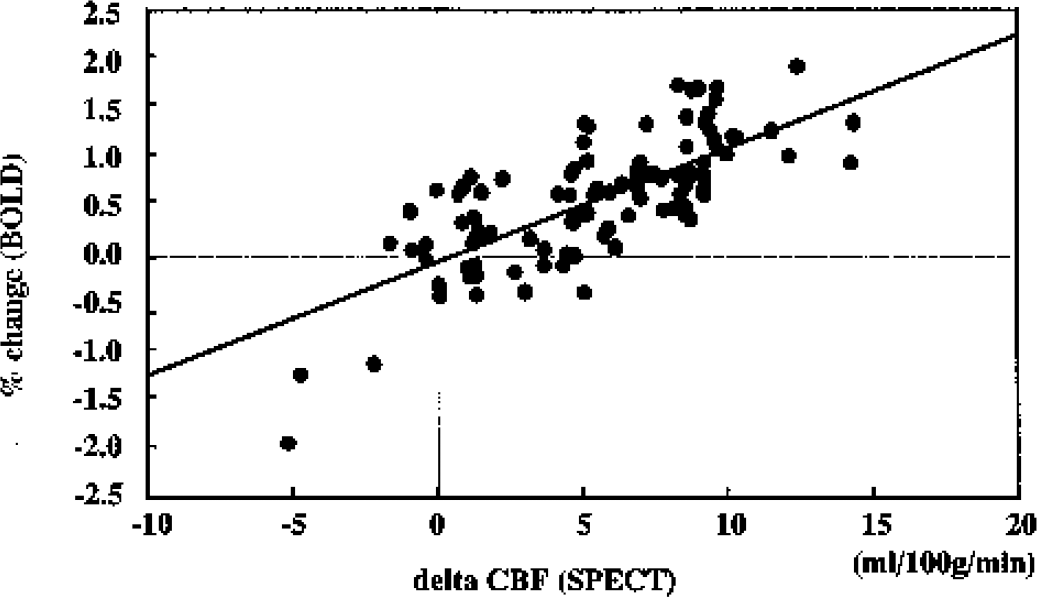
Scatter plot of the mean percent change of blood oxygenation level-dependent (BOLD) signal versus ΔCBF obtained from single-photon emission computed tomography with and without the acetazolamide challenge test. Data are obtained from a total of 100 areas in 10 patients. There was a direct linear correlation with r = 0.698, P < 0.0001.
Effect of acetazolamide administration on the percent change in the blood oxygenation level-dependent signal (n = 6)
BOLD, blood oxygenation level-dependent; ACZ, acetazolamide; ACA, anterior cerebral artery; MCA, middle cerebral artery; PCA, posterior cerebral artery.
The location and the distribution of impaired areas in the BOLD study agreed with the results of the SPECT study in 9 of 10 patients by visual inspection. The concordance between the two radiologists was complete (Cohen's κ = 1.0). The one case in which visual inspection between the two studies was not in agreement (Case 2) showed a markedly decreased response in the right MCA in the BOLD study, but only a mild impairment in the SPECT. As a result, the sensitivity and the specificity of the BOLD study were 100% and 98.4%, respectively. Representative cases are shown in Figs. 6 to 9.

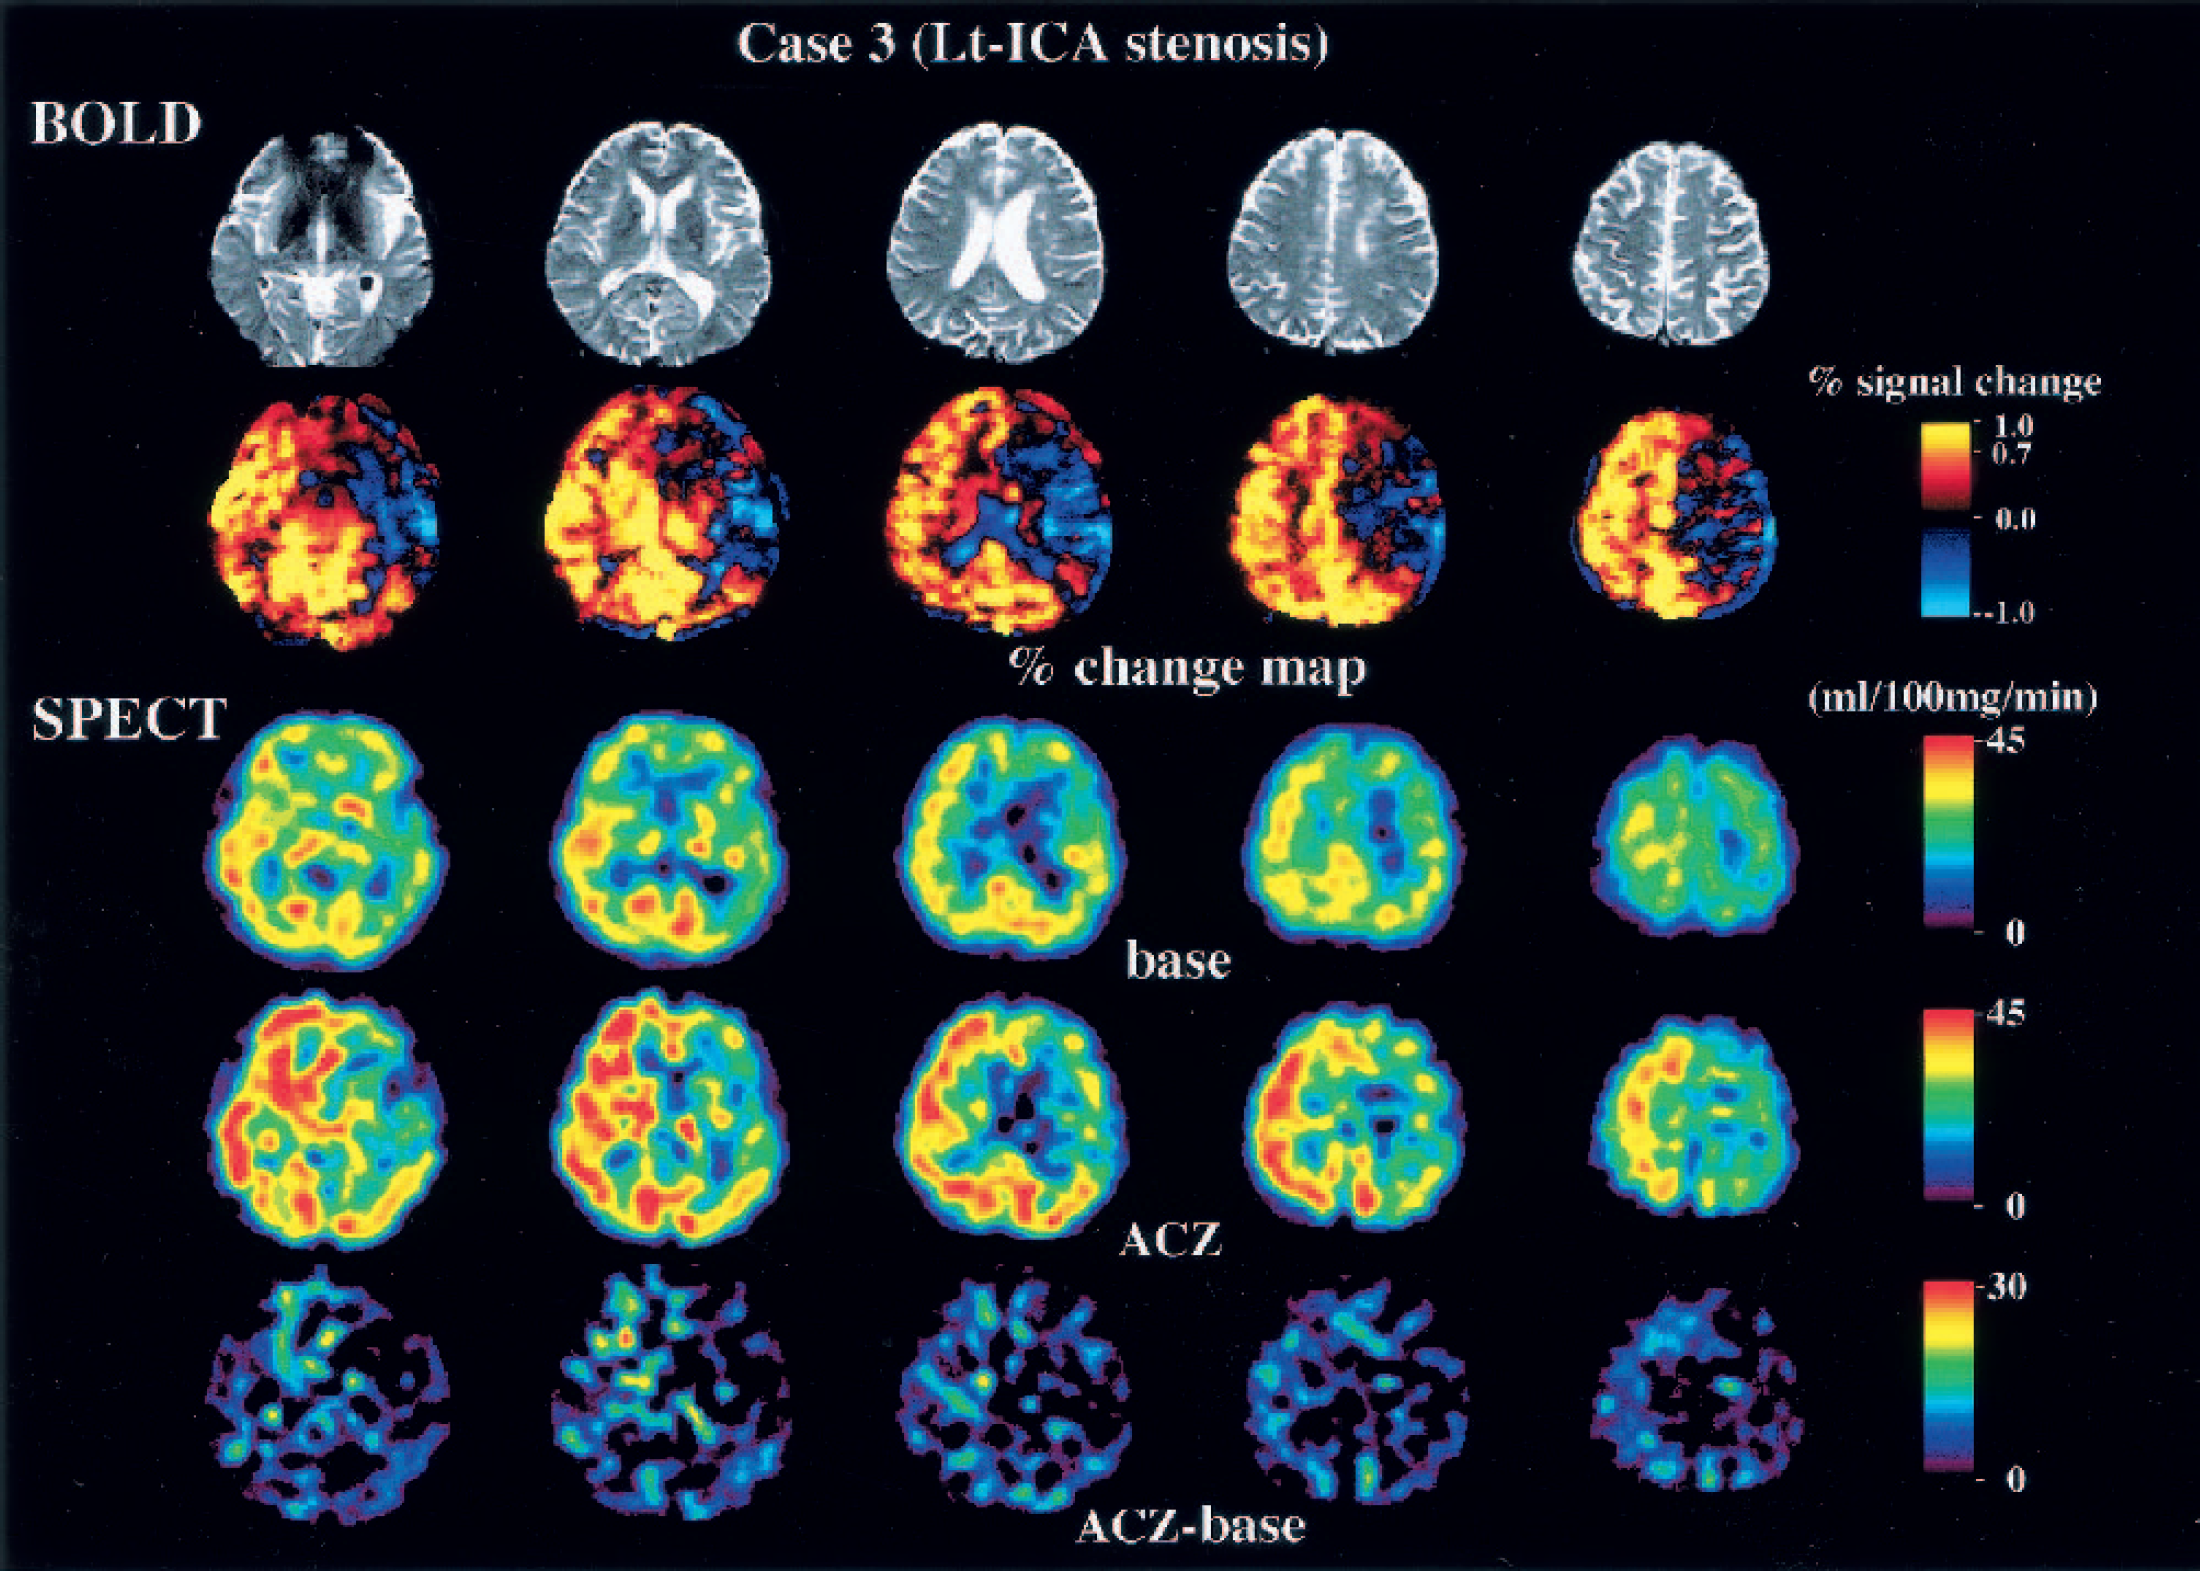
Blood oxygenation level-dependent (BOLD) and single-photon emission computed tomography (SPECT) images of a patient with left internal carotid artery (Lt-ICA) stenosis. The echo planar images show slight atrophy of the left hemisphere. The percent change map, however, indicates that the reserve capacity in the left middle cerebral artery (MCA) territory is severely compromised. SPECT-CBF map shows poor capacity in the left MCA territory, corresponding to the results of the BOLD study. The results of the ‡CBF map (acetazolamide [ACZ] base) are ambiguous compared with the percent change map. This patient underwent extracranial-intracranial bypass surgery.
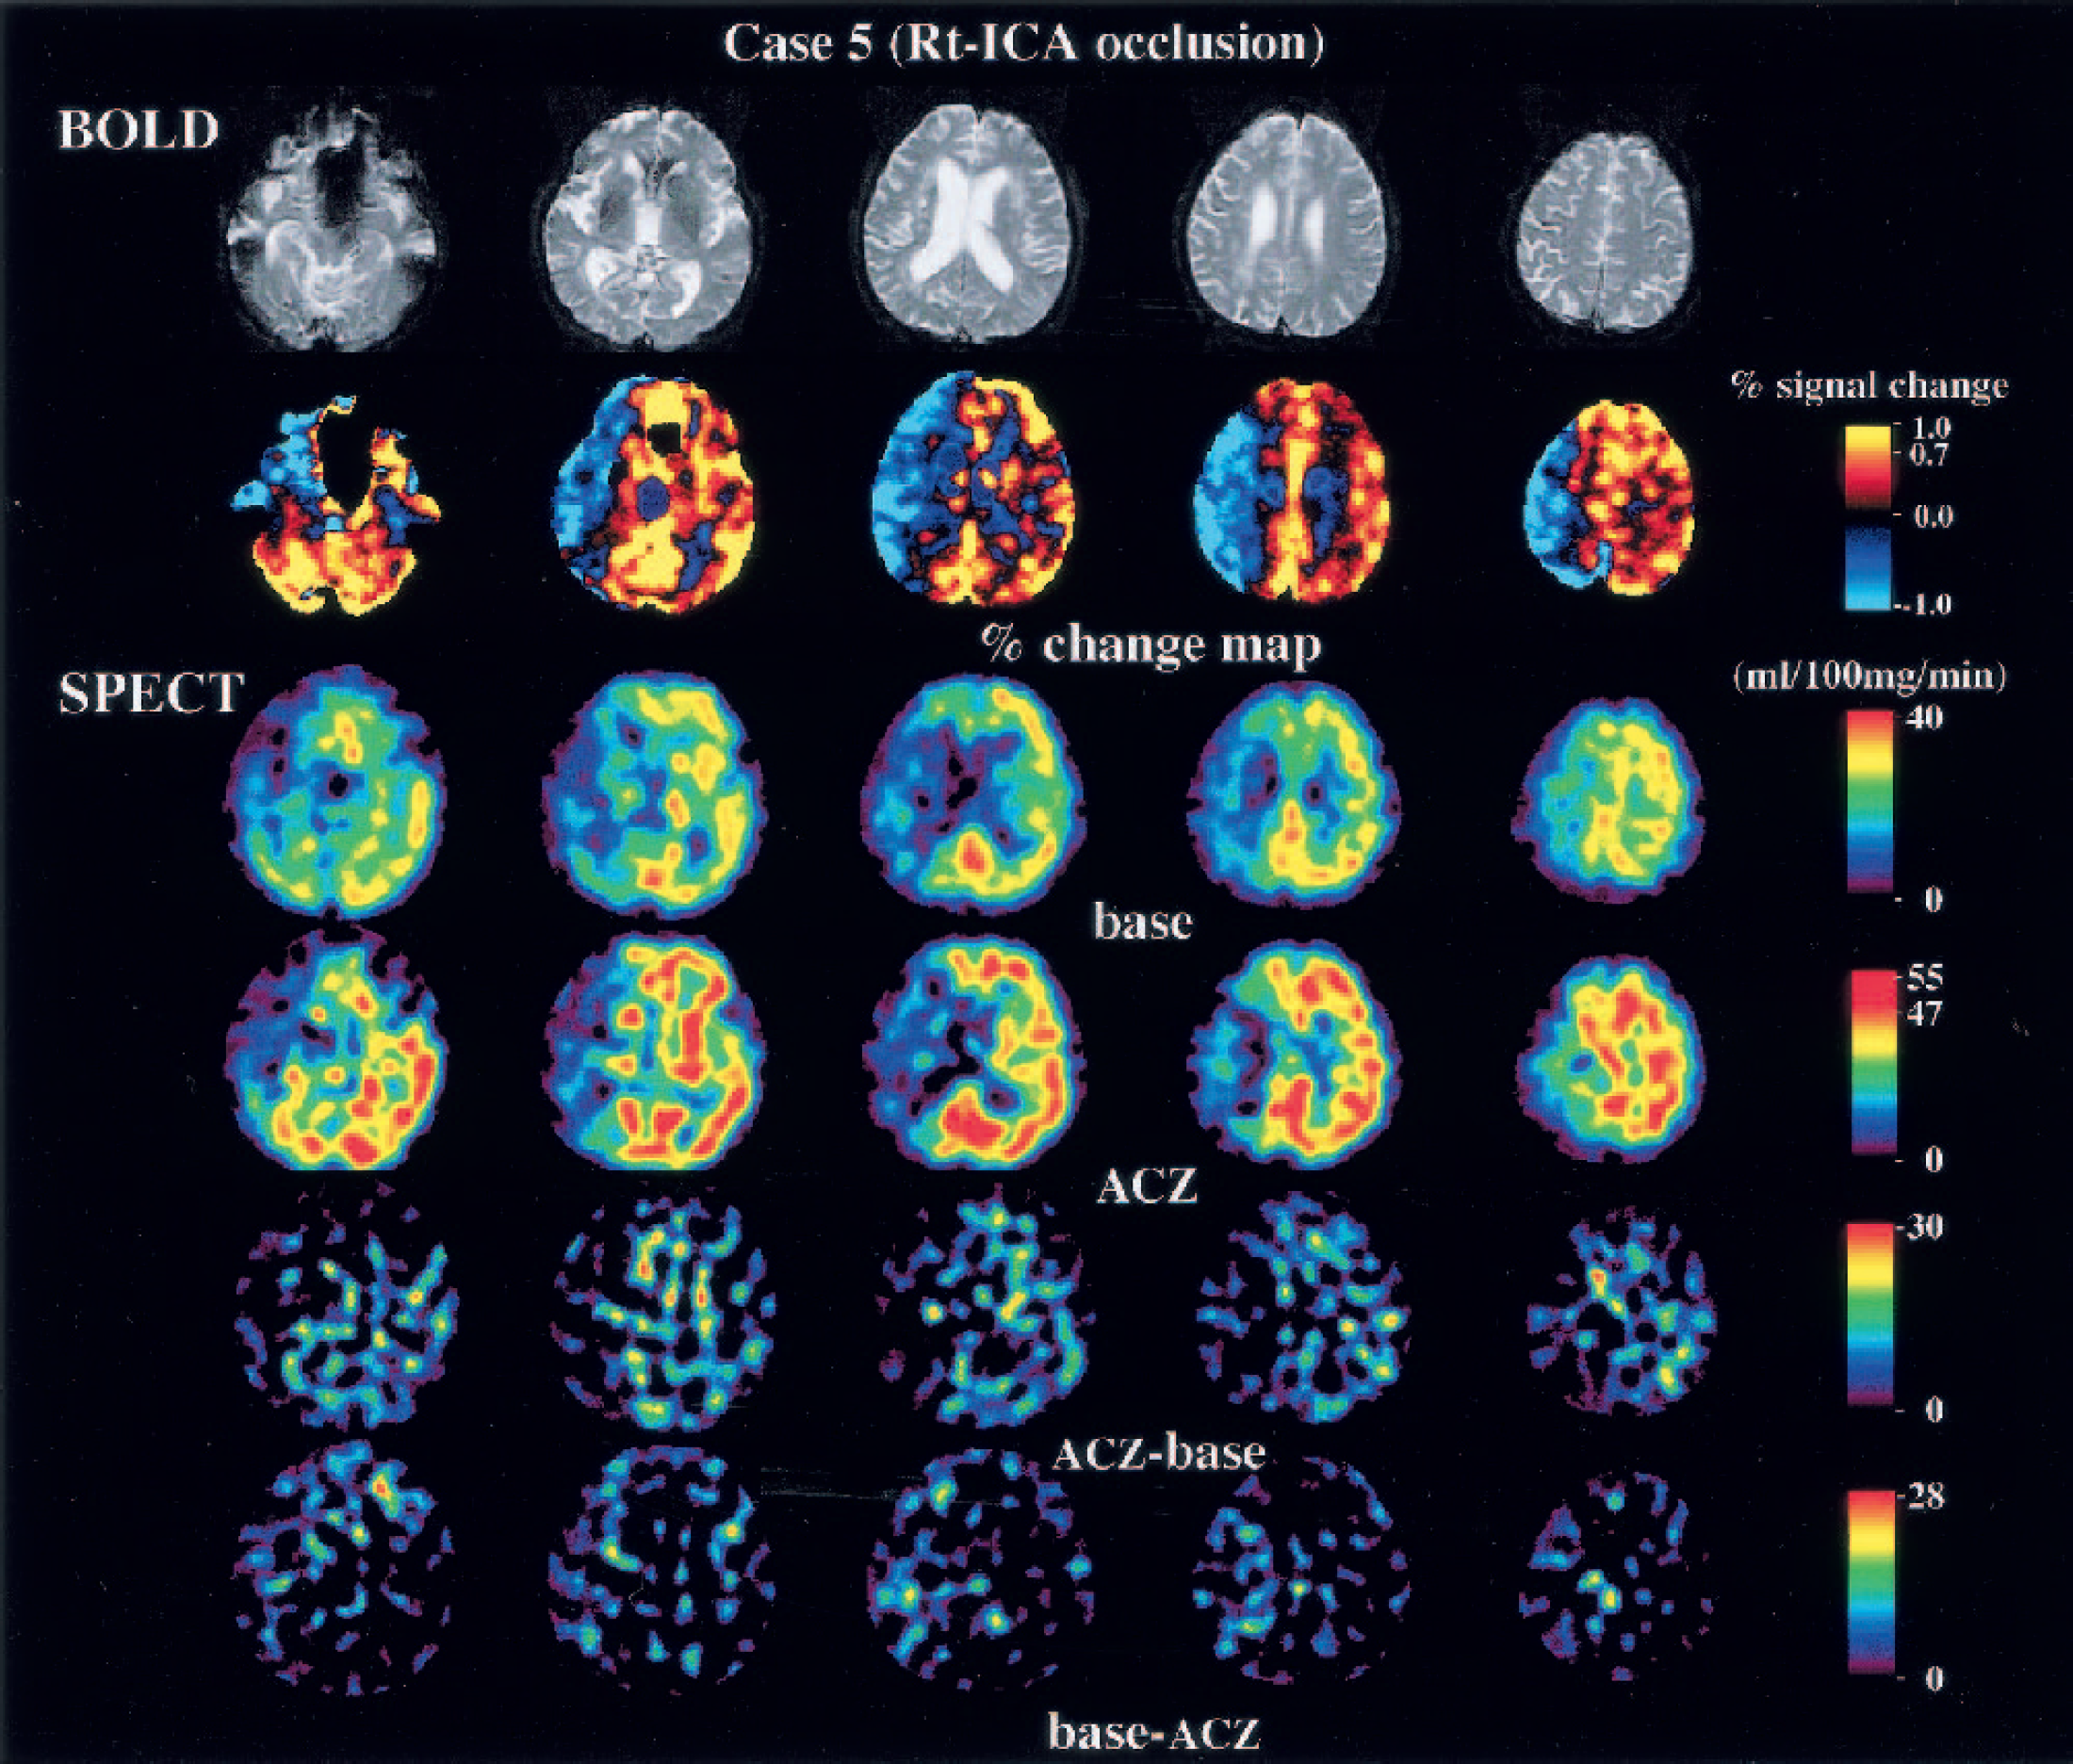
Blood oxygenation level-dependent (BOLD) and single-photon emission computed tomography (SPECT) images of a patient with right internal carotid artery (Rt-ICA) stenosis. The echo planar images show slight atrophy of the right hemisphere. Percent change map indicates a “steal” phenomenon in the right middle cerebral artery (MCA) territory. The SPECT-CBF map shows poor capacity and a steal phenomenon in the left MCA territory that is exactly the same as the result of the BOLD study. The results of the ΔCBF map (acetazolamide [ACZ] base) are ambiguous compared with the percent change map. This patient underwent extracranial-intracranial bypass surgery.
Blood oxygenation level-dependent (BOLD) and single-photon emission computed tomography (SPECT) images of a patient with left internal carotid artery (Lt-ICA) stenosis. Echo planar images show no apparent change in the brain. Percent change map indicates slight impairment of reserve capacity in the left MCA territory. The SPECT-CBF map shows mildly impaired capacity, which is exactly the same as the result of the BOLD study. The results of the ΔCBF map (acetazolamide [ACZ] base) are ambiguous compared with the percent change map. This patient has been maintained with antiplatelet therapy.
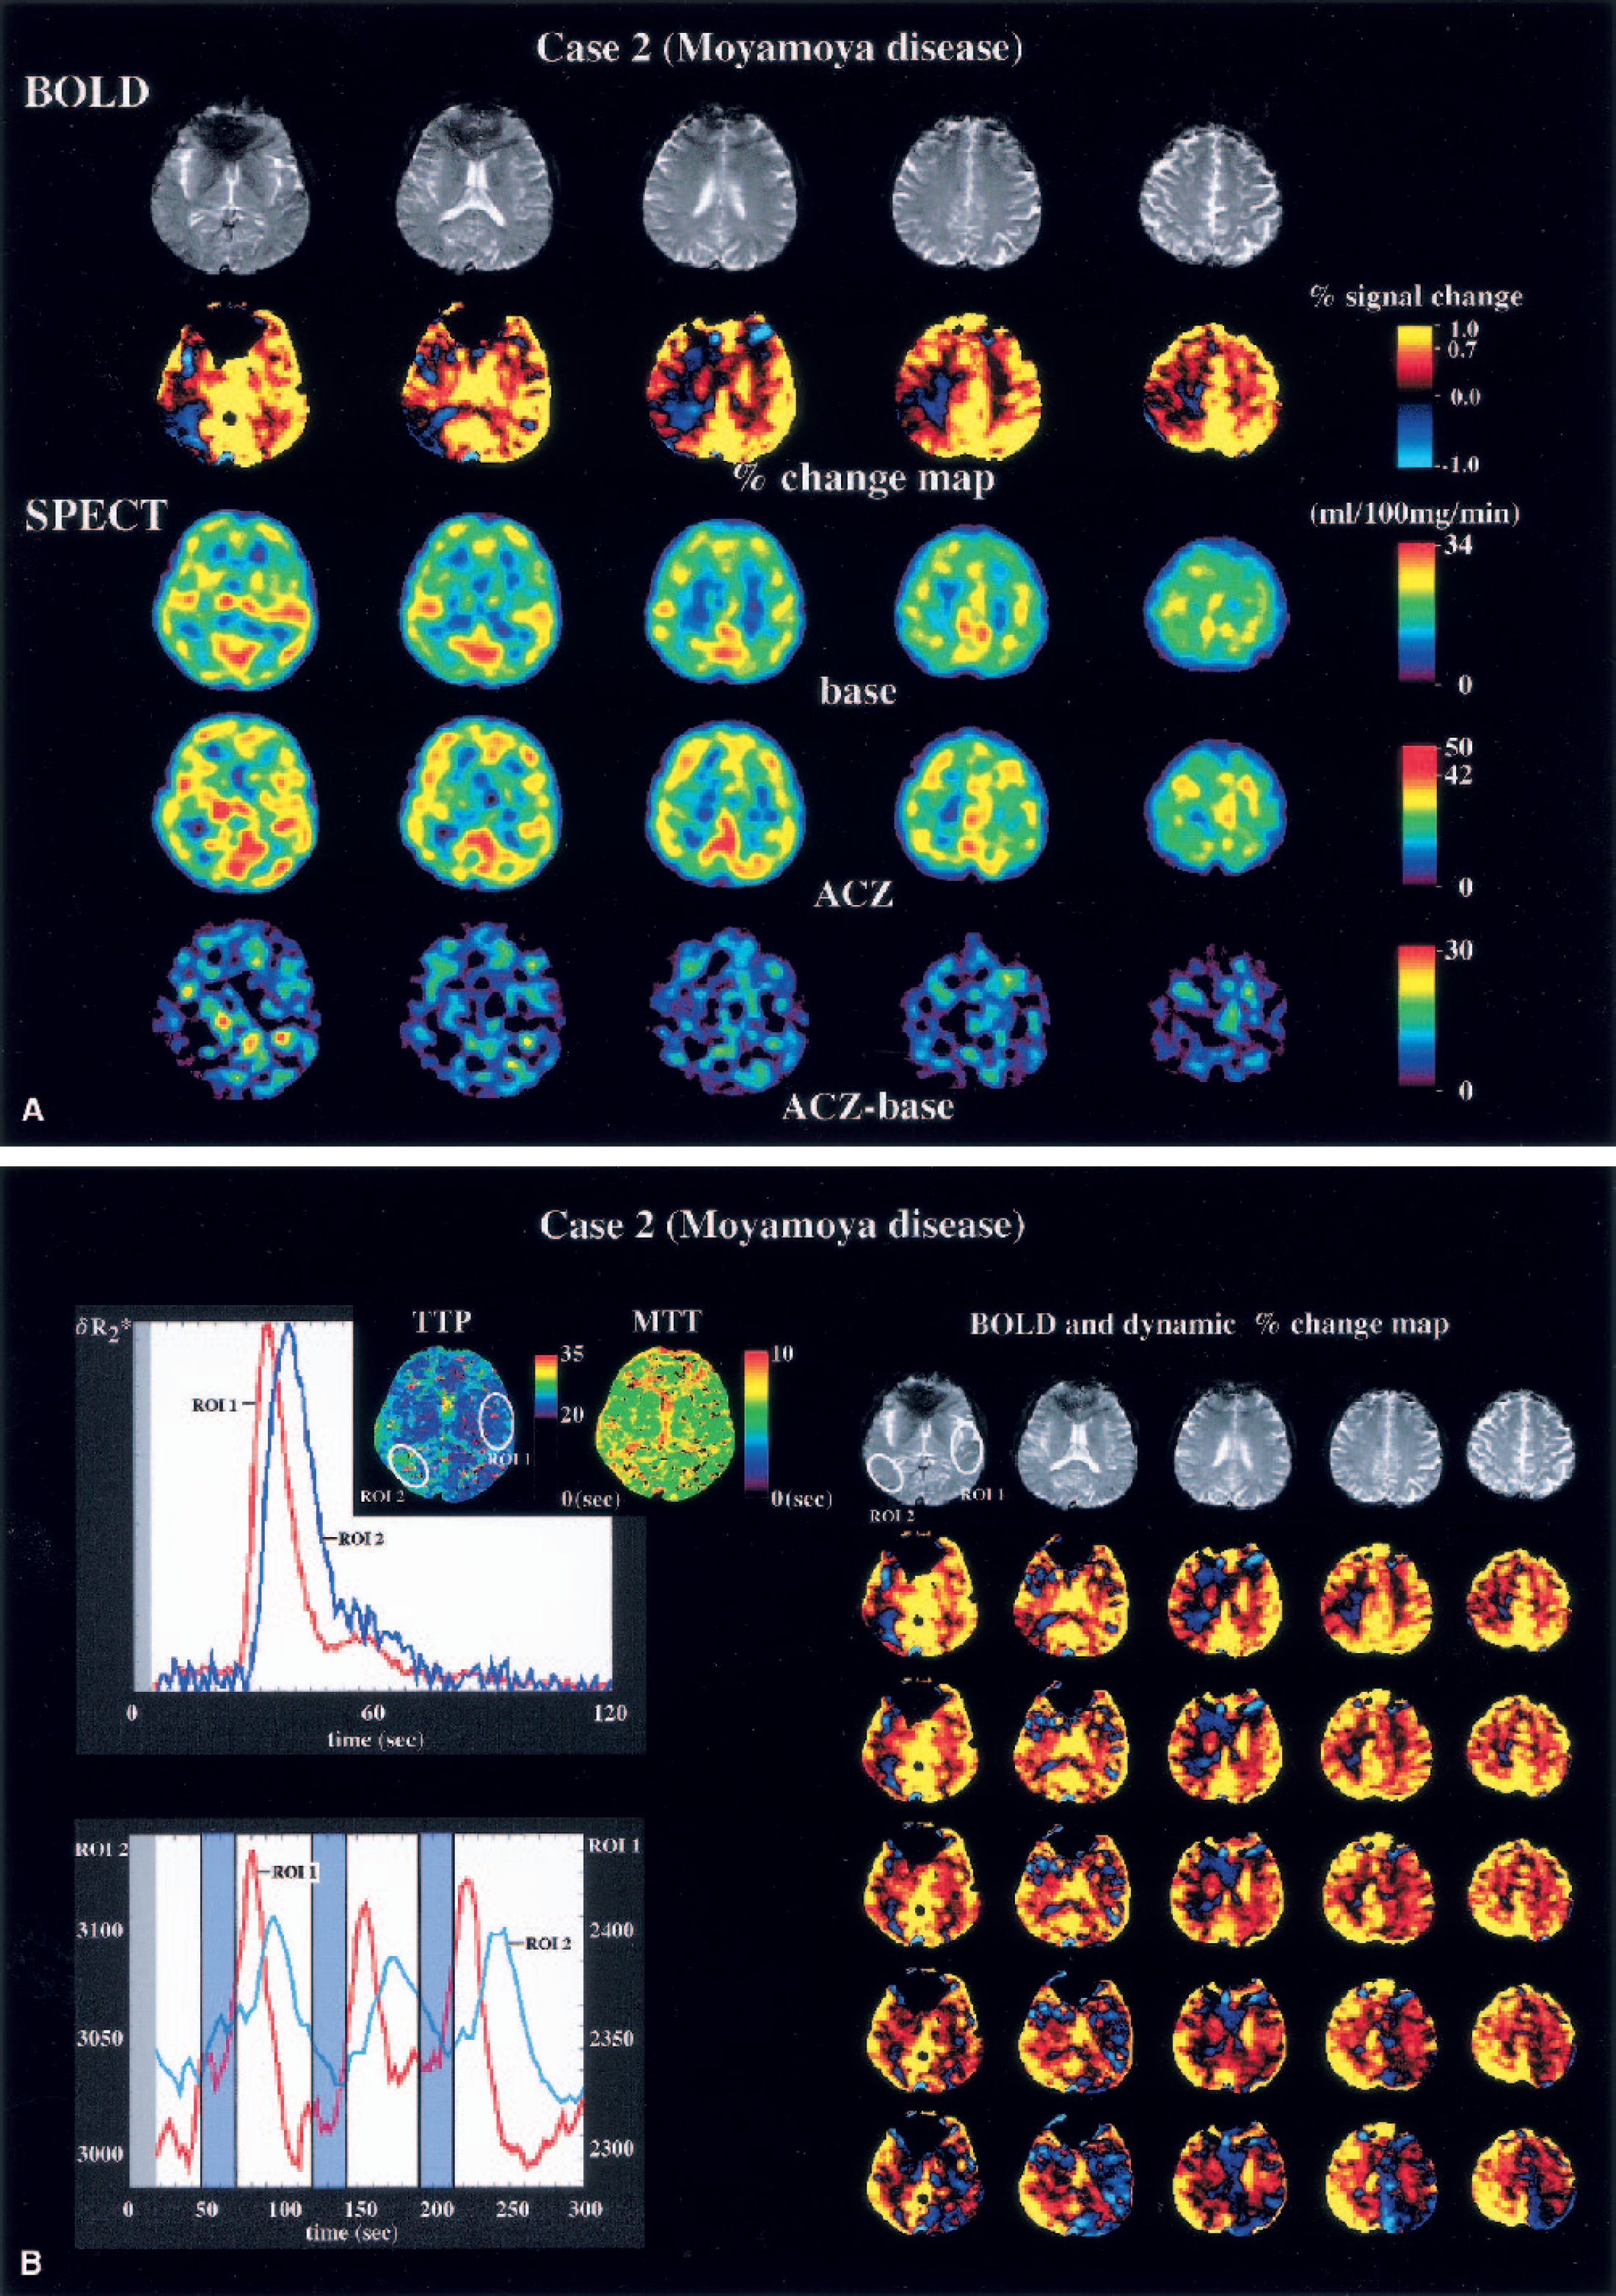
(A) Blood oxygenation level-dependent (BOLD) and single-photon emission computed tomography (SPECT) images of a patient with bilateral internal carotid artery stenosis (moyamoya disease). Echo planar images show no apparent change in the brain. Percent change map indicates slight impairment of reserve capacity in the right temporoparietal area and the centrum semiovale. The assessment of the radiologists was that the reserve capacity was not impaired. ACZ, acetazolamide.
DISCUSSION
The present study showed that the percent change map, which was constructed by calculating the mean relative change in the BOLD signal on a pixel-by-pixel basis, correlated well with the results of 123I-iodoamphetamine-SPECT with acetazolamide challenge, possessing both high sensitivity and specificity on visual interpretation. Furthermore, the ΔCBF correlated with mean percent change of the BOLD signal. Although the number of the subjects was small, the present study clearly demonstrated the feasibility of estimating the cerebral perfusion reserve capacity using conventional MRI under physiologic and pathologic conditions. The one instance in which the visual interpretation of BOLD and SPECT images differed was in a patient with adult-type moyamoya disease (Case 2, stage 2 on the right side and stage 3 on the left side). Both neuroradiologists had the impression that the reserve capacity was severely impaired in the right temporoparietal region on the percent change map, but that impairment was very mild on the SPECT with acetazolamide challenge test. Further examination provided additional insight into the pathophysiology in this case. Digital subtraction angiography showed collateral circulation from the posterior cerebral artery in the right temporoparietal region, and the flow of contrast medium to this region was slower than to other regions. An MR perfusion study with bolus injection of gadodiamide clearly showed the delay in the time-to-peak in this region, suggesting that oxyhemoglobin was supplied via collateral circulation (Fig. 9B). Looking at the time-intensity curve in this ROI, it was obvious that the peak of the BOLD signal was delayed relative to the other areas, and this underestimated the percent change (Fig. 9B). A similar delay in the BOLD peak has been observed in hypoperfused areas in a focal ischemia model in the rat (Harris et al., 2001). The dynamic map of the percent change calculated with the shift in the template may help to avoid misleading interpretations resulting from any focal delay in the BOLD signal change (Fig. 9B).
Because the BOLD signal change is not linearly dependent on ΔCBF, quantitative analysis of the BOLD effect with respect to cerebrovascular reserve is a complex and somewhat time-consuming task. The BOLD signal is strongly affected by the venous deoxyhemoglobin concentration and the tissue blood volume, as well as by other minor factors that cause magnetic heterogeneity such as the tissue hematocrit (Lin et al., 1998a, b) and the anatomy of microvessels (Lin et al., 1997). The blood pH reduction also affects the BOLD signal because it changes the hemoglobin-oxygen affinity, the so-called Bohr effect (Bohr et al., 1904).
Venous deoxyhemoglobin concentration is determined by the relation between oxygen delivery, hemoglobin concentration, and oxygen consumption. The contribution of the arterial hemoglobin saturation to the BOLD signal seemed small in the present study because arterial blood entering the brain was nearly fully saturated throughout each experiment and the sigmoid O2-hemoglobin dissociation curve is flat at this point. It is reported that CMRo2 is unaffected by mild or moderate hypercapnia at a Paco2 ranging from 51 to 80 mm Hg in animals (Artru et al., 1980) and from 40 to 50 mm Hg in humans (Cohen et al., 1964). There are no specific data on breath holding, however. In the present study, the 24-second breath holding induced an increase in the Paco2 of up to 49.7 mm Hg, which is the equivalent of mild hypercapnia. Thus, it seems reasonable to assume that the effect of the breath holding on the CMRo2 was negligible.
Hypercapnia induces the augmentation of both CBF and CBV, which inversely affects the BOLD signal (Ogawa et al., 1993). The effects of the changes in the CBV on the BOLD signal, however, are unclear. Lin et al. (1999) observed a linear relation between regional CBV and CO2 tension in both arterial and jugular venous blood in pentobarbital-anesthetized rats. They also found a linear relation between the relative change in R2* and the oxygen saturation of cerebral venous blood, when a correction for ΔCBV was incorporated into the data analysis. On the other hand, Keyeux et al. (1995) reported that the extraparenchymal blood volume increased by 44%, whereas the increment in the intraparenchymal blood volume was negligible under moderate hypercapnia (5% CO2, 51 to 61 mm Hg). Silva et al. (1999) showed that a direct correlation exists between BOLD and CBF changes in rats. Davis et al. (1998) showed that the relative R2* change is linearly dependent on the blood volume fraction, whereas the blood deoxyhemoglobin concentration has a supralinear effect on the relative R2* change (β = 1.5 obtained from their Monte Carlo simulation). These facts indicate that the change in the BOLD signal is most strongly influenced by the ΔCBF, but it is also affected by CBV changes to some extent. In the present study, the percent BOLD change was much higher in the cortex and thalamus than in the white matter. This finding is at odds with a PET study that found only small regional differences in the percent CBF change between the cerebral cortex and centrum semiovale in the human brain (Ito et al., 2000). The basal CBF is two or three times higher in the gray than white matter, and this regional difference seems to be the source of this discrepancy. The relative change in the BOLD signal depends mainly on the absolute value of ΔCBF, whereas in PET, the percent change in CBF is calculated as (ΔCBF)/(basal CBF); thus the percent ΔCBF is an inverse function of the absolute value of the basal CBF. Because the change in the BOLD signal is derived primarily from the change in the deoxyhemoglobin concentration, regional differences in blood vessel density, especially the veins, affect the percent change in BOLD signal. A gray-to-white CBV ratio of 2:1 has been reported (Greenberg et al., 1978), and may be even greater at the cortical surface with its high density of pial vessels. These factors would account for the large regional differences in the BOLD signal.
The percent change map showed clear anatomic information and was more impressive than the ΔCBF map generated by SPECT. Quality may have been compromised because single-day, split-dose 123I-iodoamphetamine-SPECT was used, which can lower tracer activity and result in an error due to a heterogeneous washout pattern of radioisotope (Moretti et al., 1995). In contrast, the relative change in the BOLD signal can be detected readily and measured accurately using statistical analysis, as is done in functional MRI. This may account for the higher detection rate of the negative response with BOLD compared with SPECT. In the present study, eight locations in the cerebral cortex in five patients showed a negative change in the BOLD signal. Six of the eight locations showed negative cerebrovascular reserve and the remaining two locations showed no response to acetazolamide on the SPECT study. The values of the percent change of these 2 locations (right ACA in case 9 and left MCA in case 10) were higher than those of the other 6 locations.
The BOLD study found a negative response in the centrum semiovale. This inverse response in white matter was observed in a patient in whom the ipsilateral reserve capacity of the cortex was found to be moderately impaired on the SPECT study. This result is consistent with the fact that the centrum semiovale is susceptible to ischemia in patients with severe internal carotid artery disease (Yamauchi et al., 1991; Weiller et al., 1991; Krapf et al., 1998), because the supraventricular white matter is a watershed area between the superficial territories of the ACA and the MCA. Krapf et al. (1998) reported an association between infarction in the centrum semiovale and hypoperfusion in the ipsilateral hemisphere secondary to severe occlusion of the internal carotid artery. Thus, BOLD-MRI may make it easier to detect the steal phenomenon, which is found to be predictive of an increased risk of stroke as well as an increased oxygen extraction (Nariai et al., 1995; Widder et al., 1994).
In this study, the BOLD signal increased in a biphasic manner. The first phase occurred during breath holding; CO2 accumulation led to an increase in CBF, which was relatively greater than the increase in the deoxyhemoglobin. The second phase was a rapid increase in the BOLD signal immediately after resumption of breathing, as flow of highly oxygenated blood increases through dilated cerebral vessels. Because CO2 levels in arterial blood rose over the course of breath holding (24 seconds), and the hemodynamic response to changes in Paco2 was on the order of a few seconds, there was some delay before the BOLD signal rose and reached its peak. This delay may cause an error in the percent signal change if it is calculated simply by subtracting the mean signal intensity during normal breathing from that during breath holding. Thus, we first calculated the correlation coefficient using a sine wave template to determine the actual “activated” and “rest” stages in sequential BOLD signals. For this, the phase of the template was shifted in 15° increments until the highest correlation coefficient value was obtained, after which we calculated the percent change in the BOLD signal on a pixel-by-pixel basis.
We adopted breath holding to activate the vascular response based on the report of Kastrup et al. (1998), who showed the usefulness of breath holding as a hypercapnic challenge test. The advantage of breath holding is that it does not require any special equipment, and it can be stopped whenever the patient wishes. The major drawback is that it requires patient cooperation and may vary from person to person. The interindividual variation in CO2 accumulation may not be trivial, and this is one serious impediment to the quantitative assessment. This value can be normalized by using the ΔPaco2. Simultaneous measurements of both Paco2 and BOLD weighted-MR, however, require complicated manipulations and undermine the benefit of breath holding, and the Paco2 concentration at the end of breath holding does not represent the integrated Paco2, which may increase at different rates in different individuals. Moreover, the relation between CBF dynamics and physical parameters contributing to the T2* is a complicated one, and the BOLD signal does not change linearly with the ΔCBF. Thus, it would be cavalier to equate the breath holding-induced percent change and ΔCBF blindly. A correlation was in fact found, however, between the percent change and the ΔCBF (Table 2). Therefore, we believe that BOLD-MRI is appropriate for use in patients with cerebrovascular disease as long as they are sufficiently cooperative to comply with the procedure.
We modified the study protocol published by Kastrup et al. (1998) in two ways. First, we administered oxygen during the examination, which enhanced the BOLD signal increase at the start of breathing after breath holding. The net effect of this increase on the BOLD signal is to enhance the signal-to-noise ratio. The reproducibility of the percent change in the BOLD signal was low before oxygen inhalation, and most of the subjects felt better when inhaling oxygen. Second, it is important to provide an adequate interval between periods of breath holding to avoid overlapping the effects of breath holding. Patients whose perfusion was compromised experienced a delay in the arrival of the peak BOLD signal. If the interval between breath holding is not long enough, the effects of the next cycle of breath holding may interfere with the BOLD signal of the preceding breath-holding. In addition to a phase shift of the template during postprocessing, we regard O2 inhalation and adequacy of intervals between the breath holding as the keys for an accurate and reliable evaluation of cerebrovascular reserve capacity by the BOLD technique.
Administration of 1 g of acetazolamide did not completely suppress breath holding-induced augmentation of the BOLD signal. Although the physiologic effects of acetazolamide and breath holding on the cerebral vessels are not exactly equivalent, breath holding may be at least as potent a vasodilator of the cerebral vessels as acetazolamide. One might expect that voluntary breath holding would induce only a small increase in the Paco2. The mean ΔPaco2, however, was higher than that induced by inhalation of 7% CO2 (Ito et al., 2000). One more potentially confounding variable should be considered. We instructed the subjects, to avoid changing the cerebral venous pressure, not to perform Valsalva's maneuver. Although it has been reported that CO2 inhalation increases the mean arterial pressure and thus the cerebrovascular reserve (Hetzel et al., 1999), we did not observe a change in blood pressure during or after breath holding in either the healthy subjects or the patients. Moreover, the augmentation of the BOLD signal disappeared when the dose of acetazolamide was increased to 1.5 g (data not shown). Thus, the residual increment of the BOLD signal after administration of acetazolamide seems to be derived from CBF augmentation induced by the breath holding. Graham et al. (1994) had observed that 30 mg of acetazolamide induced a larger R2* change than 20% CO2 inhalation in halothane-anesthetized rats. This result does not contradict our findings. Because the dosage of both agents exceeded the usual clinical dose, we can assume that the cerebral vessels were nearly maximally dilated, and that the increment in venous blood volume that reduced BOLD signal intensity should be higher with 20% CO2 than 30 mg of acetazolamide. These facts suggest that the breath holding performed in this study has sufficient potential to induce a vascular response adequate for investigating regional cerebrovascular reserve capacity.
There are several limitations to the present study. As with functional MR studies, susceptibility artifact due to intravoxel phase dispersion causes signal defect and skew in the basal frontal and temporal lobes. Because breath holding requires the subject's cooperation, this method is not suitable for all patients. Additionally, the results obtained are affected by a variety of physical factors including CBV, the Bohr effect, and integration of CO2 accumulation in blood vessels, among others. Thus, quantitative analysis is exceedingly difficult based on the BOLD technique alone. This study does not establish whether the BOLD technique predicts cerebrovascular risk or not, and this important question requires further study. There was a clue, however, as to its validity among our cases. Although the percent BOLD change failed to distinguish slightly (group A) from moderately impaired reserve (group B), severely impaired areas (group C) can be identified clearly by this technique. Because all patients who had a “group C” area (Cases 3, 5, and 6) underwent bypass surgery, the actual stroke risk in these patients was unknown. The presence of the steal response, however, is believed to predict a high risk of stroke (Nariai et al., 1995; Yonas et al., 1993). Because all areas identified as group C by SPECT showed a negative value of the percent BOLD change, it can be deduced that an area showing a negative BOLD response is hemodynamically distressed. The other seven patients had no ischemic attack during a follow-up over 1 year. Only a very few techniques, such as PET oxygen extraction fraction and transcranial Doppler ultrasound with the CO2 test, predict stroke risk, and none have proved useful for planning therapy. We determined the indications for extracranial-intracranial bypass surgery based on the criteria of an ongoing prospective study, the Japanese EC-IC Bypass Trial (JET Study Group, 2002), which approved the use of SPECT for quantitative CBF measurement. Although a larger study is needed to obtain unequivocal evidence of the utility of BOLD examination, once its validity is established, this technique would likely find broad clinical use because it is less invasive and easier to perform than SPECT.
In conclusion, BOLD-MRI as described in this article provides a unique way to assess the hemodynamic state of the brain with better spatial resolution than existing methods that use radioactive tracers. Although our data are preliminary, this technique suggests that tissue at risk of infarction can be detected by an MR-based breath-holding challenge.