
Abstract
Interpretation of functional metabolic brain images requires understanding of metabolic shifts in working brain. Because the disproportionately higher uptake of glucose compared with oxygen (“aerobic glycolysis”) during sensory stimulation is not fully explained by changes in levels of lactate or glycogen, metabolic labeling by [6-14C]glucose was used to evaluate utilization of glucose during brief brain activation. Increased labeling of tricarboxylic acid cycle–derived amino acids, mainly glutamate but also γ-aminobutyric acid, reflects a rise in oxidative metabolism during aerobic glycolysis. The size of the glutamate, lactate, alanine, and aspartate pools changed during stimulation. Brain lactate was derived from blood-borne glucose and its specific activity was twice that of alanine, revealing pyruvate compartmentation. Glycogen labeling doubled during recovery compared with rest and activation; only 4% to 8% of the total 14C was recovered in lactate plus glycogen. Restoration of glycogen levels was slow, and diversion of glucose from oxidative pathways to restore its level could cause a prolonged reduction of the global O2/glucose uptake ratio. The rise in the brain glucose–oxygen uptake ratio during activation does not simply reflect an upward shift of glycolysis under aerobic conditions; instead, it involves altered fluxes into various (oxidative and biosynthetic) pathways with different time courses.
Energy-dependent processes are the basis for metabolic imaging of functional and cognitive activities of the brain, and recent imaging studies of working human brain have renewed interest in the bioenergetics of mental activity, neuronal signaling, and neuron-astrocyte interactions required for neurotransmission. Reexamination of the long-held concept of close stoichiometric coupling of oxidative metabolism of glucose and functional activity in brain was stimulated by reports of 30% to 50% increases in the rates of cerebral glucose utilization (CMRglc) and cerebral blood flow (CBF) with little or no change in oxygen consumption (CMRO2) during stimulation (Fox and Raichle, 1986; Fox et al., 1988; Madsen et al., 1995a). Because glucose consumed in excess of oxygen is generally assumed to be converted to lactate, this phenomenon is sometimes called “aerobic glycolysis.” The low glycolytic yield of ATP led Fox et al. (1988) to conclude that energy required by working brain is much less than that inferred from oxidative metabolism. This apparent failure of CMRO2 to rise during some but not all types or conditions of physiologic stimulation of normoxic subjects is unexpected and unexplained, and many issues related to glucose and lactate metabolism in working brain have been recently assessed in considerable detail (Attwell and Laughlin, 2001; Chih et al., 2001; Dienel and Hertz, 2001; Gjedde et al., 2002; Magistretti et al., 1999).
The brain clearly has the capacity to sustain large increases in CMRO2 in vivo with heightened energy demand under normal and abnormal conditions. For example, visual stimulation increases CMRO2 in humans (Hoge et al., 1999; Marrett et al., 1995; Vafaee et al., 1999). During seizures, CMRO2 rises 1.5 to 2-fold in humans, and in animals the CMRO2/CMRglc ratio falls at seizure onset and increases thereafter, with rapid (<1-minute), persistent (up to 2-hour), and large (60% to 270%) increases in CMRglc and CMRO2 (Siesjö, 1978). Enhanced lactate production and its rapid efflux to blood from activated brain (Cruz et al., 1999; Hawkins et al., 1973) can contribute to both aerobic glycolysis and discrepant metabolic images obtained with [14C]glucose and [14C]deoxyglucose (Ackermann and Lear, 1989; Adachi et al., 1995; Collins et al., 1987). Increased lactate levels in stimulated brain are registered by in vivo microdialysis (Fellows et al., 1993; Kuhr and Korf, 1988) and may arise from astrocyte (e.g., Magistretti et al., 1999) and neuronal (Gjedde and Marrett, 2001) metabolism, but this remains to be established. The biochemical basis for aerobic glycolysis is not understood, and shifts in utilization of glucose underlying a disproportionate rise in uptake or utilization of glucose compared with oxygen in working brain in vivo are not known.
To investigate metabolic changes during aerobic glycolysis, we developed an in vivo animal model in which a high glucose-oxygen uptake ratio was induced by generalized sensory stimulation of the conscious rat (Madsen et al., 1995b), and showed that the excess uptake of glucose was not fully explained by lactate and glycogen accumulation in brain or lactate efflux to blood (Madsen et al., 1999). The present study tested the hypothesis that channeling of [6-14C]glucose into major metabolic pathways changes during and after sensory stimulation, and reports increased labeling of products of the oxidative pathways, altered metabolite pool sizes, and metabolic compartmentation. Slow restoration of glycogen level, which is mainly localized in astrocytes (reviewed by Swanson, 1992), suggests that astrocyte metabolism may influence the global glucose/oxygen uptake ratio, particularly after a stimulus.
MATERIALS AND METHODS
Chemicals
D-[6-14C]glucose (specific activity, 52 mCi/mmol) and 2-deoxy-D-[1-14C]glucose ([14C]DG; 51 mCi/mmol) were purchased from DuPont NEN (Boston, MA, U.S.A.). Radiochemical purity was assayed before use by phosphorylation with yeast hexokinase (Boehringer-Mannheim, Indianapolis, IN, U.S.A.) plus ATP, then purification by HPLC; the radiochemical purity of each tracer was >98%. ATP, D-glucose, and glutaminase were purchased from Sigma Chemical Co. (St. Louis, MO, U.S.A.), and Dowex 50-H+ (AG50W-X8) was obtained from BioRad (Richmond, CA, U.S.A.).
Animals
Some rats (six per group) in which the levels of unlabeled glycogen, glucose, and lactate in ethanol, HCl, and perchloric acid extracts were reported in our accompanying article (i.e., in conjunction with extensive analysis of the effects of extraction procedure on measured levels of glycogen; Cruz and Dienel, 2002) were labeled in vivo with [6-14C]glucose during rest, activation, and recovery.
Physiologic variables were determined just before the metabolic labeling (i.e., 3 hours after surgery). Rectal temperature was monitored with a thermistor (Yellow Springs Instrument Co. [YSI], Yellow Springs, OH, U.S.A.) and maintained at 37°C with a thermostatically controlled heating lamp. Arterial blood samples were drawn for determination of physiologic variables before beginning the experiment. Arterial blood PO2, PCO2, and pH were determined with a Model 170 pH/blood-gas analyzer (Corning Medical Scientific, Medfield, MA, U.S.A.). Arterial blood hematocrit was determined after centrifugation. Mean arterial blood pressure was measured with a Micro-Med Analyzer (Micro-Med, Louisville, KY, U.S.A.) that had been calibrated with an air-damped Hg manometer. Arterial plasma glucose and lactate concentrations were simultaneously measured in each sample by enzyme-sensor technology with a YSI 2700 Select Biochemistry Analyzer using glucose and lactate oxidases to produce H2O2 which is electrochemically oxidized at the respective platinum anodes; the instrument was calibrated with standards with each assay set, and standard curves were used to determine the linear range for each substrate.
To assess labeling of brain metabolic pools, an intravenous pulse of [6-14C]glucose (100 μCi/kg, 100 μCi/ml) was injected into conscious 350- to 400-g rats during rest, at onset of 5 minutes of generalized stimulation, or at 10 minutes after cessation of stimulation (n = 6 per group). Timed samples of arterial blood were drawn throughout the 5-minute labeling period; the first six samples were drawn sequentially during the initial 0.2 minutes, and subsequent samples were drawn at about 0.25, 0.5, 0.75, 1, 2, 3, and 5 minutes after the pulse. After centrifugation to obtain plasma, the 14C content of each sample was measured by liquid scintillation counting (Packard Model 2200, using external standardization) and the corresponding glucose level determined with a YSI Model 2700 Select Biochemistry Analyzer; [14C]glucose-specific activities were determined for each sample and used to calculate the ISA of the arterial plasma precursor pool for each animal.
Analytical procedures
Two tissue-extraction procedures were used in the present study. Labeled and unlabeled glucose, lactate, and glycogen were assayed after aqueous ethanol extraction (Dienel et al., 1990) to eliminate possible interference of perchlorate with the anion-exchange high-performance liquid chromatography (HPLC) purification of the carbohydrates. Perchloric acid extracts of parallel samples of frozen brain powders were used for amino acid analysis because this acid-extraction procedure is more rapid and less tedious than the quantitative ethanolextraction procedure. Perchlorate does not interfere with amino acid analysis because it was removed during the initial cationexchange chromatography step (see below) in which the amino acids were separated from neutral and acidic compounds to eliminate any potential interference by labeled glucose and its labeled metabolites (in the glycolytic pathway and tricarboxylic acid [TCA] cycle) that might co-elute with amino acids.
Unlabeled glucose and lactate contents of each sample were determined with the Biochemistry Analyzer, by standard enzymatic fluorometric assays (Lowry and Passonneau, 1972), or by HPLC; all assay procedures gave similar values. Glycogen was assayed in the ethanol-insoluble fraction by determination of net release of labeled or unlabeled glucose after incubation in the presence minus that in the absence of amyloglucosidase. Washed amyloglucosidase-treated pellets (protein, DNA, RNA, lipid) were dissolved in 1N NaOH and assayed for their 14C contents. Total 14C in brain was determined by liquid scintillation counting after dissolving a separate weighed portion of frozen powder in 1N NaOH.
RESULTS
Physiologic variables
Physiologic variables for all groups of rats were similar and in the normal range (Table 1). Blood O2 levels were elevated during funnel freezing owing to use of 100% O2 to minimize hypoxia.
Physiologic variables
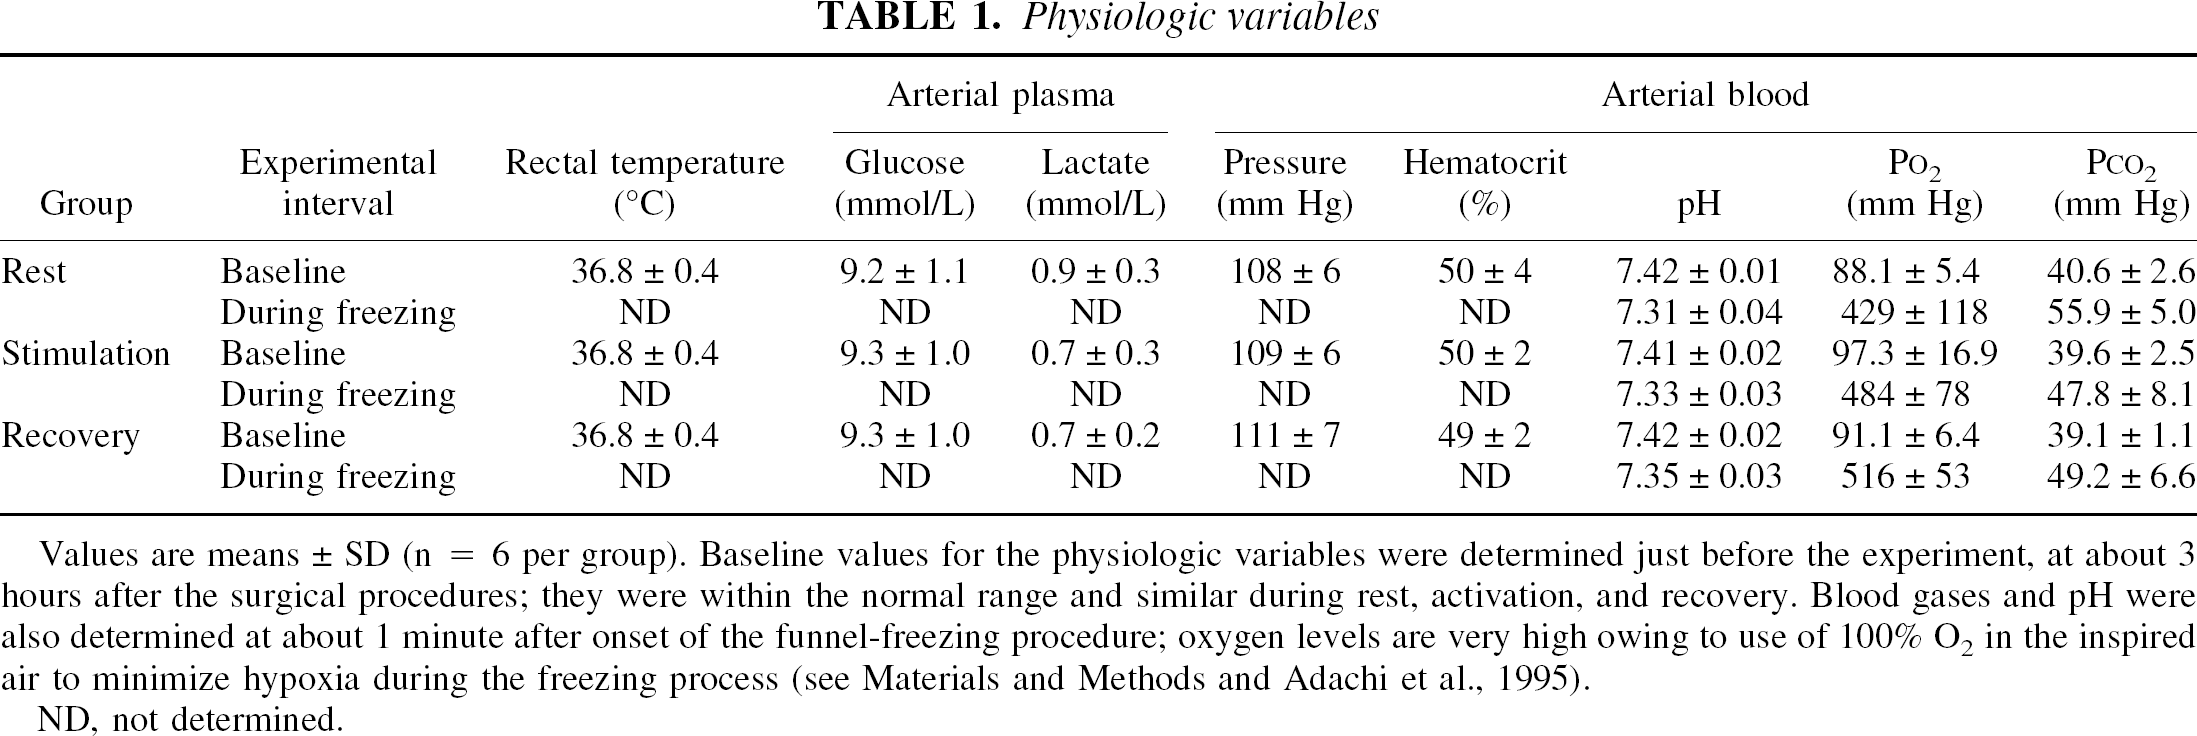
Values are means ± SD (n = 6 per group). Baseline values for the physiologic variables were determined just before the experiment, at about 3 hours after the surgical procedures; they were within the normal range and similar during rest, activation, and recovery. Blood gases and pH were also determined at about 1 minute after onset of the funnel-freezing procedure; oxygen levels are very high owing to use of 100% O2 in the inspired air to minimize hypoxia during the freezing process (see Materials and Methods and Adachi et al., 1995).
ND, not determined.
Metabolic activation during brief generalized sensory stimulation
Qualitative [14C]DG autoradiographic assays were used to visualize shifts in cortical glucose use in a small number of animals (n = 3 per group) during brief generalized sensory stimulation compared with rest and recovery. Dark bands near the midlayer of cerebral cortex—presumably layer 4, which has high CMRglc compared with other cortical layers (Zilles and Wree, 1995)—were more prominently labeled by [14C]DG during stimulation compared with rest and recovery (data not shown). Total tissue 14C levels in the caudate and dorsal cortex at the level of caudate/hippocampus were 20% higher (P < 0.05) during stimulation compared with rest; the magnitude of this increased labeling is underestimated due to the higher background contributed by a greater fraction of unmetabolized [14C]DG at 5 minutes in resting versus activated tissue (Dienel and Cruz, 1993; Adachi et al., 1995).
Labeling of major brain metabolites by [6-14C]glucose during and after brief stimulation
The specific activity of glucose in arterial plasma peaked within 0.1 or 0.2 minutes after the pulse injection and the first phase of clearance was very rapid and similar in all experimental groups (Fig 1). Between about 0.5 and 5 minutes, the fall in specific activity of plasma glucose was much more gradual, decreasing by approximately 50% during this interval in all three groups (Fig. 1, bottom panel). The specific activities of glucose in the last blood sample taken before funnel freezing and the ISAs of glucose in arterial plasma did not differ among the experimental groups (Fig. 1). The specific activities (nCi/μmol) of the last plasma glucose sample were slightly higher than those of brain glucose (P < 0.05 only for the stimulation group) owing to the lag (about 1 to 1.5 minutes) between drawing the last blood sample and freezing of the brain, during which time clearance of label from plasma would continue. Thus, with the exception of 2 of the 18 animals (bottom panel, Fig. 1), the areas under the plasma curves and temporal profiles of labeled precursor in blood were similar in all rats.
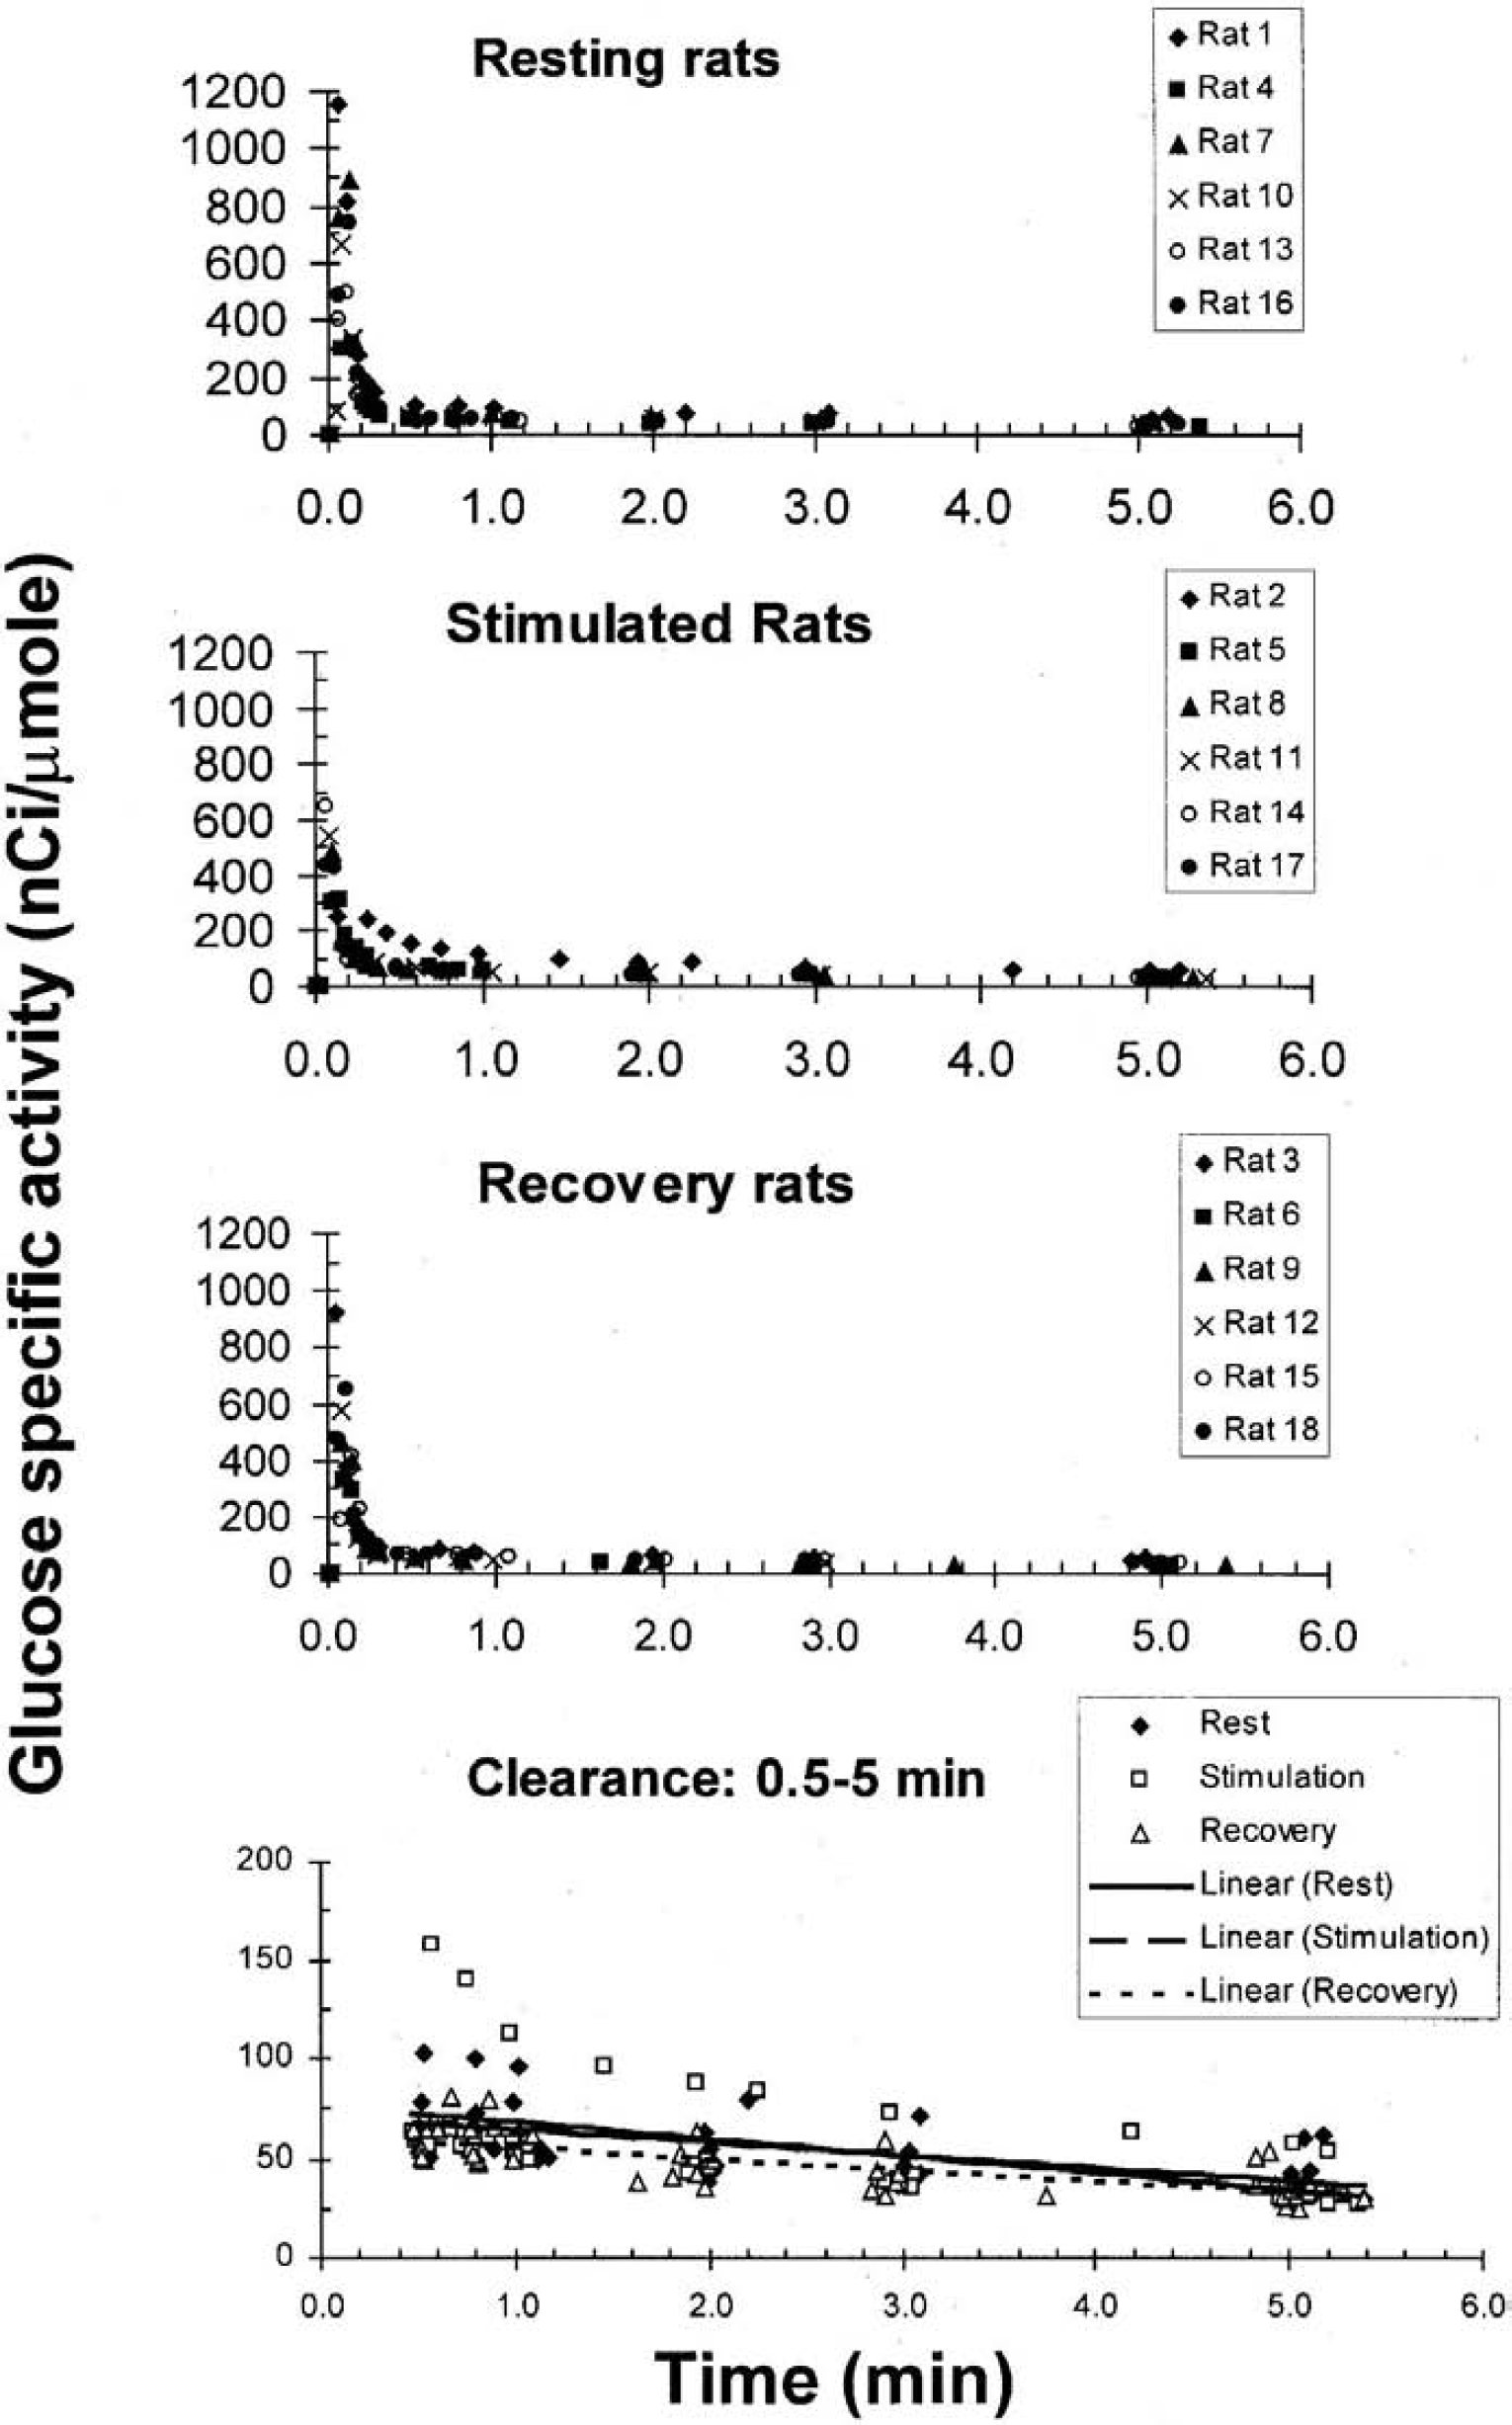
Temporal changes in specific activity of arterial plasma glucose after a pulse intravenous injection of [6-14C]glucose. Values are shown for all animals in which metabolic labeling was carried out during rest, during 5 minutes of generalized sensory stimulation, and during the 10- and 15-minute interval of recovery from stimulation. After the initial peak, which occurred within 0.2 minutes, the fall in glucose-specific activity was much more gradual (bottom panel). The linear regression lines determined for each data set between the interval 0.5 to 5 minutes (n = 41, 45, 40 pairs of values/group) are described as follows: rest, y = −6.3x + 71; activation, y = −8.0x + 77; recovery, y = −5.6x + 61. The standard errors of the estimates (slopes) are 1.3, 1.9, and 0.9, respectively, and the 95% confidence intervals of slopes overlapped. The specific activities of glucose (mean ± SD, n = 6 per group) during rest, activation, and recovery, respectively, were 40 ± 12, 34 ± 10, and 36 ± 10 in the last blood sample and 31 ± 4, 25 ± 3, and29±4inbrain; the blood- and brain-specific activities were not statistically significant except during stimulation (P < 0.05, t-test), presumably owing to continued clearance of label from blood during the freezing procedure and a lag between the last blood sample and freezing of the brain. The ISAs of [14C]glucose in arterial plasma were 374 ± 113, 324 ± 91, 301 ± 66 [nCi/μmol plasma glucose]min during rest, stimulation, and recovery, respectively, and did not differ among the three groups (ANOVA).
Incorporation of [6-14C]glucose into total labeled metabolites in dorsal cerebral cortex rose 26% during sensory stimulation compared with rest, and 14C recovered in the TCA cycle-derived amino acids accounted for most of this increase (Table 2). The total 14C in all labeled compounds (Table 2) determined in separate portions of the frozen brain powders from each animal agreed within 1% of the total 14C recovered in the ethanol extracts plus that in the insoluble fractions (glycogen, lipid, protein, DNA, and RNA), indicating that all labeled products of glucose in the tissue were quantitatively taken into account. At 5 minutes after the pulse of tracer, 15% to 25% of the total 14C remained as unmetabolized glucose, depending on the stage of activity, and identified compounds that were purified accounted for 50% to 60% of the total.
Labeling of major cortical glucose carbon pools by [6-14C]glucose before, during, and after 5 minutes of generalized sensory stimulation
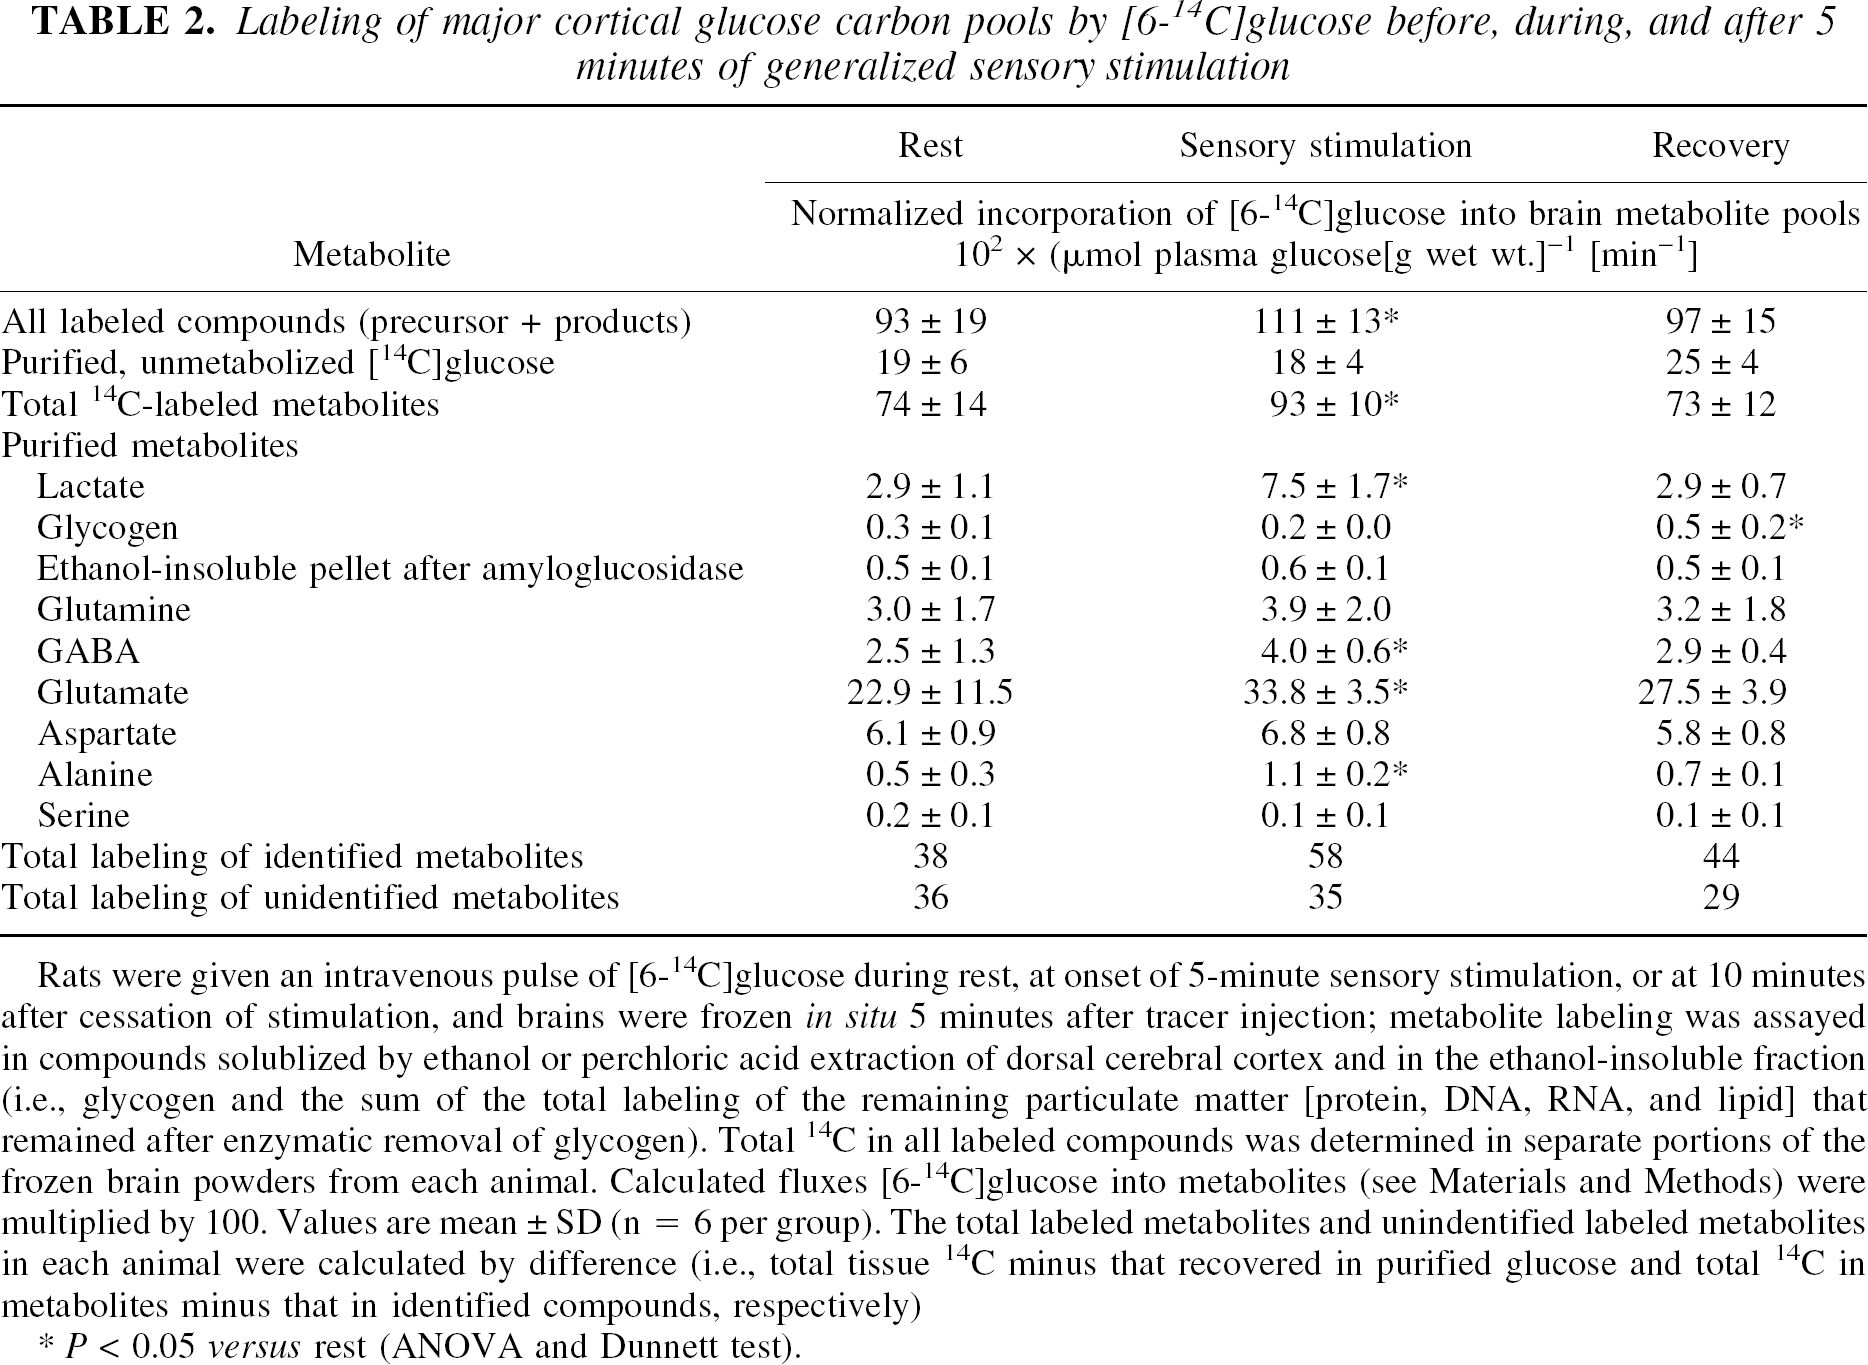
Rats were given an intravenous pulseof[6-14C]glucose during rest, at onset of 5-minute sensory stimulation, or at 10 minutes after cessation of stimulation, and brains were frozen in situ 5 minutes after tracer injection; metabolite labeling was assayed in compounds solublized by ethanol or perchloric acid extraction of dorsal cerebral cortex and in the ethanol-insoluble fraction (i.e., glycogen and the sum of the total labeling of the remaining particulate matter [protein, DNA, RNA, and lipid] that remained after enzymatic removal of glycogen). Total 14C in all labeled compounds was determined in separate portions of the frozen brain powders from each animal. Calculated fluxes [6-14C]glucose into metabolites (see Materials and Methods) were multiplied by 100. Values are mean ± SD (n = 6 per group). The total labeled metabolites and unindentified labeled metabolites in each animal were calculated by difference (i.e., total tissue 14C minus that recovered in purified glucose and total 14C in metabolites minus that in identified compounds, respectively)
P < 0.05 versus rest (ANOVA and Dunnett test).
Lactate and glycogen are products of nonoxidative pathways and together accounted for only a small fraction (i.e., 4% to 8%) of the 14C recovered in metabolites at any stage of activity (Table 2). The percent increase in labeling of lactate and alanine during stimulation was, however, higher than that of other metabolites. Labeling of brain glycogen was low and did not change during stimulation, but doubled during recovery. Labeling of all pools except glycogen normalized within 15 minutes after cessation of the stimulus.
The largest quantity of 14C was incorporated into glutamate (i.e., 31% to 38%) at all stages of activity, exceeding that incorporated into alanine, glutamine, GABA, or aspartate. Labeling of glutamate rose by nearly 50% during sensory stimulation, reflecting increased oxidative metabolism; that is, for [6-14C]glucose-derived label to be trapped in glutamate via the transaminase exchange reaction, the labeled carbon must first pass through the mitochondrial pyruvate and isocitrate dehydrogenase steps, thereby producing NADH, which is oxidized via the respiratory chain. Increased labeling of glutamate by [6-14C]glucose agrees with previous work showing (1) rapid, preferential incorporation of [14C]glucose into glutamate (incorporation of labeled glucose into a “large” glutamate compartment has been interpreted as mainly neuronal on the basis of a low [about 0.3 to 0.5; Table 5] glutamine-to-glutamate-specific activity ratio compared with that obtained with acetate or other precursors [>1.0; Balázs and Cremer, 1972; Berl et al., 1975], but glucose is probably also incorporated into the glial glutamate pool); and (2) a lag before glucose label incorporation into glutamine, presumably via glutamate-glutamine cycling between astrocytes and neurons (Sibson et al., 1997). Most of the intermediates in the glycolytic, pentose phosphate shunt, and TCA cycle pathways are present in brain in small quantities compared with the major pools of glucose-derived compounds (Bachelard, 1989; Siesjö, 1978). Because these compounds were not individually purified, labeling of the composite pool of unidentified ethanol-soluble metabolites by [6-14C]glucose, which was determined by difference, accounted for 40% to 50% of the total 14C. Labeling of this heterogeneous pool did not change during stimulation, and fell somewhat during recovery (Table 2). To summarize, the fraction of the additional [6-14C]glucose metabolized during stimulation over and above that in the resting state was 73% for the oxidative pathway (i.e., TCA cycle-derived amino acids) and 25% for the lactate remaining in tissue at sampling time. Any efflux of labeled lactate from the activated tissue (to blood or other brain regions [Cruz et al., 1999; Hawkins et al., 1973]) would, however, alter these proportions.
Levels and specific activities of purified metabolites
Levels and specific activities of major glucose carbon pools before, during, and after 5 minutes of generalized sensory stimulation
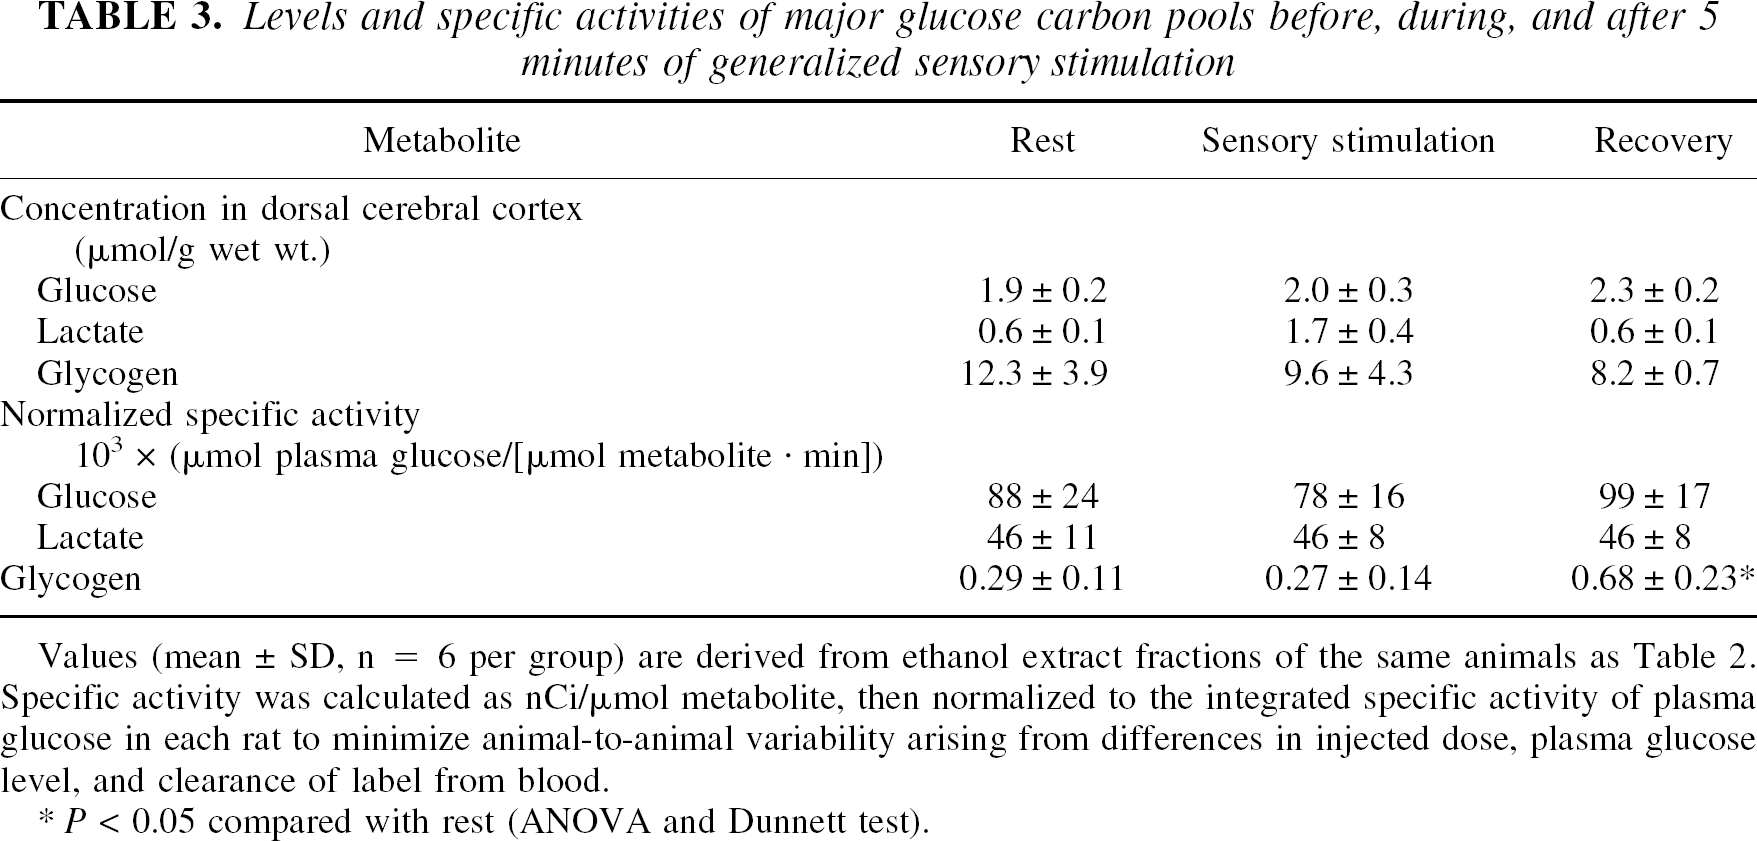
Values (mean ± SD, n = 6 per group) are derived from ethanol extract fractions of the same animals as Table 2. Specific activity was calculated as nCi/μmol metabolite, then normalized to the integrated specific activity of plasma glucose in each rat to minimize animal-to-animal variability arising from differences in injected dose, plasma glucose level, and clearance of label from blood.
P < 0.05 compared with rest (ANOVA and Dunnett test).
The mean glycogen level tended to fall between rest and 15 minutes of recovery. Owing to high variability, the lower concentration did not become statistically significantly different from rest until data from two experiments were pooled to increase animal number from 6 to 9–11 per group (Cruz and Dienel, 2002); the magnitude of change, about 4 μmol/g, was similar in the individual and pooled groups. The normalized specific activity of glycogen did not change during stimulation but doubled during recovery (Table 3), reflecting increased label incorporation (Table 2) and a lower concentration (Table 3). The overall apparent rate of glucose utilization normalized well before normal glycogen levels were reestablished, in spite of increased glycogen labeling during recovery (Tables 2 and 3). Thus, return to a resting rate of glucose utilization does not signify normalization of the partitioning of glucose carbon into various pathways.
Levels and specific activities of glucose-derived amino acids before, during, and after 5 minutes of generalized sensory stimulation
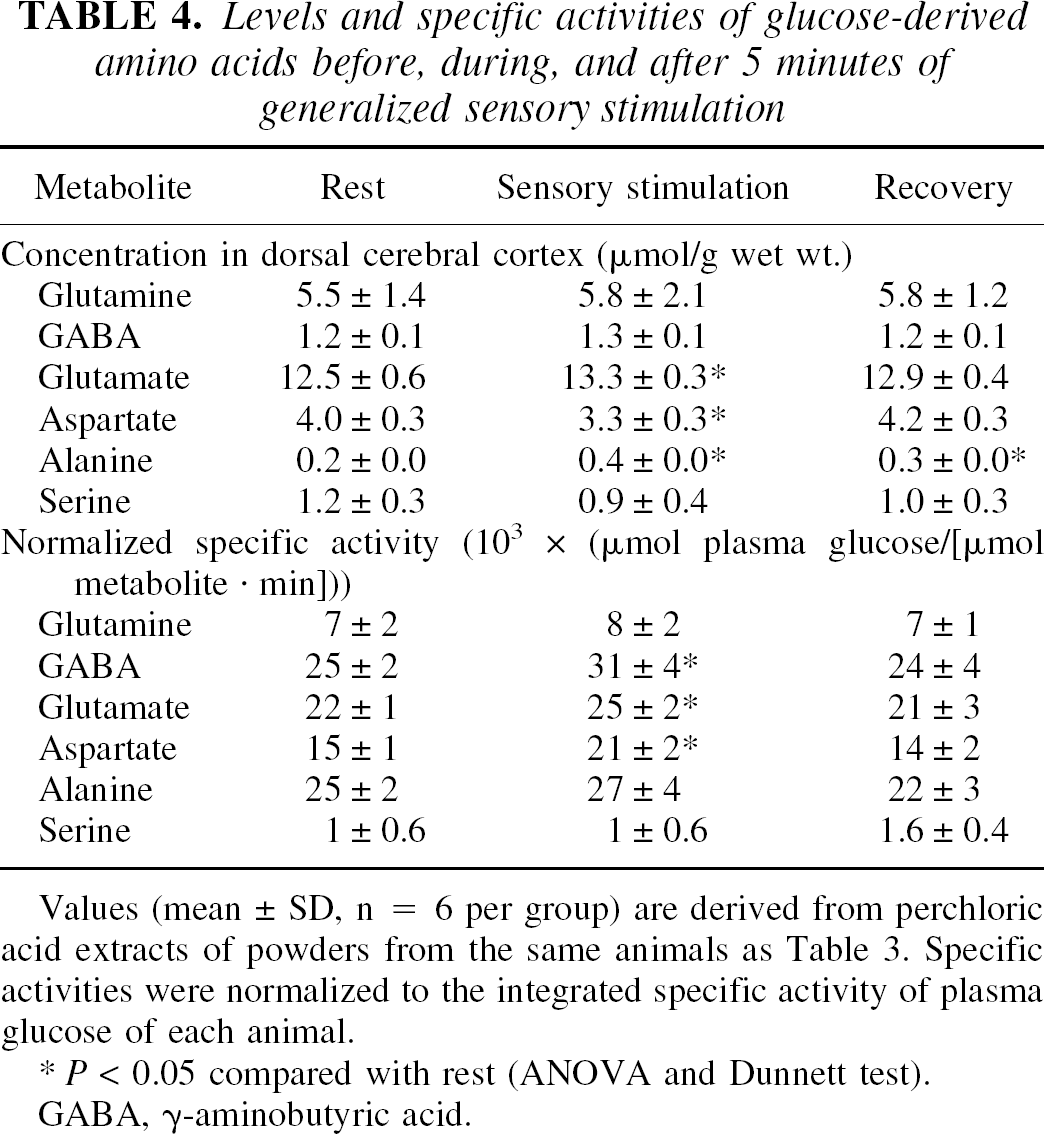
Values (mean ± SD, n = 6 per group) are derived from perchloric acid extracts of powders from the same animals as Table 3. Specific activities were normalized to the integrated specific activity of plasma glucose of each animal.
P < 0.05 compared with rest (ANOVA and Dunnett test).
GABA, γ-aminobutyric acid.
Ratios of specific activities before, during, and after brain activation
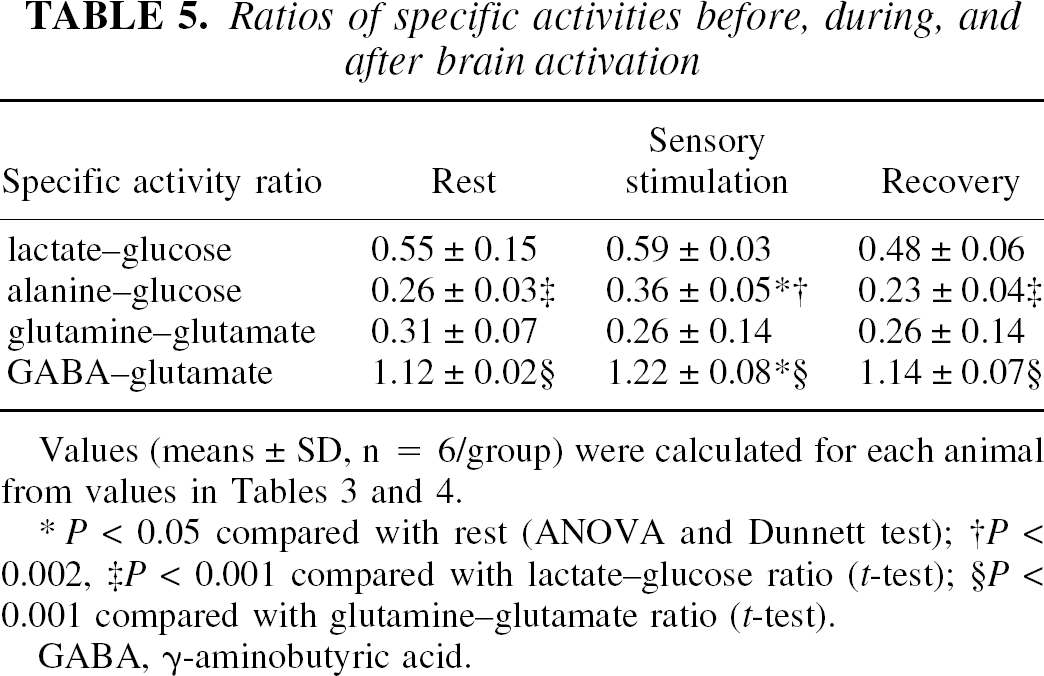
P < 0.05 compared with rest (ANOVA and Dunnett test)
P < 0.002
P < 0.001 compared with lactate-glucose ratio (t-test)
P < 0.001 compared with glutamine–glutamate ratio (t-test).
GABA, γ-aminobutyric acid.
The lactate–glucose and alanine–glucose normalized specific activity ratios did not fall during stimulation and recovery compared with rest (Table 5), and this stability in conjunction with a concomitant decrease in glycogen level (Cruz and Dienel, 2002) suggests the possibility of compartmentation of metabolism of blood-borne glucose and glycogen. In cultured astrocytes, glycogen is converted mainly to lactate and exported to the medium (Dringen et al., 1993) and brain glycogen has a very low specific activity compared with glucose, lactate, and alanine (i.e., 70- to 300-fold, Tables 3 and 4). During the initial 5-minute phase of the 20-minute activation-recovery interval, the mean glycogen level decreased by 2.7 μmol/g (i.e., about 5 and 25 times the carbon equivalent gain in lactate and alanine contents, respectively; Tables 3 and 4), and it fell another 1.4 μmol/g during the next 15 minutes; the average net losses of glucosyl units from glycogen during these intervals are calculated to be 0.54 and 0.09 μmol/min, respectively. These values are about 60% and 13%, respectively, of the corresponding estimated minimal rates of metabolism of blood-borne glucose (i.e., 0.93 μmol/min during stimulation and 0.73 μmol/min during recovery; Table 3), and would increase the true rate of energy metabolism substantially above that determined by tracer labeling. Mixing of low-specific-activity products derived from mainly unlabeled glycogen with the high-specific-activity compounds derived from blood glucose should greatly reduce the specific activity of pyruvate and its products, lactate and alanine, particularly during activation, but this did not occur (Table 5). The very low net incorporation of [14C]glucose into glycogen during the 5-minute labeling period (Table 2) and larger net loss of glucose carbon from glycogen (Table 3; note that the glycogen level at 15 minutes of recovery from stimulation was statistically significantly lower than at rest in the pooled data set [Cruz and Dienel, 2002]) render it less likely that “laston-first-off” metabolic cycling of highly labeled glucose in glycogen during the 5-minute labeling with activation could produce the equivalent high specific activity glycogen-derived lactate compared with blood glucose-derived lactate. These results suggest an intriguing hypothesis, that glycolytic and transamination products of blood-borne glucose are segregated from metabolites of glycogen.
Glutamine and GABA are both synthesized from glutamate in astrocytes and neurons, respectively (Hertz et al., 1999, 2000). The glutamine–glutamate-specific activity ratio is much lower than the GABA–glutamate ratio, reflecting the similar magnitude of labeling of these two compounds by glucose (Table 2) but a fivefold larger pool size for glutamine (Table 4). During brain activation the GABA–glutamate-specific activity ratio rose (i.e., the relative labeling of GABA increased more than that of glutamate), whereas that for glutamine was stable (Table 5).
DISCUSSION
Aerobic glycolysis and increased oxidative metabolism are not mutually exclusive
The biochemical and cellular basis for the phenomenon of aerobic glycolysis has not been elucidated since the initial reports of apparent uncoupling of glucose and oxygen metabolism in working brain (Fox and Raichle, 1986; Fox et al., 1988). The notion that increased brain uptake and utilization of glucose compared with oxygen simply reflects a shift from oxidative to glycolytic metabolism was directly examined in the rat model developed in the NIH laboratory (Madsen et al., 1995b), and the glucose uptake into brain in excess of oxygen was not fully explained by accumulation of lactate or glycogen in brain or of lactate efflux from brain to blood (Madsen et al., 1999). Major findings of the present study are that oxidative metabolism of glucose rises (Table 2) during the same interval of brain activation when glucose is taken up into brain in excess of oxygen (Madsen et al., 1999) and there are small increases and reductions in the sizes of carbohydrate and amino acid pools during activation. Pyruvate compartmentation was evident in vivo, and has been previously detected in cultured neurons and astrocytes (Cruz et al., 2001; Zwingmann et al., 2000, 2001). Taken together, these data indicate that the energetics of working brain are complex and cannot be adequately evaluated on the basis of global measures of fuel uptake, assays of selected metabolic steps, or changes in the brain levels of only a few end-product metabolites such as lactate.
Brief tracer studies can be used to evaluate activity-dependent shifts in glucose utilization by assaying the initial labeling of brain metabolic pools in conscious animals under different experimental conditions without altering tissue metabolite levels. Labeled deoxyglucose has the advantage that metabolic products are trapped and activation can be qualitatively detected in brief experiments and quantitatively assessed in 30- to 45-minute studies; its limited metabolism does not, however, permit analysis of the fate of glucose. Although local metabolic balance assays in short nonsteady state experiments with tracer levels of [14C]glucose can identify some shifts in its metabolism, quantitative assays are especially difficult to carry out for many reasons. For example, precursor ISA in brain cannot be directly determined in each rat, quantitative product trapping is required to assess metabolic rates, efflux of labeled products cannot be prevented or easily evaluated (Ackermann and Lear, 1989; Adachi et al., 1995; Collins et al., 1987), time-course studies require different experimental groups, and laborintensive purification of many labeled products must be quantitative.
The intravenous pulse of [6-14C]glucose quickly mixes with blood, enters the brain more slowly due to restrictions imposed by the blood–brain barrier, and labels the various metabolic pools. Brain glucose has a half-life of about 1 minute in resting brain (Savaki et al., 1980), and within about 2 minutes after intravenous pulse labeling with [2-14C]glucose the specific activity of brain glucose approximates that in arterial plasma (Cremer et al., 1978; Hawkins et al., 1974). In the present study, the ISAs of plasma glucose were the same in each group, but it is possible that differences in the actual timing of exposure of tissue to precursor might influence the relative labeling of pools more proximal to the precursor compared with those more distal. We have not modeled these effects, but, for example, an early pulse peak with rapid clearance of precursor might preferentially label the distal pools compared with tissue labeling with the same quantity of precursor given in a slowly increasing ramp with a later pulse peak to enhance labeling of the most proximal pools. Any such effects in the present study cannot be ruled out because the time courses of labeling of the various metabolites could not be determined in each animal. The similarity of the temporal profiles of plasma glucose-specific activity in all animals throughout most of the labeling period (i.e., the 0.5- to 5-minute interval; Fig. 1) should, however, minimize the differences in precursor pool labeling arising from timing of precursor delivery.
Analyzing the metabolism of labeled glucose mainly relies on label trapping and filling of sequential metabolic pools with labeled material. The rate of equilibration of the specific activity of a given metabolite with that of its precursor influences the time span during which the pools can be used to identify changes in metabolic fluxes. Pool filling with tracer continues until constant specific activity is achieved and changes in metabolite fluxes are no longer tracked. (Changes in pool size during the experimental period will influence the total amount of label trapped.) This limitation is apparent in the present study, that is, specific activity of lactate reached its theoretical maximum, 0.5 that of [6-14C]glucose, within 5 minutes after introduction of the pulse label (Adachi et al., 1995, Table 5). Thus, the total labeling of lactate (and alanine) is less than that of glutamate (Table 2), even though glucose-derived carbon must flow through the pyruvate (lactate-alanine) pool to reach the much larger glutamate pool where label is more effectively trapped. Furthermore, the metabolites in the glycolytic pathway between glucose and lactate–pyruvate, all of which are present in brain in relatively low concentrations (Bachelard, 1989; Siesjö, 1978), must also be as rapidly labeled and have achieved their maximal specific activities within the 5-minute interval; this may also be true for TCA cycle intermediates, and could account for the constancy of the label in unidentified metabolites with stage of activity (Table 2).
Overall glucose utilization in the dorsal cerebral cortex increased by at least 25% during stimulation (Table 2), a value smaller than the 44% rise calculated from arteriovenous differences and blood flow (Madsen et al., 1999). This underestimation arises, in part, from calculations using plasma ISA (see Materials and Methods) and, perhaps, also from some loss of [14C]metabolites. Adult rat brain has the capacity to rapidly clear lactate to blood (13% to 20% of glucose entering brain; Cruz et al., 1999; Hawkins et al., 1973) or other brain regions, and efflux of glucose-derived lactate would have the greatest impact owing to its high specific activity compared with other metabolites (Tables 3 and 4). Although there was no net efflux of unlabeled lactate to blood during stimulation (Madsen et al., 1999), there could have been some exchange of labeled and unlabeled lactate across the endothelium, which was not assessed. Loss of 14CO2 from [6-14C]glucose via the TCA cycle is expected to be minimized by trapping of 14C in large unlabeled amino acid pools via exchange reactions (Hawkins and Mans, 1989; Hawkins et al., 1985), although there could be small compartments that are metabolically activated, do not quickly mix with the total metabolite pools, and rapidly release labeled CO2. However, efflux of labeled lactate to blood greatly exceeds that of labeled CO2 in normal human brain (Blomqvist et al., 1990), as well as in conscious rats during spreading depression (Cruz et al., 1999). Synaptosomes increase oxidative metabolism of pyruvate during depolarization (Schaffer and Olson, 1980), have tight coupling between glycolytic rate and respiration, and also have a high glycolytic capacity (Kauppinen and Nicholls, 1986a,b); if the synaptosomal amino acid pools do not quickly mix with other cellular amino acid pools, these structures might be a source for loss of labeled CO2 and, perhaps, a source of transient lactate production during brain activation if glycolytic activity temporarily exceeds the capacity of the malateaspartate shuttle to transfer reducing equivalents into mitochondria and pyruvate dehydrogenase activity. To summarize, the equivalent of about half of the additional labeled glucose consumed during brain activation that remained trapped in brain during the interval when the brain glucose-oxygen uptake ratio was elevated was recovered in products of the oxidative pathway.
Lactate accumulation, pyruvate compartmentation, and metabolite trafficking
The net twofold increase in lactate content during activation represents only a small fraction, 12%, of the minimal amount of glucose consumed, and, on the basis of the lactate/glucose-specific activity ratios, blood-borne glucose is identified as the major source of brain lactate at all stages of activity. The stability of this ratio plus downward shifts in glycogen content during activation led to our working hypothesis that metabolism of blood-borne glucose and astrocytic glycogen stores may be segregated. This is an important but technically difficult area for future studies because it suggests rapid, active turnover and different functional uses for metabolites derived from the incoming and stored energy sources, as exemplified by studies of Bouzier et al. (1998, 2000).
A shuttle system involving lactate and alanine has been proposed to transport nitrogen between neurons and astrocytes, and trafficking of lactate, alanine, glutamine, or other compounds provides an opportunity for rapid egress of [14C]metabolites from activated tissue via extracellular space and paravascular flow (Rennels et al., 1985) or other mechanisms. Pyruvate-alanine-lactate compartmentation is evident in cultured brain cells (Cruz et al., 2001; Zwingmann et al., 2000, 2001), and the cells that predominately synthesize alanine from lactate appear to differ with brain region; that is, astrocytes in cortical cultures (Sonnewald et al., 1991; Westergaard et al., 1993; Waagepetersen et al., 1998a,b) and neurons in cerebellar cultures (Waagepetersen et al., 2000). If a glucose-derived pyruvate-lactate pool were the major source for alanine in brain of conscious rats in vivo, the specific activities of lactate and alanine relative to that of glucose should be similar, but this was not the case (Table 5). Alanine-specific activity in cerebral cortex was about half that of lactate (even with an increase during activation) and, as observed for lactate, both the incorporation of label from [14C]glucose into alanine and the alanine level rose during stimulation (Tables 2–4). These data suggest either two segregated pyruvate pools or extremely slow pyruvate transamination relative to its conversion to lactate. Synthesis of pyruvate from lower specific activity (Table 4) TCA cycle derivatives (Cerdan et al., 1990; Hassel and Sonnewald, 1995; Sonnewald et al., 1993, 1996) might supply an alanine precursor pool, but metabolism of neurotransmitter-derived glutamate is a less-likely source because labeled glutamate is not incorporated into alanine in cultured astrocytes (McKenna et al., 1996). Thus, use of lactate- or alanine-specific activity (which differs by almost twofold; Tables 3 and 4) to estimate the specific activity of pyruvate for calculation of TCA cycle fluxes might not be appropriate, depending on which pool reflects the true pyruvate precursor pool(s) for the TCA cycle(s) of interest.
Potential influence of glycogen turnover on oxygen–glucose uptake ratio
The high brain glycogen levels (Cruz and Dienel, 2002) suggest large energy stores and the capability for “rapid burst” metabolic responses to high ATP demand in working astrocytes. Pulse labeling with [14C]glucose, which preferentially labels outer tiers of glycogen (Strang and Bachelard, 1971; Watanabe and Passonneau, 1973), indicates that the glycogen is being synthesized in vivo during rest, activation, and recovery even though there is a progressive downward trend in glycogen level during and after brain activation (Table 3; Madsen et al., 1999; Swanson et al., 1992); restoration of glycogen content after the brief stimulus was slow compared with normalization of other compounds and overall glucose utilization (Tables 2–4). The estimate of stimulus-induced, glycogen-derived glucose utilization (0.54 μmol · g−1 · min−1, calculated from the 2.7 μmol/g mean loss of glycogen after 5 min stimulation) is about half that of blood-borne glucose in the activated dorsal cerebral cortex (0.93 μmol/g/min, Table 2), and is 1.4 times the incremental increase in CMRglc estimated by arteriovenous differences and blood flow during activation in the same animal model (i.e., 0.38 μmol · g−1 · min−1; Madsen et al., 1999). Thus, astrocytic glycogen could make a substantial contribution to energy metabolism during the initial phase of brain activation, and use of this energy source is not detectable by determination of metabolic rates by arteriovenous differences or tracer labeling assays of glucose metabolism.
After glycogen is consumed, its level must be restored and the nonoxidative biosynthetic activity will contribute to disproportionate uptake of glucose compared with oxygen. For example, the levels of glycogen at 15 minutes after sensory stimulation were about 4 μmol/g below normal (Cruz and Dienel, 2002; Table 3). If CMRglc were 0.7 μmol · g−1 · min−1 during recovery (Table 2) and 10% of this glucose (equivalent to reducing the oxygen-glucose uptake ratio from 5.9 to 5.5, the magnitude observed in rat or human brain [Madsen et al., 1995a,b; 1999]) were diverted to astrocytes to restore glycogen, then a disproportionate uptake of glucose would occur for an additional 14 to 57 minutes during the recovery period after only 5 minutes of gentle stimulation of the rat. The duration of this “restoration period” would be extended considerably if glycogen levels were further reduced by more intense or more prolonged activation from 8 μmol/g to the generally reported levels of 2 or 3 μmol/g. Thus, the recent history of the subject (activation or stress) and astrocytic metabolic activities are critical, previously unrecognized factors that can influence the global oxygen-glucose uptake ratio.
To summarize, manifestation of aerobic glycolysis during physiologic activation of the normal, conscious rat includes shifts of glucose labeling of oxidative and biosynthetic pathways in neurons and astrocytes with different temporal profiles. The “mystery of the extra glucose” (Hertz and Fillenz, 1999) consumed in excess of oxygen during activation is probably a summation of many changes that vary with the intensity and duration of the stimulus and time after the stimulus ceases; lactate release from activated tissue is an important but confounding factor due to the difficulty in its detection and quantification, as well as its potential for rapid efflux. The increase in oxidative metabolism of glucose during the same interval when there is an excess of glucose taken up relative to oxygen suggests loss of glucose metabolites from the activated tissue, which is reflected by incomplete trapping of labeled products of glucose (Collins et al., 1987). Astrocyte energy stores can be very high, and glycogenolysis begins shortly after stimulus onset and is quite slow to recover. During stimulation, glycogenolysis in astrocytes can substantially raise (by >50%) the initial rate of total glucose utilization over and above that taken up from blood for use by all brain cells (i.e., CMRglc assayed with labeled glucose metabolism tracers). On the other hand, replenishment of glycogen in astrocytes could (1) depress the oxygen–glucose uptake ratio for at least 3 to 10 times the duration of stimuli that triggered activation, depending on the magnitude of glycogen depletion; and (2) be the sole or major contributor to the manifestation of prolonged “aerobic glycolysis” during that time frame. These findings plus segregated pyruvate-lactate pools suggest the possibility of separate glycolytic pathways to extract energy from blood-borne glucose and stored glucose (glycogen), and raise provocative, challenging questions for future in vivo studies regarding temporally selective enhancement of metabolic activity in specific cellular compartments of working brain, especially the contributions of astrocytes and the functional interactions of astrocytes and neurons.
Footnotes
Acknowledgments:
The authors thank Dr. Louis Sokoloff for his support of this project and Tom Burlin for help with amino acid analysis.