
Abstract
The combination of cerebral blood flow measurement using 15O-water positron emission tomography with magnetic resonance coregistration and CSF infusion studies was used to study the global and regional changes in CBF with changes in CSF pressure in 15 patients with normal pressure hydrocephalus. With increases in CSF pressure, there was a variable increase in arterial blood pressure between individuals and global CBF was reduced, including in the cerebellum. Regionally, mean CBF decreased in the thalamus and basal ganglia, as well as in white matter regions. These reductions in CBF were significantly correlated with changes in the CSF pressure and with proximity to the ventricles. A three-dimensional finite-element analysis was used to analyze the effects on ventricular size and the distribution of stress during infusion. To study regional cerebral autoregulation in patients with possible normal pressure hydrocephalus, a sensitive CBF technique is required that provides absolute, not relative normalized, values for regional CBF and an adequate change in cerebral perfusion pressure must be provoked.
Some (usually elderly) patients with ventricular dilatation accompanied by gait apraxia, slowing of mentation, dysexecutive function, incontinence, and apparently normal CSF pressure on isolated lumbar puncture measurement may benefit from CSF shunting, particularly in terms of gait and slowing of mentation. Patients with NPH who respond to shunting are likely to have CSF pressures in the upper range of normal, an increased CSF outflow resistance (Rcsf), a wide CSF pulse pressure, and “B” pressure waves during sleep (Pickard et al., 1980). The underlying pathology is poorly defined but may include obliteration and scarring of the subarachnoid space, periventricular gliosis, and/or cerebrovascular changes within the periventricular white matter (Akai et al., 1987). Controversy surrounds which investigations provide the most reliable prediction of outcome after shunting, but measurement of Rcsf, when performed accurately, provides a standard against which other techniques may be judged (Boon et al., 1998; Borgesen, 1984; Borgesen and Gjerris, 1982).
In addition to NPH being partly a disorder of the CSF circulation, there is an association among systemic hypertension, ventriculomegaly, the symptoms and signs of NPH, and a response to shunting (Casmiro et al., 1989). It has been suggested that systemic hypertension may reduce the elasticity of the cerebral mantle and make the latter more susceptible to relatively minor obstruction within the CSF circulation (Earnest et al., 1974). In addition, CSF production increases and Rcsf decreases with age (Czosnyka et al., 2001). In health, CBF is protected against moderate fluctuations in arterial blood pressure and CSF pressure by cerebrovascular autoregulation. There has been some controversy surrounding studies of cerebral autoregulation in the past, possibly because of inadequate CBF technology. The literature surrounding previous studies of cerebrovascular autoregulation in NPH has recently been reviewed in detail (Owler and Pickard, 2001). A previous study of autoregulation in a population of patients with ventriculomegaly presenting to a multidisciplinary CSF clinic revealed that hemispheric autoregulation, as assessed by transcranial-Doppler ultrasonography, was more likely to be relatively intact when Rcsf was increased (Czosnyka et al., 1999, 2002). Global autoregulation was more likely to be impaired when Rcsf was not increased; that is, in patients where the predominant pathology was “cerebrovascular” rather than a primary disturbance of CSF circulation.
We wished to define the effect of CSF pressure on regional CBF in patients with possible NPH. We have resolved the logistical problems of studying patients during CSF infusion studies, performed as part of their clinical workup, within the PET scanner followed by MR coregistration. We have been able to define the topography of the changes in CBF with the increase in CSF pressure during the infusion study.
MATERIALS AND METHODS
Patients
This study involved 15 patients (age 69.5 ± 5.2 years; 7 males and 8 females) with NPH who were referred to the CSF Clinic at Addenbrooke's Hospital. Twelve patients presented with idiopathic NPH and three with NPH secondary to meningitis (two cases, one of which followed a head injury) or an intracerebral hemorrhage. One of the patients with idiopathic NPH also had progressive supranuclear palsy; this patient's condition initially improved after shunting but then deteriorated.
The criteria for inclusion were gait disturbance, with or without cognitive changes or urinary incontinence, dilated ventricles on computed tomography, and normal CSF pressure. All patients were assessed clinically using an NPH scale modified from Larsson et al. (1991), which assessed gait (0 = normal, 1 = insecure, 2 = insecure (cane), 3 = bimanual support, 4 = aided, and 5 = wheelchair), living condition (0 = independent, 1 = at home with assistance, 2 = retirement home, 3 = nursing home, and 4 = hospital) and urinary symptoms (0 = no symptoms; 1 = symptoms present). This resulted in a score out of 10 points and a gait score. In addition, as a measure of overall function, we recorded a modified Stein-Langfitt score (0 = no neurologic deficit and able to work, 1 = minimal deficit and able to function independently at home, 2 = some supervision required at home, 3 = custodial care required despite considerable independent function, and 4 = no capacity for independent function).
Patients suspected of having NPH and who were suitable for further treatment underwent insertion of a frontal Ommaya reservoir. After a postoperative period of at least 2 days, a computerized CSF infusion study (Czosnyka et al., 1996) was performed to characterize the CSF dynamics, including Rcsf. The infusion study was performed in the PET scanner during acquisition of CBF PET data as described later. Patients with an increased Rcsf, and who were medically suitable, underwent CSF ventriculoperitoneal shunting incorporating either a Codman Medos programmable valve (Codman, Rynham, MA, U.S.A.) or a Medtronic Strata valve (Medtronic, Minneapolis, MN, U.S.A.). Nine patients were shunted and were followed up in the CSF clinic and a score assigned as per preoperatively. Patients were considered to have responded to shunting if the NPH score decreased by 2 or more points.
PET and MR imaging scanning
All PET scanning was performed on a GE vision scanner (General Electric Medical Systems, Milwaukee, WI, U.S.A.) at the Wolfson Brain Imaging Center, which is incorporated within the Neurosciences Critical Care Unit of Addenbrooke's Hospital. A radial arterial line and peripheral venous line were inserted. The patient's Ommaya reservoir was accessed using two 25-G butterfly needles. The first needle was connected to a fluid pressure transducer and CSF pressure monitor. The second needle was connected to a CSF infusion pump containing 60 mL of mock CSF (normal saline). The CSF pressure was monitored continuously until after all PET scanning had ceased. MABP was also recorded continuously in 10 patients to allow continuous monitoring of the CPP. The patient was positioned supine on the scanner table, the room was darkened, and the patient was encouraged to lie quietly.
A 10-minute transmission scan was performed using two rotating 68Ge/68Ga rod sources (approximately 600 MBq in total) to correct for photon attenuation. Two 15O-water PET scans to measure CBF were then performed using the following protocol. An intravenous infusion of 800 MBq of O15-labeled water was delivered to the patient over 20 minutes; after a 10-minute build-up period to achieve tracer steady state, PET data was acquired in three-dimensional mode in two contiguous 5-minute frames. Arterial blood samples were taken at 10, 15, and 20 minutes into the infusion to monitor blood gases (including PaCO2) and to determine the radioactivity concentration in blood during the PET acquisition, as required by the CBF kinetic model. The PET images were reconstructed using the three-dimensional PROMIS filtered backprojection algorithm (Kinhan and Rodgers, 1989) implemented on the scanner, with corrections applied for randoms, dead time, normalization, attenuation, and scatter.
The first PET scan was performed to measure the baseline CBF, during which time the patients' resting ICP and MABP were recorded. At the end of this scan, the computerized CSF infusion study was commenced. A constant rate (0.5–1.0 mL/min) of mock CSF was infused into the Ommaya reservoir, during which time the ICP and MABP were monitored. The ICP was thus elevated until a new higher equilibrium ICP was established. The time to equilibrium was generally 5 to 15 minutes. Once the equilibrium had been established for 5 minutes, using the same method as described for the first scan, a second PET scan was performed to measure the CBF at the higher ICP. At the end of the PET scanning, the ICP was allowed to return the baseline ICP. The arterial blood samples were also used to measure arterial blood gases (including PaCO2) during baseline and equilibrium PET scans. The experimental setup is illustrated in Figure 1.
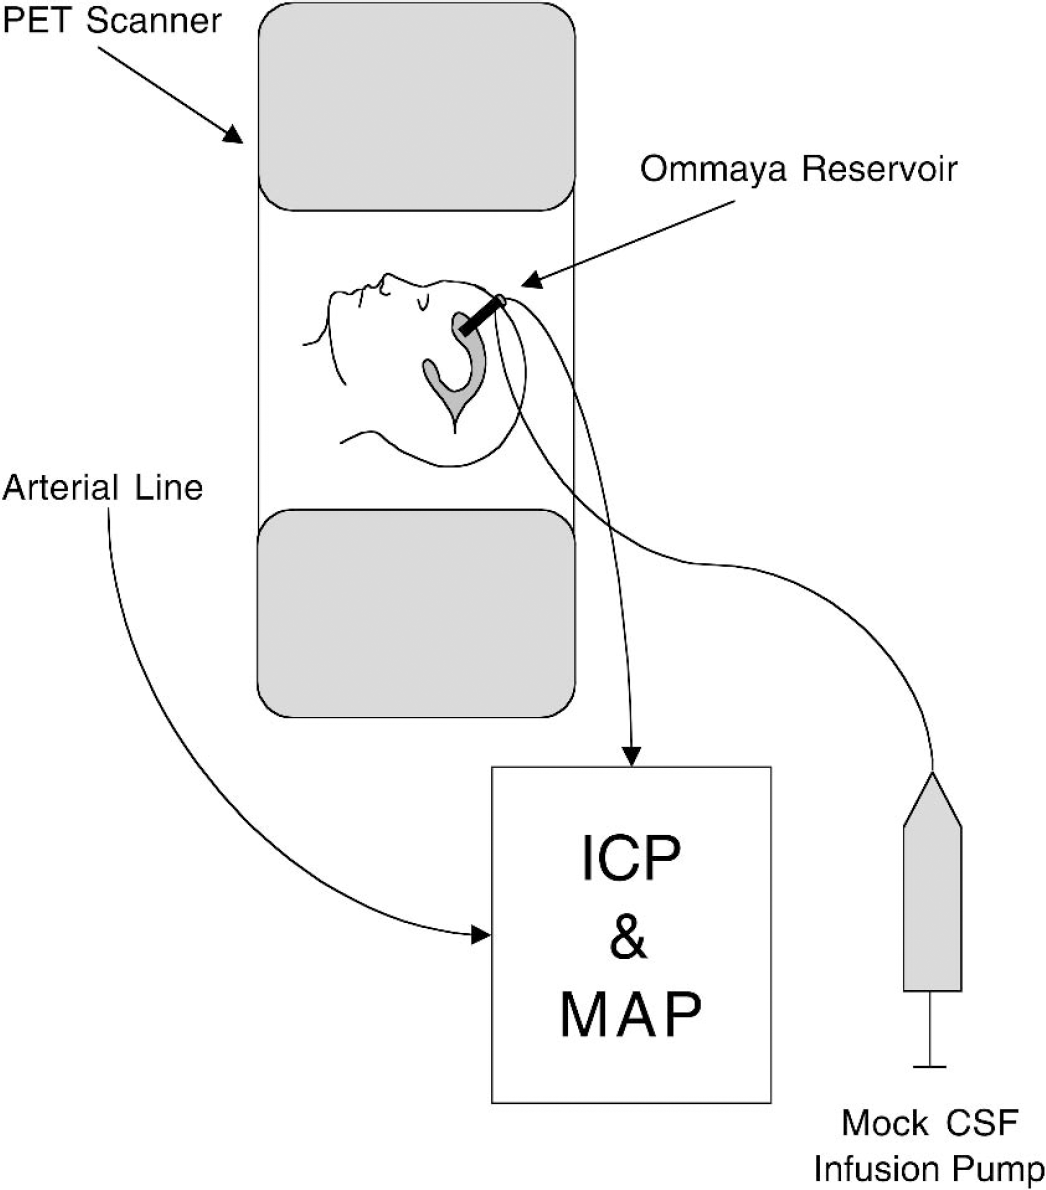
Experimental setup. Patients were positioned in the PET scanner with an intravenous line to deliver the O15-labeled water and a radial arterial line for arterial blood sampling and arterial blood pressure monitoring. The previously implanted Ommaya reservoir was accessed and set up for a CSF infusion study and ICP monitoring. A baseline PET scan of CBF was performed and ICP was monitored. The CSF infusion study was then initiated and a new higher equilibrium ICP was obtained. A second PET study of CBF was then completed.
A volumetric 3-T SPGR MR imaging scan (voxel size: 1 × 1 × 1 mm) of the brain was obtained on the same day as the PET scan in 14 of the 15 patients. One patient was unable to tolerate the MR scanner because of claustrophobia. Both PET and MR images were coregistered using SPM-99 and CBF maps were calculated using standard kinetic models (Frackowiak et al., 1981) (PETAN2001, Dr. Piotr Smielewski, Cambridge, U.K.). The spatial resolution of the PET data was approximately 6 mm and the CBF map voxel size was 2.34 × 2.34 × 4.25 mm (field of view, 15.3 cm).
FE modeling
As an adjunct to this study, we conducted an FE modeling analysis of the distribution of mean stress, shear stress, and displacement of the brain during a CSF infusion study. There were two purposes of this study. First, we wished to be able to compare the baseline and equilibrium CBF maps. If the CSF infusion study resulted in significant enlargement of the ventricular system, then this would make comparison difficult. Second, because the brain is not a fluid but a semisolid, the distribution of stress during CSF infusion will be distributed throughout the brain unevenly. We therefore examined these distributions and their relationship to the observed changes in CBF.
Finite-element modeling was conducted using three-dimensional elements based on the geometry of an axial MR brain slice at the level of the body of the lateral ventricles (see Appendix).
Analysis
For each individual patient, global CBF was assessed by drawing ROIs on the coregistered MR scans. For the global regions (i.e., the cerebrum and cerebellum), regions were outlined with AnalyzeAVW (BIR, Mayo Clinic, Rochester, MN, U.S.A.) using a combination of thresholding and manual inspection (Fig. 2). CSF spaces and large vessels were excluded from the ROIs. The process was repeated for each slice. For each ROI, a mean CBF was calculated based on the entire ROI volume. In this way a true mean CBF for the ROI was obtained and the overall mean not artificially affected by the size of the ROI. For the patient in whom coregistration was not possible owing to the lack of a suitable MR scan, global ROIs for the cerebrum and cerebellum were drawn using AnalyzeAVW directly onto the CBF maps.
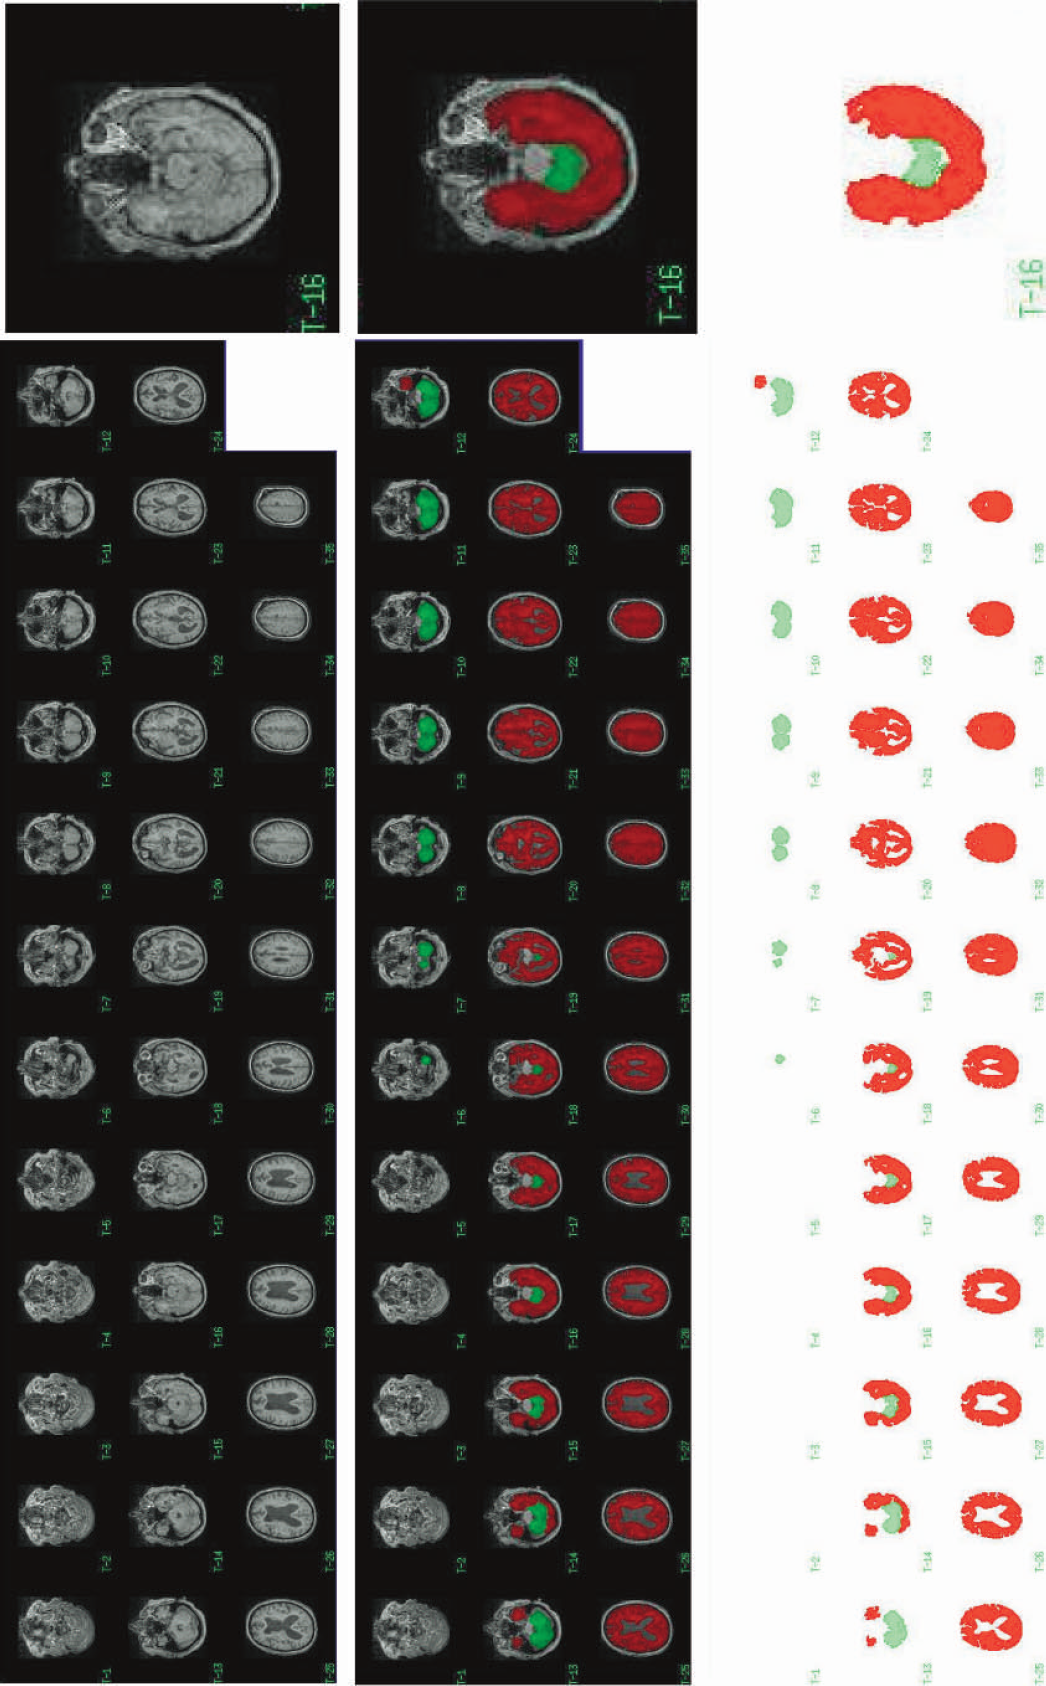
Coregistered MR scan and of a representative NPH patient (top). The MR scan resliced to PET resolution giving 35 slices with whole-brain coverage. For each slice, the cerebrum and/or cerebellum were identified and ROIs were drawn using the methods described in the text (middle). This process was repeated for each individual patient. The resulting ROIs for the cerebrum (red) and cerebellum (green) are shown for this representative patient (bottom).
The regional CBF results were obtained by manually placing small circular ROIs (each 15 voxels in size) bilaterally within anatomical regions on all slices of the MR scan where that structure was visible. This was performed for the frontal, occipital, temporal, and parietal white matter, as well as the thalamus, head of caudate, and the putamen. Care was taken to place ROIs away from boundaries of anatomical regions so as to minimize partial volume contamination of the ROI by other structures with different CBFs. A regional CBF analysis could not be accurately performed in the patient for whom there were no coregistered MR images.
A third type of analysis was performed based on the distance from the lateral ventricles. Three ROIs were described using the coregistered MR images (Fig. 3). Only MR slices in which the lateral ventricles were visible and which were above the level of the thalamus were included. All cerebral tissue at a maximum distance of 15 mm from the wall of the lateral ventricle was included in the first ROI. The second ROI contained tissue within 15 to 30 mm from walls of the lateral ventricle. The remainder of the tissue to the cortical surface made a third ROI. Thus, all of these ROIs contained a mixture of gray and white matter. The type of tissue contained within these ROIs varies among patients depending on the size of the ventricles and the morphology of the brain. However, the aim was to study change in CBF with distance from the lateral ventricle when CSF pressure is increased rather than absolute values.
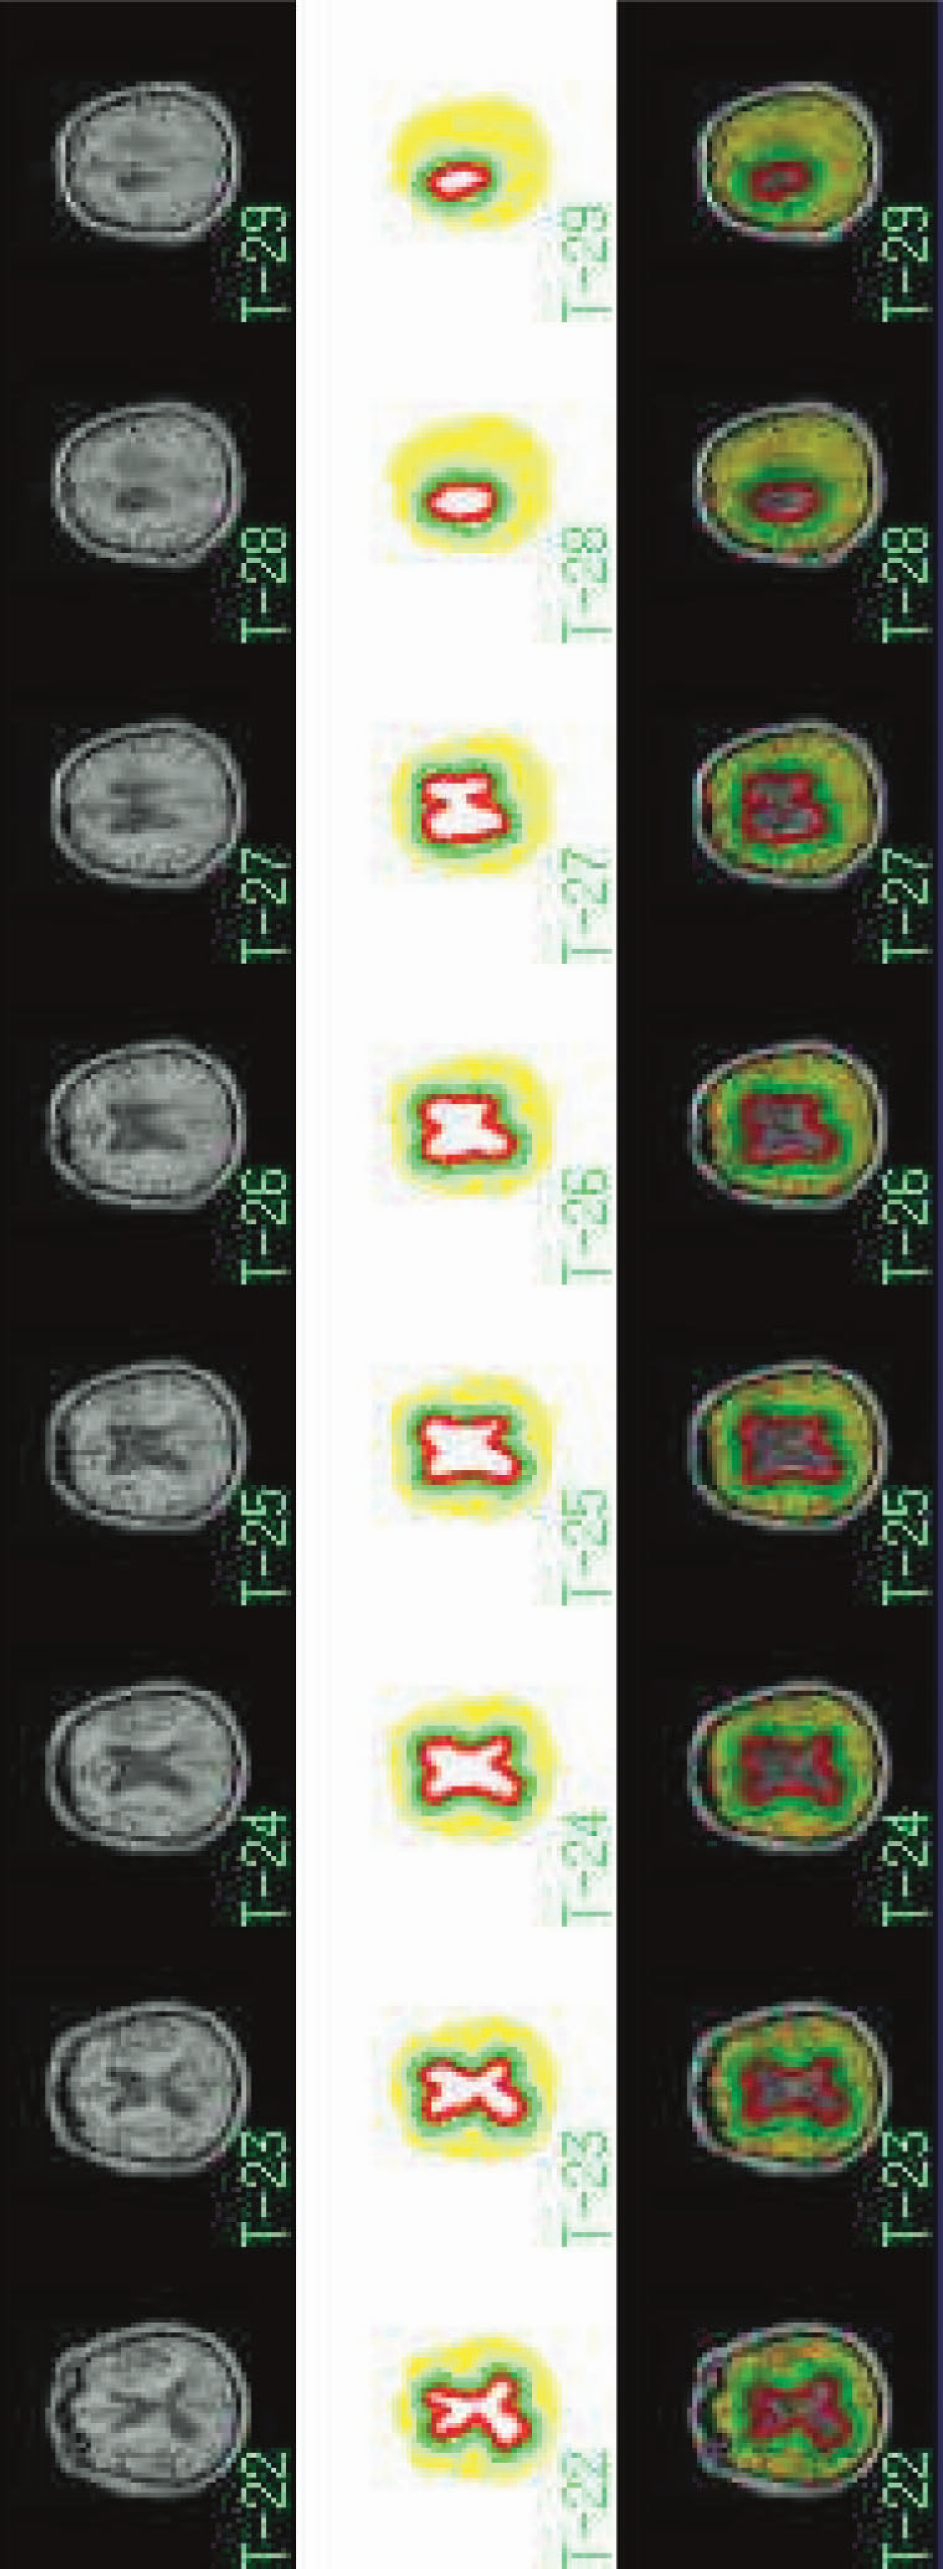
Concentric ROIs. In addition to global and anatomical regional ROIs, concentric ROIs, based on the distance from the lateral ventricles, were drawn on the MR slices at level of the lateral ventricles (top and middle). The three concentric ROIs were labeled as the inner (red), middle (green), and outer (yellow) ROIs.
The mean CBF values for global and anatomical regions were compared between CBF values at baseline CSF pressure and equilibrium CSF pressure during CSF infusion using the Wilcoxon matched pairs test. Changes in CSF pressure and the Rcsf were compared to changes in CBF and examined for correlations using the Spearman rank order correlation test.
All patients involved in the study gave informed consent. The study was performed with the approval of the Cambridge Local Region Ethics Committee (96/172) and the Administration of Radioactive Substances Advisory Committee (083–2050[14977]).
RESULTS
CSF compensatory parameters and change in ICP
The computerized CSF infusion technique was used to study all patients. Mean ± SD ICP during the acquisition of the baseline PET scan was 11.0 ± 3.5 mm Hg. The average increase in ICP during CSF infusion to equilibrium ICP was 22.1 ± 7.8 mm Hg, providing a mean equilibrium ICP of 33.1 ± 9.9 mm Hg and Rcsf of 20.1 ± 7.3 mm Hg · mL−1 · min−1 (Table 1). In one patient, initiation of CSF infusion precipitated large plateau waves to 60 mm Hg and the infusion was therefore terminated. Calculation of Rcsf was estimated to be approximately 24 mm Hg · mL−1 · min−1 in this patient given the mean ICP of 35 mm Hg during the time of data acquisition of the second PET scan.
Age and CSF compensatory parameters obtained from CSF infusion study
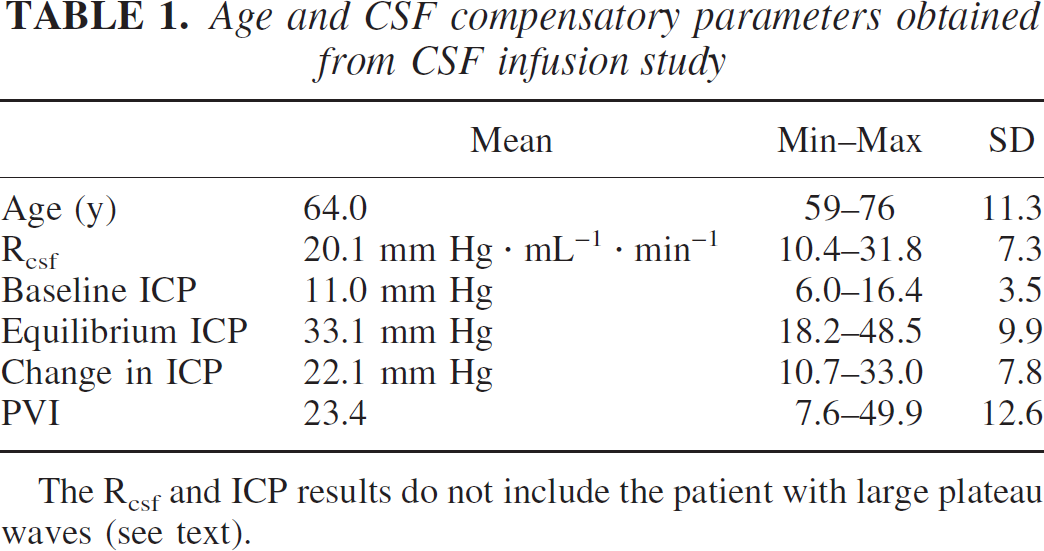
The Rcsf and ICP results do not include the patient with large plateau waves (see text).
Finite element analysis
The results of the three-dimensional FE modeling of the brain during CSF infusion with an increase in CSF pressure of 30 mm Hg are illustrated in Figs. 4A through 4D. With regards to displacement, the results suggest that small changes in the size and shape of the lateral ventricles do occur. These changes are >2 mm and are located in the region of the body of the lateral ventricles and around the corpus callosum. This magnitude of displacement is well within the abilities of the MR/PET coregistration process.
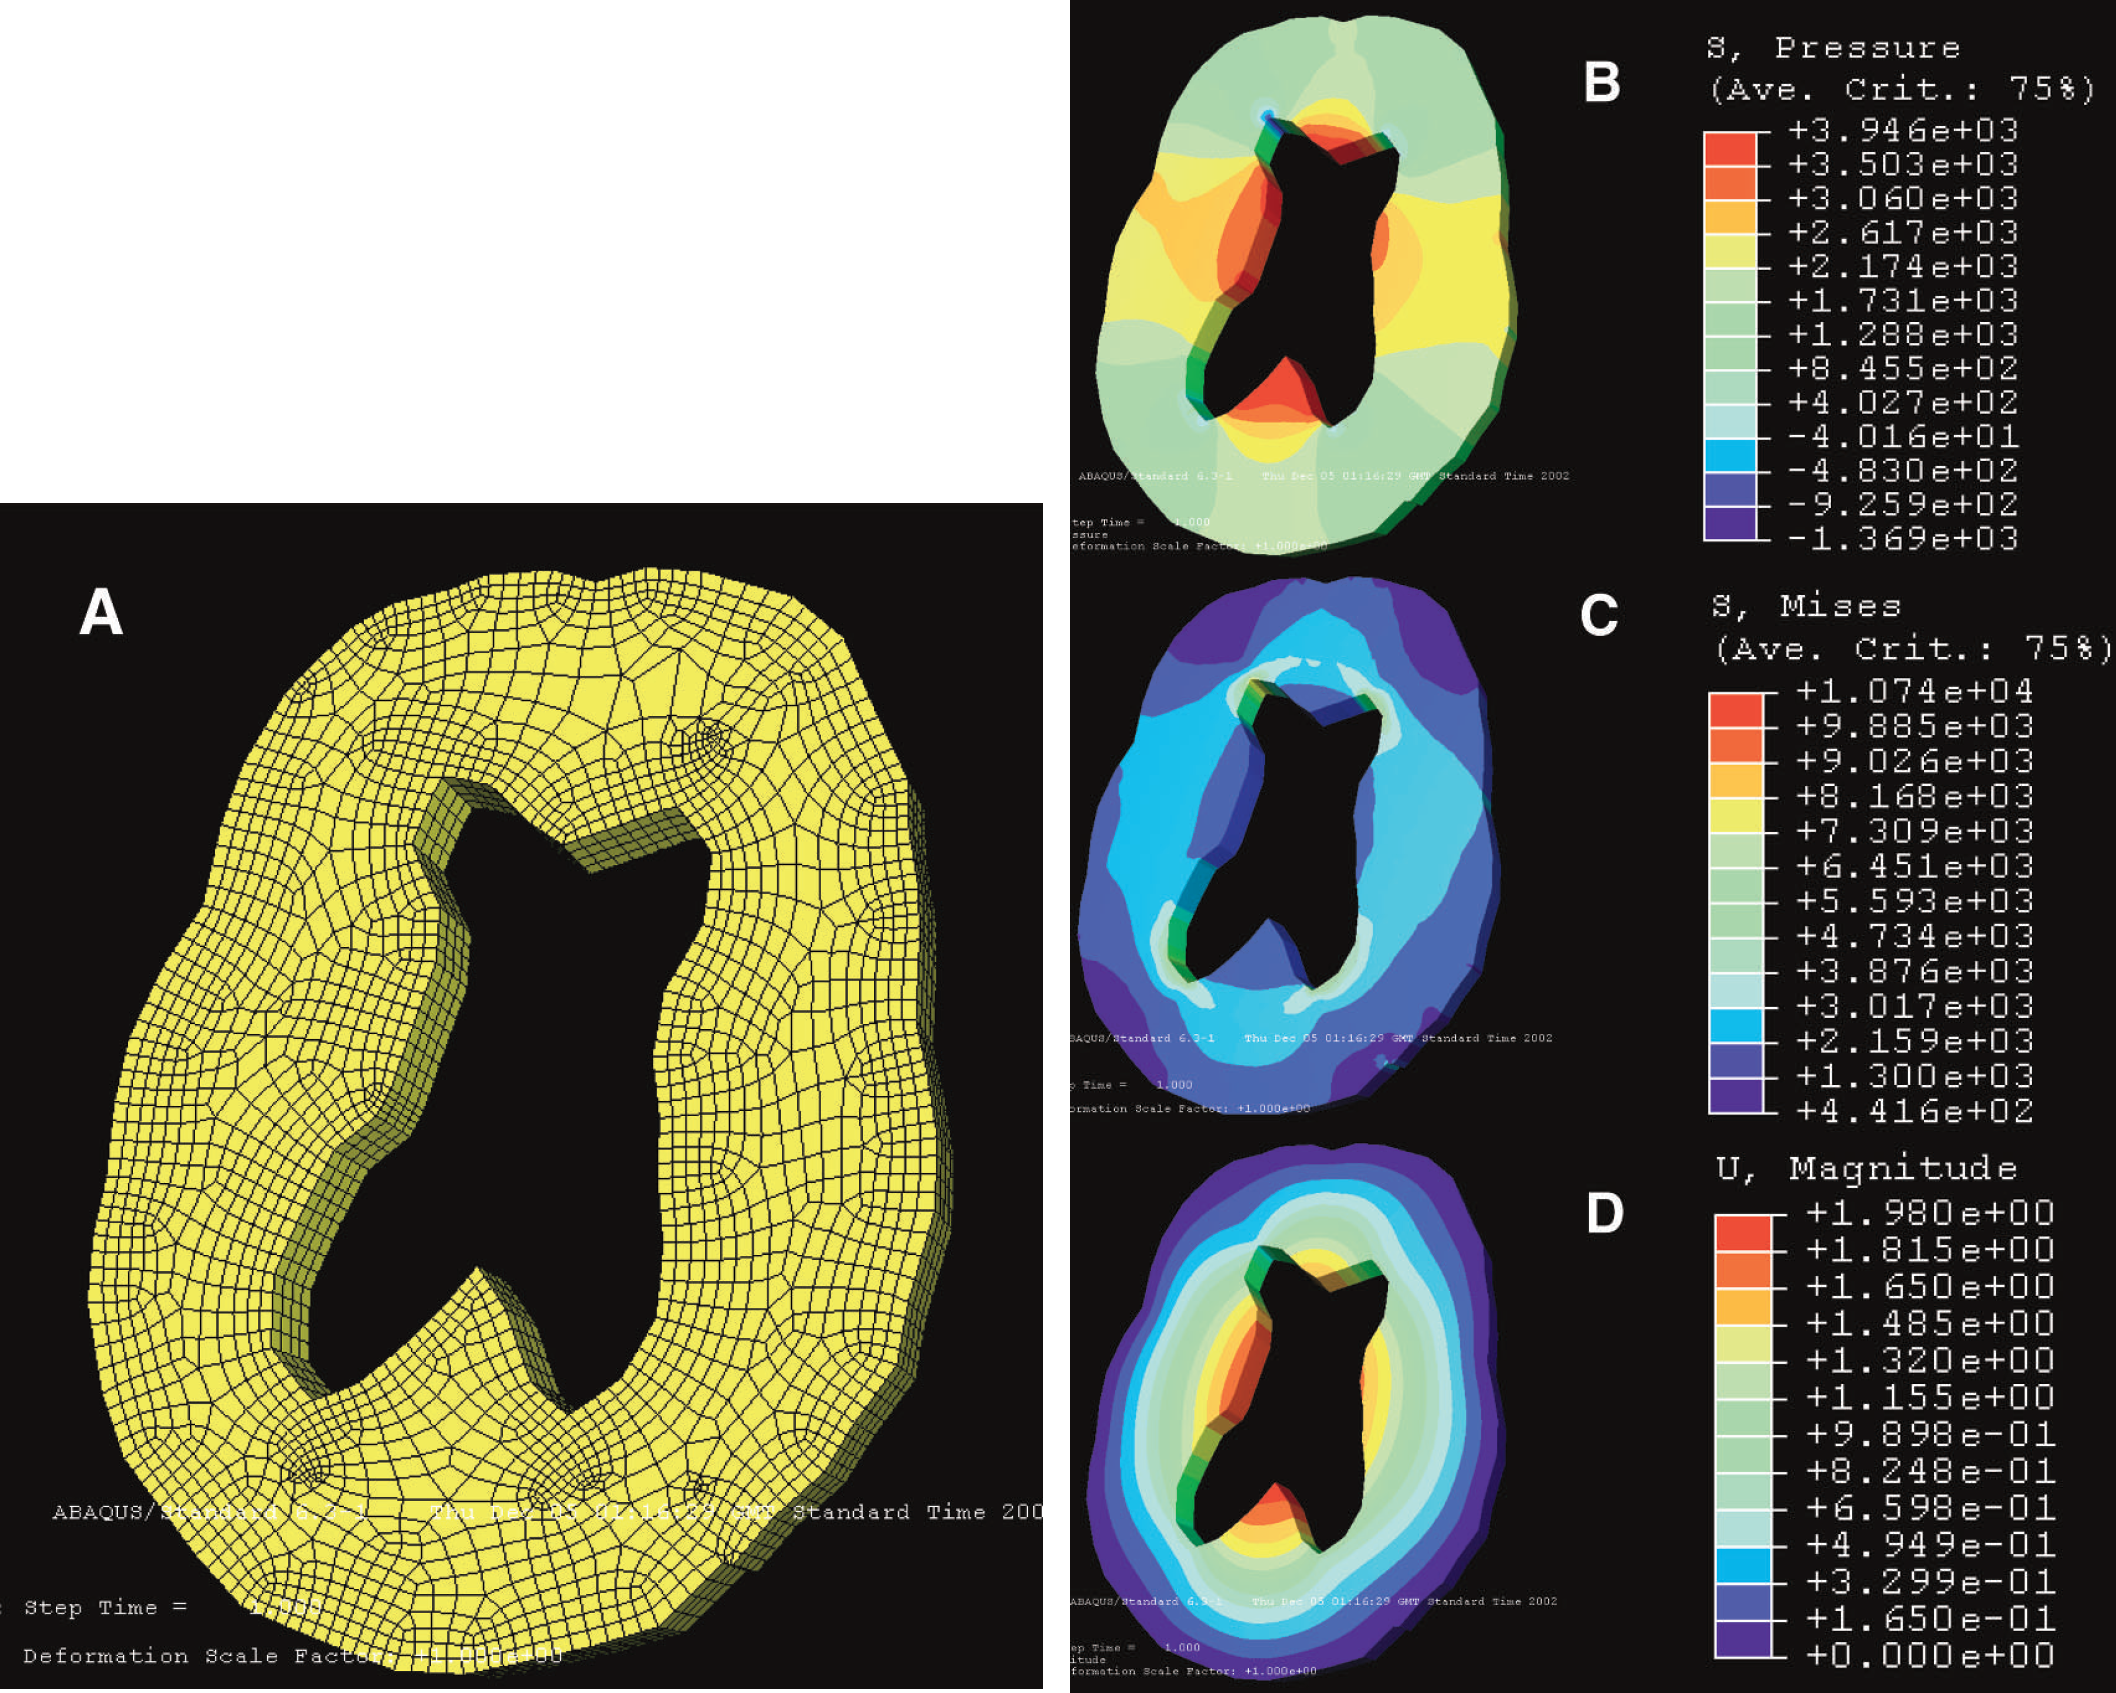
Results of the FE analysis modeling of changes that occur during CSF infusion. (A) The three-dimensional FE mesh was constructed using an automatic mesh generator. The mesh is composed of 2,318 nodes and 2,154 elements. The geometry of the mesh was based on the MR of a representative NPH patient. The changes in CSF pressure that took place during the CSF infusion study performed in this patient were then modeled. (B) Mean pressure experienced by the brain parenchyma is maximal in the corpus callosum and region of the basal ganglia, but is low or even negative at the region of the frontal horns. (C) In contrast, shear (von Mises) stress is maximal at the frontal and occipital horns. (D) The result of the CSF infusion study is that the displacement of the brain parenchyma appears maximal around the body of the lateral ventricles and corpus callosum, though the magnitude is actually very small (>2 mm).
Mean stress was distributed throughout the brain during CSF infusion. The location in which the mean stress (p), indicating compression, was maximal was the region of the thalamus and corpus callosum (approximately 2.5 kPa), with a smaller increase in the cortical regions (approximately 1 kPa) and the smallest increase occurring in the regions around the ventricular horns (approximately 0.5kPa). The white matter surrounding the ventricular horns was the site of maximal Von Mises shear stress (approximately 3kPa), and the smallest shear stresses were in the cortical regions (approximately 0.7 kPa).
Change in CPP
The MABP was measured in 10 patients throughout scanning. There was a small but significant (P = 0.005) increase in MABP of 8.2 ± 3.6 mm Hg from baseline to equilibrium ICP, consistent with the Cushing response. However, because the increase in ICP was higher than the increase in MABP, the CPP was still significantly decreased during CSF infusion by 14.0 ± 8.8 mm Hg (Table 2). There was a strong correlation between change in ICP and change in CPP (R = −0.95; P>0.00005) and between Rcsf and change in CPP (R = −0.83; P>0.01). There was no correlation between change in MABP and change in CPP.
Changes in ICP, MAP, and CPP and PaCO2 during CSF infusion
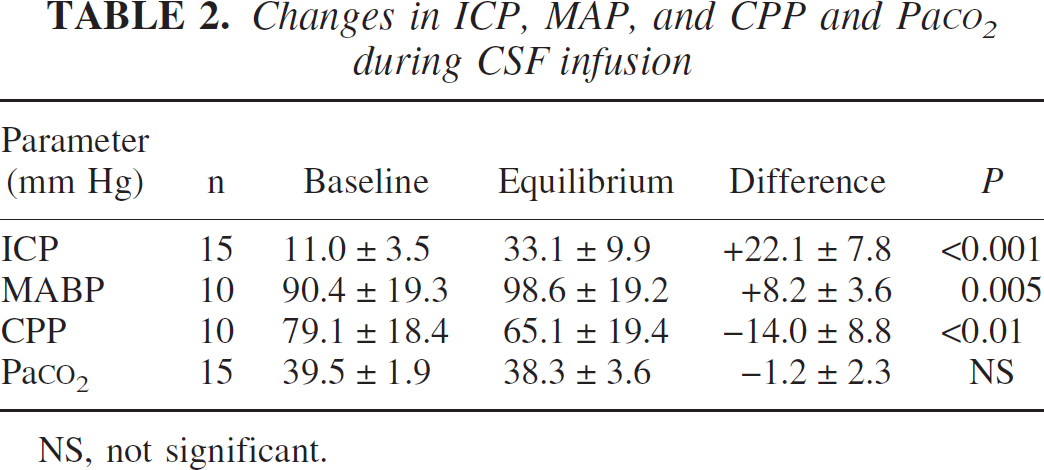
NS, not significant.
Changes in PaCO2
Mean PaCO2 was not significantly different when comparing baseline and equilibrium values (39.5 ± 1.9 mm Hg versus 38.3 ± 3.6 mm Hg). There were no correlations between the change in PaCO2 and change in CBF values for any ROI (Table 2).
Changes in global CBF
Significant changes in CBF were found in the cerebrum and the cerebellum (Table 3). For the cerebrum, 12 of 15 patients had a decrease in CBF of >5%, one patient had no change, and 2 patients showed a small increase. The difference in CBF between baseline and equilibrium ICP was significant (P>0.01) and correlated with the measured Rcsf (R = −0.82; P>0.0005) (Figure 5a) and with the change in ICP (R = −0.57; P>0.05) but not with the change in CPP or MABP.
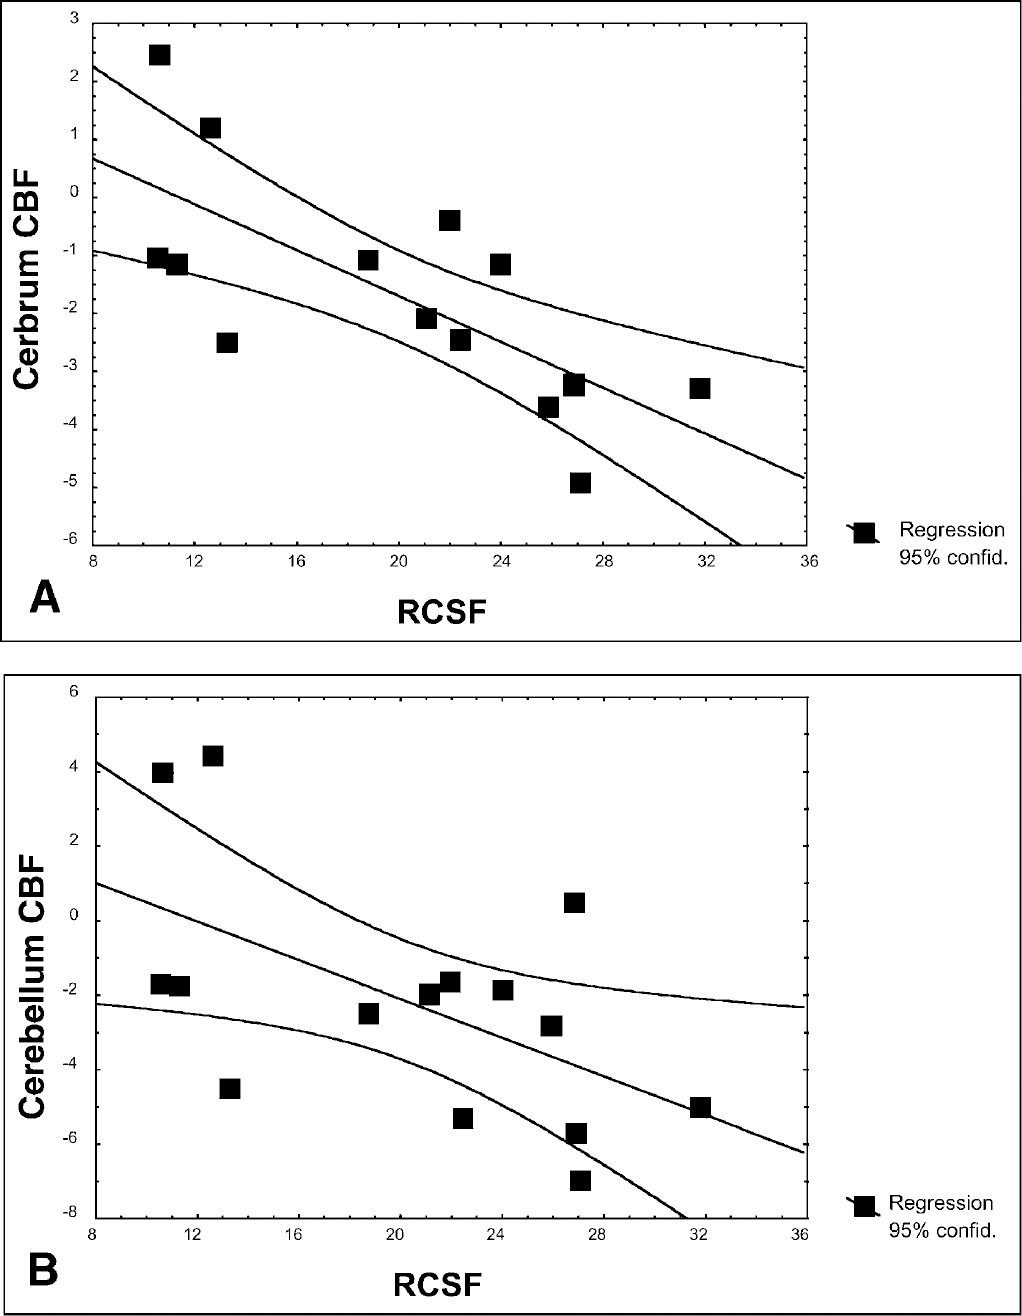
(A) Correlation between Rcsf and decrease in CBF of the cerebrum (R = −0.82; P>0.0005). In patients with a high Rcsf value, the change in ICP and CPP was greatest and CBF values decreased. In patients with a normal or high-normal Rcsf value, changes in ICP and therefore CPP were more difficult to achieve. (B) A similar but less significant correlation between Rcsf and the change in CBF of the cerebellum (R = −0.64; P>0.05) was observed.
Changes in CBF for the cerebrum and cerebellum
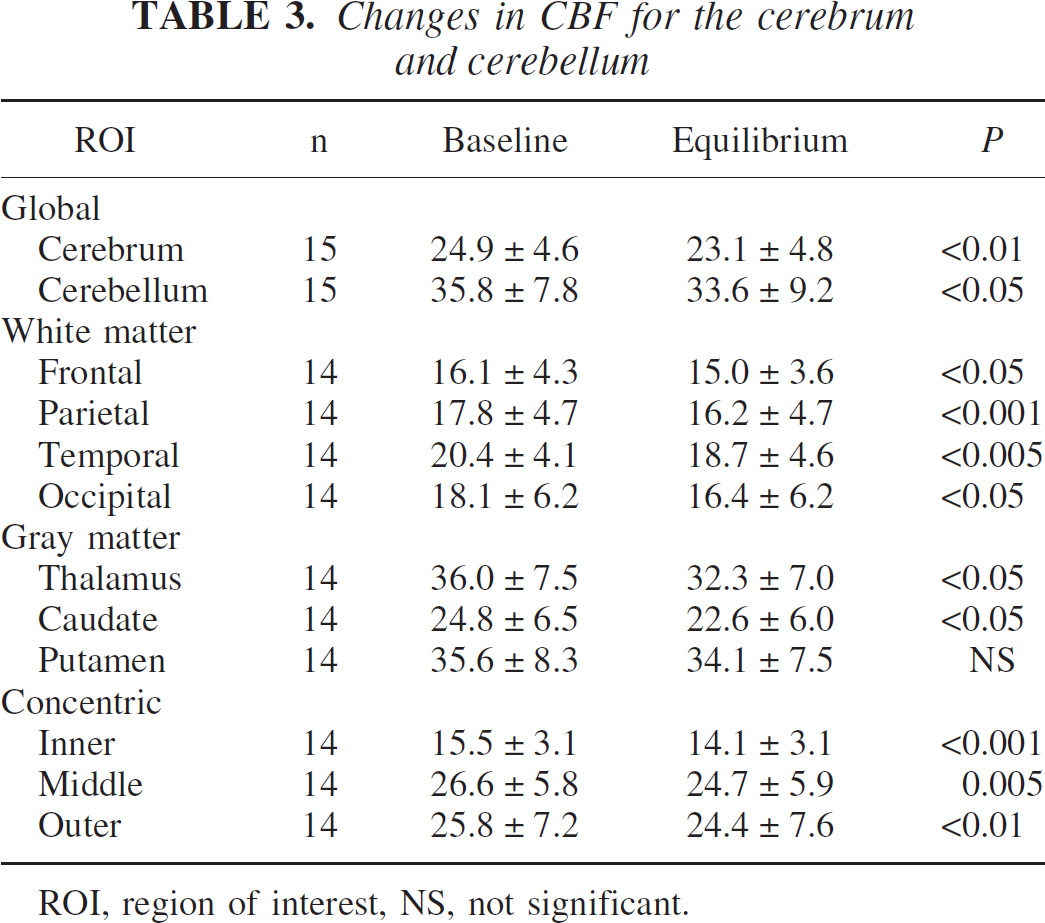
ROI, region of interest, NS, not significant.
In the cerebellum, mean CBF was significantly (P>0.05) decreased during CSF infusion. However, regarding individual patients, two patients changed by >5% and two had increases of <5%. The change in CBF was correlated with the measured Rcsf (R = −0.64; P>0.05) (Figure 5b) but not with the change in ICP, CPP, or MABP.
Examination of the CSF infusion study results of the patients who showed an increase rather than decrease in CBF during CSF infusion were those with high-normal Rcsf.
Changes in anatomical regional CBF
For the white matter anatomical ROIs, there were significant decreases in mean CBF for all four regions (Table 3). These regions all showed significant correlation between Rcsf and the decrease in CBF (P>0.05; −0.68 > R > −0.56). There was no correlation between change in ICP, MABP, or CPP and CBF in any white matter region. There was no correlation between the degree of white matter hyperintensities and the change in CBF.
Mean CBF in the thalamus and the head of the caudate nucleus were both significantly lower during CSF infusion. However, there was no significant difference in CBF found in the putamen (Table 3). The change in CBF for the thalamus was significantly correlated with Rcsf (R = −0.59; P>0.05) but not with MABP. The change CBF in the caudate was significantly correlated with change in MABP (R = −0.68; P>0.05) but not with Rcsf. There were no correlations between changes in CBF and change in ICP or CPP.
Changes in concentric ROI CBF
There were significant decreases in mean CBF for each of the three concentric type ROIs during CSF infusion (Table 3). The changes in CBF were correlated with Rcsf and ICPend for all three ROIs. These correlations were closest for the inner ROI and decreased toward the outer ROI. Changes in ICP were also correlated with change in CBF for the inner and middle ROIs but not the outer (Table 4).
Correlations between changes in CBF of concentric ROIs and Rcsf, ICP, and CPP during CSF infusion
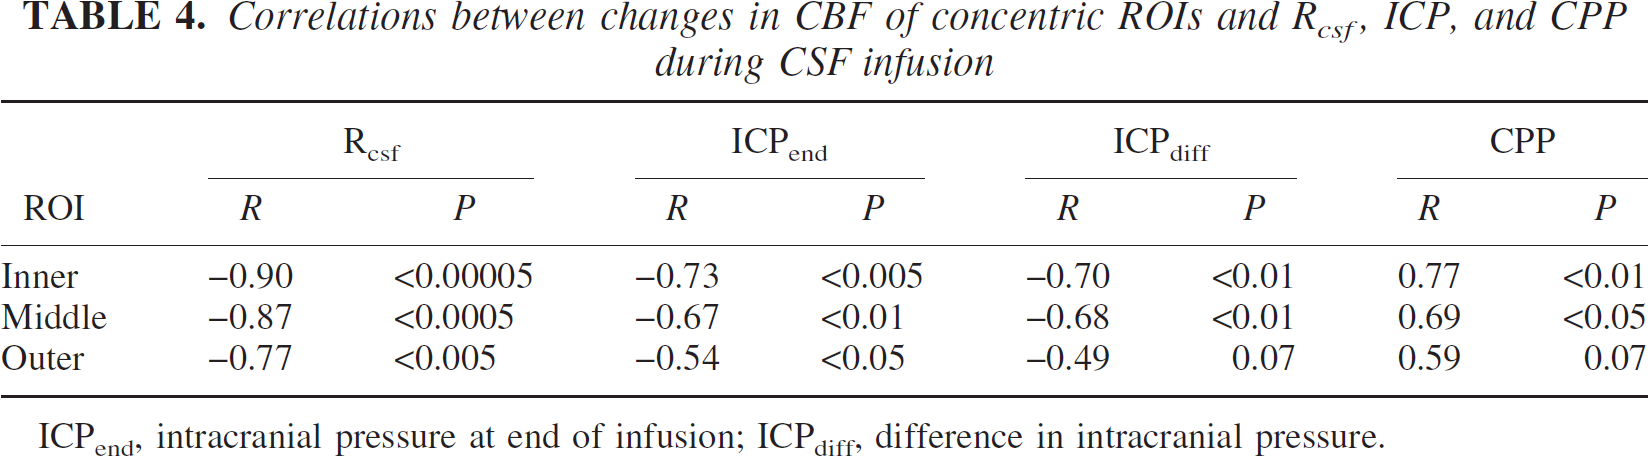
ICPend, intracranial pressure at end of infusion; ICPdiff, difference in intracranial pressure.
Response to shunting
Nine of the 15 patients were treated using a ventriculoperitoneal shunt. Six patients responded to shunting whereas three did not. The CSF compensatory parameters, changes in MABP and CPP, and changes in CBF during CSF infusion studies were compared between the shunt responders and nonresponders. The mean Rcsf was higher in patients who responded to shunting (22.7 ± 7.5 versus 16.6 ± 8.1 mm Hg · mL−1 · min−1) but there were no statistically significant differences between the two groups of patients given the small numbers.
DISCUSSION
This study is unique in its approach to studying the dynamic characteristics of the cerebral vasculature in patients with NPH. Most studies aimed at investigating the state of the cerebral vasculature of patients with NPH measured CBF at rest (Owler and Pickard, 2001) The combination of the computerized CSF infusion study and measurement of CBF using 15O-water PET scan has allowed us to manipulate CSF pressure in order to assess the response of the cerebrovascular system to changes in ICP. It should be emphasized that the aim of the study was to examine the dynamic characteristics of the cerebral vasculature in patients with NPH rather than to replicate the increases ICP that may be observed on ICP recordings in NPH such as B waves, because the source of increased ICP in these situations is often the cerebral vasculature itself.
Cerebral pressure autoregulation may be defined as the ability of the cerebrovascular system to maintain a constant CBF during changes in CPP. Other investigators have not been able to assess pressure autoregulation directly but have studied cerebrovascular reactivity; that is, metabolic autoregulation. Klinge et al. (1999) and Chang et al. (2000) have both studied cerebrovascular reactivity using the administration of intravenous acetazolamide. Klinge et al. used PET without MR coregistration, whereas Chang et al. used 99mTc-HMPAO SPECT before and after administration of acetazolamide and found that the response to acetazolamide was decreased in patients with NPH. Lee et al. (1998), using transcranial Doppler of the middle and anterior cerebral arteries to measure cerebrovascular reactivity after inhalation of 5% CO2, found that cerebrovascular reactivity was also decreased in patients with NPH.
We chose to measure CBF using 15O-water PET because it provides whole-brain coverage, allows accurate measurement of CBF in both deep and superficial structures, and because the measurements are obtained during a steady-state period. In addition, maps of CBF could be coregistered to MR images, allowing accurate identification of anatomical structures. The method of defining the ROIs in this article avoids the pitfalls of applying a “normal” anatomical template to the grossly abnormal hydrocephalic brain. Partial volume contamination, particularly bordering the ventricle, is a potential source of error. However, the effects of such partial volume contamination of the CBF values are probably minimal because of the methods used, the relatively high resolution of the PET images, and the number of voxels involved compared with the total number each slice. The regional analysis is less prone to such partial-volume effects as the ROIs were placed away from the tissue boundaries. Most importantly, potential errors due to partial voluming and the definition of ROIs are minimized by using the subjects as their own controls; the issue in this study is not the absolute CBF but the change in CBF.
An obvious concern with this study is whether baseline and infusion CBF maps of individual patients are comparable. During the CSF infusion, the increase in CSF pressure may change the size and shape of the ventricles. Therefore we performed a three-dimensional FE analysis and studied the morphological changes that may occur during CSF infusion. The results suggest that small changes in the size and shape of the lateral ventricles do occur, but that they are small (>2 mm) and located in the region of the body of the lateral ventricles and around the corpus callosum. Changes in the geometry of the brain of this magnitude during CSF infusion are accounted for by the coregistration process because the CBF maps are coregistered to the same MR volume for each patient. In addition, most ROIs are located well away from the ventricular system and therefore not affected. Finally, manual inspection of the CBF maps shows that there are no gross differences in the morphology between the images that may account for the measured differences in CBF between the baseline and infusion CBF measurements.
Using the CSF infusion study, we were able to increase CSF pressure in a controlled fashion and maintain CSF pressure at a higher equilibrium pressure. The changes in CSF pressure were such that the new equilibrium pressure was significantly different from the baseline CSF pressures. The Rcsf is equal to the difference in equilibrium and baseline CSF pressures divided by the rate of infusion. In using the CSF infusion study to alter ICP, the patients with high Rcsf will show the largest change in ICP, and therefore generally CPP, for a given infusion rate. This is evidenced by the correlation between Rcsf and the change in CPP. A lower rate of infusion (0.5 mL/min) was used in some patients to prevent ICP from becoming too high. Patients with normal or high-normal Rcsf will exhibit a relatively small change in ICP, and therefore CPP, for a given infusion rate. Thus, the autoregulatory capacity of patients with a normal Rcsf is not tested using such a study. This would explain the reason for the lack of change in global CBF in the patients with normal Rcsf (Czosnyka et al., 1999, 2002).
The mechanism responsible for the observed reduction in mean CBF during CSF infusion was examined. We performed the “concentric ROI” analysis to assess whether the reduction in CBF during CSF infusion was related solely to the proximity from the lateral ventricle. Because these ROIs were drawn above the level of the thalamus, the majority of the inner ROI consists of periventricular white matter. The middle and outer ROIs contain a mixture of white matter and cerebral cortex. A significant decrease in mean CBF was observed for all three ROIs. This correlated with the Rcsf and the ICPend. The strength of the correlation was greatest for the inner ROI and decreased to the outer ROI. In addition, the change in CPP and ICP was correlated to the decrease in CBF for the inner and middle ROIs but not for the outer ROI. This suggests that there is a relationship between the proximity to the ventricles and the decrease in CBF. This is consistent with the results of the FE analysis, which suggests that the mean stress as well as shear stress are maximal in regions closest to the ventricle and are lowest in the cortical regions. These findings suggest that increases in CSF pressure cause a reduction in CBF by direct compression of the cerebral tissues. An alternative explanation may be that infusion of mock CSF into the ventricular system of patients with NPH may cause an increase in the transependymal seepage of CSF into the parenchyma. The ependyma of the lateral ventricles is often disrupted in patients with hydrocephalus, and transependymal CSF absorption is a likely alternative pathway for CSF absorption in patients with NPH. Increased intraparenchymal fluid may result in compromise of CBF. This would also be consistent with the finding that there was relatively poor correlation between changes in ICP, CPP, or MABP and the change in CBF compared with the relationship between Rcsf and the change in CBF.
The baseline CBF values for our patients were compared with normal controls in a previous report (Owler et al., 2004) and were shown to be significantly reduced. The relatively small reduction in CBF in response to the increase in CSF pressure during CSF infusion may be significant. Such increases in CSF pressure during B-wave activity, for example, are due to an increase in cerebral blood volume. Changes in CBF secondary to changes in CSF pressure may result in ischemic stress on tissues in an already precarious state. In patients with disturbed autoregulation, this may be even more so as CBF changes passively with CPP.
The number of patients in this study is insufficient to comment on the importance of cerebrovascular autoregulation for predicting the outcome after shunting. The only difference between shunt responders and nonresponders was the Rcsf, which was higher in the former group.
CONCLUSIONS
We have been able to directly measure cerebral pressure autoregulation in patients with NPH using a combination of a computerized CSF infusion study and 15O-water PET scanning with MR coregistration. In patients in whom CBF changed, we found a relationship between CBF change and proximity to the lateral ventricles that is consistent with the location of mean and shear stress within the brain as shown by FE analysis. The importance of changes in CBF with changes in ICP, and the implications for shunt outcome, will be made clearer with further studies and correlation with clinical outcomes.