Detection of cerebral hypoxia–ischemia remains problematic in neonates. Near-infrared spectroscopy, a noninvasive bedside technology has potential, although thresholds for cerebral hypoxia–ischemia have not been defined. This study determined hypoxic–ischemic thresholds for cerebral oxygen saturation (Sco2) in terms of EEG, brain ATP, and lactate concentrations, and compared these values with CBF and sagittal sinus oxygen saturation (Svo2). Sixty anesthetized piglets were equipped with near-infrared spectroscopy, EEG, laser-Doppler flowmetry, and a sagittal sinus catheter. After baseline, Sco2 levels of less than 20%, 20% to 29%, 30% to 39%, 40% to 49%, 50% to 59%, 60% to 79%, or 80% or greater were recorded for 30 minutes of normoxic normocapnia, hypercapnic hyperoxia, or bilateral carotid occlusion with or without arterial hypoxia. Brain ATP and lactate concentrations were measured biochemically. Logistic and linear regression determined the Sco2, CBF, and Svo2 thresholds for abnormal EEG, ATP, and lactate findings. Baseline Sco2 was 68 + 5%. The Sco2 thresholds for increased lactate, minor and major EEG change, and decreased ATP were 44 ± 1%, 42 ± 5%, 37 ± 1%, and 33 ± 1%. The Sco2 correlated linearly with Svo2 (r = 0.98) and CBF (r = 0.89), with corresponding Svo2 thresholds of 23%, 20%, 13%, and 8%, and CBF thresholds (% baseline) of 56%, 52%, 42%, and 36%. Thus, cerebral hypoxia-ischemia near-infrared spectroscopy thresholds for functional impairment are Sco2 33% to 44%, a range that is well below baseline Sco2 of 68%, suggesting a buffer between normal and dysfunction that also exists for CBF and Svo2.
Hypoxic–ischemic brain damage in neonates represents an important health issue because of their long life expectancy (Vannucci and Perlman, 1997; Vohr et al., 2000). Despite many advances in neonatology during the past 20 years, detection of cerebral hypoxia–ischemia remains problematic (Hill and Volpe, 1999). Noninvasive bedside techniques, including neurologic examination, transcranial-Doppler sonography, and EEG are insensitive or nonspecific for the immature brain. Neonates at risk for hypoxic–ischemic brain damage are usually critically ill. Monitoring jugular bulb oxyhemoglobin saturation (Sjo2) or CBF with magnetic resonance imaging, positron emission tomography, or xenon radiography is impractical. At present, cerebral hypoxia–ischemia is diagnosed after the fact by history and radiologic studies (Hill and Volpe, 1999; Vannucci and Perlman, 1997). A technology to diagnose this condition at the bedside might allow treatment before brain damage ensues.
Near-infrared spectroscopy (NIRS) is a relatively new, noninvasive optical technology to monitor cerebral oxygenation. It relies on the relative transparency of biologic tissues to near-infrared light (700–900 nm) where oxyhemoglobin, deoxyhemoglobin, and cytochrome aa3 have distinct absorption spectra (Wray et al., 1988). Because the hemoglobin monitored by NIRS is located in the tissue circulation (venules, capillaries, and arterioles) and because cytochrome aa3 is located in neurons, oxygenation status monitoring can indicate cerebral hypoxia-ischemia (Nioka et al., 1990; Springett et al., 2001; Watzman et al., 2001). However, it is technically easier to monitor hemoglobin oxygenation than cytochrome aa3 oxygenation. The NIRS indices of hemoglobin oxygenation include cerebral hemoglobin oxygen saturation (Sco2), oxydeoxyhemoglobin concentration difference, and tissue oxygenation index (Brun et al., 1997; Fantini et al., 1999; Springett et al., 2001; Tsuji et al., 1998; Watzman et al., 2000).
Previous studies using NIRS in neonates at risk of hypoxic–ischemic brain damage have observed episodes of decreased cerebral hemoglobin oxygenation (Kurth et al., 2001; Tsuji et al., 2001; VanBel et al., 1993; Wyatt et al., 1986). However, NIRS use in clinical care has been hampered by the lack of oxygenation thresholds to detect hypoxia–ischemia for prognostic and therapeutic purposes. In adults, CBF and Sjo2 have been used to detect cerebral ischemia using threshold values to mark functional and structural neurologic impairment (Heiss, 2000; Hossmann, 1994; Schell and Cole, 2000). As CBF and Sjo2 decrease, functional activity of the brain becomes impaired first, followed by loss of structural integrity and tissue damage. Functional activities include protein synthesis, lactate, EEG activity, ATP, and cell membrane potential, for which CBF and Sjo2 thresholds exist to mark change in each. We hypothesized the existence of functional thresholds for NIRS hemoglobin oxygenation. The present study sought to determine hypoxic-ischemic thresholds for NIRS Sco2 in terms of EEG, brain tissue ATP, and lactate concentrations, and compared these values with CBF and cerebral venous oxygen saturation (Svo2) in piglets.
MATERIALS AND METHODS
Surgical preparation
After approval by the Institutional Animal Care and Use Committee at the Joseph Stokes Jr. Research Institute, 60 5- to 10 day-old piglets weighing 2.1 to 3.8 kg were studied. Anesthesia was induced with intramuscular ketamine (33 mg/kg) and acepromazine (3.3 mg/kg) and maintained with intravenous fentanyl (25 μg/kg bolus, 10 μg · kg−1 · h−1) and droperidol (0.25 mg · kg−1 · h−1). Catheters were inserted into the femoral vessels to administer drugs and monitor arterial pressure (PXL; Stathum, Waltham, MA, U.S.A.), blood gases, pH, and hemoglobin concentration (iSTAT; iSTAT, Princeton, NJ, U.S.A.), and into the superior sagittal sinus to sample blood for Svo2 282 CO-Oximeter; (Instrumentation Laboratories, Lexington, MA, U.S.A.). Through a midline neck incision, the trachea was cannulated and lungs were mechanically ventilated with room air at normocapnia. The common carotid arteries were exposed and encircled with ligatures. Piglets were maintained normothermic during the study.
After the head was secured, the scalp was reflected to expose the skull. An EEG (Gould Instrument Systems, Valley View, OH, U.S.A.) was recorded from 3 electrodes pasted on the skull over the left hemisphere. A 4-mm diameter hole was created in the skull between the positive and negative EEG electrodes, through which a laser-Doppler flow probe was set on the dura to monitor CBF (Laserflo BPM2; Vasamedics, St. Paul, MN, U.S.A.). The laser-Doppler device used 800-nm light and interrogates approximately 1 mm3 tissue beneath the probe. The cerebral oximeter emitter and detector optical fibers (Near Infrared Monitoring, Philadelphia, PA, U.S.A.) were set on the skull 3 cm apart over the right hemisphere, opposite the positive and negative EEG electrodes, to determine Sco2. The NIRS views approximately 1 cm3 banana-shaped tissue between emitter and detector. In piglets, the thin skull does not interfere with NIRS brain monitoring (Kurth et al., 1993). The spatial separation between the laser Doppler and NIRS prevented cross talk.
Protocol
Piglets were randomly assigned to one of seven groups to experience Sco2 of 80% or greater, 60% to 80%, 50% to 59%, 40% to 49%, 30% to 39%, 20% to 29%, or less than 20%. Selection of these Sco2 ranges (? 10%) was based on cerebral oximeter precision (± 5%) and the ability to maintain Sco2 within this range during the protocol. After group assignment, EEG, CBF, and Sco2 were recorded for 10 minutes to establish the baseline level before proceeding to the targeted Sco2. The targeted Sco2 was achieved with hyperoxic hypercapnia (inspired 95:5 oxygen:carbon dioxide), normoxic normocapnia (continued at baseline), or bilateral carotid artery occlusion with or without arterial hypoxia (inspired oxygen, 10%–18%). Arterial blood gases and pH were recorded at baseline and end of the protocol. It took 5 to 10 minutes after intervention initiation to achieve the targeted Sco2. After 30 minutes at the targeted Sco2, cortical tissue was obtained for lactate and ATP concentrations, and the animals were killed with intravenous pentobarbital (100 mg/kg).
Near-infrared spectroscopy
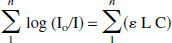
By monitoring light-intensity signals at several wavelengths where oxyhemoglobin and deoxyhemoglobin have different absorption coefficients, it is possible to determine oxyhemoglobin and deoxyhemoglobin concentrations through an expression based on the principles of the Beer Law,
where Io and I are the emitted and detected light intensities, L represents the path length of light through the tissue, C the concentration of the compound, e the extinction coefficient of the compound, and n is the number of wavelengths of the light being used. In the brain, the main absorbing compounds in the near-infrared spectrum are oxyhemoglobin and deoxyhemoglobin and, to a lesser extent, water and cytochrome aa3 (Wray et al., 1988). The Sco2 is given by
where Hbo2 and Hb represent oxyhemoglobin and deoxyhemoglobin concentrations. The Sco2 is calculated from Eqs. 1 and 2 for three wavelengths to account for oxyhemoglobin and deoxyhemoglobin and the other absorbing compounds (Kurth and Thayer, 1999).
At present, NIRS instrumentation is based on continuous-wave, spatial-domain, frequency-domain, or time-domain technologies (Chance, 1998). In frequency-domain devices, the emitted intensity is oscillated at high frequency. After passing through the tissue, the light is amplified and demodulated. Oxyhemoglobin, deoxyhemoglobin, and Sco2 are determined from the amplitude and phase signals, which account for Io, I, and L in Eq. 1.
In this study, the frequency-domain NIRS consisted of a main unit, emitter, and detector fiberoptic bundles, and a computer. The main unit uses laser diodes at wavelengths of 754, 780, and 830 nm. The laser intensities are oscillated at 120 MHz. The fiberoptic bundles deliver the light to and from the head. The main unit uses homodyne frequency-domain technology to determine amplitude and phase at each wavelength. The computer captures these signals and calculates Sco2 in real time by means of an algorithm. Instrument Sco2 drift is 1%/h and precision is +5% (Kurth and Thayer, 1999).
Brain tissue metabolites
A biopsy gun containing liquid nitrogen was directed through the laser-Doppler flow probe craniotomy hole and neocortical tissue was aspirated into the gun. The frozen tissue was removed and stored in liquid nitrogen until the biochemical assay was performed. Brain tissue ATP and lactate concentrations were determined by the Lucifer-luciferase and lactate dehydrogenase reactions, respectively (Miller and Corddry, 1981).
Electroencephalogram activity
The analogue EEG signal was digitized at 100 Hz with a 12-bit analogue-digital converter (DAQPad 1200; National Instruments, Austin, TX, U.S.A.) and stored on a computer. Epochs of 200 data points (2 seconds) were analyzed by power spectrum analysis and displayed using color-enhanced density spectral array techniques. Data were also displayed using Cartesian (x-y) graphs after averaging 30 consecutive epochs. An EEG expert (W.J.L.) blinded to the Sco2 group assignment analyzed the EEG data. The EEG was categorized relative to baseline as no change, minor change, and major change. Minor change was a reduction in EEG power without change in frequency distribution, or an increase in low-frequency activity without a loss in high-frequency activity. Major change was a loss of both power and high frequency activity, including the development of an isoelectric signal.
Statistical analysis
Data are presented as mean ± SD. Relations between variables were determined by least-squares regression and a Pearson correlation coefficient was calculated. Logistic regression analysis was used to determine Sco2 where 5%, 50%, and 95% of the animals had EEG change or abnormal brain tissue concentrations of ATP and lactate. Abnormal lactate and ATP concentrations were defined by those values outside the 95% confidence intervals for the normoxic normocapnic group. P less than 0.05 was considered statistically significant.
RESULTS
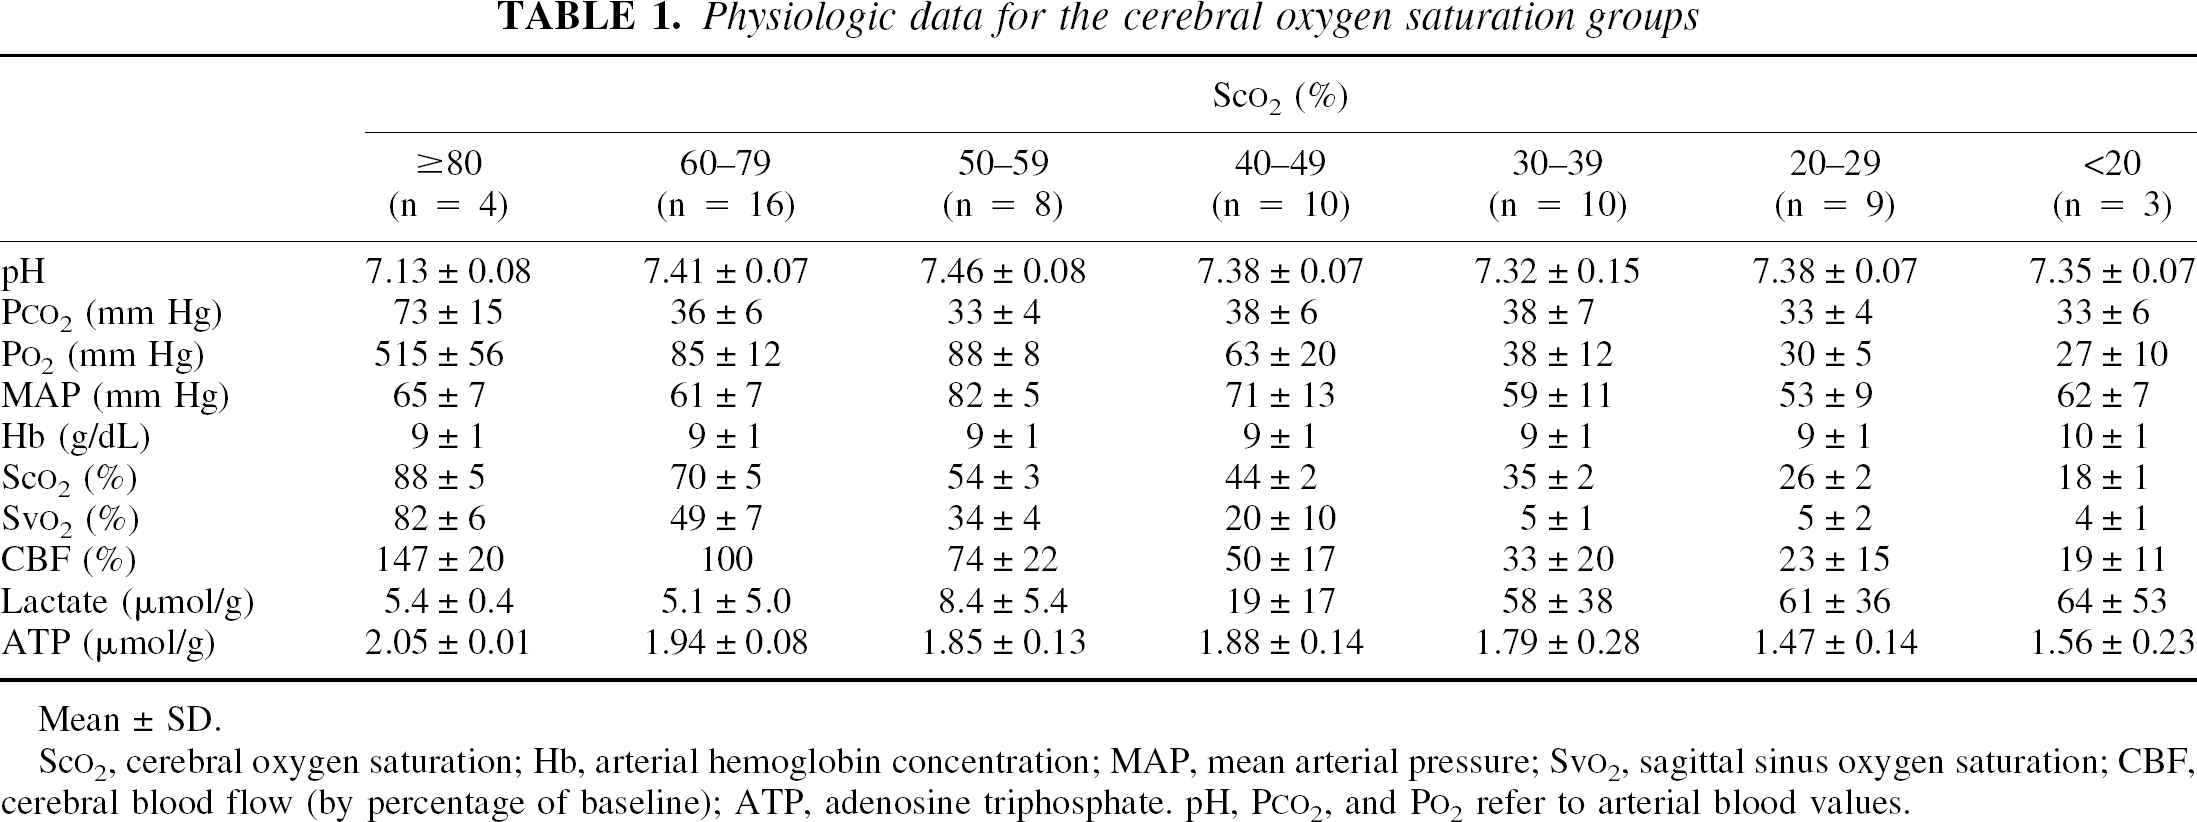
Table 1 displays the physiologic data for the Sco2 groups. Baseline Sco2 for all animals was 68 ± 5%. In the Sco2 80% or greater group, all animals received hyperoxic hypercarbic ventilation to achieve the targeted Sco2. In the Sco2 60% to 80% group, all animals continued at baseline (normoxic, normocarbic ventilation). All animals in the Sco2 50% to 59% group received carotid arterial occlusion. Of the animals in the Sco2 40% to 49% group, six (60%) received only carotid arterial occlusion, and four (40%) received both carotid arterial occlusion and hypoxic gas ventilation. All animals in the Sco2 groups 10% to 19%, 20% to 29%, and 30% to 39% received both carotid arterial occlusion and hypoxic gas ventilation to achieve the targeted Sco2. Technical problems precluded obtaining sagittal sinus blood in 24 piglets.
Physiologic data for the cerebral oxygen saturation groups
Sco2 (%)
≥ 80 (n = 4)
60–79 (n = 16)
50–59 (n = 8)
40–49 (n = 10)
30–39 (n = 10)
20–29 (n = 9)
<20 (n = 3)
pH
7.13 ± 0.08
7.41 ± 0.07
7.46 ± 0.08
7.38 ± 0.07
7.32 ± 0.15
7.38 ± 0.07
7.35 ± 0.07
Pco2 (mm Hg)
73 ± 15
36 ± 6
33 ± 4
38 ± 6
38 ± 7
33 ± 4
33 ± 6
Po2 (mm Hg)
515 ± 56
85 ± 12
88 ± 8
63 ± 20
38 ± 12
30 ±5
27 ± 10
MAP (mm Hg)
65 ± 7
61 ± 7
82 ±5
71 ± 13
59 ± 11
53 ± 9
62 ± 7
Hb (g/dL)
9 ± 1
9 ± 1
9 ± 1
9 ± 1
9 ± 1
9 ± 1
10 ± 1
Sco2 (%)
88 ± 5
70 ± 5
54 ± 3
44 ±2
35 ±2
26 ±2
18 ± 1
Svo2 (%)
82 ± 6
49 ± 7
34 ± 4
20 ± 10
5 ± 1
5 ± 2
4 ± 1
CBF (%)
147 ± 20
100
74 ± 22
50 ± 17
33 ± 20
23 ± 15
19 ± 11
Lactate (μmol/g)
5.4 ± 0.4
5.1 ± 5.0
8.4 ± 5.4
19 ± 17
58 ± 38
61 ± 36
64 ± 53
ATP (μmol/g)
2.05 ± 0.01
1.94 ± 0.08
1.85 ± 0.13
1.88 ± 0.14
1.79 ± 0.28
1.47 ± 0.14
1.56 ± 0.23
Mean ± SD.
Sco2, cerebral oxygen saturation; Hb, arterial hemoglobin concentration; MAP, mean arterial pressure; Svo2, sagittal sinus oxygen saturation; CBF, cerebral blood flow (by percentage of baseline); ATP, adenosine triphosphate. pH, Pco2, and Po2 refer to arterial blood values.
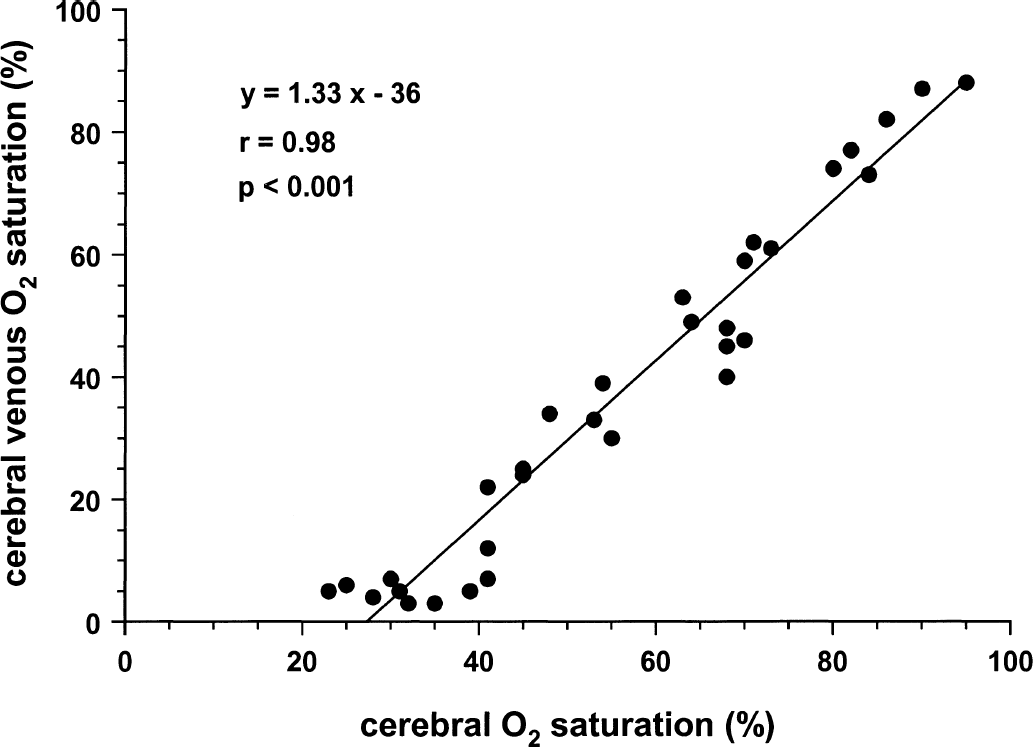
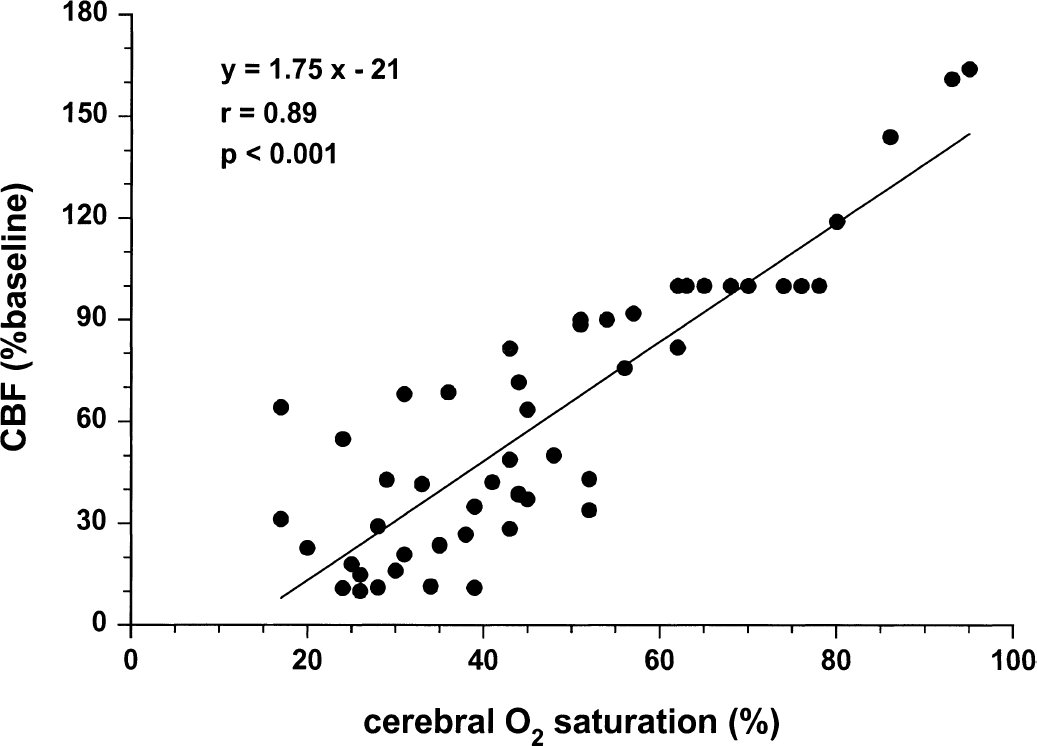
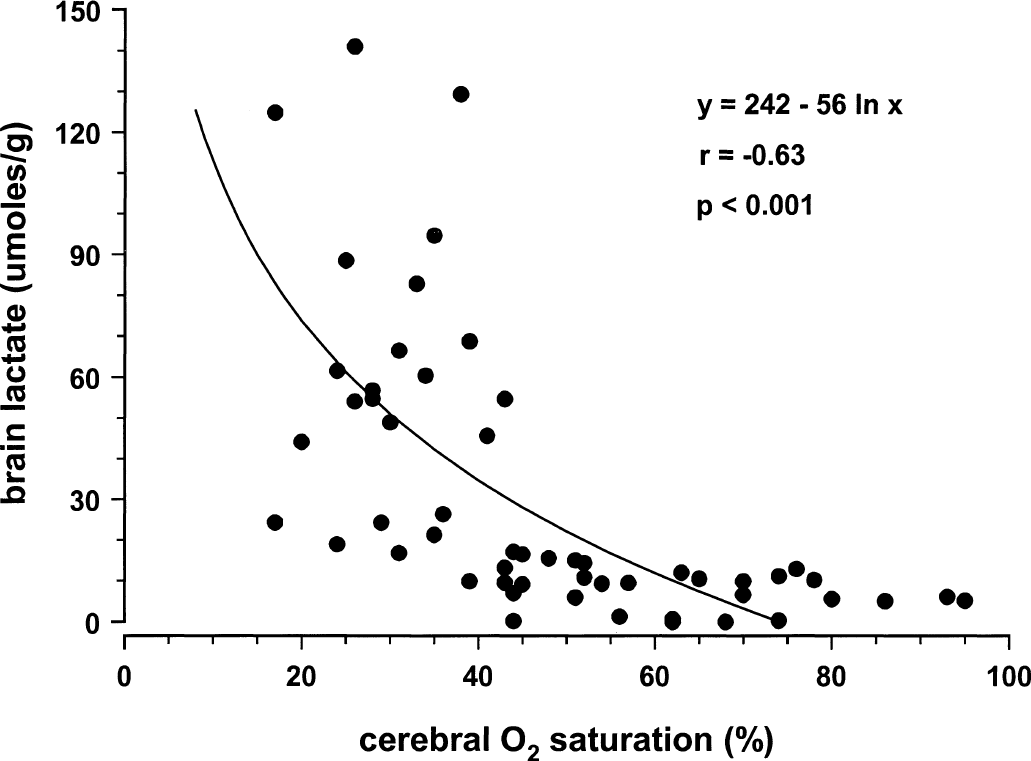
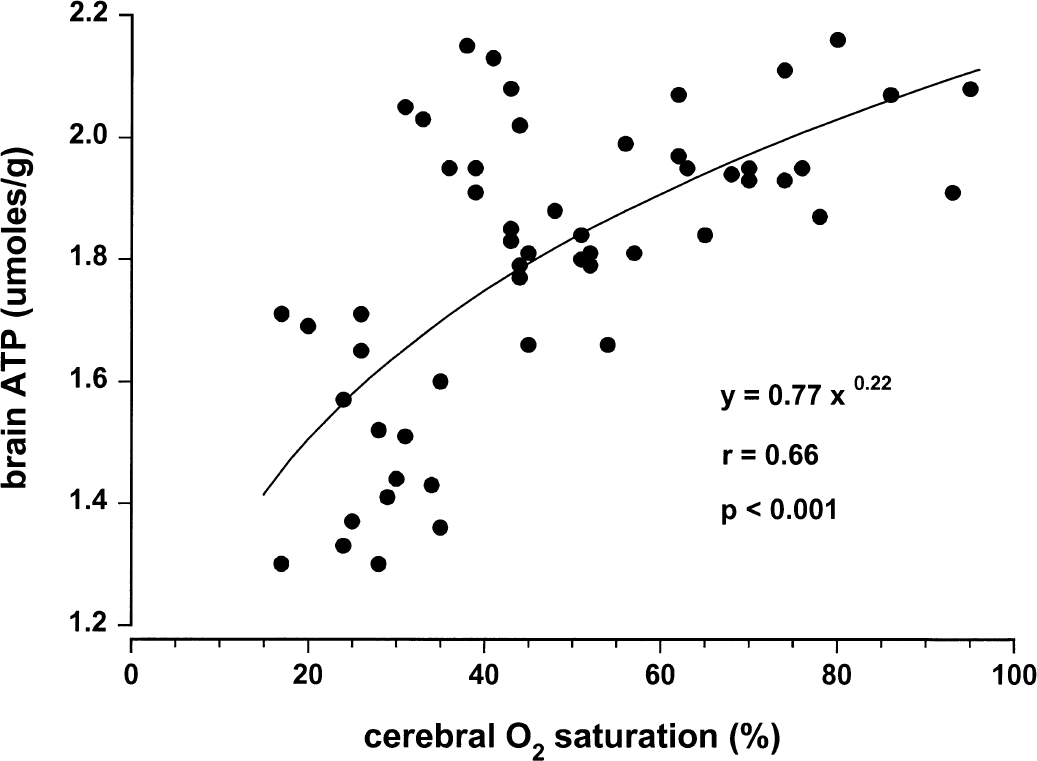
Figures 1 to 4 illustrate statistically significant relations between Sco2 and Svo2, CBF, and brain tissue lactate and ATP concentrations. Linear relations were observed between Sco2 and Svo2 (Fig. 1) and CBF (Fig. 2). Of note, the y-intercepts between Sco2 versus Svo2 and Sco2 versus CBF were significantly less than zero. Curvilinear relations were observed between brain tissue lactate concentration (Fig. 3) and brain tissue ATP concentrations (Fig. 4). For lactate, as Sco2 decreased below 40% to 45%, lactate concentration increased, suggesting a change in cerebral metabolism below this Sco2. For ATP, as Sco2 decreased below 30% to 35%, ATP concentration decreased, suggesting a change in cerebral energy state below this value of Sco2.
Relation between near-infrared spectroscopy Sco2 and Svo2 in piglets.
Relation between near-infrared spectroscopy Sco2 and CBF in piglets.
Relation between near-infrared spectroscopy Sco2 and brain tissue lactate concentration in piglets.
Relation between near-infrared spectroscopy Sco2 and brain tissue ATP concentration in piglets.
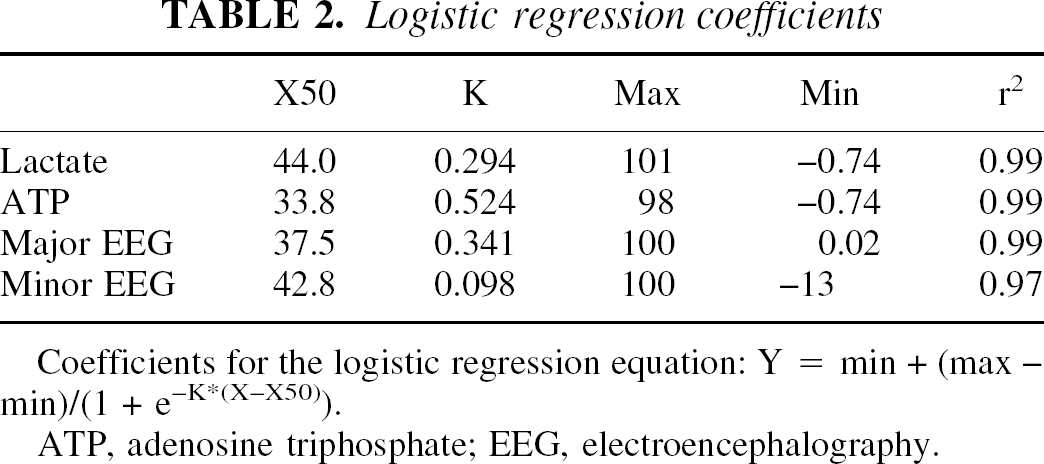
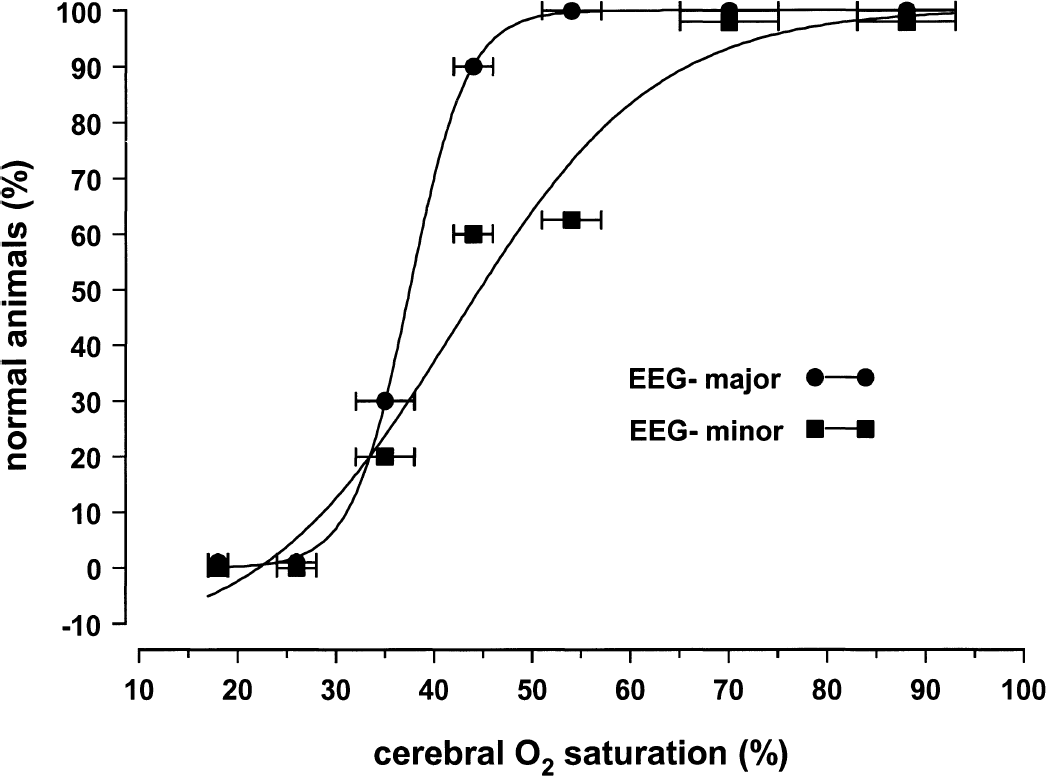
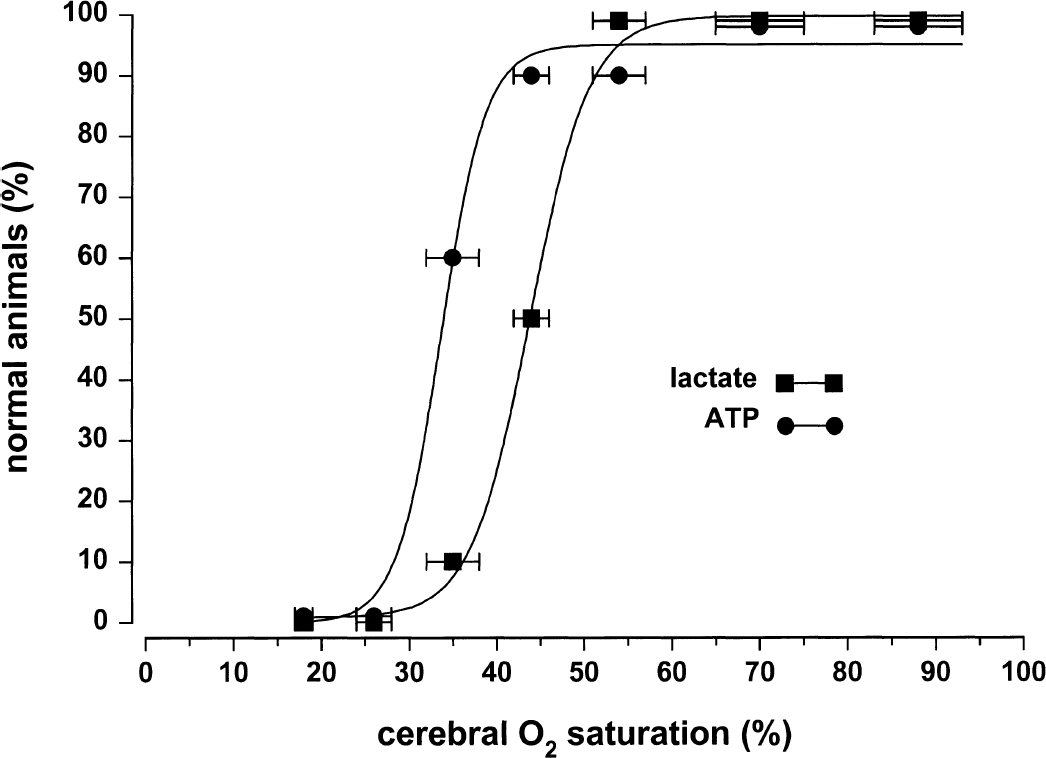
Figures 5 and 6 and Table 2 depict logistic regressions to define changes in cerebral function in terms of EEG activity, abnormal tissue lactate, and ATP concentrations for the population of animals. Normal brain tissue lactate and ATP concentrations were, respectively, 0 to 15 and 1.78 to 2.10 μmol/g tissue (Table 1, 95% confidence intervals for Sco2 60% to 79% group). As Sco2 decreased below 50%, minor EEG changes and abnormally high lactate levels were observed in some animals. As Sco2 decreased below 40%, all animals had minor EEG changes and abnormally high lactate levels, and some animals also had major EEG changes and abnormally low ATP levels. As Sco2 decreased below 30%, all animals had major EEG changes and abnormally low ATP levels.
Logistic regression coefficients
X50
K
Max
Min
r2
Lactate
44.0
0.294
101
−0.74
0.99
ATP
33.8
0.524
98
−0.74
0.99
Major EEG
37.5
0.341
100
0.02
0.99
Minor EEG
42.8
0.098
100
−13
0.97
Coefficients for the logistic regression equation: Y = min + (max - min)/(1 + e−K*(X-X50)).
Logistic regression plot between near-infrared spectroscopy Sco2 and the percent of piglets without minor change in EEG activity or without major change in EEG activity compared with baseline. Data points indicate mean ± SD. Logistic regression equation variables are presented in Table 2.
Logistic regression plot between near-infrared spectroscopy Sco2 and the percent of piglets with normal brain tissue lactate concentrations and normal brain tissue ATP concentrations. Data points indicate mean ± SD. Logistic regression equation variables are presented in Table 2.
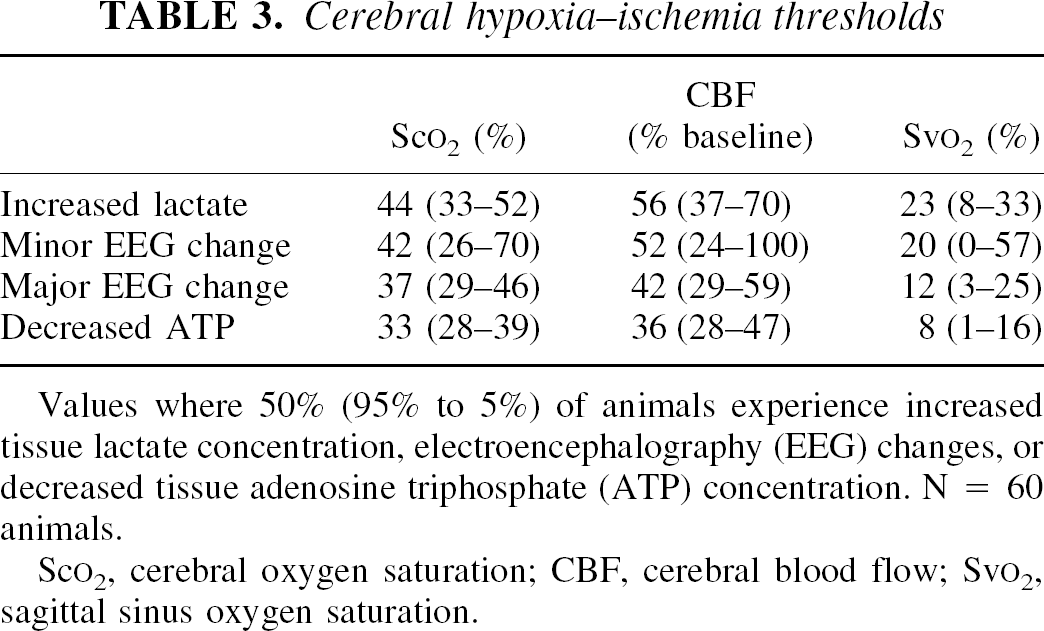
Table 3 displays the Sco2, CBF, and Svo2 thresholds for 50%, 5%, and 95% of animals based on the logistic regression. The thresholds for CBF and Svo2 were calculated from the linear regressions (Figs. 1 and 2) using the Sco2 threshold calculated from the logistic regression. Lactate increases and minor EEG changes occurred first, followed by further reduction in Sco2, CBF, and Svo2 levels, after which major EEG changes occurred and ATP decreased. For 50% of animals, the Sco2 thresholds ranged from 44% (increased lactate) to 33% (decreased ATP), the Svo2 thresholds from 23%(increased lactate) to 8% (decreased ATP), and the CBF thresholds from 56% (increased lactate) to 36% (decreased ATP) of baseline perfusion.
Cerebral hypoxia–ischemia thresholds
Sco2 (%)
CBF (% baseline)
Svo2 (%)
Increased lactate
44 (33–52)
56 (37–70)
23 (8–33)
Minor EEG change
42 (26–70)
52 (24–100)
20 (0–57)
Major EEG change
37 (29–46)
42 (29–59)
12 (3–25)
Decreased ATP
33 (28–39)
36 (28–47)
8 (1–16)
Values where 50% (95% to 5%) of animals experience increased tissue lactate concentration, electroencephalography (EEG) changes, or decreased tissue adenosine triphosphate (ATP) concentration. N = 60 animals.
Detection of cerebral hypoxia–ischemia remains problematic in neonates because neurologic examination findings, CBF, and Sjo2 monitoring are unreliable or impractical (Hill and Volpe, 1999). Although NIRS, a relatively new technology, is suited for this purpose, cerebral oxygenation thresholds for hypoxia–ischemia have not been defined. In adults, CBF and Sjo2 are used to detect cerebral ischemia, by comparing observed and threshold values at which brain function and structure become impaired (Heiss, 2000; Hossmann, 1994; Schell and Cole, 2000). In our study, increased tissue lactate, minor and major EEG changes, and decreased tissue ATP levels were observed at Sco2 values of 44%, 42%, 37%, and 33%, respectively, indicating hypoxic–ischemic thresholds for functional impairment occur at Sco2 values of 33% to 44%. These thresholds were well below baseline the Sco2 at 68%, suggesting a buffer exists between normal and dysfunction, similar to that for CBF and Sjo2.
The classic concept of viability thresholds for cerebral ischemia distinguishes between CBF thresholds for functional neurologic impairment and structural tissue damage. As CBF decreases, functional impairment occurs first and is evident almost immediately after CBF drops below the threshold; structural damage occurs after more severe reductions in CBF and is time dependent (Heiss, 2000). These CBF thresholds, defined in adult animals and humans, vary somewhat with ischemic duration, temperature, and anesthesia. (Hossmann, 1994; Heiss, 2000). Examples of functional impairment include altered brain protein synthesis, lactate concentrations, synaptic activity, ATP concentrations, and membrane potential occurring at CBF reductions of 30% to 50%, 50% to 60%, 60% to 75%, 75% to 85%, and 85% to 90%, respectively (Hossmann, 1994). For structural damage, selective neuronal death and tissue infarction occurs after CBF reductions of 60% to 75% and 80% to 95% for at least 30 minutes (Hossmann, 1994).
In our study, lactate, ATP, and EEG were used to assess functional impairment in which the changes were evident within 30 minutes after Sco2 was decreased. Structural damage was not assessed. However, the CBF thresholds for selective neuronal death and infarction are similar to those for increased lactate and decreased ATP (Hossmann, 1994). Thus, NIRS Sco2 thresholds for structural damage may be similar to those for functional impairment, provided the hypoxia-ischemia is of sufficient duration. The NIRS Sco2 thresholds, like the CBF thresholds, may vary somewhat with ischemic duration, temperature, and anesthesia. For comparison, we calculated CBF thresholds from Sco2 thresholds using the CBF and Sco2 relation (Table 3). These calculations revealed CBF reductions associated with increased lactate, EEG changes, and decreased ATP that were in the same range as those reported in adult models of ischemia (Hossmann, 1994).
Bilateral carotid occlusion alone in piglets decreased CBF by 26% with nonsignificant changes in lactate and ATP concentrations (Table 1). Cerebral vasodilation, increased arterial pressure, and collateral blood flow through the basilar circulation and circle of Willis helped maintain CBF. With superimposed arterial hypoxia, however, arterial pressure decreased, and CBF decreased to a greater extent along with lactate and ATP concentrations. This pressure passive CBF response reflects maximal cerebral vasodilation with bilateral carotid occlusion. Arterial pressure could have fallen during hypoxia from a decrease in cardiac output or systemic vascular resistance.
In adult clinical care, Sjo2 monitoring is often used to detect cerebral ischemia (Schell and Cole, 2000). The Sjo2 thresholds for functional and structural neurologic impairment are not as well defined as for CBF. The Sjo2 values in healthy volunteers range from 55% to 71% (Gibbs et al., 1942). During graded arterial hypoxia in awake human volunteers, major EEG changes occur at Sjo2 below 40%, confusion develops at Sjo2 below 33%, and loss of consciousness at Sjo2 below 26% (Gibbs et al., 1942). In cerebral ischemia, increased tissue lactate and neurologic deficits can appear at Sjo2 below 50% in humans, though tissue ATP does not decrease until Sjo2 below 15% in cats (Schell and Cole, 2000). In our study, we calculated Svo2 thresholds for the piglets, analogous to Sjo2 in humans, from the Sco2 thresholds using the Svo2 and Sco2 relation (Table 3). These calculations showed increased lactate, EEG changes, and decreased ATP developed at Svo2 below the aforementioned values for Sjo2. This finding likely reflects different experimental models.
Logistic regression analysis was used to determine the hypoxia–ischemia thresholds. This analysis determines the interaction between a quantal dependent variable (present or absent) and a continuous independent variable. In our study, the independent variable was Sco2. The dependent variable was presence or absence of EEG change, or of abnormal lactate and ATP. The advantage of this approach is that it permits the use of all Sco2 measurements to determine the “critical” value rather than only the low values of Sco2. The number of animals in each Sco2 group was set to optimize curve fitting and to permit the calculation of probability of functional impairment or brain damage, which helps in the design of clinical trials. Probabilities (thresholds) for 50%, 5%, and 95% of animals were calculated for biologic and clinical monitoring reasons. An alternative approach, reduce Sco2 in each animal in a stepwise fashion until functional impairment occurs, is confounded by the effect of number and duration of the preceding steps.
The NIRS is a regional oxygenation monitor. Theoretical work and imaging experiments illustrate that it views a banana-shaped tissue field between emitter and detector (Chance, 1998; Okada et al., 1995), which in our study encompassed neocortical gray and white matter, the ischemic region. The NIRS Sco2 represents a mixed vascular hemoglobin-oxygen saturation of capillaries, arterioles, and venules in that tissue field. Because of the greater volume of the venous circulation, Sco2 is closer to venular than arterial saturation. In clinical care, the use of NIRS Sco2 thresholds may not detect cerebral hypoxia–ischemia, if, for example, the cortex included a mixture of perfused and ischemic tissue such that the average Sco2 was above the threshold, or if NIRS monitors frontal cortex and focal ischemia occurs in the occipital cortex.
Our study illustrates a few points about NIRS and physiology. In principle, cerebral oxygen delivery and consumption regulate Sco2. Cerebral oxygen delivery consists of CBF, arterial oxygen saturation (Sao2), hemoglobin concentration, and hemoglobin-oxygen affinity. It is easy to manipulate Sco2 through CBF or Sao2 by changing the inspired oxygen and carbon dioxide concentrations, minute ventilation, or occluding the cerebral arterial circulation. The presence of an arterial component in the Sco2 is shown by the positive value of Sco2 as Svo2 approaches zero (x-intercept, Fig. 1). The slope of this line shows the dominance of the venous contribution to Sco2, which is close to unity. The inability of brain tissue to extract all the oxygen bound to NIRS-monitored hemoglobin is shown by the positive value of Sco2 as CBF approaches zero (x-intercept, Fig. 2).
The logistic regression analysis also shows great similarity among the relations for lactate, major EEG change, and ATP. The K values are nearly identical and the curve fits are tight (Table 2), suggesting a strong link to the same phenomena (i.e., cell energy dysfunction). In contrast, for minor EEG change, the K value is different and the curve fit is less tight, suggesting linkage to another phenomena associated with cerebral hypoxia (e.g., synaptic dysfunction).
Our results help clarify the use of NIRS hemoglobin oxygenation monitoring in clinical care. In healthy human neonates, children, and adults, Sco2 ranges from 60% to 80%, similar to that in newborn pigs (Brun et al., 1997; Fantini et al., 1999; Kurth et al., 2001; Springett et al., 2001). The Sco2 threshold for functional neurologic impairment begins at a level 25% less than this range, suggesting the existence of a buffer zone (Sco2 45% to 60%), in which cerebral oxygenation is less than normal but adequate for function. This Sco2 difference between normal and dysfunction is well within NIRS precision (± 5%), affording some luxury in clinical monitoring. In many sick neonates, cerebral hemoglobin oxygenation is at or below the functional Sco2 threshold, indicating that cerebral hypoxia-ischemia may not be recognized during clinical care (Brun et al., 1997; Tsuji et al., 1998; Watzman et al., 2000; Kurth et al., 2001; Fantini et al., 1999; Springett et al., 2001).
There are several types of NIRS instruments available for use that report hemoglobin oxygenation differently, such as tissue oxygenation index, oxydeoxyhemoglobin concentration difference, Sco2, or regional oxygen saturation (Brun et al., 1997; Chance, 1998; Fantini et al., 1999; Springett et al., 2001; Tsuji et al., 1998; Watzman et al., 2000). These devices differ in the technology and algorithm used to determine hemoglobin oxygenation. If these devices measure hemoglobin saturation accurately at low saturation and in the neocortex without extracranial contamination, the ischemic thresholds for a given experimental paradigm should be similar. Given these caveats, our results should be generally applicable to the interpretation of cerebral oxygenation by all NIRS instruments.
Footnotes
Acknowledgments:
The authors thank Shavon Yannuzzi for technical assistance.
References
1.
BrunN.C.MoenA.BorchK.SaugstadO.D.GreisenG. (1997) Near-infrared monitoring of cerebral tissue oxygen saturation and blood volume in newborn piglets. Am J Physiol273:H682–H686.
2.
ChanceB. (1998) Near infrared images using continuous, phase-modulated, and pulsed light with quantitation of blood and blood oxygenation. Ann N Y Acad Sci838:29–45.
3.
FantiniS.HueberD.FranceschiniM.A.GrattonE.RosenfeldW.StubblefieldP.G.MaulikD.StankovicM. (1999) Non-invasive optical monitoring of the newborn piglet brain using continuous-wave and frequency-domain spectroscopy. Phys Med Biol44:1543–1563.
4.
GibbsE.L.LennoxW.G.NimsL.F.GibbsF.A. (1942) Arterial-venous differences in man. J Biol Chem144:325–334.
5.
HeissW-D (2000) Ischemic penumbra: Evidence from functional imagining in man. J Cereb Blood Flow Metab20:1276–1293.
6.
HillI.E.VolpeJ.J. (1999) Neurological and neuromuscular disorders. In: Neonatology: pathophysiology and management of the newborn, 5th ed (AveryG.B.FletcherM.A.MacDonaldM.G., eds), Philadelphia: Lippincott Williams & Wilkins, pp. 1231–1252.
7.
HossmannK.A. (1994) Viability thresholds and the penumbra of focal ischemia. Ann Neurol36:557–565.
8.
KurthC.D.ThayerW.S. (1999) A multiwavelength frequency-domain near infrared cerebral oximeter. Phys Med Biol44:727–740.
9.
KurthC.D.StevenJ.M.BenaronD.ChanceB. (1993) Near-infrared monitoring of the cerebral circulation. J Clin Monit Comput9:163–170.
10.
KurthC.D.StevenJ.M.MontenegroL.WatzmanH.GaynorJ.W.SprayT.L.NicolsonS.C. (2001) Cerebral oxygen saturation before congenital heart surgery. Ann Thorac Surg72:187–192.
11.
MillerA.J.CorddryD.H. (1981) Brain carbohydrate metabolism in developing rats during hypercapnia. J Neurochem36:1202–1210.
12.
NiokaS.ChanceB.SmithD.S.MayevskyA.ReillyM.P.AlterC.AsakuraT. (1990) Cerebral energy metabolism and oxygen state during hypoxia in neonate and adult dogs. Pediatr Res28:54–61.
13.
OkadaE.FirbankM.SchweigerM.ArridgeS.R.CopeM.DelpyD.T. (1995) A theoretical and experimental investigation of the effect of sulci on light propagation in brain tissue. IEEE Eng Med Biol Mag12:1117–1119.
SpringettR.NewmanJ.CopeM.DelpyD.T. (2001) Oxygen dependency and precision of cytochrome oxidase signal from full spectrum NIRS of the piglet brain. Am J Physiol Heart Circ Physiol279: H2202–H2209.
16.
TsujiM.K.duPlessisA.TaylorG.CrockerR.VolpeJ.J. (1998) Near infrared spectroscopy detects cerebral ischemia during hypotension in piglets. Pediatr Res44:591–595.
17.
TsujiM.K.SaulJ.P.DuPlessisA.EichenwaldE.C.SobhJ.CrockerR.VolpeJ.J. (2001) Cerebral intravascular oxygenation correlates with mean arterial pressure in critically ill premature infants. Pediatrics106:625–632.
18.
VanBelF.DorrepaalC.A.MannonJ.N.L.BendersM.B.ZeeuweE.M.Van de BorM.BergerH. (1993) Changes in cerebral hemodynamics and oxygenation in the first 24 hours after birth asphyxia. Pediatrics92:365–372.
19.
VannucciR.C.PerlmanJ.M. (1997) Interventions for perinatal hypoxic-ischemic encephalopathy. Pediatrics100:1004–1014.
20.
VohrB.R.WrightL.L.DusickA.M.MeleL.VerterJ.SteichenJ.J.SimonN.P.WilsonD.C.BroylesS.BauerC.R.Delaney-BlackV.YoltonK.A.FleisherB.E.PapileL.A.KaplanM.D. (2000) Neurodevelopmental and functional outcomes of extremely low birth weight infants in the National Institute of Child Health and Human Development Neonatal Research Network, 1993–1994. Pediatrics105:1216–1226.
21.
WatzmanH.KurthC.D.MontenegroL.RomeJ.StevenJ.M.NicolsonS.C. (2001) Arterial and venous contributions to near-infrared cerebral oximetry. Anesthesiology93:947–953.
22.
WrayS.CopeM.DelpyD.T.WyattJ.S.ReynoldsE.O.R. (1988) Characterization of the near infrared absorption spectra of cytochrome aa3 and haemoglobin for the non-invasive monitoring of cerebral oxygenation. Biochim Biophys Acta933:184–192.
23.
WyattJ.S.DelpyD.T.CopeM.WrayS.ReynoldsE.O.R. (1986) Quantification of cerebral oxygenation and haemodynamics in sick newborn infants by near infrared spectrophotometry. Lancet2(8515):1063–1066.