
Abstract
The effect of different percentages of coil mesh in a cerebral aneurysm on the pulsatile flow and pressure in the parent vessel and aneurysm lumen was evaluated. Geometric data on a basilar tip aneurysm and vertebrobasilar arteries after subarachnoid hemorrhage was obtained by computer tomographic angiography. Intraarterial pressure was measured at four vertebrobasilar points before and after treatment with detachable coils. Pulsatile flow was documented by transcranial ultrasonography. A three-dimensional computer simulation was created using a commercial fluid dynamics solver for four aneurysm conditions: (1) before intervention; (2) with a 20% filling showing a complete cessation of the inflow through the aneurysm neck; (3) with a 12% filling showing an incomplete deceleration of inflow through the aneurysm neck, with a remaining flow around the embedded platinum coils; and (4) with a 12% filling and simulation of clotted aneurysm dome, which did not inhibit persisting flow phenomena. The relative pressure amplitudes neither increased nor decreased under the different simulated aneurysm filling conditions. Inserted platinum coils can immediately and decisively relieve the influx of pulsating blood and allow for initial clotting. To reach this effect, a volume density of 20% platinum coil mesh in the aneurysm neck is needed.
The less invasive character of endovascular methods for the management of cerebral aneurysms is a redeeming aspect for many patients who are confronted with brain surgery as the only alternative treatment. Particularly since the introduction of Guglielmi detachable coils (GDC), results are comparable with those achieved with surgery in cases of acute aneurysm rupture (Groden et al., 1998, 2000, 2001). However, factors influencing the achieved results, especially longer-term results, are still under discussion. In vitro studies of aneurysm-related hemodynamics have focused on wall stress (Steiger et al., 1989), geometric relations (Steiger et al., 1988a), flow rate and pulsatility (Steiger et al., 1988b), and aneurysmal flow disturbances after partial embolisation (Gobin et al., 1994; Graves et al., 1990). The alteration of flow as a major factor, even evoking spontaneous aneurysm regression, has been reported after treatment of arteriovenous malformation shunts by embolization (Redekop et al., 1998). Angiographic follow-up studies at 1 year after GDC treatment have reported a 15% coil compaction (Byrne et al., 1999). To understand the influence of embedded coils on the flow and pressure conditions in parent vessels and the aneurysm lumen, a three-dimensional computer model based on in vivo data was created. The pulsatile flow conditions of a cerebral vessel with an aneurysm were simulated for different stages of aneurysm occlusion.
METHODS
The present study was not necessarily focused on a detailed anatomical reconstruction of the parent vessel as reported Foutrakis et al. (1996), but rather on creating a geometrical model that did not greatly vary with vessel narrowing or bending, such as in terms of flow pattern with only minor influence on the resulting calculations. The constructed model simply approximated the form and shape of the actual aneurysm (compare aneurysm in Figs. 1A and 1B with the model in Fig. 1C). To our knowledge, such an aneurysm-modeling procedure has no parallel in the medical literature and, thus, depended on corroboration from the fields of physics and hydraulics.
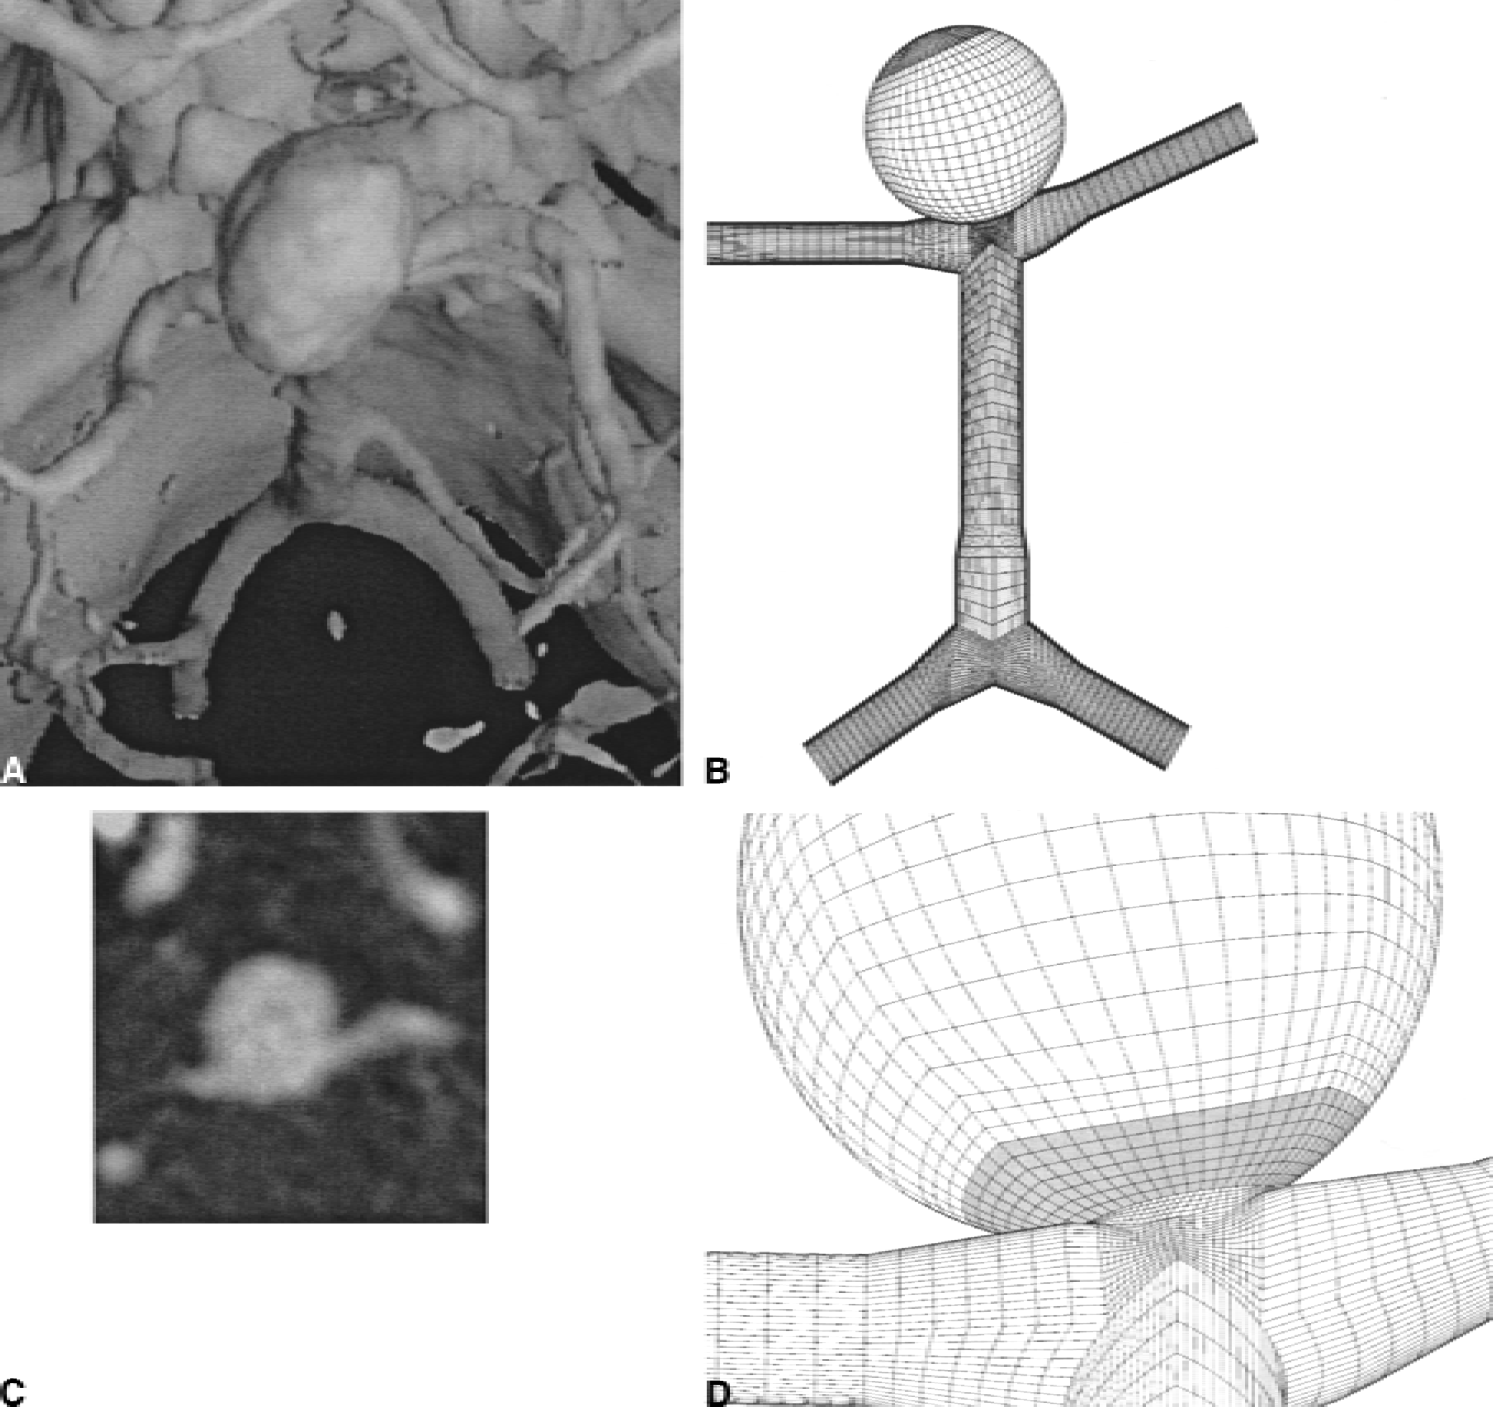
Several parameters were used to model the interactive hemodynamic aspects between intracranial vessels and aneurysms. The brain of a patient with a subarachnoid hemorrhage of a basilar tip aneurysm was scanned using computed tomography with 120-mL contrast medium. The simplified geometric sizes of the arteriae vertebrales, arteria basilaris, arteriae posteriores, and the diameters of the aneurysm lumen (14 mm) and neck (4 mm) were derived from source-data depiction (Fig. 1C). For modeling purposes, the somewhat oblong-appearing aneurysm was reckoned as a sphere. The connecting arteries were approximated to round forms (Figs. 1B and 1D).
After obtaining informed consent from the patient, intraarterial pressure was measured at four points in the vertebrobasilar arteries with a 0.014-in guidewire-mounted pressure sensor (Pressure Wire Sensor, RADI Medical Systems, Uppsala, Sweden) (see Table 1) regarding before and after treatment of the basilar tip aneurysm with GDC. The pulsatile flow in the arteria basilaris was documented by transcranial ultrasonography with a DWL Multi-Dop X-4 (Elektronische Systeme GmbH, Sipplingen, Germany).
In vivo measured vertebrobasilar blood pressure before and after aneurysm treatment
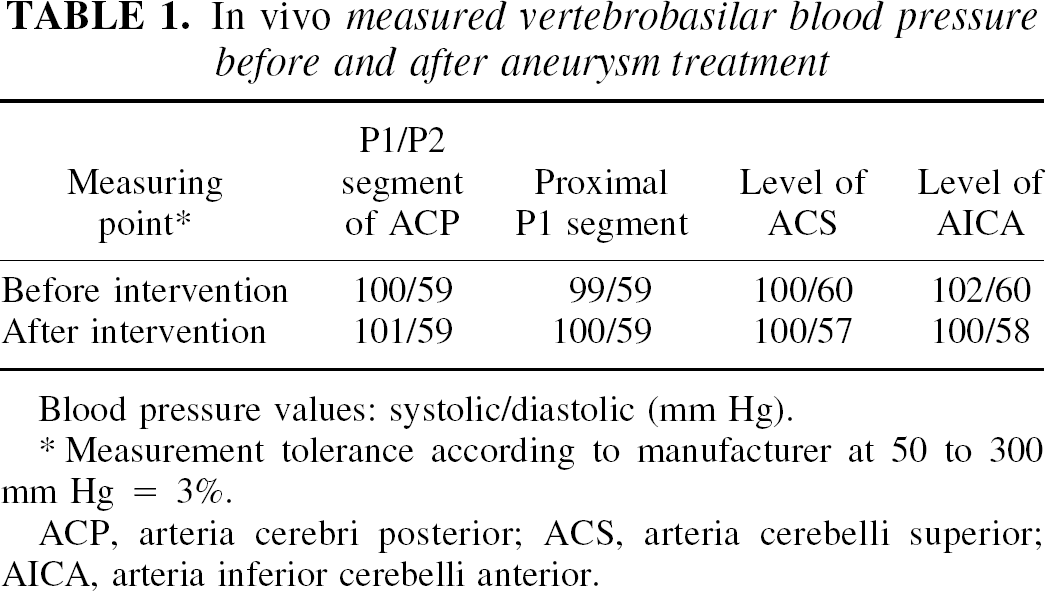
Blood pressure values: systolic/diastolic (mm Hg).
Measurement tolerance according to manufacturer at 50 to 300 mm Hg = 3%.
ACP, arteria cerebri posterior; ACS, arteria cerebelli superior; AICA, arteria inferior cerebelli anterior.
For calculation of the flow in and near the aneurysm, the software package STAR-CD (Computational Dynamics, London, UK) was used. This software package solves the time-averaged Navier-Stokes equation and the continuity equation (Reynolds-averaged Navier-Stokes equations) using a finite-volume approach. The grid-generation software ICEM CFD was used to divide the control volume into a finite number of nonoverlapping, nonorthogonal, boundary-fitted control volumes, or cells (127,856 cells were used). An O-grid method (Ferziger and Peric, 1996), which is most commonly used for pipe systems to ensure good cell quality, was used to create the block-structured grid. For each cell, the conservation equations for the impulse (Navier-Stokes equation) and mass (continuity equation) were set, whereby the convection and diffusion terms of the conservation equation were approximated by a central difference scheme. The resulting nonlinear system of equations was solved iteratively. The coupling of the velocity with the pressure was achieved according to the PISO-method (Issa, 1986). The geometry of the aneurysm and the vessels was derived from computed tomographic data (Figs. 1A and 1B). To solve the equations, the boundary conditions of all computational domains must be formulated. On the vessel walls, which were considered nonelastic, the no-slip and no-penetration conditions were applied (i.e., all velocity components at the vessel wall must be zero). At the inlet, a periodic time-varying fluid velocity was prescribed (Fig. 2). The time variation was fitted to the measurements by transcranial ultrasonography, which amounted to a mean-flow velocity of 0.43 m/sec.
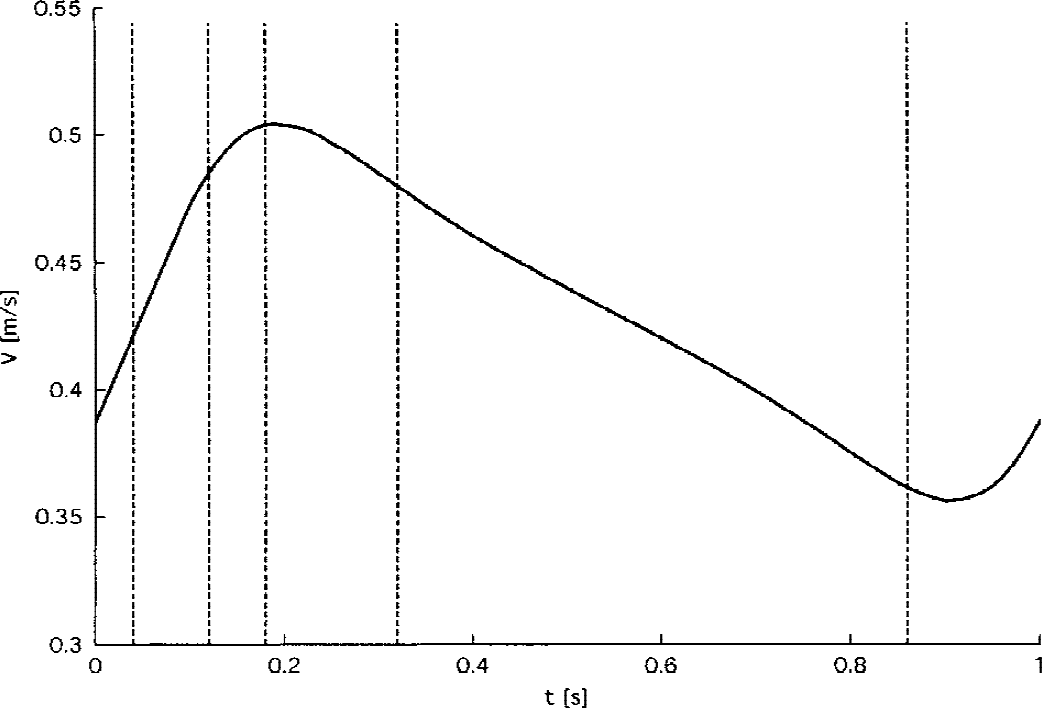
Simulated blood flow velocity v(m/second)* in the basilar artery. The vertical dotted lines represent the four time points of the different aneurysm filling conditions calculated in Figs. 3 and 4. *Sensibility of velocity measurement according to manufacturer = min. 0.1 m/second, max. = 2.5 m/second.
For the outlet, two possibilities formulate the boundary conditions:
It is assumed that for each outlet a specified amount of the total inflow exits. With two outlets, the inflow is divided equally between the two outlets only when the outlets are identical.
A constant pressure is prescribed to both outlet boundaries. The outflow distribution then resolves itself. All pressures in the computational domain are referenced relative to the outlet pressure.
For both outlet boundaries, the second method was chosen and a constant pressure was prescribed. In the actual total system, of which the computational domain represents only a small part, the pressure pulsates approximately a nonzero pressure. For simulation purposes, this measured absolute value was subtracted from the pressure definition. To obtain the absolute pressure, the measured absolute pressure must be added to the relative pressure at each time step. Because this process was transient, time was also discriminated, calculated in time steps of 0.001 second. Each computer simulation represented a real-time sequence of 2 seconds. The calculation for one condition necessitated approximately 72 hours on a Hewlett-Packard (U.S.A.) 9000/782 Workstation.
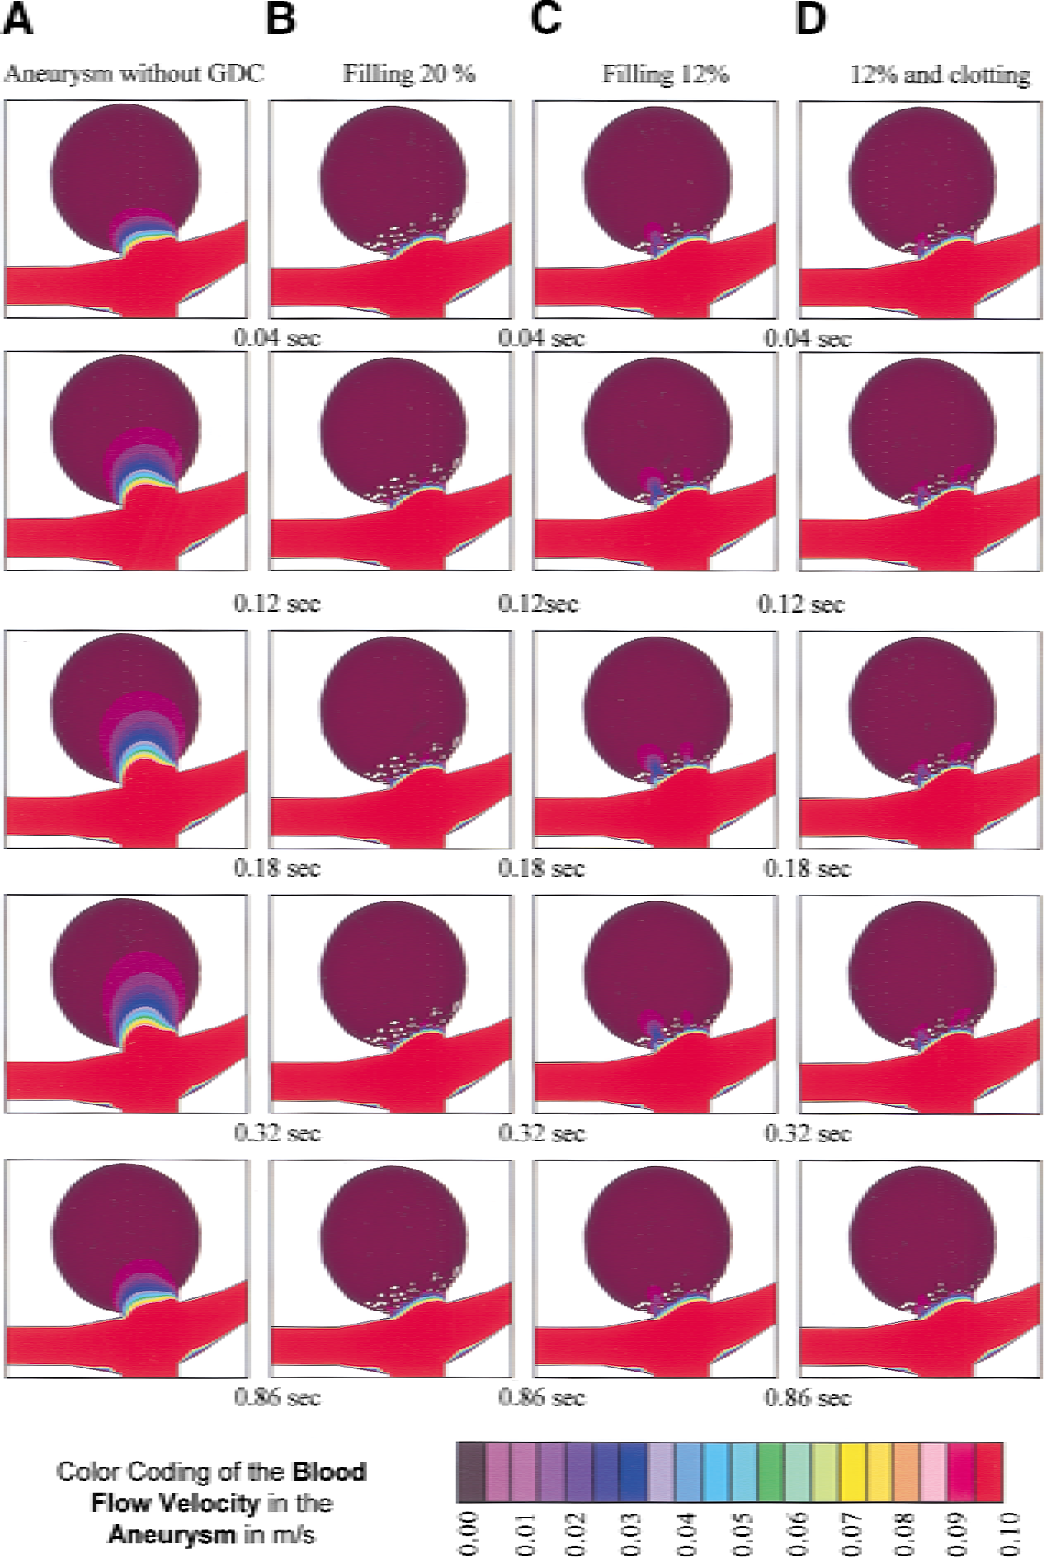
The simulation was performed with the following material constants: blood density (ρ) = 1060 kg/m3; blood dynamic viscosity (μ) = 0.05 Pa·sec; mean Reynolds number in the arteria basilaris (Rn) = 508. Four aneurysm filling conditions were studied: (A) before intervention, (B) 20% filling, (C) 12% filling (same procedure as with 20% filling, but cells are blocked to produce a filling degree of 12%), and (D) 12% filling and simulation of clotted aneurysm. The procedure for the fourth condition was the same procedure as with 12% filling, with the additional parameter that cells in the aneurysm beyond the coil blockage are filled so that only a small amount of fluid may pass (i.e., the region inside the aneurysm was defined in terms of porosity such that a 100% porosity represented no blockage, as in the before-intervention simulation, and a 0% porosity represented full blockage, or a solid mass). For this condition we chose a 10% porosity in the entire aneurysm dome, beyond the simulated coiled zone at the ostium. This porosity simulated a gelatinous structure similar to the consistency of a fresh thrombosis.
The filling of the aneurysm neck with platinum coils was simulated by a distribution of blocked cells, as created using a simple computer routine. In the first seven cell layers of the aneurysm opening (depicted by the shaded layers in Fig. 1 D), a pattern of adjoining cells was blocked. That is, the fluid was not allowed to enter these cells, as if occupied by a segment of a platinum coil. For the second filling condition (B), the number of cells blocked corresponded to 20% of the cells in this region occupied by platinum coils, whereas for the third and fourth conditions (C, D) the number of cells blocked corresponded to only 12% of the cells in this region.
The pattern of cell blockage was randomly created by a computer program according to certain guidelines. The program began by blocking a randomly selected cell within the designated region. The program then randomly selected an adjoining cell, and determined whether this new cell lay within the seven-layer region, was not already blocked, and had no more than two adjoining cells that were blocked. If the selected cell fulfilled these requirements, it was also blocked and the program continued from this newly filled cell to another randomly selected adjoining cell. This process continued until the desired filling level had been reached. To enhance simulation realism, an element edge length of 0.4 mm in these seven cell layers was imposed, which a 0.385-mm diameter GDC 18-coil segment could occupy.
RESULTS
Intraarterial pressure measurement
The recorded intraarterial systolic/diastolic pressure values from the guidewire mounted pressure sensor are displayed in Table 1.
Flow velocity
The blood flow as evaluated by transcranial ultrasonography showed a mean flow of 0.43 m/sec and systolic/diastolic values ranging from 0.52 m/sec to 0.36 m/sec. The flow simulation pattern for the three-dimensional computer model was based on the adapted sinusoidal curve as displayed in Fig. 2.
Simulation
Color-coded results for the four different conditions of aneurysm embolization grading, as described previously, were obtained from three-dimensional simulations. In the depictions (Figs. 3 and 4), a row represents an identical point of simulation corresponding to the four different conditions of the aneurysm lumen (A–D). Time varies columnwise, and is adjusted along the pulsatile flow. The point for Figs. 3 and 4 corresponds with the depiction of the vertical dotted lines in Fig. 2. The pulsatile pressure values are shown in Fig. 3, and the simulated pulsatile flow values are plotted in Fig. 4.
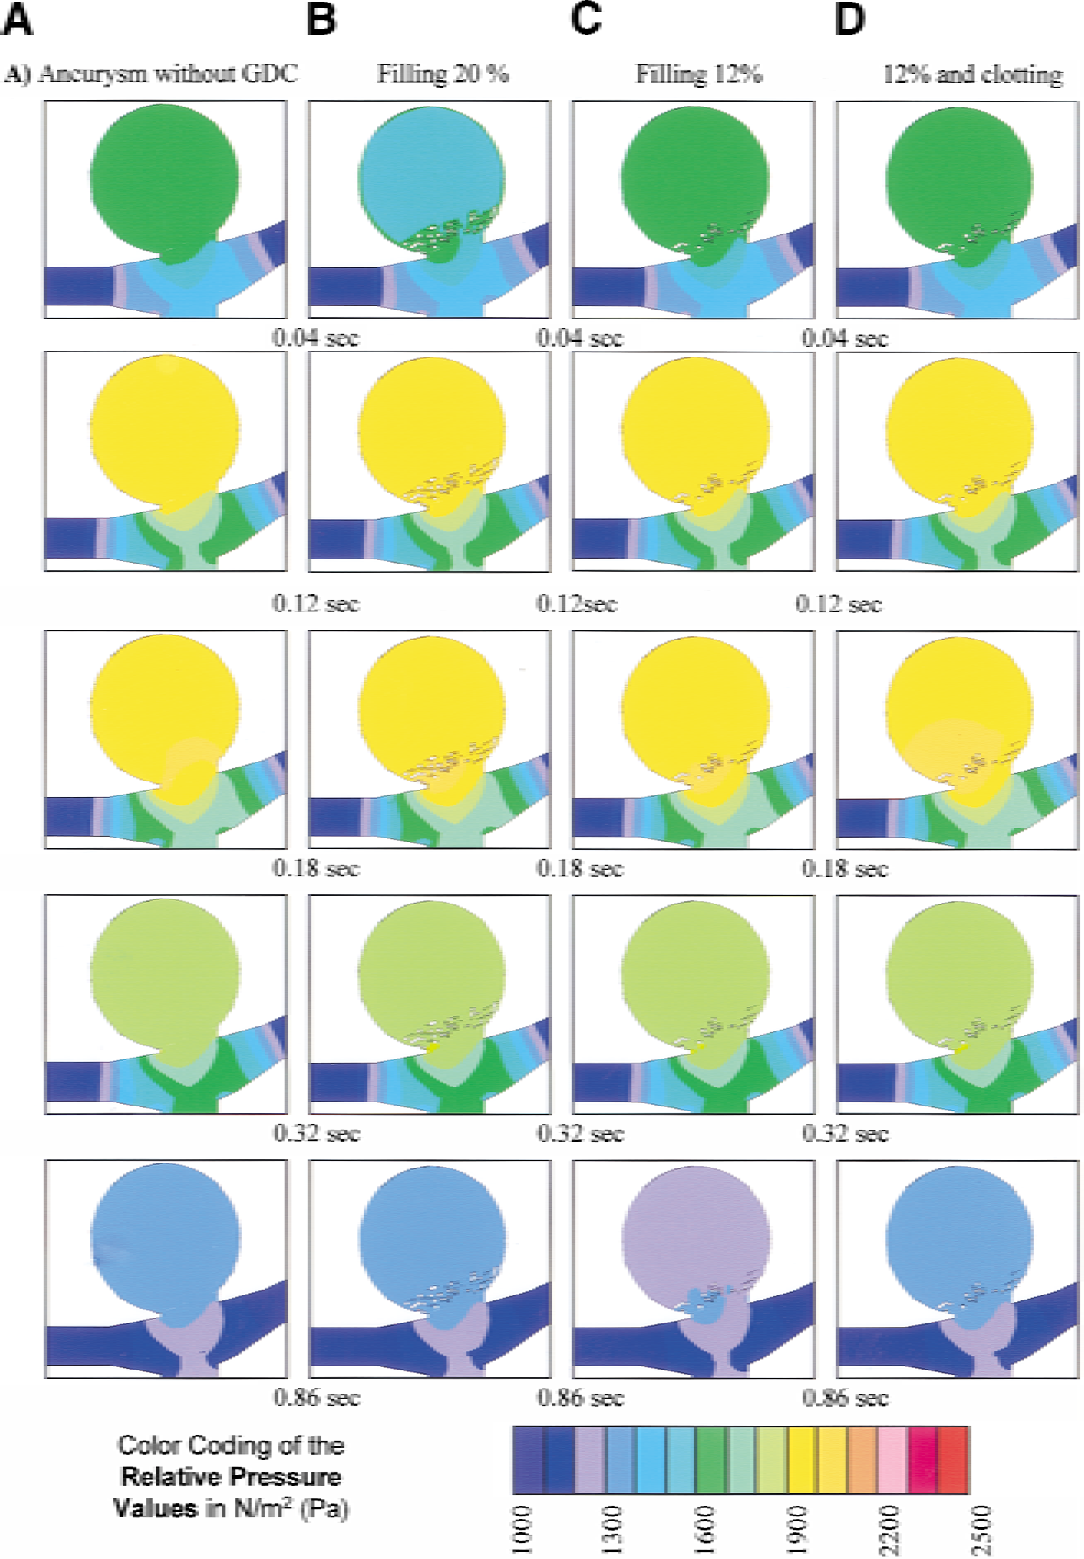
Color-coded pressure values in different stages of occlusion.
Color-coded blood flow values in different stages of occlusion.
In Fig. 3 the color coding represents the simulated pressure values of the aneurysm lumen with a graduation of 100 N/m2per step. The chosen figures are coronal middle sections expressed in color code, which is shown in the bottom code row. The relative pressure amplitudes showed no significant difference in the different simulated aneurysm filling conditions. Only column D (filling degree of 12% and dome clotting) showed an increase of the maximum pressure plane at the neck and clotting coil mesh interface.
In Fig. 4 the color coding represents the simulated flow values of the aneurysm lumen with a graduation of 0.005 m/sec per step. The chosen depictions are coronal middle sections expressed in color code, as is shown in the bottom code row. Column B, which simulates a 20% filling degree of the aneurysm neck, depicts a complete deceleration of the inflow, even at the maximum flow in the parent vessel. Column C, which simulates a 12% filling degree of the aneurysm neck, depicts an incomplete cessation of inflow, showing a remaining flow around the embedded platinum coils. It should be stressed that an additional clotting simulation of the aneurysm dome (column D) did not inhibit this persisting flow phenomena. In Fig. 5, the color coding represents the simulated blood flow vectors of every single voxel of the native untreated aneurysm in front of the simulated coiled zone at the ostium in Figs. 4B, C and D.
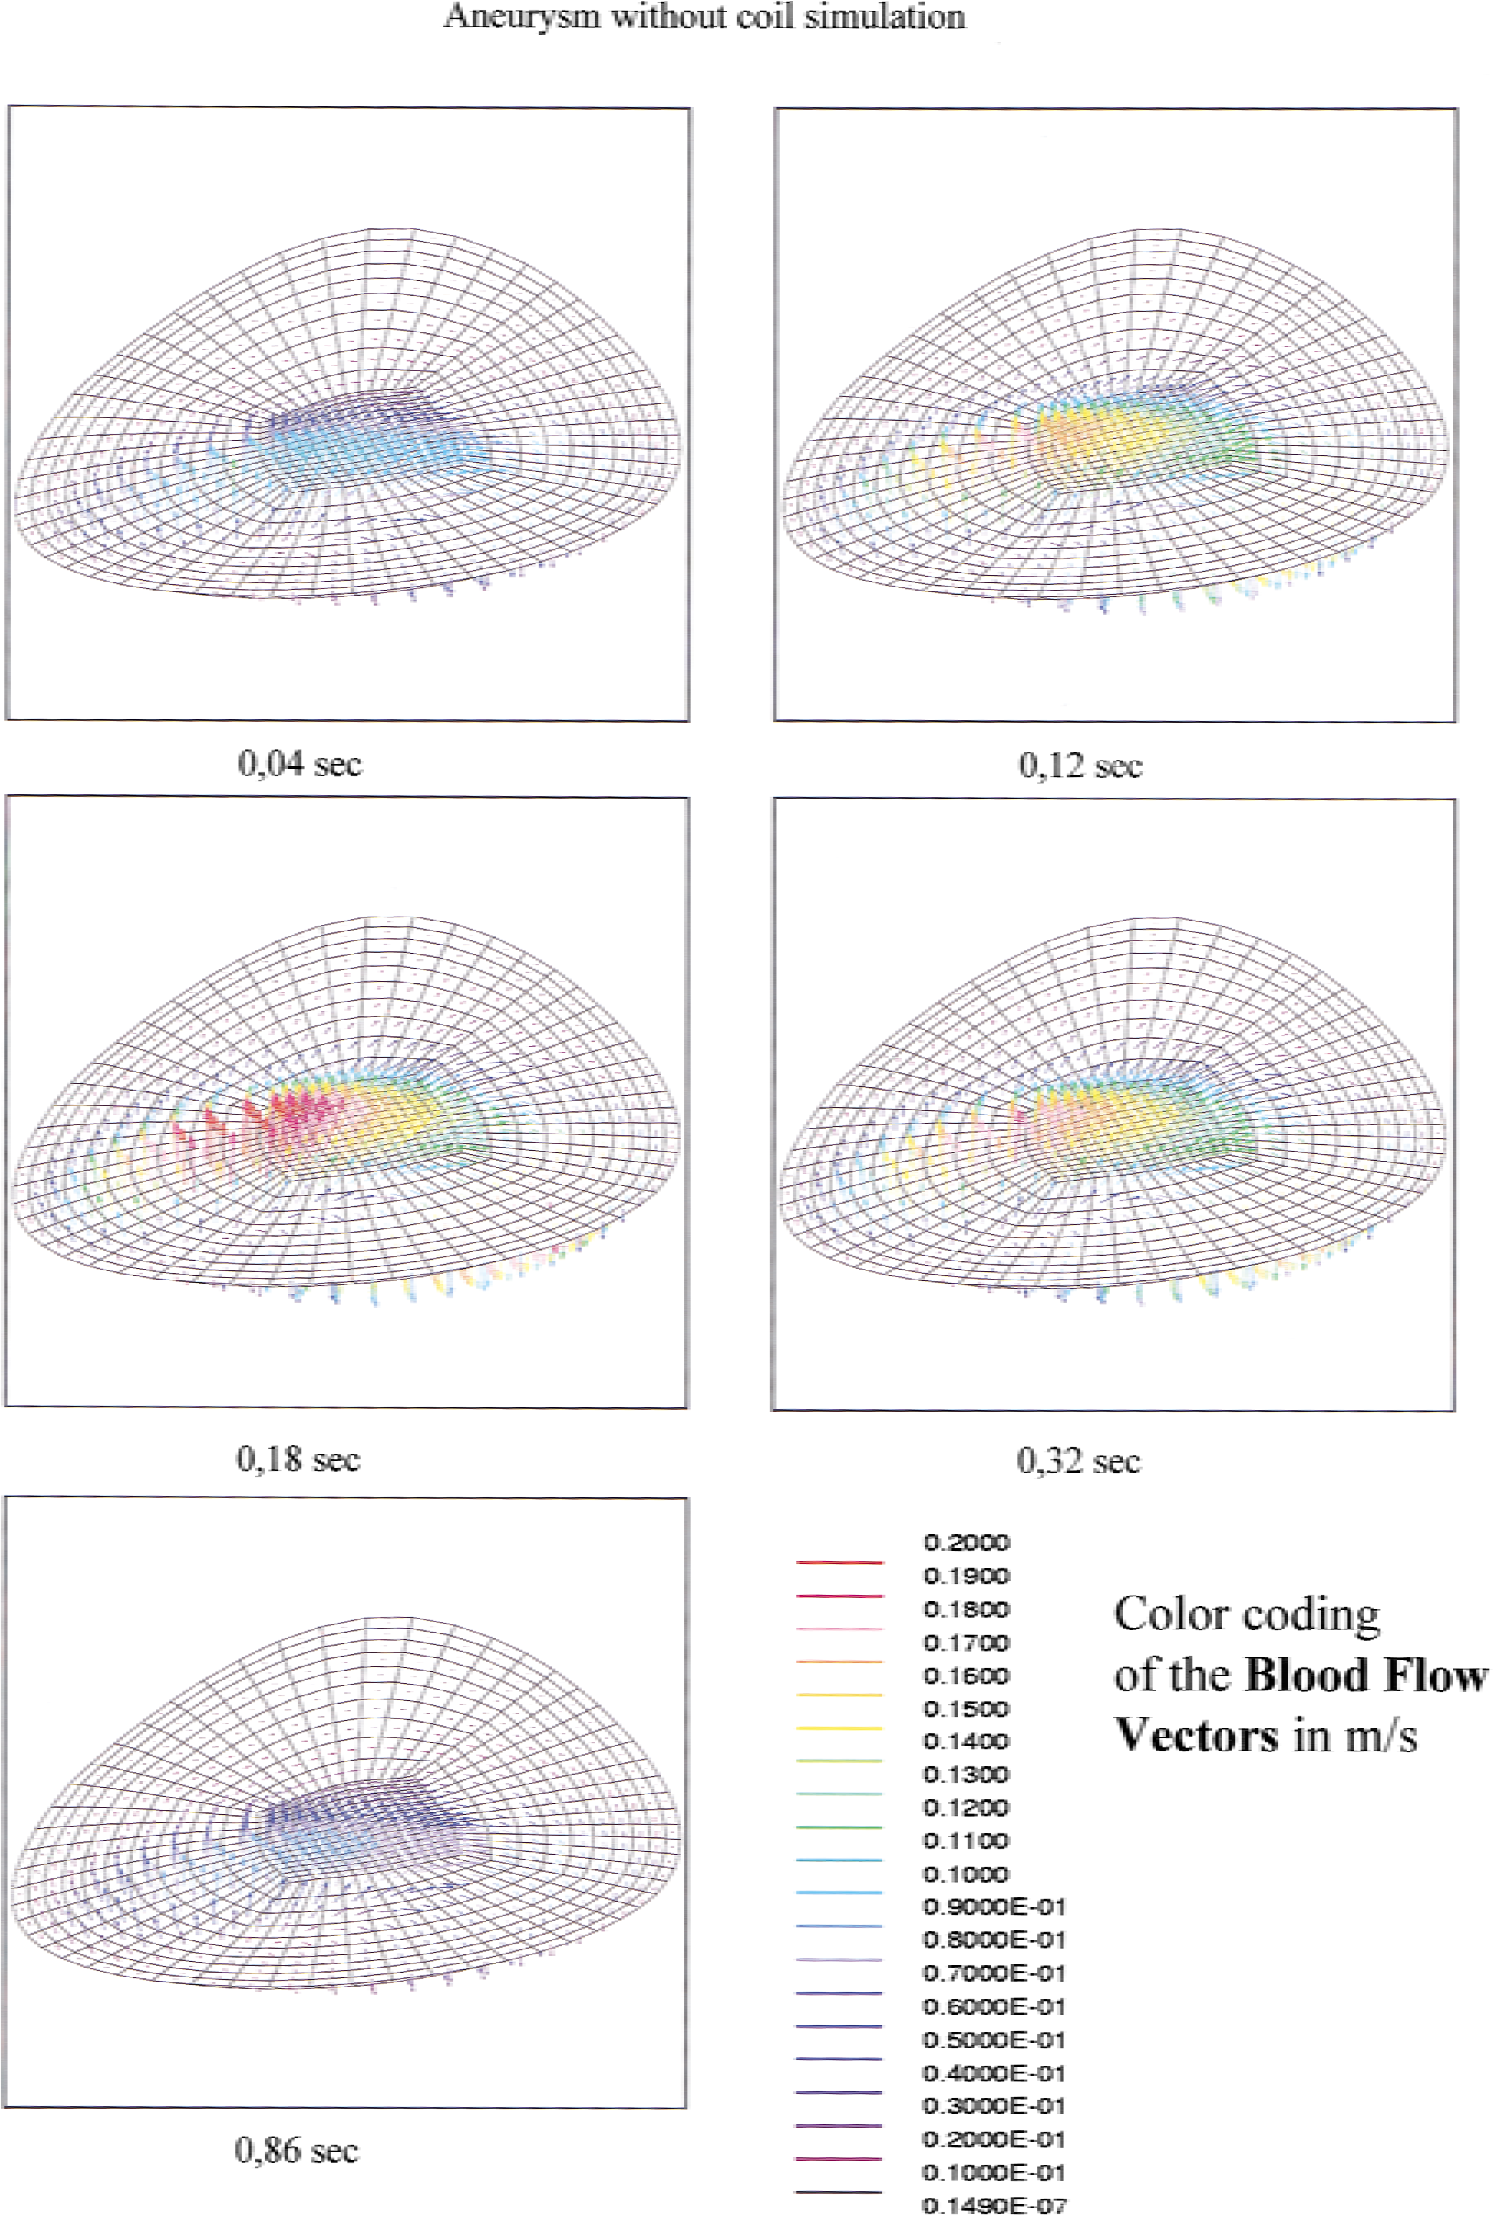
Blood flow vectors at the aneurysm neck.
DISCUSSION
The use of models implies a reality reduction on allegedly substantial constituents. This loss of reality is well demonstrated by the difference in the appearance of the real aneurysm (Fig. 1A) compared with the depiction of the simulated aneurysm (Fig. 1B) based on source data (Fig. 1C). This procedure, however, also includes a risk of the loss of one or several integral reality references. Therefore, restrictions and simplifications for a model simulation of the hemodynamic effects during endovascular therapy for cerebral aneurysm had to be postulated under certain given considerations.
The three critical blood-flow variables—pressure, resistance, and speed—had to be determined. A pressure gradient must exist to overcome friction resistance consisting of the combination of internal frictional resistance and wall friction, and to transport a specific amount of fluid through a given conduit (vessel) system at a specific speed. This “relative pressure” consists of the crucial difference between inlet and outlet pressure. The one determinable entity, the specific speed of the incoming fluid (blood), could be determined by ultrasonic measurements. The other two variables, friction and resistance and relative pressure, could be calculated. In the present evaluation all given pressures refer to the pressure at the outlet boundary for all intervals.
The cycles of individual blood pulsations were broken into small separated segments so that a fully implicit solving scheme could be used (Ferziger and Peric, 1996; Richtmeyer and Morton, 1967). To hold the computational expenditure within limits, neither the elasticity of the vessels nor that of the aneurysm, which is weakened because of the pathologically changed wall construction, was considered in the specifications for the hemodynamic effects. With a steady current, the error caused would be negligible. However, with an intermittent current, occurring pressure peaks are smoothed (bellow principle) depending on the elasticity. This simplification would lead overestimation of simulated pressure values.
The Reynolds number, which is calculated according to the formula Rn = D V ρ / μ (whereby D is the vessel diameter, V is the midfluid flow velocity, ρ is the density, and μ is the fluid viscosity) was calculated for the entire simulation model by the value of the Arteria basilaris. The corpuscle blood constituents were only included in the calculations regarding the viscosity of the liquid with μ = 0.05 Pa/sec and the density of the simulated liquid (ρ = 1060 kg/m3). The viscosity of blood as a non-Newtonian fluid, however, does not remain constant; a reduction of the viscosity values occurs under the effects of shearing stresses or acceleration. The effects of vessel branching on viscosity in cases of aneurysms are not uniformly judged in the literature. Works by Liepsch and Moravec (1984) and by Ku and Liepsch (1986) proved the differences in the flow behavior between a Newtonian and a non-Newtonian fluid. However, in an experimental work by Steiger et. al. (1988b), no significant difference in behavior was observed between Newtonian and non-Newtonian fluid in a laser-Doppler investigation of experimental aneurysms. For our model, a mean Reynolds number of 508 (maximum, 614; minimum, 421) was used. For such an order of magnitude, the inertial forces are dominant in relation to the viscous forces; therefore, the behavior of a Newtonian fluid was judged as sufficient for the selected simulation conditions. Coagulation leading to a pronounced reduction and stasis of the blood flow was simulated in a simplified form as a 90% reduction of the blood flow in the aneurysm dome. This was only brought into the calculation for condition D (Figures 3 and 4, column D).
Hemodynamic effects due to embedding of platinum coils
Similar to our simulation results for terminal aneurysms, an in vitro study by Gobin et al. (1994) showed that the blood flow pulsatility into side-wall aneurysms could be clearly and significantly reduced after insertion of a single platinum coil. In line with that finding, there was also no effect on pressure-gradient changes between parent vessels and the aneurysm lumen in the present study. By reducing blood flow into the aneurysm to the zero point, a coagulative cascade can be evoked that leads to thrombosis formation and eventually to aneurysm clotting. Such mechanisms have been described in the literature on histologic examinations in animals after coil occlusion (Tenjin et al., 1995) and in an autopsy during which a thrombolized clot consisting of fibrin and thrombocytes was found 36 hours after coil insertion (Stiver et al., 1988). It is presumed that such an endovascular treatment prevents spontaneous hemorrhages, which often occur in untreated aneurysms. The hemodynamic pressure imposed on the inserted platinum coil mesh is dissipated over the wall of the aneurysm cavity that combined with the reaction of the aneurysm wall against the foreign body (coil) initiates a cellular organization of the initially unorganized blood clot into a scar formation, resembling a normal wound healing process (Shimizu et al., 1999; Horowitz et al., 1997).
Ideally, endovascular therapy (aneurysm occlusion) seeks to achieve the goal of roentgen intransparency, which can be achieved by a filling of approximately 25% (Castro et al., 1999) of the aneurysm lumen with platinum coils. In vitro studies (Satoh et al., 1997; Mandai et al., 1998) have shown a maximum filling of 25% to 35% in silicone or glass aneurysm models. A study by Mandai et al. (Mandai et al., 1998) confirms that results of in vitro fillings are higher than in vivo results and corresponds with our clinical experience. Therefore, we minimalized the maximum filling with coils to 20%. The filling reduction to 12% was based on the filling calculation of numerous nondensely packed aneurysms observed with coil condensation or coil displacement. The pattern of cell blockage was uniformly distributed across the first seven cell levels of the aneurysm ostium (see Fig. 1D). The reduction of the in vivo embedded coil filling in the aneurysm lumen to a seven-coil diameter thick area at the aneurysm neck is not a disadvantage for the force of expression of the model, because even a 20% filling of the aneurysm neck (Fig. 1D) with platinum coils can decelerate the aneurysm flow to zero. This simulation result can only be explained by a significant variation of the blood column flow in this neck area due to a resolution of force by the platinum coil mesh. Therefore, we did not simulate the filling of the whole aneurysm dome with platinum coil mesh. A further benefit of this reduction was the better observation of the residual flow effects due to a reduced neck filling (12%Figs. 3 and 4, column D) at the interface of coil simulation and aneurysm dome.
If an adequate density of the platinum spirals in the aneurysm dome and at the portal (neck) has not been achieved, a constant water-hammer effect (Kwan and Heilman, 1991) can lead to a “settling” or rearrangement of the coil tuft, albeit not enough to cause single-coil segments to be exposed to the blood flow of the parent vessel, which could enhance lysis of the forming thrombus. In cases of coil migration, various effects on the areas around or immediately between coil segments have been reported, including aneurysm recanalization (Debrun et al., 1998a, 1998b; Gruber et al., 1999; Vinuela et al., 1997; Turjman et al., 1998), nonreactive thrombus cores without macrophage immigration or scar formation (Molyneux et al., 1995), and thrombus development from the aneurysm periphery (Shimizu et al., 1999). Ideally, thrombosis formation continues until a stable endothelium has developed as the final healing step (Castro et al., 1999). However, if the spiral coil mesh density is not high enough (e.g., 12% as in Figs. 4C and 4D), spiral segments can extend out of the thrombus and be exposed to the blood flow at the aneurysm neck (Macdonald et al., 1998). This nonthrombolized, uncoated part of the mesh “pulls” or “pushes” the rest of the mesh inside the aneurysm lumen, enhancing coil compaction within aneurysm lumen. A partial aneurysm recanalization can lead to aneurysm growth and relapsed subarachnoidal bleeding (Kuether et al., 1998). The density of the mesh may also be important because a higher mesh density reduces the possibility of large viscous inner volumes within the spiral “tuft.” At regular 1-year angiographic follow-up examinations, coils or coil meshes have been found to have changed their positions in up to 15% of all cases (Byrne et al., 1999). This finding explains the relation between a stable occlusion rate and the ratio of the aneurysm neck width to aneurysm diameter, as reported in the literature (Debrun et al., 1998a, 1998b; Gruber et al., 1999; Vinuela et al., 1997; Turjman et al., 1998; Satoh et al., 1998)
In conclusion, the three-dimensional simulation of endovascular coil treatment of intracranial aneurysms based on in vivo measurements shows both cause and effect on the local hemodynamics. The inserted platinum coils immediately and decisively relieve the influx of pulsating blood and allow for initial clotting. The density of the installed coils in both the aneurysm dome and at the orifice plays an important role in further developments; only then can the occlusion process develop. For a permanent occlusion and undisturbed scar formation, a zero-point reduction of the blood flow has to be attained at the interface of the parent vessel and aneurysm neck to avoid thrombolysis of the fresh clotting and subsequent coil migration. To achieve this effect, a volume density of approximately 20% platinum coil mesh in the aneurysm neck is needed.
The presented simulation of an in vivo aneurysm suffers from the inexactness of the modeling procedure, which could be improved through further research. In our center, studies of the influence of asymmetric outflow branches in cases of terminal aneurysms, different neck sizes, and the modeling of side-wall aneurysm management are currently underway. Special attention could be placed on perfecting the simulation of aneurysm irregularities (e.g., length, width, indentations caused by bony structures) and the relative effect of the relation between coil density and the proportionate size of neck to the aneurysm. Factors effecting partial thrombosis may also be discovered through improved modeling procedures.
Footnotes
Acknowledgment:
The authors thank Dr. Jarold Knispel for his advice regarding language.