
Abstract
In this study, the γ-aminobutyric acid (GABA) transporter at the blood–brain barrier (BBB) was identified by reverse transcription–polymerase chain reaction (RT-PCR), Western blot, and immunostaining analysis, and the transport mechanism was characterized using a conditionally immortalized mouse brain capillary endothelial cell line (TM-BBB) as an in vitro model of the BBB. γ-Aminobutyric acid transport was studied by the cellular uptake of [3H]GABA. [3H]GABA uptake by TM-BBB cells was Na+−, Cl−-, and concentration-dependent. The corresponding Michaelis–Menten constant was 679 ± 80 μmol/L and the maximal uptake rate was 4,790 ± 494 pmol/(mg protein · 5 minutes). [3 H]GABA uptake by TM-BBB cells was significantly inhibited by betaine, β-alanine, nipecotic acid, taurine, and quinidine, whereas probenecid, L-proline, creatine, and glycine had no effect. This type of inhibition is consistent with the predominant involvement of the GAT2/BGT-1 transporter in TM-BBB cells. RT-PCR analysis showed that GAT2/BGT-1 mRNA was expressed in TM-BBB cells, whereas Western blot analysis showed that TM-BBB cells and mouse brain capillaries express GAT2/BGT-1 protein. Moreover, confocal immunofluorescent microscopy of dual-labeled mouse brain sections demonstrated the colocalization of GAT2/BGT-1 and P-glycoprotein, a BBB-specific marker, on brain capillaries labeled with anti–GAT2/BGT-1 antibody and anti–P-glycoprotein antibody, respectively. These results are evidence that GAT2/BGT-1 is expressed at the BBB and is involved in GABA transport across the BBB.
Keywords
γ-Aminobutyric acid (GABA) plays a key role as an inhibitory neurotransmitter in the central nervous system (CNS). Therefore, abnormalities in regulating the GABA concentration in the CNS are involved in disorders such as Parkinson disease (Manyam et al., 1980), Alzheimer disease (Weiner et al., 1996), Huntington chorea (Perry et al., 1973; Barbeau, 1975), encephalitis, and epilepsy (Remler and Marcussen, 1983; During et al., 1995). The GABA transporters (GATs) in neuronal and glial cells play a key role in maintaining extracellular GABA concentrations (Amara and Arriza, 1993). The GABA transporters belong to the family of Na+− and Cl−-dependent neurotransmitter transporters (SCDNTs) (Masson et al., 1999). Three major subtypes of GABA transporter cDNA have been isolated and their transport functions were characterized in the rat. Thus, GAT-1 found in the CNS exhibits a selectivity for nipecotic acid (Guastella et al., 1990); GAT-2 found in the brain as a glial cell transporter is selective for β-alanine (Borden et al., 1992); and GAT-3 found in the brain as a glial cell transporter exhibits selectivity for both nipecotic acid and β-alanine (Borden et al., 1992; Clark et al., 1992). Conversely, betaine/GABA transporter-1 (BGT-1) isolated from canine kidney (Yamauchi et al., 1992) exhibits a lower affinity for GABA than the other three transporters and a selectivity for betaine (Borden, 1996). GAT-1, BGT-1, GAT-2, and GAT-3 in rat correspond to GAT1, GAT2, GAT3, and GAT4, respectively, in mouse.
The blood–brain barrier (BBB), which is formed by a complex of tight junctions of the brain capillary endothelial cells, has been shown to regulate not only the entry of nutrients and drugs into the brain from the circulating blood (Cornford, 1985; Pardridge et al., 1990), but also the efflux of excitatory neurotransmitters (Hosoya et al., 1999) and neuroactive steroids (Asaba et al., 2000; Hosoya et al., 2000 a) from brain to the circulating blood using the Brain Efflux Index (BEI) method (Kakee et al., 1996). Moreover, the authors have found evidence, using the BEI method, that GABA undergoes efflux from the brain to the circulating blood in rat when GABA transporters in neuronal and glial cells are inhibited by the presence of nipecotic acid (Kakee et al., 2001). This suggests that the efflux of GABA across the BBB occurs as a compensatory mechanism for GABA reuptake of neuronal and glial cells. Although Zhang and Liu (1998) suggested that high and low affinity GABA transport processes are present at the BBB, using isolated bovine brain capillaries and primary cultured endothelial cells, molecular identification of the GABA transport processes at the BBB has not yet been achieved.
The purpose of current study was to identify the GABA transporter at the BBB by reverse transcription–polymerase chain reaction (RT-PCR), Western blot, and immunostaining analysis. In addition, the transport mechanism of GABA was investigated by cellular uptake experiments using a conditionally immortalized mouse brain capillary endothelial cell line (TM-BBB) as an in vitro model of the BBB (Hosoya et al., 2000 b; Terasaki and Hosoya, 2001).
MATERIALS AND METHODS
Reagents
γ-[2,3-3H(N)] Aminobutyric acid ([3 H]GABA, specific activity: 3,448 GBq/mmol) was purchased from NEN Life Science Products (Boston, MA, U.S.A.); collagenase/dispase and endothelial cell growth factor were purchased from Boehringer Mannheim (Mannheim, Germany); γ-aminobutyric acid, benzylpenicillin potassium, and streptomycin sulfate were obtained from Wako Pure Chemical Industries (Osaka, Japan); sodium bicarbonate-free Dulbecco's modified Eagle's medium powder (DMEM powder) was obtained from Nissui (Tokyo, Japan). All other chemicals were of reagent grade and are available commercially.
Animals
Male ddY mice, weighing 25 to 30 g, were purchased from Charles River (Yokohama, Japan). The investigations using mice described in this report conformed to the guidelines established by the Animal Care Committee, Graduate School of Pharmaceutical Sciences, Tohoku University.
Cell culture and uptake experiments
TM-BBB2 cells were grown routinely in collagen type I–coated tissue flasks (Becton Dickinson, Bedford, MA, U.S.A.) at 33°C under 5% CO2/air. The permissive-temperature for TM-BBB2 cells culture is 33°C because of the expression of temperature-sensitive large T-antigen (Hosoya et al., 2000 b). The culture medium used consisted of DMEM supplemented with 20 mmol/L sodium bicarbonate, 15 ng/mL endothelial cell growth factor, 100 U/mL benzylpenicillin potassium, 100 μg/mL streptomycin sulfate, and 10% fetal bovine serum (FBS; Moregate, Bulimba, Australia), according to a previous report (Hosoya et al., 2000 b).
For the uptake study, TM-BBB2 cells were seeded at a density of 1.5 × 10 6 cells/cm 2 on rat tail collagen type I–coated 24 well plates (Becton Dickinson) and cultured for 72 hours. After removal of culture medium, cells were washed with extracellular fluid (ECF) buffer (122 mmol/L NaCl, 25 mmol/L NaHCO3, 3 mmol/L KCl, 1.4 mmol/L CaCl2, 2 mmol/L MgSO4, 0.4 mmol/L K2HPO4, 10 mmol/L d -glucose, 10 mmol/L HEPES, pH 7.4, 290 ± 15 mOsm/kg). The uptake study was performed at 37°C, the physiologic temperature. Uptake was initiated by applying 200 μL ECF buffer containing [3 H]GABA (9.25 Bq/well). After a predetermined time period, uptake was terminated by suctioning off the applied solution and immersing the plates in ice-cold ECF buffer. Na + -free ECF buffer was prepared by equimolar replacement of NaCl and NaHCO3 with choline chloride and choline bicarbonate, respectively. Cl − free ECF buffer was prepared by equimolar replacement of NaCl, KCl, and CaCl2 with sodium gluconate, potassium gluconate, and calcium gluconate, respectively. The cells were solubilized with 5N NaOH (200 μL) for 12 hours at 25°C and neutralized by 5N NaOH. Fifteen microliters of this solution was taken for protein assay using the DC protein assay kit (Bio-Rad, Hercules, CA, U.S.A.) with bovine serum albumin as a standard. The remainder of the sample (500 μL) was mixed with 5 mL scintillation cocktail (Hionic-fluor, Packard, Meriden, CT, U.S.A.), and the radioactivity was measured in a liquid scintillation counter (LS 6500; Beckman, Fullerton, CA, U.S.A.). The degree of uptake of test compound by the cells was estimated from the radioactivity in the sample and expressed as the cell-to-medium ratio (μL/mg protein). Thus, the [3 H]GABA concentration in the cells was divided by the initial medium concentration in the extracellular compartment and was corrected by the amount of cellular protein. The [14 C]inulin (NEN Life Science Products) uptake study was performed to estimate the volume of adhering water. The resulting cell-to-medium ratio was 0.1 to 0.2 μL/mg protein and 100-fold less than that of [3 H]GABA. Therefore, adhering water was ignored when calculating the cell-to-medium ratio of [3 H]GABA.
Data analysis
For kinetic studies, the Michaelis–Menten constant (Km) and the maximum uptake rate (Vmax) of [3 H]GABA were estimated from the following equation using the nonlinear, least-squares regression analysis program, MULTI (Yamaoka et al., 1981).

where V and C are the uptake rate of [3H]GABA and the concentration of GABA, respectively.
Unless otherwise indicated, all data represent mean ± SD. Statistical significance among means of more than two groups was determined by one way analysis of variance followed by the modified Fisher's least squares difference method.
Reverse transcription–polymerase chain reaction analysis
The sequences of specific oligonucleotide primers were as follows: sense primer 5′-gAAgCCAgCggAgACAgTTTCTg-3′ and antisense primer 5′-gAgCAgCAAgAAggAgACCTCCT-3′ for GAT1; sense primer 5′-TCCTCTCCAgCCAAACAAgAACT-3′ and antisense primer 5′-ATgCAggCTTgTTAgCTgCTgCA-3′ for GAT2/BGT-1; sense primer 5′-AACTgCTCCTgCgACACCgATgA-3′ and antisense primer 5′-TTggATTTAATgACATggAAggAAgAg-3′ for GAT3; sense primer 5′-CCAgCTgCTCACACACAgCCCAC-3′ and antisense primer 5′-CgAgCAgACAgACAATCTTgTgC-3′ for GAT4. Total RNA was isolated from mouse brain and TM-BBB2 cells using Trizol reagent (Gibco BRL, Grand Island, NY, U.S.A.), according to the manufacturer's protocol. cDNA was generated from the RNA using a RiverTra Ace (TOYOBO, Osaka, Japan). The PCR was performed with the cDNA, individual specific primer sets, and HotStarTaq (QIAGEN, Hilden, Germany) through 40 cycles at 94°C for 30 seconds, 55°C for 30 seconds, and 72°C for 1 minute after preincubation at 95°C for 15 minutes, and then 1 cycle at 72°C for 10 minutes. The PCR products were separated by electrophoresis on agarose gel in the presence of ethidium bromide and were visualized using an imager (EPIPRO 7000; Aisin, Aichi, Japan). These products then were cloned into a plasmid vector using the p-GEM-T Easy Vector System I (Promega. Madison, WI, U.S.A.) and were sequenced from both directions by the DNA sequencer (model 4200; LI-COR, Lincoln, NE, U.S.A.).
Western blot analysis
The membrane protein fraction of TM-BBB2 cells, kidney epithelial cells, and mouse brain capillary for GAT2/BGT-1 was prepared using the procedure described in a previous report (Hosoya et al., 2000 b).
Membrane proteins (50 μg per lane) were electrophoresed on 10% sodium dodecyl sulfate–polyacrylamide gels and subsequently were electrotransferred to nitrocellulose membranes (Toyo Roshi, Tokyo, Japan). Membranes were treated with blocking agent solution (Block Ace; Dainihon Pharmaceutical, Osaka, Japan) for 1 hour at room temperature and were incubated with rabbit GAT2/BGT-1 antibody (5 μg/mL; Chemicon, Temecula, CA, U.S.A.) for 16 hours at 4°C in the presence or absence of GAT2/BGT-1 peptide (9 μg/mL; Alpha Diagnostic International, San Antonio, TX, U.S.A.). Membranes were washed 4 times with 0.1% Tween 20/phosphate-buffered saline (PBS) and then incubated with horseradish peroxidase conjugated goat anti-rabbit IgG (1:500; ICN, Aurora, OH, U.S.A.) for 1 hour at room temperature. Immunoreactivity was visualized with an enhanced chemiluminescence kit (Supersignal west pico chemiluminescent substate; Pierce, Rockford, IL, U.S.A.).
Immunostaining analysis
Adult ddY mice were anesthetized with an intramuscular injection of ketamine and xylazine before perfusion through the carotid artery with 4% paraformaldehyde in 0.1 mol/L phosphate buffer. The cerebrum from each animal was isolated and immersed in 12% sucrose/Hepes-buffered saline solution (HBSS), 15% sucrose/HBSS, and 18% sucrose/HBSS in sequential order to protect the tissue against freezing. Sagittal sections (10-μm-thick) were cut from the frozen cerebrum using a Leica cryostat (CM1900; Leica, Heidelberg, Germany) and were mounted onto silanized slide glasses (DAKO, Carpinteria, MA, U.S.A.). The sections were incubated with 5% FBS/PBS for 1 hour to block nonspecific staining. The primary antibody (1 μg/mL rabbit GAT2/BGT-1 antibody or 0.5 μg/mL mouse anti–P-glycoprotein antibody (C219; Signet, Dedham, MA, U.S.A.)) was applied to the sections and was incubated for 16 hours at 4°C, followed by incubation with fluorescein isothiocyanate–conjugated swine anti-rabbit IgG (1:40, DAKO) and fluorescein isothiocyanate–conjugated goat anti-mouse IgG (1:200; ICN) as a secondary antibody. For double staining, rhodamine-conjugated goat anti-mouse IgG (1:200; Immunotech, Marseilles, France) was used as a secondary antibody for anti–P-glycoprotein antibody. Sections were shielded using “Vectashield” mounting medium with propidium iodide (Vector Laboratories, Burlingame, CA, U.S.A.) for single staining or fluorescent mounting medium (DAKO) for double staining.
The immunofluorescent-stained sections were viewed using a confocal laser microscope (TCS SP; Leica, Heidelberg, Germany) equipped with dual-channel illumination and simultaneous image recording of the two different fluorochromes.
RESULTS
Na + -dependence and Cl−-dependence of [3 H]GABA uptake
The time courses of [3 H]GABA uptake by TM-BBB2 cells in the presence or absence of Na + and Cl − are shown in Fig. 1. [3 H]GABA uptake increased linearly by 16.7 ± 1.1 μL/mg protein at 10 minutes and its initial uptake rate was 1.76 μL/(mg protein · minute) in the presence of Na + and Cl −. In contrast, under either Na+− or Cl−-free conditions, the [3 H]GABA uptake was 2.30 ± 0.50 μL/mg protein or 2.90 ± 0.40 μL/mg protein at 10 minutes, a significant reduction of 86.2% or 82.5%, respectively, compared with that in the presence of Na + and Cl −. These results indicate that GABA uptake by TM-BBB2 cells is a Na+− and Cl−-dependent process.
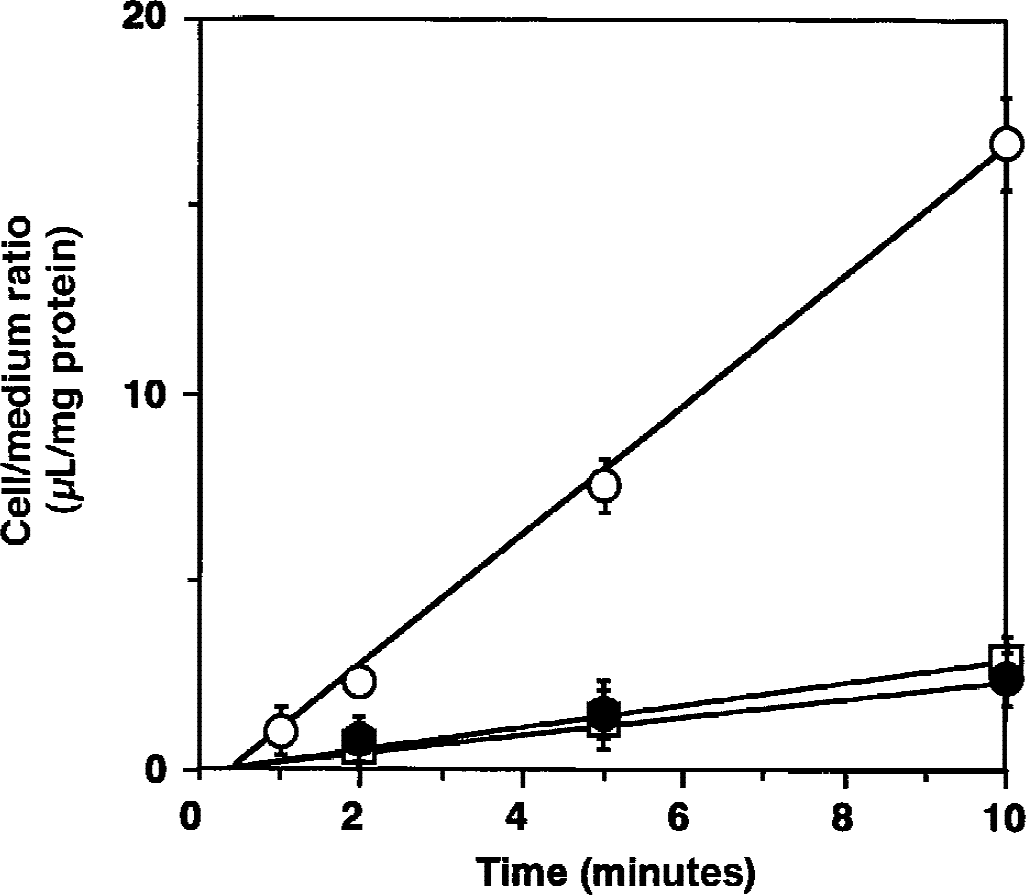
Time courses of [3 H]GABA uptake by TM-BBB2 cells in the presence or absence of Na + and Cl −. The [3 H]GABA uptake (10 nmol/L) was performed in the presence (open circles) or absence of Na + (filled circles) and Cl − (open squares) at 37°C. Each point represents the mean ± SD (n = 3 to 4).
Concentration-dependence of [3 H]GABA uptake
[3 H]GABA uptake by TM-BBB2 was also concentration-dependent for the range 60 nmol/L to 1 mmol/L (Fig. 2). Nonlinear, least-squares regression analysis was performed to give the best fit using the uptake rate for 5 minutes, yielding the following kinetic parameters: Km and Vmax were 679 ± 80 μmol/L and 4,790 ± 494 pmol/(mg protein · 5 minutes), respectively.
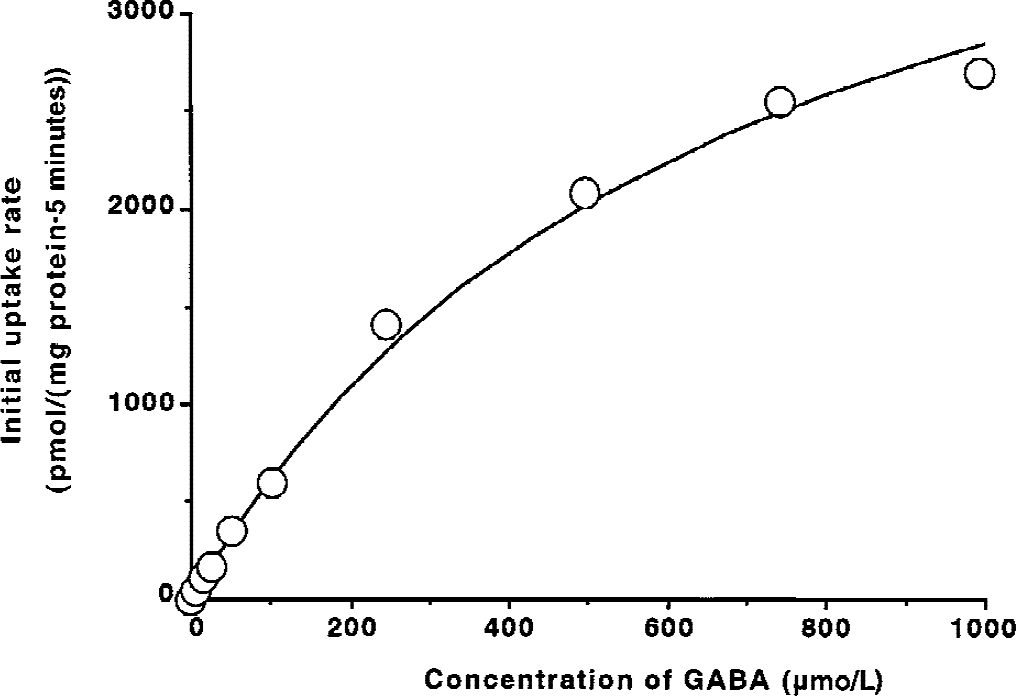
Concentration-dependence of γ-aminobutyric acid (GABA) uptake by TM-BBB2 cells. [3 H]GABA uptake (10 nmol/L) was performed at 37°C for 5 minutes. Each point represents the mean ± SD (n = 3 to 4). The deviation bar is smaller than the size of the symbol. Km and Vmax are 679 ± 80 μmol/L and 4,790 ± 494 pmol/(mg protein · 5 minutes), respectively.
Inhibitory effect of several compounds on [3 H]GABA uptake
The effect of substrates and inhibitors of the GABA transporter, organic anions, and amino acids on [3 H]GABA uptake by TM-BBB2 cells is summarized in Table 1. β-Alanine, taurine, and quinidine at 0.5 mmol/L markedly inhibited [3 H]GABA uptake by 81.8%, 89.1%, and 81.4%, respectively. Betaine and nipecotic acid at 0.5 mmol/L significantly inhibited this process by 22.2% and 37.1%, respectively. In contrast, probenecid, an organic anion transporter inhibitor, creatine, l -proline, and glycine, substrates of other neurotransmitter transporters, had no marked effect on [3 H]GABA uptake even at 2 mmol/L.
Effect of several compounds on [3H]GABA uptake by TM-BBB2 cells
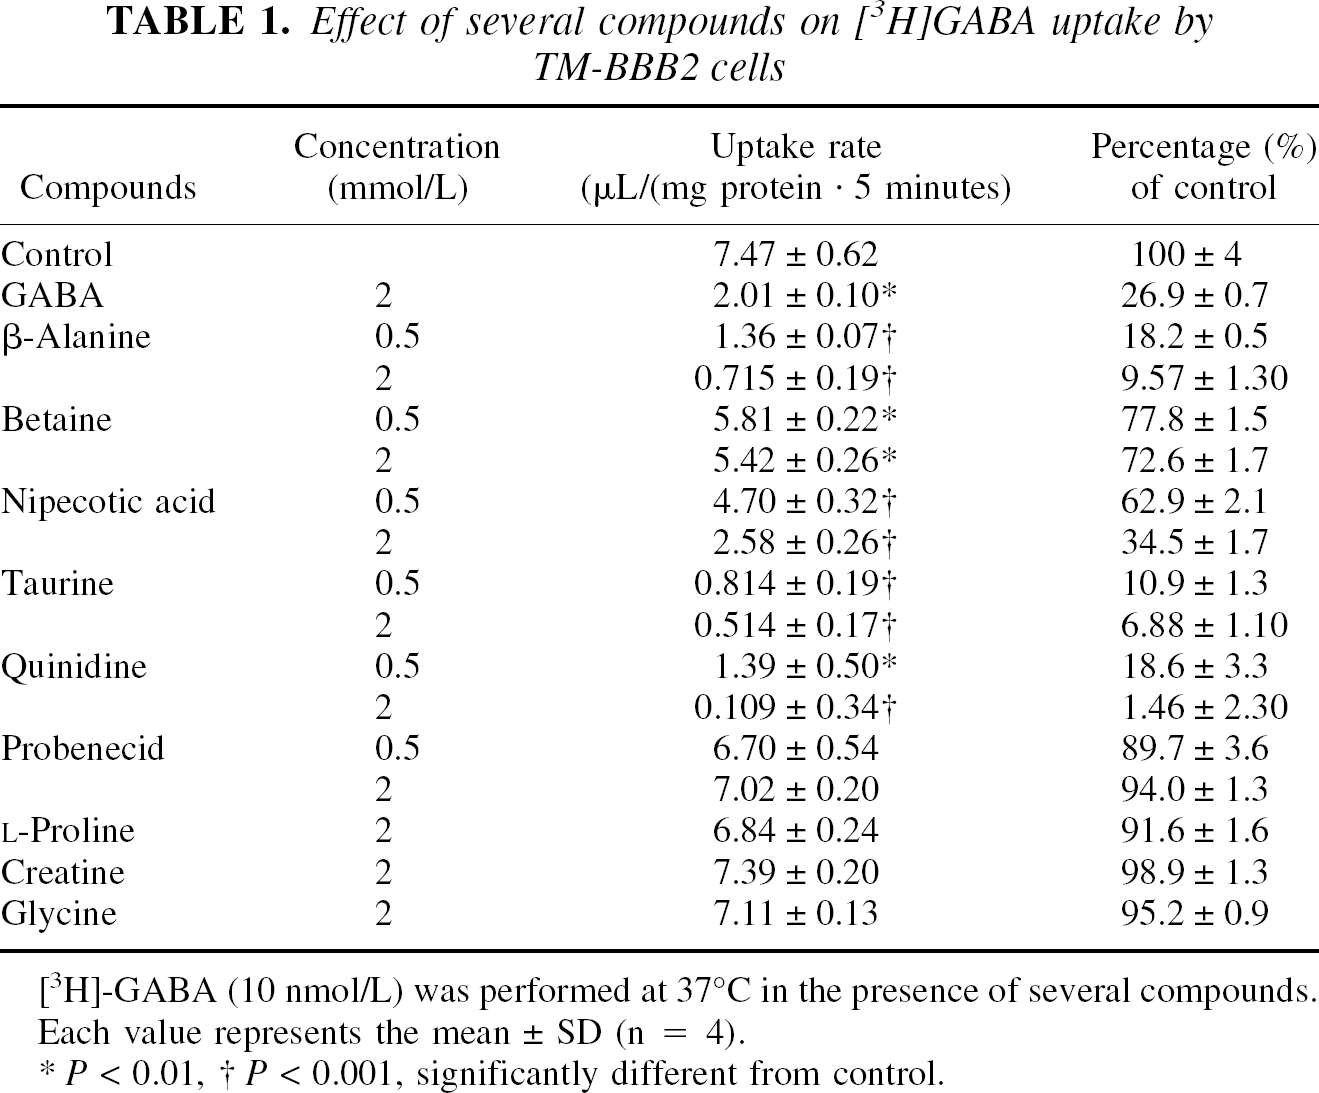
[3H]-GABA (10 nmol/L) was performed at 37°C in the presence of several compounds.
Each value represents the mean ± SD (n = 4).
P> 0.01,
P> 0.001, significantly different from control.
Expression of GABA transporter mRNA in TM-BBB2 cells
The type of inhibition was consistent with the presence of GABA transporter in TM-BBB2 cells. Reverse transcriptase–polymerase chain reaction analysis was performed to determine the expression of GABA transporter in TM-BBB2 cells using total RNA isolated from TM-BBB2 cells and mouse brain and primers that are specific for GAT1, GAT2/BGT-1, GAT3, and GAT4 (Fig. 3). Although GAT1 at 600 bp, GAT2/BGT-1 at 439 bp, GAT3 at 355 bp, and GAT4 at 367 bp were amplified from mouse brain, only GAT2/BGT-1 was amplified in TM-BBB2 cells. The nucleotide sequence of the bands of mouse brain and TM-BBB2 cells were identical to mouse GAT1, GAT2, GAT3, and GAT4, with a homology of 100%, 97%, 98%, and 99%, respectively (GeneBank accession numbers: M92378, M97632, L04663, and L04662).
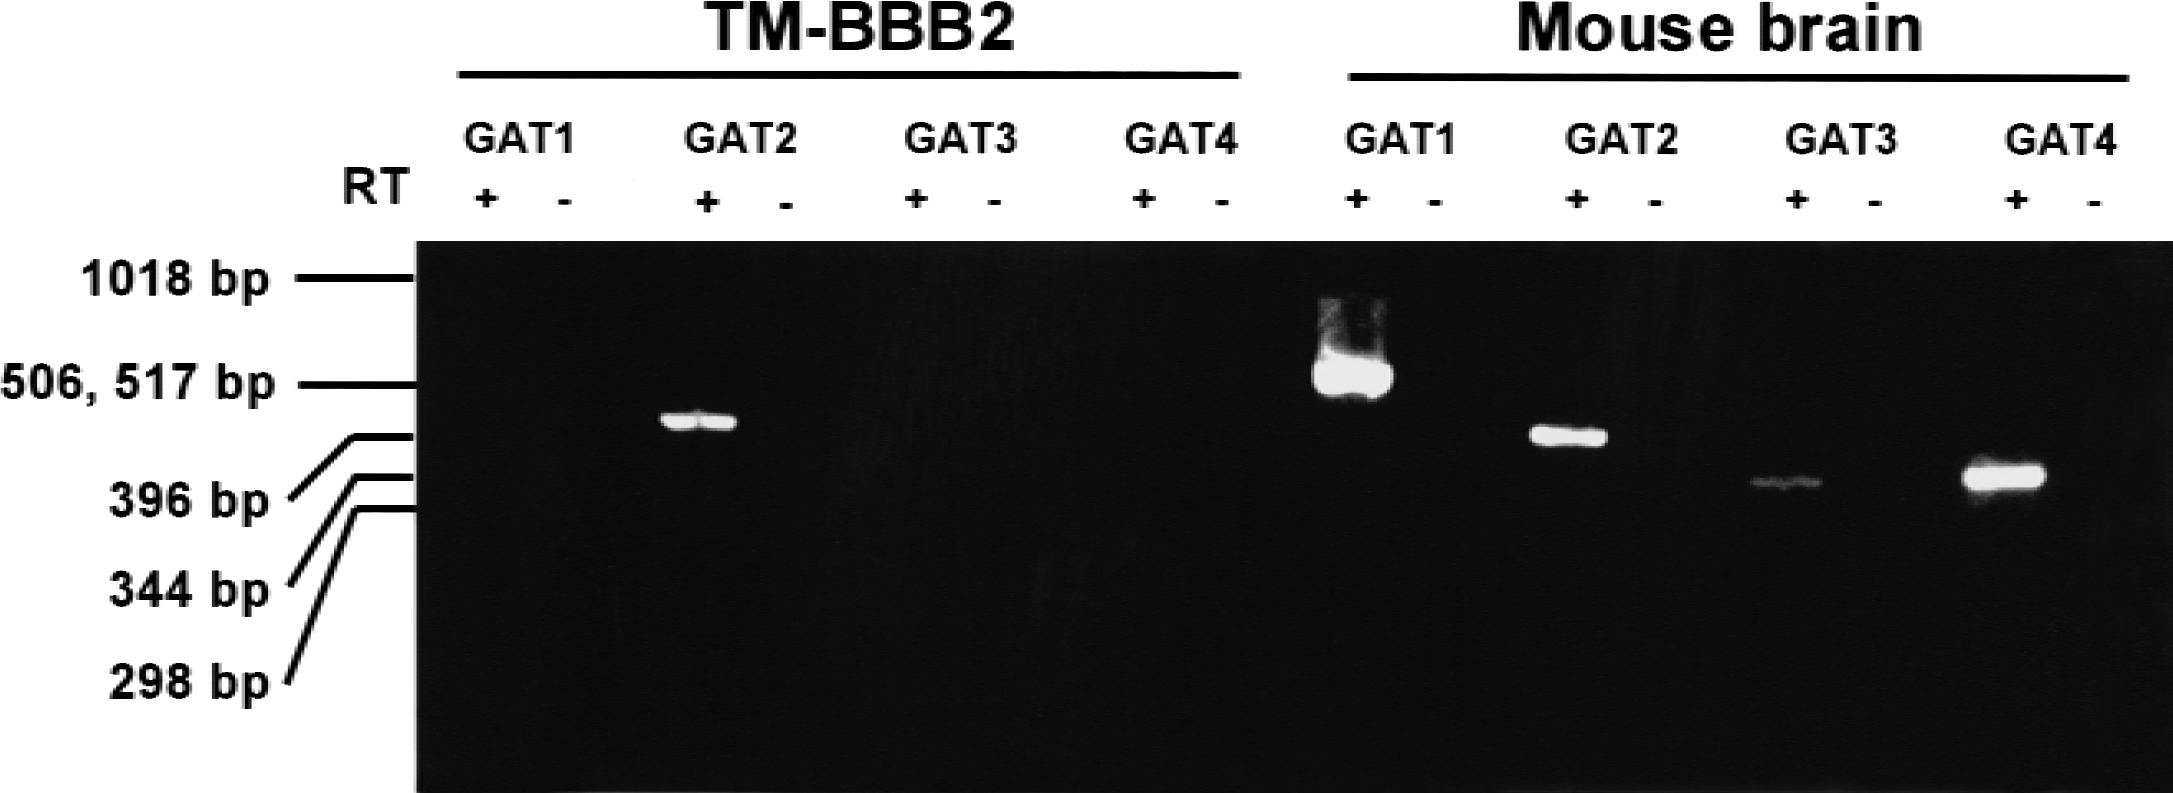
Reverse transcription–polymerase chain reaction analysis of GAT isoforms in TM-BBB2 cells and mouse brain. In mouse brain, GAT1 at 600 bp, GAT2/BGT-1 at 439 bp, GAT3 at 355 bp, and GAT4 at 367 bp were amplified. In TM-BBB2 cells, only GAT2/BGT-1 was amplified. (+) and (−) represent the presence or absence of reverse transcriptase, respectively.
Expression of GAT2/BGT-1 protein in TM-BBB2 cells and mouse brain capillaries
The expression of GAT2/BGT-1 in TM-BBB 2 cells and mouse brain capillaries was determined by Western blot analysis using anti–GAT2/BGT-1 antibody, as shown in Fig. 4A. The single bands at 68 kDa, which were detected in mouse brain capillaries and TM-BBB2 cells, had the same molecular weight as that in mouse kidney epithelial cells used as a positive control. However, the band at ∼50 kDa also was detected in mouse kidney epithelial cells. The band at 68 kDa was absent in all samples when anti–GAT2/BGT-1 antibody was preabsorbed with the GAT2/BGT-1 peptide (Fig. 4B), but the band at ∼50 kDa in mouse kidney epithelial cells remained. These findings indicate that TM-BBB2 cells and mouse brain capillary express GAT2/BGT-1 protein.
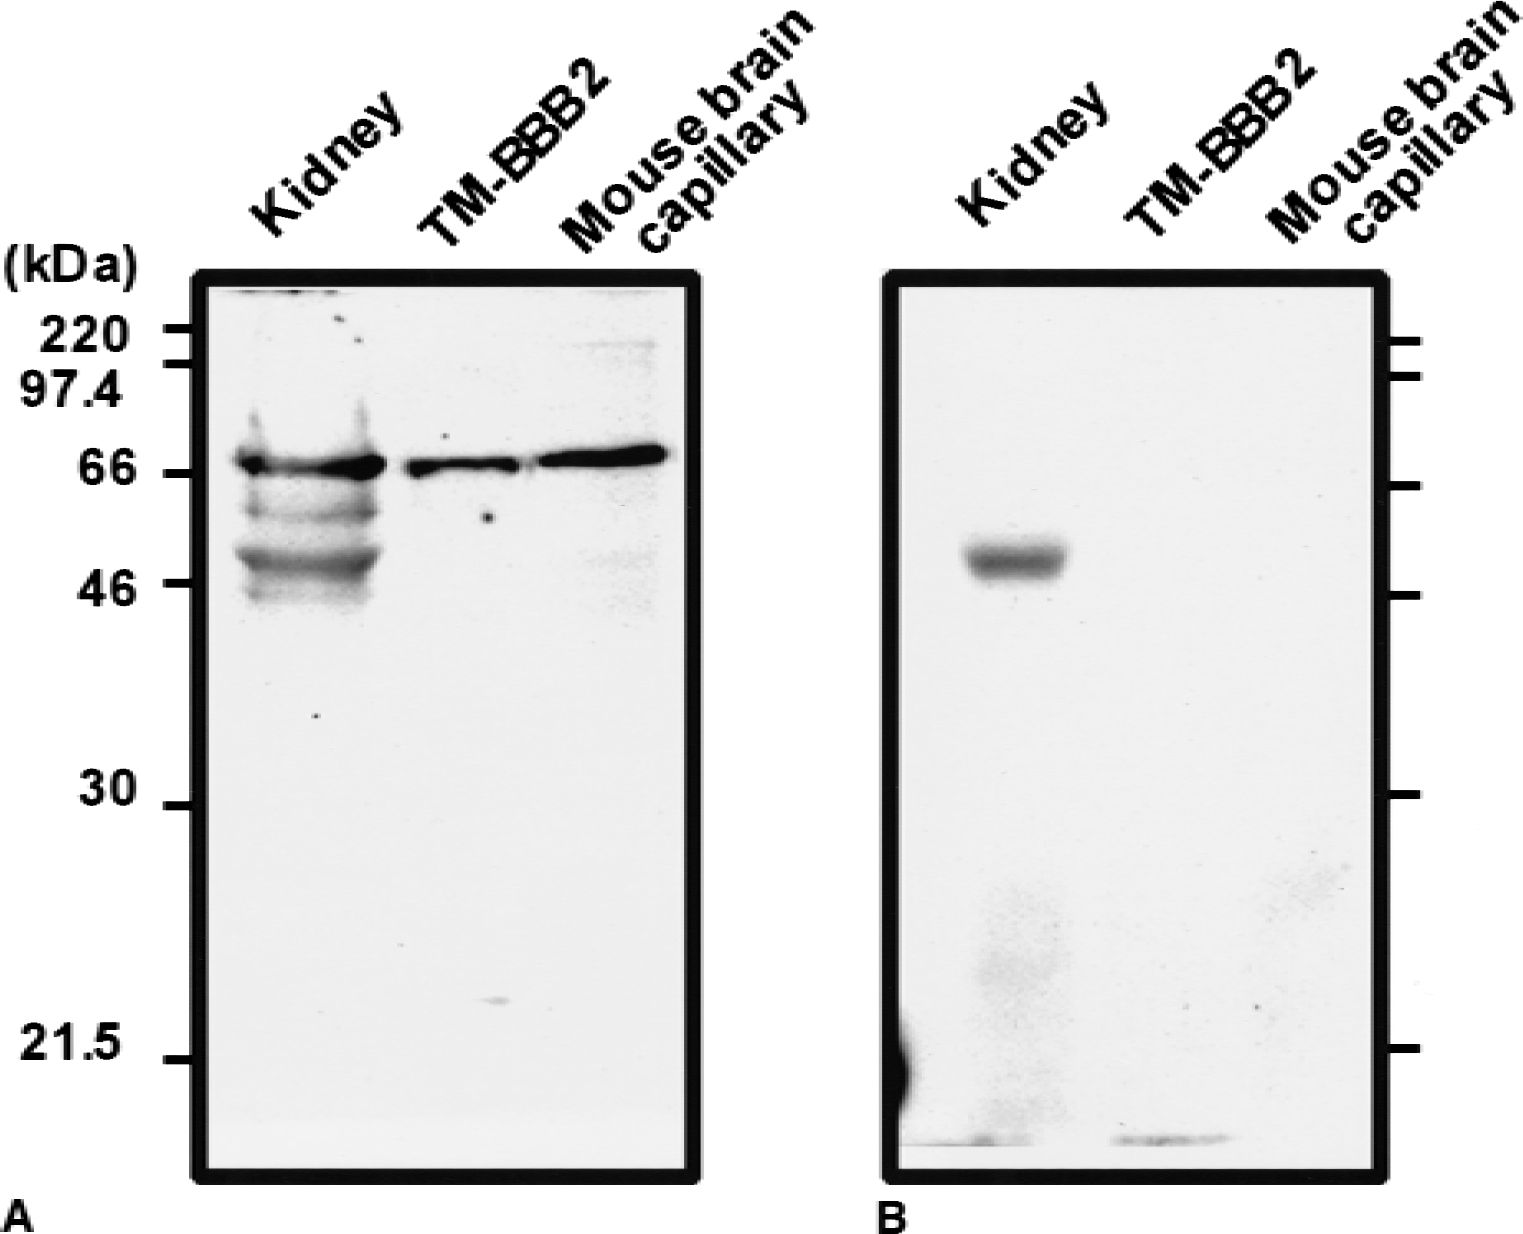
Western blot analysis of GAT2/BGT-1 using anti–GAT2/BGT-1 antibody
Localization of GAT2/BGT-1 protein in mouse brain
Confocal immunofluorescent microscopy of dual-labeled mouse brain sections demonstrated the localization GAT2/BGT-1 protein as labeled with anti–GAT2/BGT-1 antibody and the colocalization of anti–GAT2/BGT-1 and anti–P-glycoprotein as a specific BBB marker (Fig. 5). The brain capillaries were predominantly stained with anti–P-glycoprotein antibody (green; Fig. 5A) and anti–GAT2/BGT-1 antibody (green; Fig. 5B). The red staining with propidium iodide demonstrated the cell nucleus. The brain section labeled with rabbit IgG and anti–GAT2/BGT-1 antibody in the presence of GAT2/BGT-1 peptide exhibited no fluorescent signal (data not shown). Colocalization of anti–P-glycoprotein antibody and anti–GAT2/BGT-1 antibody was identified in Fig. 5E, where the localization pattern of GAT2/BGT-1 (green; Fig. 5C) and P-glycoprotein (red; Fig. 5D) were identical and overlapped completely on the brain capillaries, as demonstrated by the yellow signal (Fig. 5E).
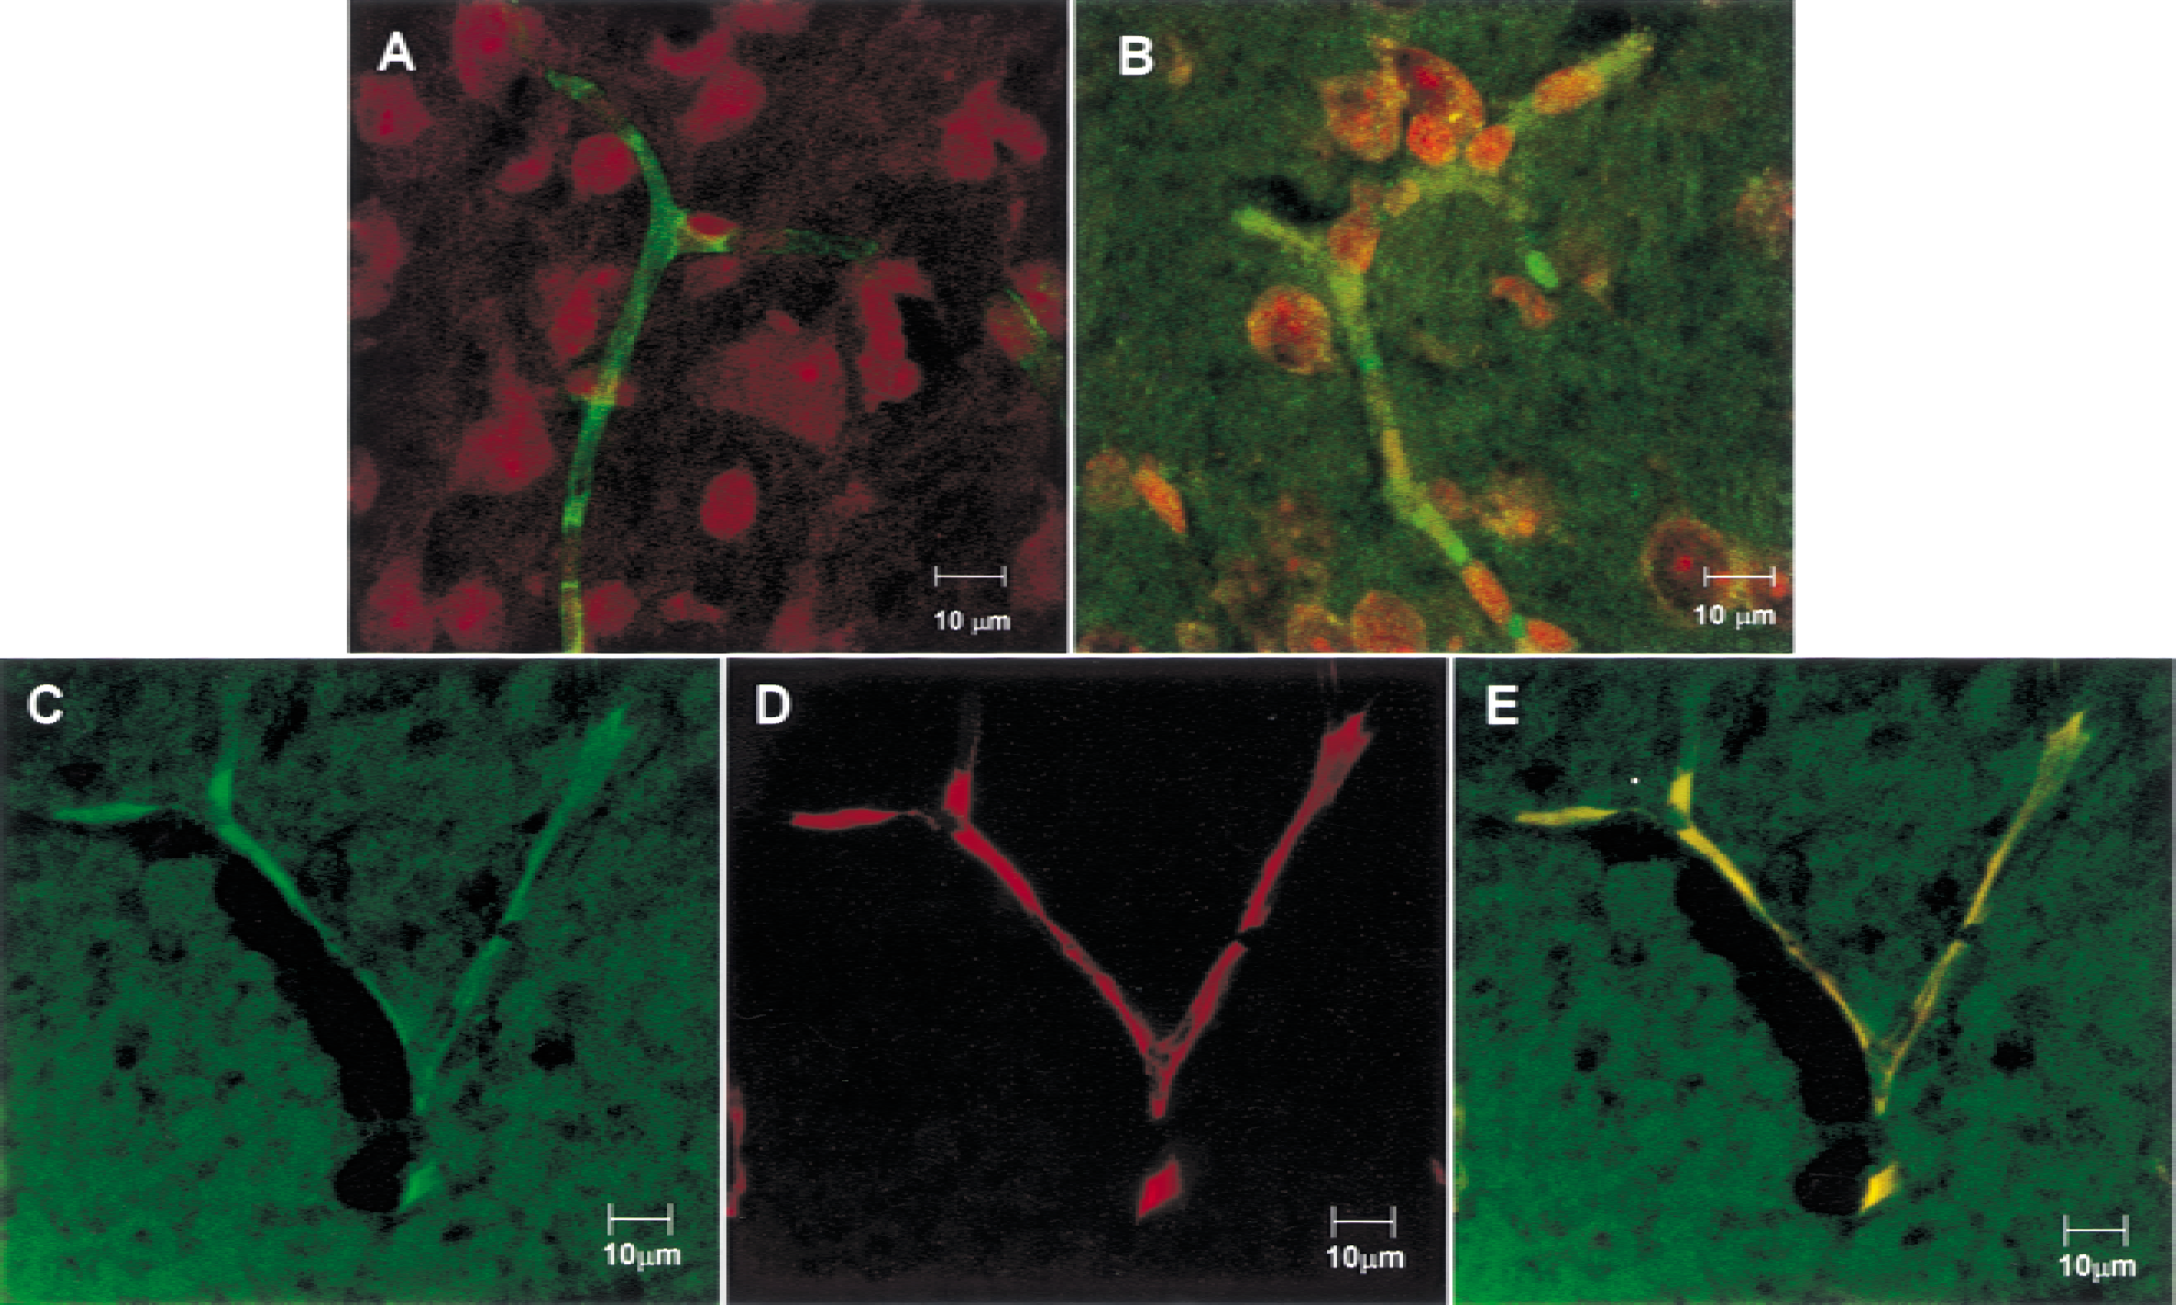
Confocal immunofluorescence microscope images of single-or dual-labeled mouse brain sections. The brain capillary was predominantly stained with anti–P-glycoprotein antibody (green)
DISCUSSION
The current study demonstrates that GAT2/BGT-1 is expressed in TM-BBB2 cells and mouse brain capillaries and plays a role in GABA uptake by TM-BBB2 cells used as an in vitro BBB model. This GABA uptake was a Na+−, Cl − −, and concentration-dependent process (Figs. 1 and 2). The corresponding Km value of 679 μmol/L is in good agreement with an apparent Km of 485 μmol/L obtained from [3 H]GABA uptake by bovine brain capillaries (Zhang and Liu, 1998). Zhang and Liu also obtained a high affinity Km value of 25 μmol/L (Zhang and Liu, 1998). Although all GATs exhibit Na+− and Cl−-dependent GABA transport, the affinity for GABA transport in GATs is different (Masson et al., 1999). GAT2/BGT-1 with a Km value of 79 μmol/L indicated a lower affinity than that of GAT1, 3, and 4 (0.6 to 18 μmol/L) (Borden et al., 1992). Therefore, GABA uptake by TM-BBB2 cells is most likely mediated by GAT2/BGT-1. Moreover, this process was significantly inhibited by betaine and quinidine (Table 1), a specific substrate and relatively specific inhibitor of GAT2/BGT-1, respectively (Borden, 1996). β-Alanine, nipecotic acid, and taurine appear to be more potent inhibitors than betaine with regard to GABA uptake by TM-BBB2 cells (Table 1). Although these results based on inhibition studies are not in agreement with a previous report (Rasola et al., 1995; Zhang and Liu, 1998), GAT2/BGT-1 is predominantly involved in GABA uptake by TM-BBB2 cells. This evidence was strongly supported by the RT-PCR and Western blot analysis. GAT1, 3, and 4 mRNA failed to amplify in TM-BBB2 cells, but all isoforms were amplified in the rat brain as reported elsewhere (Borden et al., 1992) (Fig. 3). Nevertheless, only GAT2/BGT-1 mRNA was amplified in TM-BBB2 cells (Fig. 3). Western blot analysis showed that GAT2/BGT-1 protein at 68 kDa was expressed in TM-BBB2 cells and mouse brain capillaries as well as in kidney epithelial cells used as a positive control (Yamauchi et al., 1992) (Fig. 4). Moreover, using confocal immunofluorescent microscopy and anti–GAT2/BGT-1 and anti–P-glycoprotein antibodies, GAT2/BGT-1 protein was colocalized with P-glycoprotein, which is a specific BBB marker (Schinkel et al., 1994), on mouse brain capillaries (Fig. 5). This is the first evidence to prove that GAT2/BGT-1 is located in brain capillaries even though Borden (1996) reported that GAT2/BGT-1 mRNA is present in the brain using in situ hybridization.
The authors also obtained in vivo evidence that GABA undergoes efflux from the brain into the circulating blood across the rat BBB using the BEI method when GATs in neuronal and glial cells were inhibited by nipecotic acid (Kakee et al., 2001). The release of GABA in neuronal and glial cells was stimulated by an increase in extracellular l -glutamate concentration (During et al., 1995). GABA undergoes hardly any influx transport from the circulating blood to the brain across the BBB (Van Gelder and Elliot, 1958; Kuriyama and Sze, 1971), supporting the belief that GAT2/BGT-1 is not involved in influx transport. Taken together, GAT2/BGT-1 most probably acts on GABA efflux transport at the BBB to compensate for reuptake of GABA in neuronal and glial cells.
A possible role for the efflux transport of GAT2/BGT-1 at the BBB may be to regulate osmolarity in the brain because the GAT2/BGT-1 gene has been found in kidney as a betaine and GABA transporter to concentrate urine (Yamauchi et al., 1992), and a tonicity-responsive enhancer element (TonE) in its 5′-flanking region has been identified (Kaneko et al., 1997). Betaine is one of the major compatible osmolytes in the kidney (Yamauchi et al., 1992) and is produced by choline oxidation in the brain (Garner et al., 1995). Moreover, GAT2/BGT-1 may not act by terminating GABA release from presynaptic terminals, at least under normal conditions, because the affinity of GAT2/BGT-1 for GABA is less than that of other GAT isoforms (Borden, 1996). Under hypertonic conditions, the concentrations of small organic solutes such as taurine, myo-inositol, and betaine are increased in the brain, and these corresponding transporters undergo up-regulation (Bitoun and Tappaz, 2000). Osmolarity regulation in the brain is important for maintaining a constant milieu in the CNS because hypertonicity causes brain edema (Thurston et al., 1980). Interestingly, a Na+− and Cl−-dependent taurine and β-alanine transport system is present in the bovine brain capillary endothelial cells (Komura et al., 1996), suggesting that the BBB may express a taurine transport system, TauT gene. In salt-loaded rats, the expression of BGT-1 was more marked than that of TauT in the whole brain (Bitoun and Tappaz, 2000), suggesting that BGT-1 is a more potent osmoregulator than TauT in the brain. The BBB plays major roles in not only preventing the substances in the blood from diffusing freely into the brain, but also in the efflux of osmolytes to regulate osmolarity in the brain (Terasaki and Hosoya, 1999).
From a pharmacologic viewpoint, GABA transporter inhibitors, which have a high affinity for GAT1, 3, and 4 and a low affinity for GAT2/BGT-1, suggest the interesting possibility that they may increase GABAnergic activity, but are not involved in efflux from the brain. These findings are important in drug design for the development of novel therapeutic agents, such as anticonvulsant drugs.
Conclusion
This is the first evidence that GAT2/BGT-1 is expressed at the mouse BBB and is involved in GABA transport across the BBB. The current results and the authors' previous report support the idea that GAT2/BGT-1 is responsible for GABA efflux transport across the BBB. The physiologic role of GAT2/BGT-1 at the BBB appears to be as an osmoregulator in the brain. These findings give important information to help understand the physiologic role of the BBB and the design of CNS-acting drugs.
Footnotes
Acknowledgment:
The authors thank Ms. N. Funayama for secretarial assistance.