
Abstract
Previous positron emission tomography (PET) measurements of cerebral glucose transport using [11C]-3-O-methylglucose (CMG) suggested an interindividual variation in the values of the rate constant of tracer outflow (k2) larger than that for the clearance rate of inflow (K1). These two parameters were examined in healthy cerebral cortex by dynamic PET in 4 men and 2 women (aged 24 to 73 years) without neurologic disease, and in 1 man (42 years) with a recent left hemispheric cerebral infarction under normoglycemia (average blood plasma d-glucose concentration, 5.44 ± 1.94 μmol/mL) and again under hyperglycemia (average, 10.24 ± 1.44 μmol/mL). Time-radioactivity curves were obtained from healthy cortex (grey matter) and plasma and analyzed for the values of K1 and k2 by two graphical approaches and two fitting procedures. Both K1 and k2 significantly declined with increasing plasma glucose levels. A highly significant interindividual but not intraindividual variability for k2 was found at normoglycemia and hyperglycemia. The interindividual variability of K1, although borderline significant, was less than that of k2. Accordingly variable were the distribution volumes K1 /k2. These data suggest individualized glial cell function and may be relevant to pathogenesis of neuropsychiatric disease.
The regional cerebral metabolic rate of glucose (rCMRGlc) can be measured in vivo using the d-glucose analogue 2-deoxyglucose (DG) (Sokoloff et al., 1977) labeled with 18-F (FDG) and positron emission tomography (PET) (Reivich et al., 1979; Phelps et al., 1979). The potential diagnostic information is relevant not only in neurology and psychiatry, but also is well known in cardiology and oncology. In the brain, FDG is transported across the blood–brain barrier (BBB) by facilitated diffusion similar to d-glucose, the natural substrate for the glucose transporter (GLUT) in the brain capillary endothelium. The transport rate is conventionally analyzed with the help of a first order model of enzyme kinetics according to Michaelis–Menten; at substrate saturation of the transport system, the transport velocity V is at maximum, Vmax (Pardridge and Oldendorf, 1975; Gruetter et al., 1998). The Michaelis–Menten parameter Vmax, also referred to as Tmax, describes the capacity of the transporter. Km, the half saturation constant for the transporter, expresses substrate affinity to the transporter. Both parameters repeatedly have been investigated with tracer techniques in animals and humans (Gjedde, 1981; Crane et al., 1983; Vyska et al., 1985; Brooks et al., 1986 a, 1986b). Experiments confirm that d-glucose transport across the BBB is not the rate-limiting step in healthy cerebral glycolytic metabolism; however, dysfunction of the BBB may occur in different brain diseases (Kalaria and Harik, 1989; Pardridge et al., 1990; DeVivo et al., 1991).
The function of the BBB is complex and not yet fully understood. It links the lumen of the capillary brain vessels to neurons, with glial cells as intermediates (Magistretti et al., 1995, 1999; Vannucci et al., 1997, 1998). Figure 1 attempts to bring the various components of the BBB into a unified scheme. d-glucose actively diffuses across the endothelial cells of the capillary wall into intimately connected astrocytes from where glucose as well as the glycolysis products lactate and perhaps pyruvate are transferred into intimately connected neurons. The function of the BBB is conventionally expressed by K1 and k2, with K1 being the clearance rate of d-glucose transported from the circulating blood into extravascular brain tissue, and k2 the rate constant of return from the free tissue glucose pool back into blood circulation. The value of K1 in conjunction with regional cerebral blood flow and plasma glucose concentration is usually regarded to be sufficient for describing the transport system.
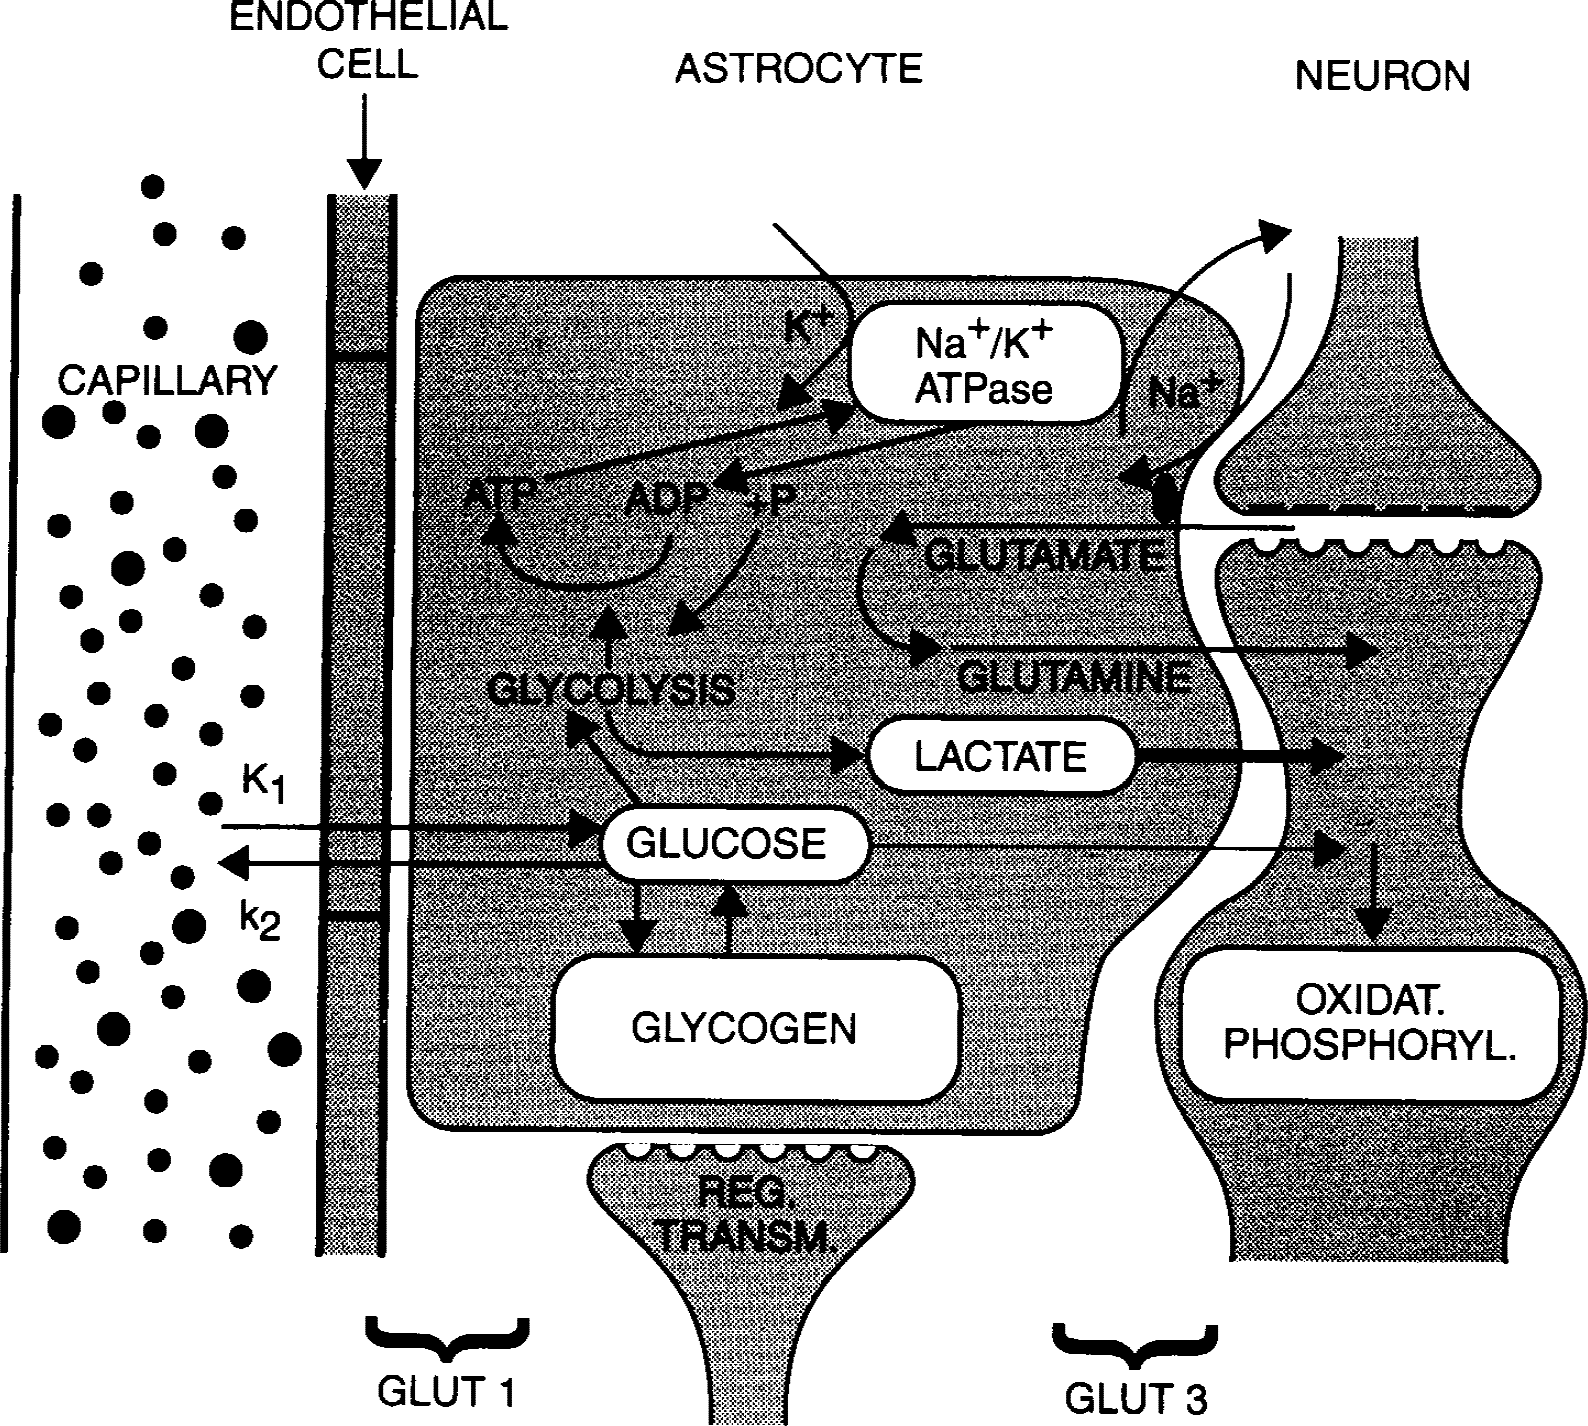
Schematic drawing of the blood–brain barrier and glial cell function regarding glucose. Adapted from data from Magistretti et al., 1995, 1999; and Vanucci et al., 1997.
The structure of the glucose transporter molecules has been identified (Dick et al., 1984; Gerhart et al., 1989) and their genes have been cloned (Birnbaum et al., 1986; Matthaei et al., 1987). The transporter GLUT 1 is mainly located in the endothelial-astrocyte membranes, whereas GLUT 3 is preferentially found in neuronal membranes (Vannucci et al., 1998).
The rate of d-glucose transport has been investigated in vitro (Betz et al., 1979; Joo, 1985; Vannucci et al., 1998) and in vivo (Hertz et al., 1981; Blomqvist et al., 1991; Hasselbalch et al., 1996) using labeled d-glucose and deoxyglucose. The latter substrate is a competitive inhibitor of d-glucose with known different affinity to the transporter system (Pardridge and Oldendorf 1975; Sokoloff et al., 1977).
A more specific approach to quantify the d-glucose transport rate constants used 3-O-methylglucose (MG) labeled with [3H] or [14C] in animals (Gjedde, 1981; Namba et al., 1987) or [11C] for PET measurements in humans (Kloster et al., 1981; Heiss et al., 1981; Vyska et al., 1985; Feinendegen et al., 1986; Brooks et al., 1986 a, 1986b). MG is transported across the BBB similar to d-glucose but is not metabolized. The in vivo observations in the healthy human brain principally confirmed the animal data: MG competes with d-glucose, has a lower affinity to the transporter than d-glucose, enters the free glucose pool in tissue, and returns from there into the circulating blood. MG accumulates in the brain with time after tracer injection to equilibrium between blood and extravascular tissue. The equilibrium indicates the reversible transport of MG across the BBB between the capillary lumen and the free glucose pool in tissue (Vyska et al., 1985; Gjedde et al., 1985; Feinendegen et al., 1986; Namba et al., 1987; Jay et al., 1990); a second relatively small tissue compartment may be involved (Brooks et al., 1986 a).
Hyperglycemia significantly reduced the rate of MG inflow across the BBB, regardless of the level of circulating insulin (Brooks et al., 1986b; Feinendegen et al., 1986). Whereas the clearance rates K1 for MG in the healthy brain were reported to be rather similar and not statistically different in various individuals at given plasma glucose levels, there was more variability in the k2 values under both normoglycemia and hyperglycemia, suggesting a greater interindividual than intraindividual variability (Feinendegen et al., 1986). Another suggestive but not statistically significant interindividual variability of k2, in contrast to K1, was observed in both the cerebral cortex and white matter in four diabetic subjects at various plasma glucose levels, regardless of the circulating insulin concentration (Brooks et al., 1986b). This variability usually is attributed to experimental error and to different methods of measurement and data analysis. The current investigation was designed to determine the individual ranges of K1 and k2 in human brain under optimally controlled experimental conditions and to analyze the data in parallel by different methods. This was to investigate whether variability in k2 could in fact represent actual differences in glucose transport among individuals, that is, individualized glial cell function.
MATERIALS AND METHODS
Subjects
The measurements described below involved seven volunteer subjects who gave their informed consent. This study was performed in accordance with the guidelines of the Declaration of Helsinki (Varda, 1984). Four of the volunteer subjects were healthy (2 men and 2 women, aged 24 to 44 years); 2 male volunteer subjects (aged 56 and 73 years) suffered from lung cancer but had no neurologic symptoms or findings; 1 volunteer subject (aged 42 years) had a 4-week-old left hemispheric cerebral infarction with Broca-aphasia and right-sided paresis. Each subject was studied twice, under normoglycemia and hyperglycemia, so that a total of 14 measurements were made.
Positron emission tomography measurements
All subjects underwent 2 PET measurements, which were 1 day apart for subjects 3 to 7, 2 days apart for subject 2, and 2 weeks apart for subject 1 (Table 1). One study was performed under normal conditions after 4 hours of fasting. Before the other study, each individual received an intravenous infusion of 20% glucose, which significantly elevated the plasma glucose concentration to approximately twice the normal level (see Results). The rate of glucose infusion was controlled by using a dedicated infusion scheme in which the plasma glucose concentrations were measured every 3 to 5 minutes and the infusion rate was automatically adjusted according to a computer algorithm (Furler et al., 1986). In subjects 1, 3, 4, 5, and 7, the control study was first, whereas the order was reversed in subjects 2 and 6.
Transport rate constants calculated by three different methods
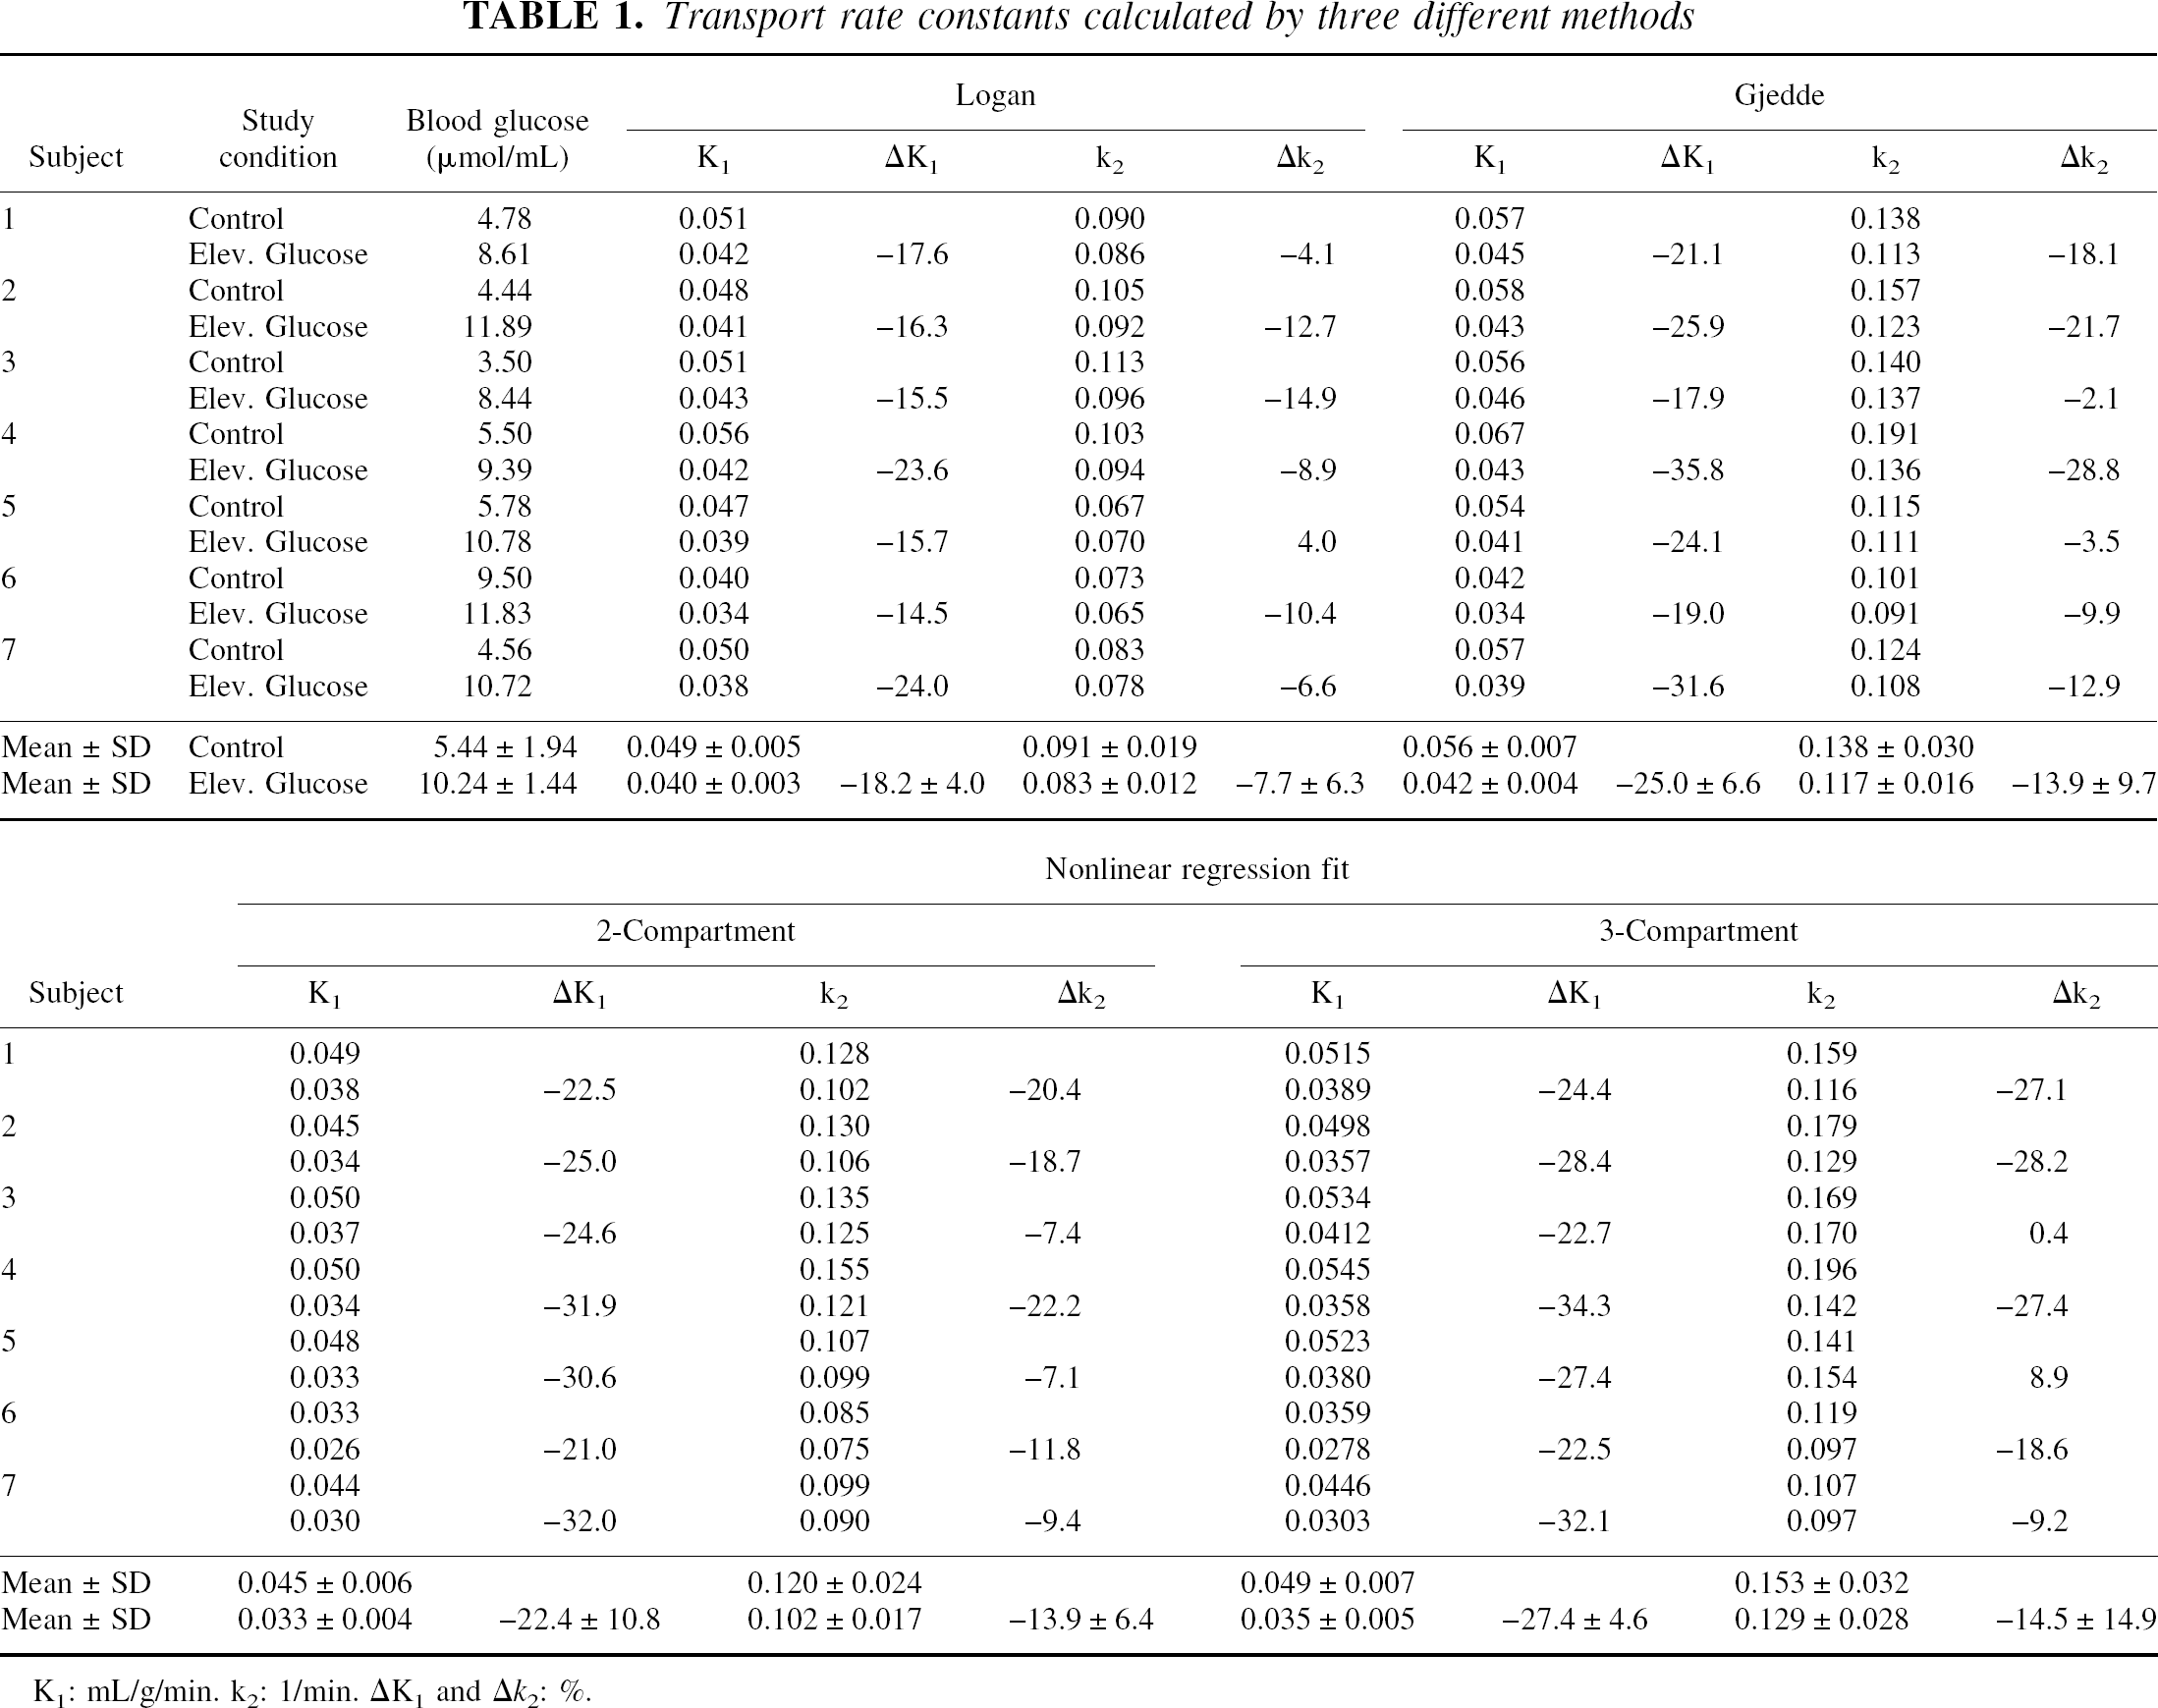
K1: mL/g/min. k2: 1/min. ΔK1and Δk2: %.
The PET studies used a Scanditronix/GE scanner PC 4096–15WB (Scanditronix, Uppsala, Sweden), which provides 15 simultaneous slices, with 6 to 7 mm traverse axial resolution (Rota Kops et al., 1990). Before each tracer injection, a transmission scan was acquired to correct for attenuation. Between 400 to 600 MBq CMG (Kloster et al., 1981) were injected into an antecubital vein as a short bolus of 10 seconds. A dynamic sequence of PET frames followed immediately beginning with 5 seconds per frame for the first 2 minutes and ending with 5 minutes per frame at 40 minutes, that is, at two half-lifes of [11C], the limit of accurate measurement for this tracer. During the first 8 minutes after injection, arterial blood was withdrawn continuously and the radioactivity was measured with a coincidence detector (Scanditronix, Uppsala, Sweden) (Eriksson et al., 1988). Starting at 5 minutes after injection, blood samples were manually obtained at frequent time intervals and the radioactivity concentrations of blood and plasma were separately measured in a well counter that was cross-calibrated with respect to the PET scanner. Using the two sets of blood data, which were measured continuously and manually from 5 to 8 minutes, the blood time-radioactivity curve was normalized to the calibrated blood samples. Then, the continuous plasma radioactivity over 8 minutes after injection was calculated from the continuously measured whole blood curve using the blood/plasma ratio obtained from the manual samples. Finally, the time-radioactivity curves of blood and plasma were decay-corrected. The latter is denoted as cP (t). The dynamic PET frames were reconstructed and a region of interest was defined over the entire grey matter in the transversal whole slice plane at the level of the basal ganglia using an isocontour level of 50% of the maximum intracerebral pixel value within the hemisphere. Based on the whole slice grey matter pixel region, a decay-corrected tissue time-radioactivity curve cT (t) was obtained. The region of interest in the subject suffering from left hemispheric infarction only comprised the nonaffected cortical areas of the right hemisphere.
Rate constants K1 and k2
The kinetics of CMG across the BBB is commonly described by a two-compartment model, that is, plasma and one-tissue compartment (Pardridge and Oldendorf, 1975; Gjedde, 1982; Vyska et al., 1985; Gjedde and Diemer, 1983; Gjedde et al., 1985; Feinendegen et al., 1986). However, previous evidence (Brooks et al., 1986 a) and results below show that a nonlinear regression fit to the time-radioactivity curve of CMG can be improved by taking into account a third nonspecific compartment.
In the two-compartment model of blood and tissue space, the values of cP (t) and cT (t) are related to each other by the differential equation:

The unknown rate constants derive from the two measured time-radioactivity curves by several analytic procedures. These include methods, which solve Eq. 1 for K1 and k2 by its linearization, or by a nonlinear fitting approach, as discussed below.
If CMG is to trace d-glucose transport, the rate constants of MG transport need to be corrected. d-glucose has a higher affinity to the glucose transporter than MG. The ratio of these affinities determines the correction factor that transforms the rate constants for MG to those of d-glucose (Pardridge and Oldendorf, 1975; Vyska et al., 1985). Because the current investigation focuses on the rate constants per se rather than on transport rates, no correction is made.
Determination of K1 and k2 by using linearized plots
The values of K1 and k2 may be graphically obtained by various linearizations of Eq. 1; for example, after its integration,
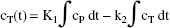
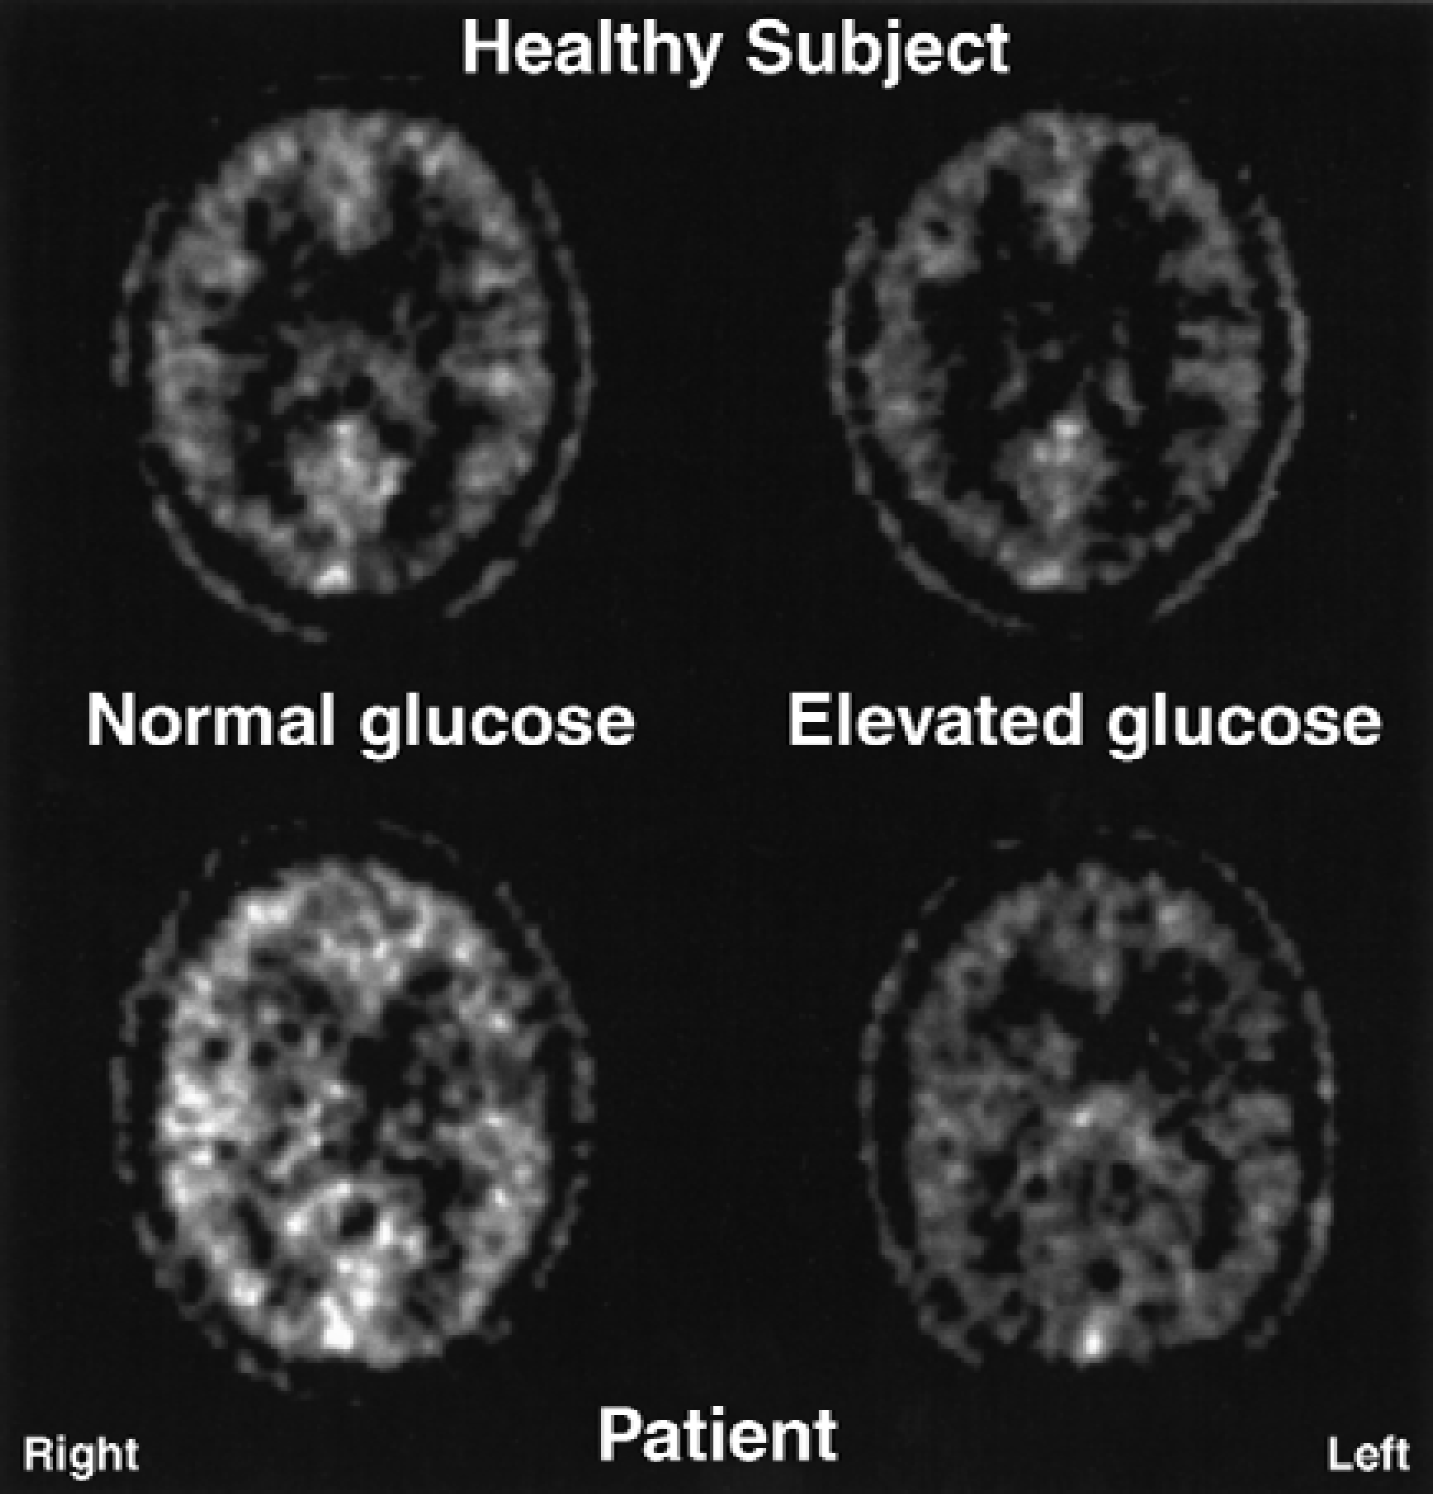
One way of rearrangement of Eq. 2 was introduced by Logan et al. (1990):
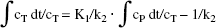
The graphical display of this equation shows the intercept to be the negative reciprocal of k2, whereas the slope equals the ratio of K1 and k2.
Another linearization was suggested by Gjedde and Diemer (1983):
This equation graphically gives K1 as the intercept and −k2 as the slope of the linear plot.
Fit analysis
A fitting procedure also was applied to calculate K1 and k2. The tissue time-radioactivity curves were analyzed using a nonlinear regression algorithm in its Marquardt–Levenberg modification (Marquardt, 1963). The first calculations were based on the two-compartment model according to Eq. 1. Then, the model was extended to take into account transport parameters k3 and k4 into and out of a third compartment. In both cases, the cerebral blood volume was included in the fitting procedure as an additional parameter.
Statistical analysis
An analysis of variance was performed for the K1 and k2 parameters separately and independently for each of the three methods of estimation. A two-way factorial design without interaction was used that considered glucose levels and subjects as the two main effects to be tested by experimental error. Measurements were made at control and elevated levels of glucose for each of the seven subjects. In addition, a three-way factorial analysis was performed that included methods as a main effect in addition to subjects and glucose levels to check the significance of the interaction between subjects and methods.
RESULTS
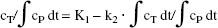
Positron emission tomography images were acquired during normoglycemia and hyperglycemia; the blood plasma d-glucose concentration was 5.44 ± 1.94 μmol/mL at normoglycemia, and elevated on average to 10.24 ± 1.44 μmol/mL at hyperglycemia. Individual values are listed in Table 1. Images from a healthy subject (#4) and the patient with a left hemispheric infarction (#7), respectively, are displayed in Fig. 2. In both examples, the cerebral uptake of MG is reduced in response to hyperglycemia.
Images of cerebral uptake of [11C]-3-O-methylglucose during normoglycemia and hyperglycemia in a
Figure 3 gives the graphical display of the Logan and Gjedde plots here for subject 4. The late slopes in these plots tend to be linear. From these linear portions, K1 and k2 were obtained from the slopes and intercepts by back extrapolation according to Eqs. 3 and 4.
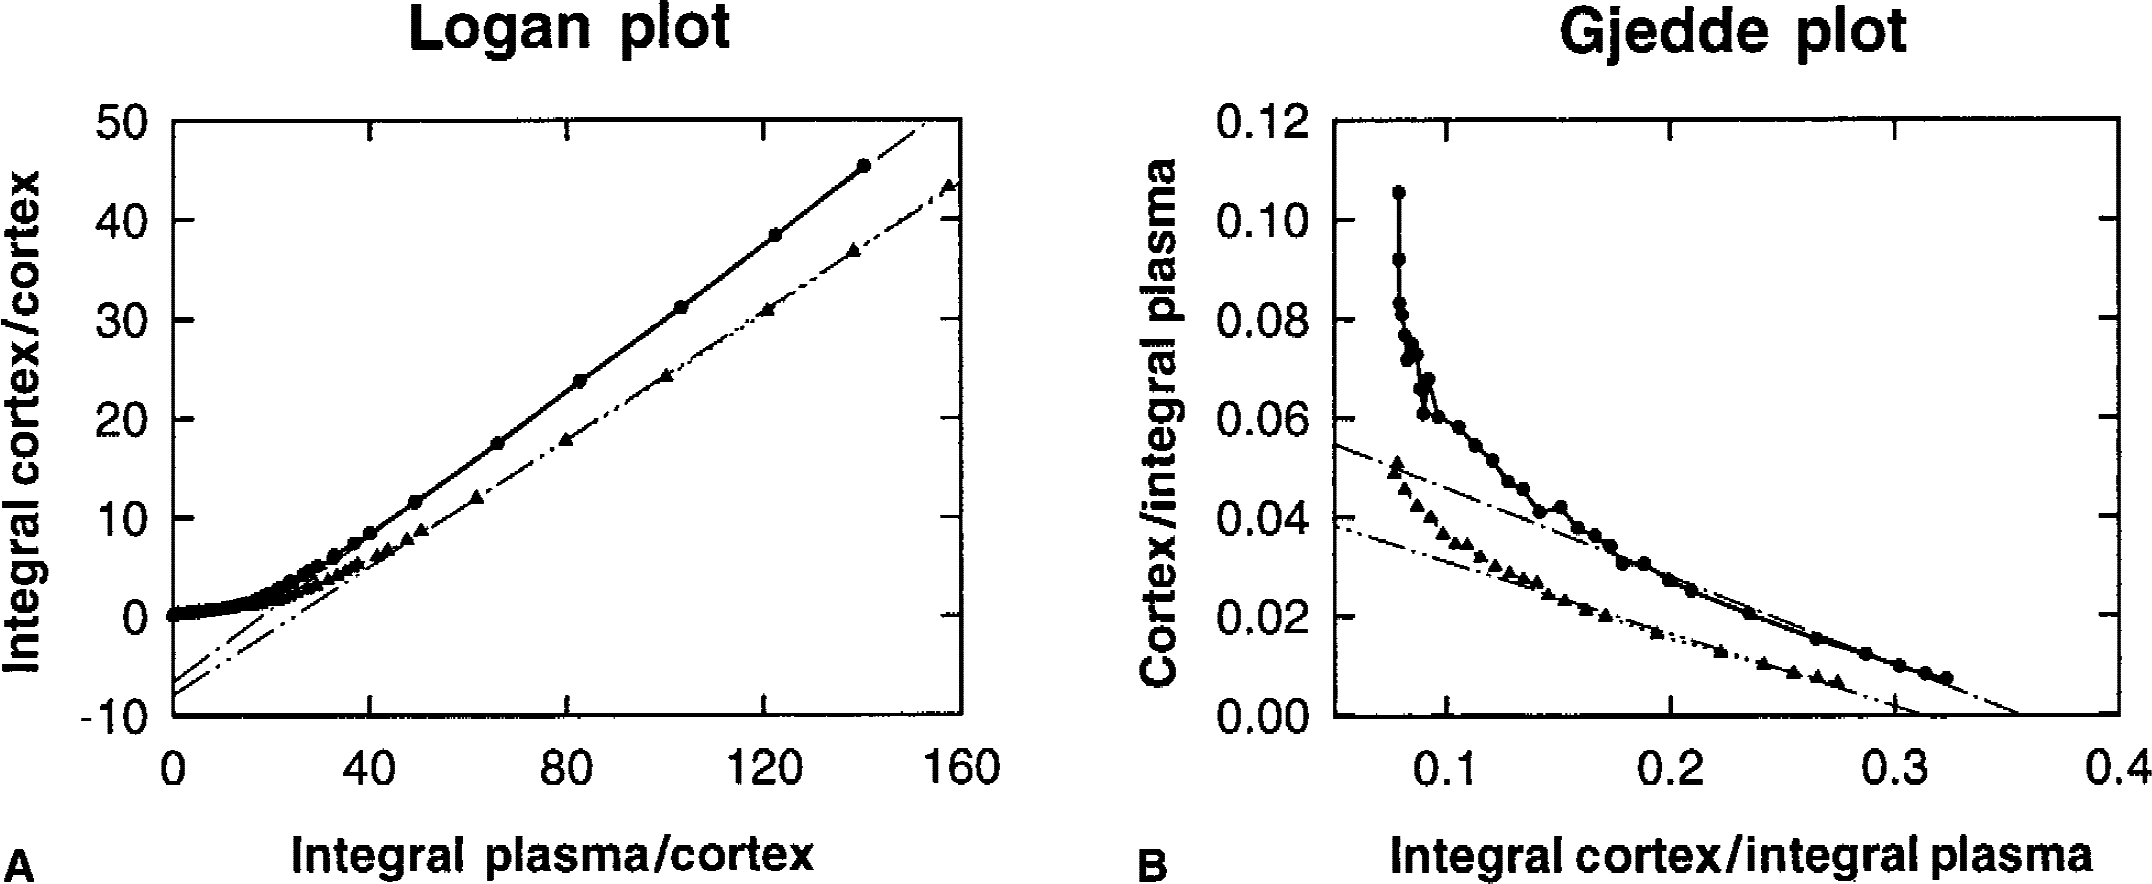
Figure 4 compares the measured cortical time-radioactivity curves with appropriate fits based on the 2-and 3-compartment model (for subject 4). The late part of the 2-compartment fit differs slightly from the measured values. An additional third compartment led to an excellent agreement in shape between measured and model curves in all cases. However, the small third compartment had no significant effect on the interindividual variability of K1 and k2 found in the 2-compartment analyses.
Measured cortical time-activity curve of subject 4 and curves fitted by nonlinear regression assuming a 2-compartment (1-tissue compartment) and a 3-compartment model (2-tissue compartment) to describe [11C]-3-O-methylglucose uptake in brain during normoglycemia.
The values of K1 and k2 of all individuals during normoglycemia and hyperglycemia are summarized in Table 1 for the various analytic methods; the ΔK1 and Δk2 give the percent difference between the two values obtained with each method. The age of the individuals had no effect on K1 and k2 and the corresponding ΔK1 and Δk2 values (not shown here). The relative standard deviation (SD of parameter estimate/parameter estimate) in the 2-compartment fit was 36% for K1 and 56% for k2 (mean of n = 7) during normoglycemia. The corresponding values during hyperglycemia were 43% for K1 and 68% for k2.
Figure 5 illustrates for all analyses the mean values of K1 to have a narrow standard deviation at normoglycemia and hyperglycemia; the decline with hyperglycemia was significant for each fitting method applied. The corresponding mean values of k2 have comparatively large standard deviations, but the decline with hyperglycemia also is significant for each group when the variation of subjects is removed from the error term. Figure 6 examplifies graphically the individual values of K1 and k2 from the 2-compartment fit, as a function of the plasma glucose concentration.
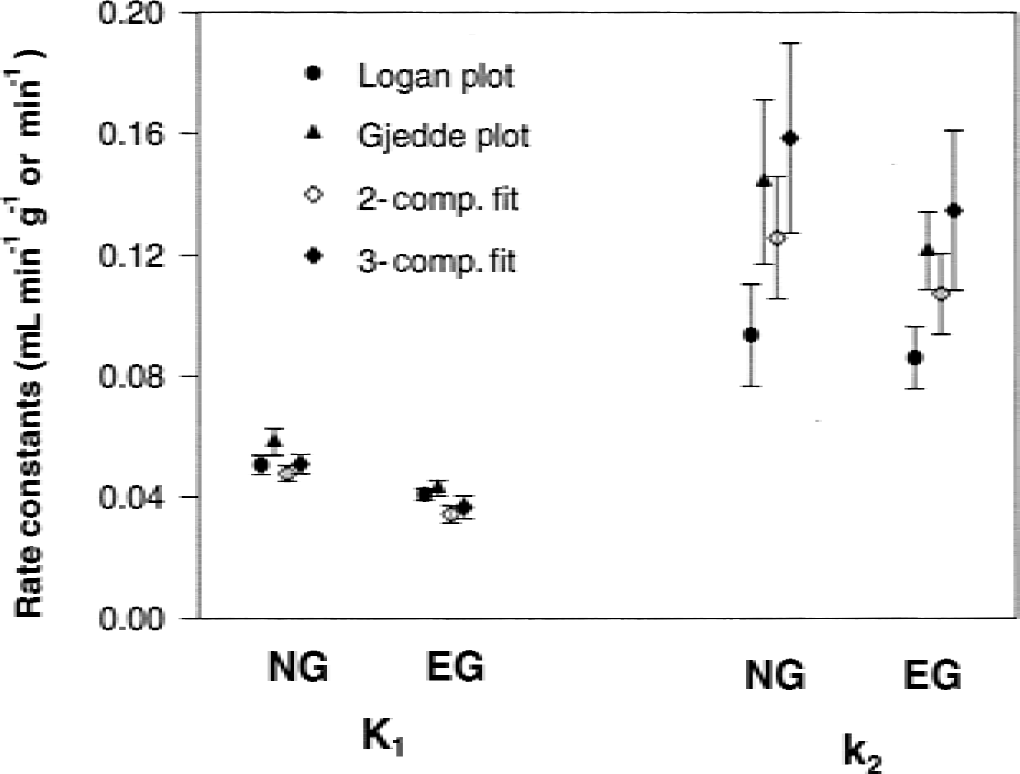
Mean values and standard deviation of K1 and k2 of [11C]-3-O-methylglucose averaged over 7 subjects and determined with linear Logan and Gjedde plots, respectively, as well as with nonlinear regression fitting (for 2-and 3-compartment model description) when subjects had normoglycemia (NG) and hyperglycemia (EG).
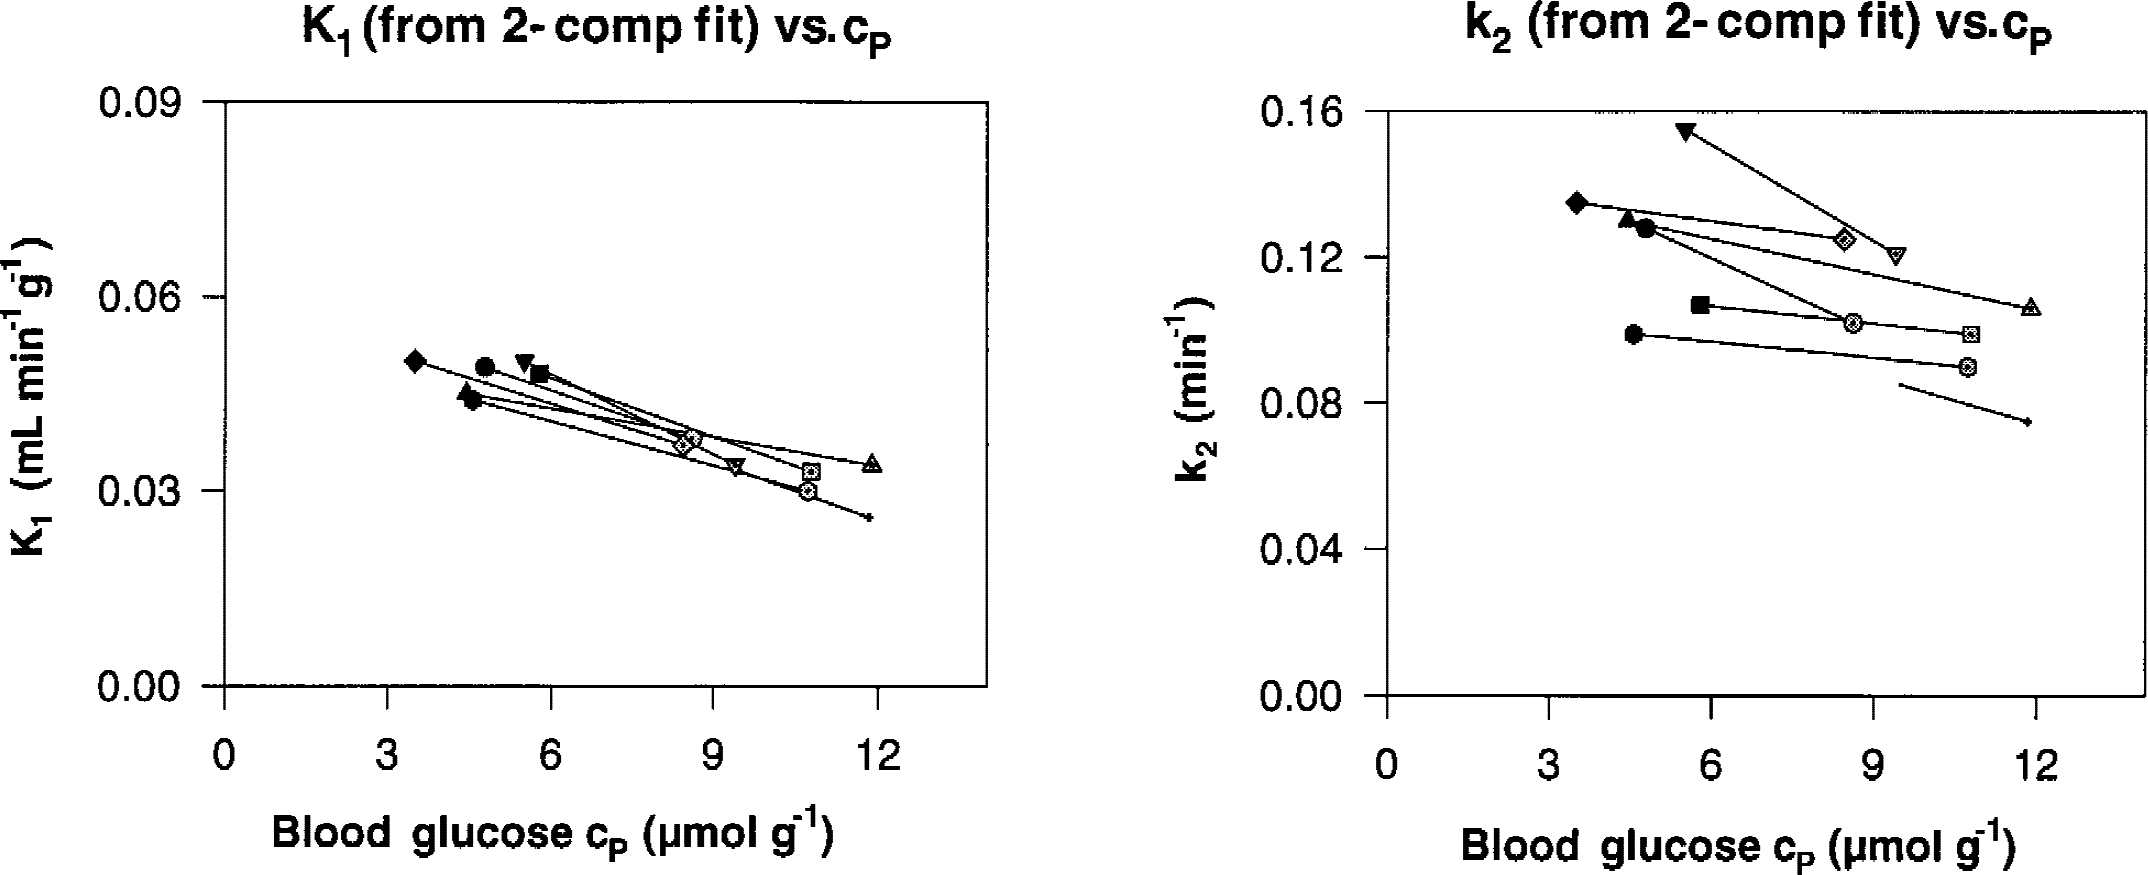
Individual values of K1 and k2 of [11C]-3-O-methylglucose determined with the nonlinear regression fitting and assuming a 2-compartment model (1-tissue compartment), as a function of the blood glucose level. Filled symbols refer to values at normoglycemia; shaded symbols give values at hyperglycemia.
K1, when calculated with the Logan plot, decreased by a mean of 18.2% during hyperglycemia (Table 1). Decreases found with the other analyses were similar: 25.0% for the Gjedde plot, 22.4% for the 2-compartment fit, and 27.4% for the 3-compartment fit (Table 1). The decline is highly significant for the Logan analysis (F = 71.86, P = 0.0003), the Gjedde analysis (F= 49.43, P = 0.0006), and the 2-compartment fit (F = 116.43, P = 0.0001). In all analyses, the values of K1 have a narrow range of variation among individuals when compared with k2, and decline almost in parallel with increasing cp (Fig. 6). However, the interindividual variation of K1 is significant for the Logan plot analysis (7.30, P = 0.0156), almost significant for the Gjedde analysis (F = 3.92, P = 0.0611), and highly significant for the 2-compartment fit (F = 10.44, P = 0.0068). This may be interpreted to mean that individuals maintain a distinctive identity with regard to K1 in response to glucose concentration.
Equivalent findings with the different methods of analysis were found for k2. All individual k2 values decline similarly in response to hyperglycemia, except for subject 4, who showed a 4% increase in the Logan analysis. The mean decrease of k2 from control to elevated glucose was 7.7% for the Logan plot (F = 9.57, P = 0.0212), 13.9% for the Gjedde analysis (F = 8.82, P = 0.0247), 13.9% for the 2-compartment fit (F = 18.97, P = 0.0051), and 14.5% for the 3-compartment fit (not significant) (Table 1).
The individual k2 values show considerably greater variability among subjects than the corresponding analysis for the K1 coefficient. This is reflected in the main effect of subjects, which is highly significant for the Logan analysis (F = 20.34, P = 0.0015), significant for the Gjedde analysis (F = 5.55, P = 0.0290), and highly significant for the 2-compartment fit (F = 14.83, P = 0.0030). The interpretation is similar as for the K1 coefficient; each individual has a highly characteristic k2 value that is maintained in response to glucose concentration.
In general, the results of K1 and k2 for an individual are similar in the different methods of analysis, although the relative order among individuals from analysis to analysis does show some variation. As a check on the magnitude and significance of the interaction of subjects over analysis methods, a 3-way factorial analysis was performed that included methods as a main effect in addition to subjects and glucose levels. This analysis confirmed that individuals have distinctive values of K1 and k2 that do not depend upon the method of analysis used.
Data analysis in terms of the distribution volume (that is, K1 /k2) again shows the distinct interindividual variability for each method of analysis. Two examples are given in Fig. 7, which illustrates the K1 /k2 values from the Logan plot and the corresponding mean values obtained from the Logan plot, Gjedde plot, and the 2-compartment fit, as a function of glucose concentration. At hyperglycemia, distribution volumes of the 7 subjects appear to converge in agreement with the lower standard deviation of all mean k2 values at elevated glucose levels compared with normoglycemia (Fig. 5).
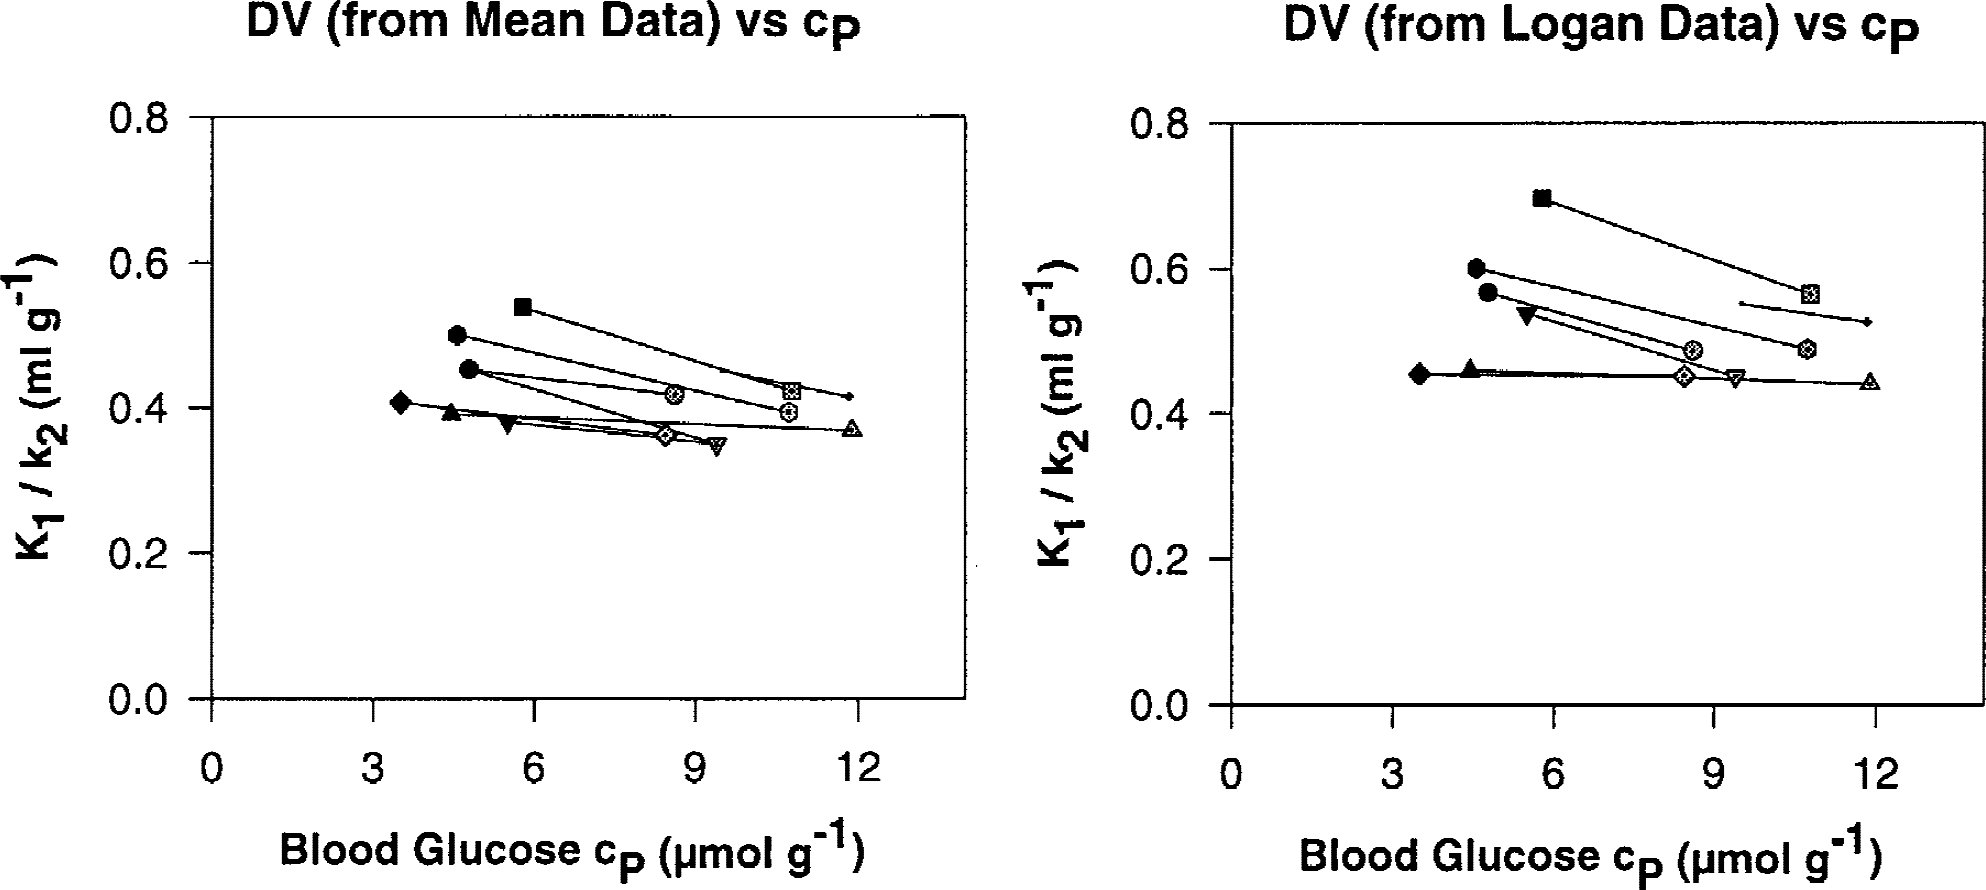
Values of the distribution volumes K1 /k2 of [11C]-3-O-methylglucose determined in each individual with the Logan plot and the corresponding mean values from the Logan plot, Gjedde plot, and the 2-compartment (1-tissue compartment) fitting, as a function of the blood glucose level. Filled symbols refer to values at normoglycemia; shaded symbols give values at hyperglycemia.
DISCUSSION
Different analytic methods in the current study indicate a statistically borderline significant interindividual variability of K1 at given plasma glucose levels. At the same glucose levels, the corresponding values of k2 showed highly significant interindividual, but not intraindividual variability. This reproducible key finding with regard to k2 in conjunction with the suggested individual identity of K1 is likely caused by biologic individualization rather than errors in methods and measurements. The specific behavior of both K1 and k2 in regard to their intra-and interindividual variability was consistently found by all analytic procedures applied here, and regardless of using a 2 or 3-compartment model of transport kinetics. The intraindividual relative standard deviation of k2 (56%) in the 2-compartment fit was slightly greater than that of K1 (36%) and was very similar during both hyper-and normoglycemia. Yet, this greater unsystematic variability cannot explain the systemically increased interindividual variability of k2. Therefore, errors, which might confound results when using a single analytic method, were ruled out.
The current results agree with the observations by Feinendegen et al. (1986) and Brooks et al. (1986 b). Both data sets appeared to suggest an interindividual variability of k2 values that was greater than that of K1 values in normal grey matter and, according to Brooks et al. (1986 b), also in white matter in four diabetic subjects at various plasma glucose levels.
To explain the significant individualization of K1, k2, and the concomitant distribution volumes (K1 /k2), the various components of the BBB that are summarily shown in Fig. 1 were chosen for consideration. In principle, the findings may be the consequence of an individualized ablumenal transport capacity (change in Vmax or Km), or a change in an individualized substrate concentration (change in [S]), or both. Thus:
d-glucose transport appears to follow kinetics expressed by the Michaelis–Menten equation (Pardridge and Oldendorf, 1975; Gjedde, 1982). Accordingly, the transport rates are proportional to the product of Vmax and substrate concentration [S], and are inversely proportional to the sum of Km and [S]—that is, the individual rate constant is given by Vmax over the sum of Km and [S]. However, in vivo measurements of glucose transport express global rates involving a sequence of successive transporter functions. The transporter GLUT 1 is located in the lumenal and ablumenal sites of and within the capillary endothelial cells and appears responsible for the transport from the capillary lumen into the intimately connected astrocytes. Glucose transport between these glial cells and neurons appears to be facilitated mainly by GLUT 3 (Magistretti et al., 1999).
Both parameters—K1 for glucose transport into the extravascular space and k2 for the exit into the capillary lumen—are governed mainly by GLUT 1 with Vmax and Km being different for inflow and outflow (Farrell and Pardridge, 1991; Vannucci et al., 1998). This asymmetry of GLUT 1 function may be further amended by allosteric regulation through binding of intracellular metabolites to the ablumenal transporter.
Under the assumption of d-glucose being metabolized mainly in the glial cells by glycolysis and also stored as glial glycogen, ad hoc demands for neuronal energy may be met by glucose supply also from the glycogen pool. Glial-neuronal transfer of lactate from glial glycolysis and of glucose, to some extent, delivers the substrates for neuronal energy that is delivered mainly through oxidative phosphorylation (Magistretti et al., 1999).
d -glucose transport from the capillary lumen across the endothelial cells into the glial cells operates on neuronal energy demand and appears to involve a variety of regulatory mechanisms. These include neurotransmitter cycling between neurons and glial cells coupled with Na-and K-transport–linked activation of ATPase affecting glycolysis, and the activity of hexokinase in the glial cells. Moreover, signaling through neurotransmitter for glial cells has been invoked to regulate glucose availability from the glycogen pool (Vannucci et al., 1998; Magistretti et al., 1999).
The narrow range of K1 values at both normoglycemia and hyperglycemia means that d-glucose transport across the capillary wall into the extravascular space responds mainly to the plasma glucose concentration as the predominant single variable in the current set of measurements. This also indicates that the mean local blood flow and the product of permeability and surface area are similar in the various individual healthy brains. It is also considered that blood flow and the product of permeability and surface may vary in an individual so that K1 is quite similar across individuals; therefore, the relatively pronounced individualization of k2 must originate from the regulation of ablumenal transport.
The ratio K1 /k2 for CMG expresses the distribution volume and is quantitatively related to the brain glucose level regardless of whether the plasma glucose concentration or the rCMRGlc is altered over a wide range (Dienel et al., 1997). Thus, the current data are consistent with individualized amounts of extravascular d-glucose at normo-and hyperglycemia. However, this extravascular glucose pool in the normal brain appears to converge to an eventual common value for all individuals at highest plasma glucose concentrations, in agreement with Michaelis–Menten kinetics governing a metabolic pathway that is common for all. Yet, this convergence to a common value is not recognized to occur for k2 indicative of an individualized regulation of the extravascular glucose pool. The value of k2 therefore may be considered a functional signature of this pool.
Because MG is known to equilibrate between circulating blood and tissue, the decline of the individual values of k2 with increasing plasma glucose concentrations indicates the free glucose pool in tissue to be individually related to the plasma glucose level. This individualization may be caused by biochemical controls in the glial cells, as well as by cell structures that affect the ablumenal glucose distribution and concentration. Regarding the biochemical controls, all of the ablumenal metabolic steps including transport into neurons need to be considered: (1) individualized glycolysis in glial cells and transfer of glucose to the glycogen storage pool with corresponding production of ATP; (2) individualized production of allosteric regulators of the ablumenal transporter; and (3) individualized supply of lactate and glucose from glial cells to neuronal cells, which appears to be under various regulatory controls. With respect to structural individualization, glial cells rather than endothelial cells appear to individually determine the free glucose pool and, thus, k2; otherwise, K1 would be affected in the same way as k2.
The current data cannot differentiate between these possible causes of highly significant individualization of the k2 values and the corresponding distribution volumes. However, the following reasoning is justified:
The observation of individualized distribution volumes K1 /k2 by PET imaging derives from average values taken from the entire cortex; thus, the phenomenon appears generalized and not limited to a few regions in the brain.
The individualized free glucose pool in front of the ablumenal transporter, or regulation of this transporter, or both determine the individualized values of k2.
Glucose is the main energy source for neuronal and glial cells and is metabolized in complex interacting biochemical loops, which are, in fact, expected to be genetically individualized. Consequently, individualized rates of cerebral glucose metabolism, including glucose turnover in glial glycogen storage, may then determine the observed individualized free glucose pools and corresponding values of k2.
The transfer of glucose and lactate into the neurons is facilitated by transport systems that differ from the transporters between the capillary lumen and glial cells; the downstream transporters may vary functionally between individuals more than the upstream transporters.
Regardless of the types and sites of the glucose transporters, glial cells rather than endothelial cells may have individualized structural compartments of the free glucose pool; this may explain a second tissue compartment for CMG, as discussed above (Fig. 3) (Brooks et al., 1986a).
The current data suggest further research for the following:
Cerebral glucose metabolism needs to be studied with both FDG and CMG using PET in healthy volunteer subjects. The free cerebral glucose pool is not measurable with FDG alone. Thus, the ratio of the localized normal values of rCMRGlc, as measured with FDG, and the complementary distribution volume or its signature k2 both being indicative of the cerebral glucose pool, as measured with CMG, would likely give more complete information on individualized biochemical mechanisms of glial cell and neuronal function.
Such combined measurements also should be made at different plasma glucose levels to uncover diagnostic information involving Michaelis–Menten kinetics not obtainable with either method alone. Indeed, congenital depression of activity of the glucose transporter GLUT 1 severely affects neurologic function in children suffering from intractable seizures and delayed growth in early childhood (DeVivo et al., 1991). Down-regulation of transporter also is seen in Alzheimer disease (Kalaria and Harik, 1989).
Combined measurements of rCMRGlc with FDG and of the distribution volume with CMG may also be made at rest and at defined stress such as mental activity or sleep deprivation, to test for the adaptability of transporter function, of the glucose pool, and of the hexokinase reaction. A case in point is a patient suffering all her life from a neurotic syndrome expressed by exceptionally easy fatigue upon stress without other pathologic signs or symptoms. This patient had an extremely low value of k2 for CMG and a normal FDG uptake (Feinendegen et al., 1992). Here, an increased glucose pool in glial cells may be coupled with a deficient energy supply across GLUT 3 into the neurons because of a functional GLUT 3 defect.
Further comparative observations are needed on the cellular glucose transporters, glucose pool, and metabolic kinetics in single cells and sections of brain tissue. This should be associated with information on individual regulation of the corresponding genes. Such data should complement clinical PET studies and profiles on gene expressions that are obtainable with DNA arrays. Combined measurements of cerebral uptake kinetics of FDG and CMG eventually may help to differentiate in vivo between glial and neuron-based disease and gene-related regulation of glial and neuronal function.
Footnotes
Acknowledgments:
The authors thank Mr. W. Roden and Mr. W. Hamkens of the Institute of Chemistry of the Research Center Juelich, Germany for production of [11C]-3-O-methylglucose; Drs. H. Boecker, N. Czech, and T. Kuwert, previously of the Center and the Nuclear Medical Department of the Heinrich-Heine-University Duesseldorf, Germany, for capable clinical support; Mrs. M. Theelen for excellent technical assistance; Drs. R.D. Neumann, W. C. Eckelman, and P. Herscovitch of the Departments of Nuclear Medical and PET, Clinical Center of the NIH, Bethesda, MD, U.S.A. for support and critical discussions; and Mrs. B. McMahon of the NIH for most helpful editorial assistance.