
Abstract
Carbon-10–labeled carbon dioxide (10CO2) with a half-life of 19.3 seconds offers almost ideal characteristics as a positron emission tomography (PET) tracer for assessment of the regional cerebral blood flow (rCBF) distribution, enabling multiple independent measurements at short intervals. To appraise the feasibility of 10CO2 for localizing and characterizing human brain function in single subjects, the authors chose a well-characterized activation paradigm. In 6 healthy volunteers, 50 to 64 independent PET scans of the rCBF distribution were acquired while viewing an annular reversing checkerboard presented at 10 reversal frequencies between 0.03 and 30 Hz. Changes in regional cerebral activity as a function of reversal frequency were modeled in every subject using a set of polynomial basis functions, which, as predicted, showed highly significant second or third order relations located in the striatal cortex. Correlation coefficients (R2) ranged from 0.46 to 0.63. The average intersubject maximal response relative to the 0.03 Hz condition was 8.0% ± 1.7% SD occurring at stimulus contrast reversal frequencies between 6 and 15 Hz with an average of 11.8 ± 3.8 (SD) Hz. From the qualitative and quantitative replication of previous results it is concluded that 10CO2 PET is a feasible technique for human brain mapping studies and a great improvement compared with the existing oxygen-15–labeled water (H2 15 O) PET method, particularly for single subject studies and parametric design.
Keywords
Positron emission tomographic (PET) measurements of the regional cerebral blood flow (rCBF) distribution for mapping the human brain have been used for several years. To date, the preferred radionuclide has been oxygen-15 (15O), which when labeled to water (H2 15O) or butanol presents as a freely diffusable rCBF tracer. However, conditions are far from optimal, both kinetically and in the utilization of PET scanner time. Limited by the half-life (123 seconds), the maximum number of PET scans attainable is 12 to 16 within a 2.5-hour scan session. The individual PET scan is normally acquired during the first 40 to 90 seconds, sampling only 15% to 35% of the emitted brain tissue counts. Furthermore, approximately 4/5 of the total PET scanner time is consumed waiting for isotope decay, yielding a poor scanner utilization rate. These considerations dictate the use of a radionuclide with an even shorter half-life. One promising candidate proposed has been the very short-lived positron emitting radionuclide carbon-10 (10C) with a half-life of 19.3 seconds labeled to carbon dioxide (10CO2) (Holm et al., 1999; Jensen et al., 1998; Nickles et al., 1998). After rapid delivery to the brain tissue by inhalation, 10CO2 acts as a freely diffusable rCBF tracer. Preliminary results showing the potential of the tracer in human brain mapping studies have been presented (Jensen et al., 1998), but apart from these no data from normal man exist.
The purpose of this study was to investigate the feasibility of this tracer for human brain mapping in single subjects. The priority was to optimize the number of PET scans acquired per subject in a single session without exceeding the total effective radiation dose (6.0 mSv) or PET scanner time (2.5 hours) of a routine H2 15O activation session allowed at the authors' unit.
MATERIALS AND METHODS
Production of 10CO2
Using a Scanditronix MC32NI cyclotron for 10CO2 production, the authors used the 10B(p, n) 10C reaction. By irradiating a highly enriched molten diboron trioxide (B2 O3; 99.8% in 10B and 92% in 18O) target on a rhenium mesh support (Alves et al., 2000), 10C was produced with 10C-carbon monoxide (10CO) as the primary radioactive product. The gas was swept from the target using helium as carrier gas through a copper oxide (CuO) furnace at 650°C (converting 10CO to 10CO2,), a nitrogen oxide trap (Tewson et al., 1989), a quality control loop, a 0.45-μm filter, and a 50-m gas pipeline to the PET scanner. The emerging gas stream was delivered to a standard “T”-tube, and inhaled through a regular mouthpiece (Nickles et al., 1998). At the inspiratory end of a 1-m-long tube, the activity was built up between inhalations and mixed with room air. A nose clip was applied. The concentration of 10CO2 in the inspired gas was in trace amounts, thus without an independent physiologic effect.
The positron (β +) energy of 10C is 1.9 MeV, which compared with 1.7 MeV for 15O will not significantly curtail the effective image resolution. The 719 keV photons (γ) also emitted by 10C are interpreted by the PET scanner as an increase in randoms and scatter that, however, can be adequately corrected by the standard delayed window subtraction and the implemented scatter correction, respectively (Nickles et al., 1998; Stearns, 1995).
Subjects
The subjects consisted of 6 paid healthy volunteers (median age: 24 years; range: 21–37 years; 2 female, 4 male). The subjects had no past or present neurologic or psychiatric disorders and were not actively taking medication or recreational drugs. Informed consent was obtained according to the Declaration of Helsinki II, and the study was approved by the local ethics committee of Copenhagen (J. nr. (KF) 01-100/99).
Positron emission tomography scanning
Positron emission tomography scans were obtained with an 18 ring GE-Advance scanner (General Electric Medical Systems, Milwaukee, WI, U.S.A.) operating in three-dimensional acquisition mode, producing 35 image slices with an interslice distance of 4.25 mm. The total axial field of view was 15.2 cm with an approximate inplane resolution of 5 mm. The technical specifications have been described elsewhere (DeGrado et al., 1994; Lewellen et al., 1996). Positron emission tomography scans were reconstructed with a 4.0-mm Hanning filter transaxially and axially with an 8.5-mm Ramp filter.
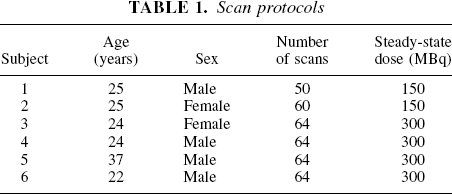
Two different protocols were used in the current study. In protocol A (n = 2), 50 and 60 PET scans were acquired, respectively. Scans were acquired in 10-minute sessions consisting of 5 independent, dynamically sampled time frames of 2 minutes each representing separate conditions. Tracer administration was initiated 10 seconds before the start of each frame to account for the delay to tracer appearance in brain tissues and was continued for 1 minute. An additional 1 minute (3 half-lives) without tracer administration followed for tracer decay and washout. 10CO2 was inhaled at a steady-state radioactivity dose of 150 MBq (4.1 mCi). In protocol B (n = 4), 64 PET scans were acquired in 12-minute sessions consisting of 8 independent time frames of 1.5 minutes. 10CO2 was inhaled for the first 30 seconds at a steady-state radioactivity dose of 300 MBq (8.1 mCi), again followed by a period of 1 minute (Figs. 1 and 2). The distribution of scan protocols among individuals can be seen in Table 1. The levels of radiochemical and radionuclidic tracer impurities were established before the first inhalation and during a 30-minute intermission after approximately 1 hour, when half of the images in a given protocol had been sampled. During this break a 10-minute transmission scan was performed for attenuation correction. Head movements were limited by head holders constructed of molded foam.
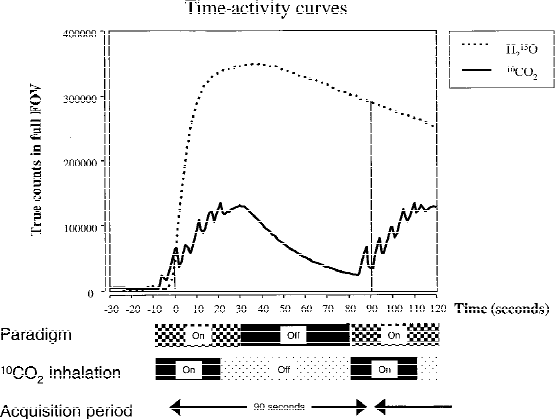
A representative time-activity curve within the PET scanner total field of view (FOV) after a 300 MBq (8.1 mCi) 10CO2 steady-state radioactivity dose inhalation for 30 seconds, followed by 60 seconds for decay and washout, and after a 400 MBq H2 15 O bolus injection. Activity has been calculated as true counts. The 10CO2 curve oscillates synchronously with respiration during 10CO2 inhalation presumably derived from the fluctuating activity of the upper airways in the FOV. Thus, not all activity is derived from brain tissues, and the early part of the curve will only represent upper airway activity. The H 2 15 O curve is a representative curve measured on a different subject. The timing of the activation paradigm (checkerboard stimulation/darkness), 10CO2 inhalation (on/off), and acquisition periods are illustrated.
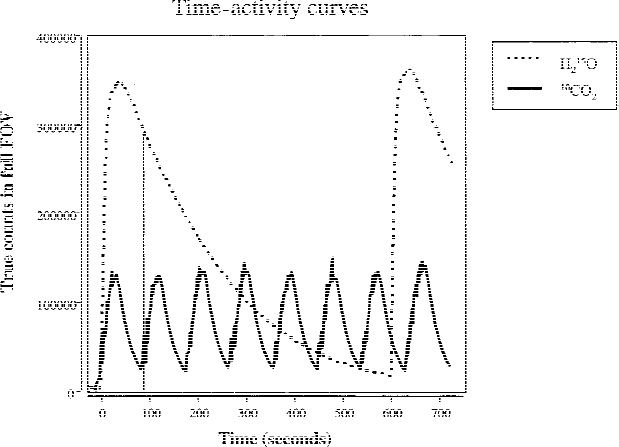
Approximately seven 90-second 10CO2 positron emission tomography (PET) scans can be performed within the time consumed by a standard 90-second H2 15 O PET scan (vertical line). With this acquisition period only approximately 33% of the emitted counts are used for the H2 15 O PET scan compared with almost 100% for 10CO2. Further, the scanner time is primarily consumed waiting for H2 15 O isotope decay. Same data as in Fig. 1.
Scan protocols
10CO2 dosimetry
The effective dose (ED) during 10CO2 inhalation at steady state has previously been calculated to 36 μSv · MBq−1· h −1 corresponding to 0.60 μSv · MBq−1 · min−1 (Holm et al., 1999). Thus, 1 minute of 10CO2 inhalation at a steady-state radioactivity dose of 150 MBq yields an ED of 90 μSv or approximately 20% of the ED conferred from a standard 400 MBq (10.8 mCi) H215 O bolus injection (1.16 μSv · MBq−1) as performed at the authors' unit (Holm et al., 1996; Smith et al., 1994).
Activation paradigm
To appraise the feasibility of 10CO2 as a new PET rCBF tracer for mapping human brain function, the authors chose a well-characterized activation paradigm, namely stimulation of the visual cortex using an annular reversing checkerboard. This paradigm gives a large and robust activation response in the visual cortex of approximately 33% at an 8 Hz reversal frequency compared with darkness (Fox and Raichle, 1985). It has been used several times as an easily implemented probe to examine focal rCBF increase with new human brain mapping methods, (Belliveau et al., 1991; Kim et al., 1999; Kwong et al., 1992), new tracers (Holm et al., 1994), or new tracer kinetic models (Law et al., 2000; Vafaee et al., 1999).
The checkerboard was displayed on a 17” computer screen suspended approximately 90 cm in front of the subject's eyes, and the visual angle of the stimulus was 15° vertical and 20° horizontal. The screen was covered in black drapes to create a dark environment. The subjects were asked to focus attention at the center of the annulus.
Stimulation was initiated with the start of tracer administration and lasted until 10 seconds after its termination, to account for an approximately 10-second delay for tracer arrival to brain tissue. Therefore, length of stimulation was 70 seconds and 40 seconds for protocols A and B, respectively. Stimulation periods were followed by the presentation of a blank black screen for 50 seconds and the subjects were instructed to wait for the next stimulus period with their eyes open. All conditions were performed in a quiet room with dim lighting. The timing of visual stimulation, 10CO2 inhalation, and acquisition is shown in Fig. 1 relative to a representative time-activity curve. Activity was calculated as true counts.
The reversal frequencies were parametrically varied at 10 levels—0.03 Hz, 1.0 Hz, 3.0 Hz, 3.75 Hz, 5.0 Hz, 6.0 Hz, 7.5 Hz, 10 Hz, 15 Hz, and 30 Hz—each frequency repeated 5 to 7 times in a randomized order. One hertz represents one full cycle per second—that is, the presentation of an image for 0.5 second and then the same image, only with the checkers reversed, for another 0.5 second. By parametrically varying the reversal frequencies, the activation response could be evaluated qualitatively in terms of the cerebral location of change in the visual cortex and quantitatively in terms of the shape of the resulting stimulus frequency-response relation at this location.
There are a number of differences in the design between the current study and the originally published article (Fox and Raichle, 1985). First, all the current conditions were performed during visual stimulation, whereas in the study by Fox and Raichle (1985), the baseline condition was darkness (labeled as 0 Hz). Thus, the described sharp initial rise in striatal cortex of approximately 20% activation from 0 to 1 Hz is likely to be driven by visual input per se and is not necessarily an isolated stimulation frequency effect. Second, the current maximal stimulation frequency was 30 Hz, but was 60 Hz in the article by Fox and Raichle (1985). This affects the expected shape of the stimulus-response characteristic resembling a second order polynomial function at stimulation frequencies from 0.03 Hz to 30 Hz. With this in mind, the authors expected, based on previous data, that the stimulus-response relation in the striatal cortex could be described by a second or possibly a third order polynomial function with a peak response of approximately 8 Hz and a maximal response magnitude, when considering differences in baseline conditions, of approximately 13% relative to the 0.03 Hz condition.
Magnetic resonance imaging
Structural magnetic resonance imaging (MRI) was performed with a 1.5 T Vision scanner (Siemens, Erlangen, Germany) using a three-dimensional MPRAGE sequence (repetition time/echo time/initial time = 11/4/300 milliseconds, flip angle 12°). Images were acquired contiguously in the sagittal plane with an inplane resolution of 0.92 mm and a slice thickness of 1.0 mm. The number of planes was 170 and the inplane matrix dimensions were 256 × 256.
Data analysis
As noted above, the authors had a prior assumption of the shape of the relation of regional activity and stimulus contrast reversal frequency in the striatal cortex (Fox and Raichle, 1985). However, this was a group study using pooled data, an approach that may to some degree disguise individual effects. Furthermore, the authors could not neglect the possibility of activity changes relative to the stimulus parameter occurring in other cerebral areas outside the striatal cortex following functions of unknown shape. Thus, the authors chose a subject-specific analysis strategy using all available data as opposed to a more restricted regions of interest–based technique.
The initial preprocessing stage was performed using Statistical Parametric Mapping software (SPM-99b; Wellcome Department of Cognitive Neurology, London, U.K.), whereas the statistical analysis was performed using SPM96. Before analysis, each image was filtered using a 6-mm (full width at half maximum) isotropic gaussian filter. To account for head movements between images, alignment on a voxel-by-voxel basis was performed. Images were aligned to the first image of that session followed by alignment of images between sessions based on the alignment parameters calculated from alignment of the average session images. This was followed by coregistration of the structural MR image to the average image of all conditions, normalization of the images to the Talairach and Tournoux atlas (Talairach and Tournoux, 1988) using the SPM 99 PET template, and 16-mm (full width at half maximum) isotropic gaussian filtering. Using in-house software, differences in global activity between conditions were removed by proportional normalization to a value of 50. By an iterative approach, only intracerebral areas in the whole group that did not change significantly (P ≥ 0.05) between conditions as elicited by analysis of variance were selected to represent global activity (Andersson, 1997). The same mask of cortical areas was used in all subjects to globally normalize activity.
For every subject, the resulting images were statistically modeled using the “Single subjects & covariates” model of SPM96. A linear orthogonalized covariate defining the scan number was removed in all analyzes performed. This is a strategy for removing linear increases in background activity over time caused by the, albeit very low, 11CO2 content in the inhaled gas. Three orthogonalized covariates of interest using a set of polynomial expansions of the stimulus reversal frequency (first, second, and third order) were computed (Buchel et al., 1996). This allowed a characterization of the regional distribution of linear and nonlinear dependencies of stimulus reversal frequency to specify the exact shape of the relation. A backward stepwise selection strategy to determine the optimal model was used. The goodness of fit at each step was assessed using a spatially extended F statistic, SPM{Fν1,ν2}, with v1 and v2 degrees of freedom. Initially, the third order term of reversal frequency was selected as the covariate of interest with scan number, and first and second order terms were selected as covariates of no interest. The term survived if areas of significant activation could be identified, if not it was eliminated. As a hypothesis about a second or third order relation existed, the significance threshold was set at P < 0.05, uncorrected in the striatal cortex, and P < 0.05, corrected for multiple independent comparisons in other areas of the brain (Friston et al., 1995; Worsley et al., 1996). This was followed by a separate analysis of the second order term of reversal frequency as the covariate of interest with scan number and first order terms as covariates of no interest. If not eliminated above, the third order term was also removed in an analogous fashion. A similar analysis for the first order term followed. Finally, a full model incorporating all terms with overlapping areas of activation was calculated. Foci of significant activation were characterized in terms of peak F-score greater than the significance threshold. To estimate the model coefficients and correlation coefficients (R2), the normalized activity was sampled at the peak coordinates and polynomially fitted in a standard statistical software package.
To evaluate differences in the average intrasubject COV between reversal frequencies, the authors used a repeated measures analysis of variance model with reversal frequency as a single factor. Furthermore, the average maximal response relative to the 0.03 Hz condition was calculated, and the maximal response based on the fitted polynomial functions was identified by solving the equation of the first derivative set to zero.
RESULTS
10CO2 PET image acquisition
Figures 1 and 2 show the activity in the total scanner field of view (FOV) as a function of time for 30 seconds of an inhaled steady-state dose of 300 MBq 10CO2, followed by 60 seconds for tracer decay and washout. The corresponding curve from a different subject after an intravenous 400 MBq H215O bolus injection for a standard PET activation study as performed at the authors' unit is also shown. As the total FOV includes the upper airways, the respiratory movements associated with 10CO2 inhalation give rise to the oscillatory changes seen in the first part of the time-activity curve. Thus, this section of the curve does not represent the brain tissue curve only. Figure 2 illustrates the conversion of idle PET scanner time waiting for H215O decay into repeated acquisitions using 10CO2. In this example, the ratio of 10CO2 to H215O PET scans was 7 to 1 in a 10-minute PET session. In the same 10-minute session, only approximately 33% of the emitted counts in a H 215O PET scan are acquired during the first 90 seconds compared with 10CO2, which has a value close to 100%. In the chosen experimental setup, each 10CO2 scan has only approximately 20% of the integrated counts found in a typical H215O scan. At a stage immediately before the statistical analysis, the image quality evaluated visually for a 10CO2 PET scan seems comparable with the quality attainable using conventional H215O PET, an effect of filtering (Fig. 3).
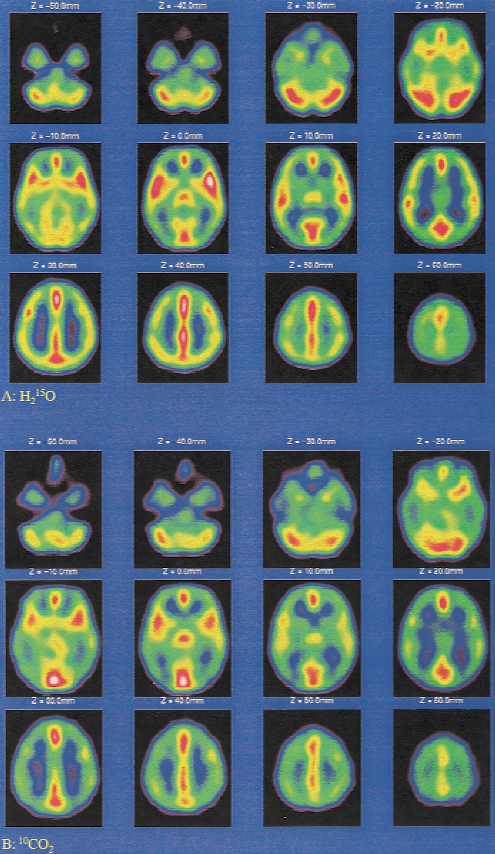
Representative 90-second PET scans using H2 15 O
Visual activation
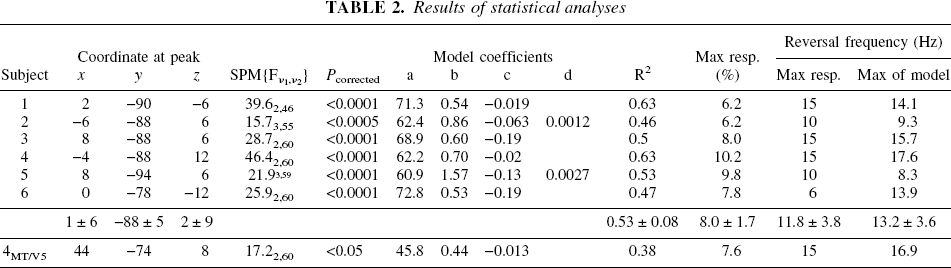
To appraise the feasibility of 10CO2 for localizing and characterizing human brain function in single subjects, the authors chose a well-characterized activation paradigm. In 6 healthy volunteers, 50 to 64 independent PET scans of the rCBF distribution were acquired while viewing an annular reversing checkerboard (Law et al., 2000) presented at 10 reversal frequencies between 0.03 Hz and 30 Hz. Calculation of the voxel-by-voxel regression of the regional normalized activity to a set of polynomial expansions of the stimulus reversal frequency (first, second, and third order) revealed significant nonlinear responses in all subjects localized focally in the posterior half of the calcarine sulcus (Figs. 4 and 5, Table 2). Correlation coefficients (R2) at the peak of statistical significance ranged from 0.46 to 0.63. There were no areas in which a significant first order function could be fitted in isolation, all had an overlapping second order term. In two subjects (2 and 5), a significant overlapping third order term also was identified (Fig. 5, Table 2). Furthermore, in one subject (4 MT/V5, Table 2) a significant second order polynomial function could also be fitted to an area outside the calcarine sulcus close to the left ascending limb of the inferior temporal sulcus, possibly the left motion specific visual area MT/V5 (Tootell et al., 1996; Watson et al., 1993). The resolution (“smoothness”) in millimeters of the resulting SPM{F}'s were approximately (x, y, z) = (15, 17, 20) full width at half maximum (FWHM). Analysis of variance revealed no significant difference in coefficient of variances (COVs) between reversal frequencies (F9, 45 = 0.71; P = 0.70). The average intrasubject COV at a given reversal frequency was 2.0% ± 0.7% SD. The average intersubject maximal response relative to the 0.03 Hz condition was 8.0% ± 7% SD occurring at stimulus contrast reversal frequencies between 6 and 15 Hz with an average of 11.8 ± 3.8 (SD) Hz. The corresponding maximal response based on the fitted polynomial functions was between 9.3 and 17.6 Hz with an average of 13.2 ± 3.6 (SD) Hz.
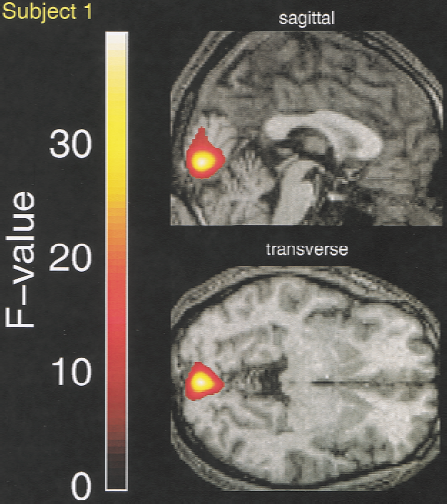
Data from subject 1 showing areas with activity that significantly correlate with a second order polynomial function of stimulus reversal frequency. The goodness of fit is expressed as a statistical parametric F-map, SPM{F2, 46}, and projected onto the individual structural anatomy. Data displayed at a significance threshold of P < 0.001, uncorrected.
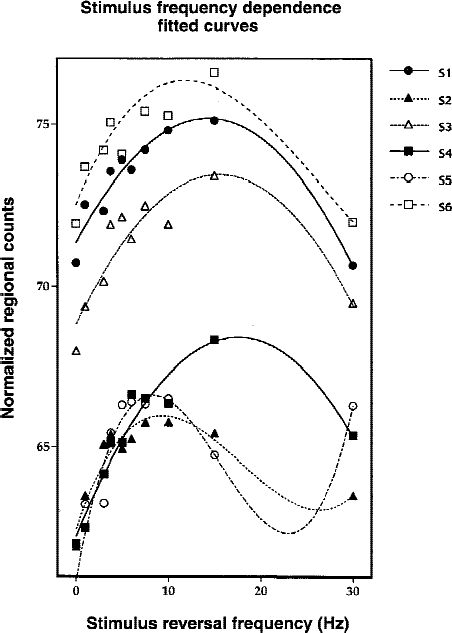
Regression plots of normalized regional counts versus stimulus reversal frequency from all six subjects. Subjects 2 and 5 showing significant third order components. Each data sample represents the average of 5 to 7 individual PET scans in that condition.
Results of statistical analyses
DISCUSSION
10CO2 as a positron emission tomography tracer for regional cerebral blood flow
From lungs to brain.
After entering the lung capillaries through the lung alveoli, most of the CO2 diffuses into the red blood cells, where hydration produces the weak acid carbonic acid (H2 CO3) catalyzed by the enzyme carbonic anhydrase. Carbonic acid subsequently is almost completely ionized to hydrogen and bicarbonate ions. This conversion, and the equally rapid reverse process, is of major importance for the bicarbonate and carbon dioxide transport in all organs and is essentially instantaneous (Maren, 1963). Carbon dioxide is transported in arterial whole blood to the brain as bicarbonate (87%), bound to the amino groups of proteins (mainly hemoglobin) as carbamate (7%), and as dissolved CO2 (5%) (Klocke, 1991). However, these proportions may not correctly reflect the relative composition of 10CO2 in arterial whole blood as it arrives at the brain. The carbamate will exchange reversibly with 10C-labeled and unlabeled CO2 in arterial blood in proportion to their relative contributions. A single breath 11CO2 inhalation study in rats found 7.8% of the total activity in the blood to be fixed after 4.5 minutes (Lockwood and Finn, 1982). In a PET study using 15 minutes of continuous 11CO2 inhalation for estimation of pH in the human brain, lower fixation values (0.5 to 1.0% per minute) have been argued (Brooks et al., 1984). In conclusion, a fixation rate for 10CO2 in whole blood of 1% to 2% per minute is probably reasonable. Given a lung to brain tissue delay of approximately 6 seconds, the contribution of first pass 10C-labeled carbamate is negligible, and it is mainly recirculated 10C -labeled carbamate, which can potentially increase counts in the blood compartment. Given an average recirculation time of 3 to 4 times that of the tracer half-life, this can be neglected. Thus, for practical purposes, the 10CO2 in arterial whole blood exists in a chemical form (dissolved 10CO2 or 10C-labeled bicarbonate) that favors rapid exchange across the blood–brain barrier (BBB).
10CO2 across the blood–brain barrier and in cerebral tissue.
The extraction of CO2 across the BBB is 88%, that is, the same magnitude as water (87%) (Friis et al., 1980). On the other hand, the CO2 diffusion BBB permeability coefficient (4.4 × 10 −3cm/sec) (Friis et al., 1980) can be calculated as approximately 20 times as high as the BBB water permeability (2.4 × 10 −4cm/sec) (Paulson et al., 1977). Carbon dioxide has approximately the same high lipid solubility as inert gasses such as xenon and krypton (Yeh and Peterson, 1963). Thus, CO2 is essentially freely diffusible across the lipid plasma membrane of the endothelial cells lining the BBB and has ideal rCBF tracer characteristics.
The rate of metabolic brain tissue fixation of 10C can, by inference from the 11CO2 PET experiments, be expected to be 1% to 2% per minute (Brooks et al., 1984; Lockwood and Finn, 1982), which, analogously with the blood carbamate fixation, is negligible compared with tracer half-life.
Effects of radiochemical and radionuclidic impurities.
Because of target impurities (up to 0.2% 11 B-labeled boron and 5% to 10% 16O) the inhaled gas will contain small amounts of 11C-labeled carbon dioxide (11CO2, half-life: 20.4 minutes) (Alves et al., 2000) and 13N-labeled nitrogen (13N2, half-life: 10 minutes), respectively. The radionuclidic impurity level of 13N2 in the Quality Control loop was controlled by half-life analysis immediately before use and at approximately 1-hour intervals and was between 1% and 5%; thus, 95% to 99% of the inhaled activity was 10CO2. Nitrogen is an inert gas with a low solubility in alveolar blood and lung tissues. The Ostwald solubility of 13N2 in whole blood is 0.017 ± 0.02 (Madsen, 1980, Table 2.4). This results in a (relative) brain tissue/lung gas activity ratio of 0.7%. This extreme insolubility of 13N2 makes its small lung gas concentration contribute negligibly to the cerebral counting rate. Furthermore, this results in a biologic half-clearance time (in healthy subjects) of 6.9 ± 1.0 minutes measured over a 45-second 13N2 breath-hold (Hichwa, 1980, Table 6)—that is to say, it does not leave the lung gas space.
The biologic half-life of 11CO2 in the human body can be described by a two-component model: 40% of the biologic decay arising from a fast component with a half-life of 2.2 minutes, presumably exhaled 11CO2, and 60% from a slow component with a half-life of 76 minutes (ICRP, 1987). At steady-state inhalation, this translates to a fixed 11C level in the body of approximately half the value it would be with no excretion at all. Considering the small amount of 11B impurity (0.2%) in the applied target, a delay of 40 seconds (210C half-lives) in the activity transport system from cyclotron to subject and the biologic half-life presented above, the 11C level at steady-state inhalation can be calculated as well below 5% using previously presented principles (Alves et al., 2000). The effects of this increasing background contribution, reflecting the pattern of the regional cerebral pH values and metabolic fixation, was distributed randomly across conditions, and a rough correction was performed by removing scan number as a nuisance covariate.
Optimizing acquisition.
In this study, the priority was to optimize the number of scans acquired at a fixed 6.0 mSv subject radiation dose. Fewer scans at a higher dose/longer inhalation period would increase total counts/signal-to-noise in the image, but also would reduce the number of independent samples for the estimation of the average activity level at a given stimulus frequency. The average of many low count scans will be identical to the value of one high count scan, as far as only the poisson noise from the decay process is considered. However, there are prudent technical, experimental, and statistical reasons for not choosing a few high activity scans. Few scans would increase the fraction of randoms, enhance the relative noise contribution from behavioral factors (attention, fatigue) on the regional activity level, and reduce the degrees of freedom available for the statistical analysis compromising sensitivity to change. There would, however, be a lower limit to acceptable total image counts in which noise will dominate and introduce errors in either the alignment or stereotactic normalization processes.
The shortest scan acquisition period would be the time of a single inhalation plus 1 minute for decay and washout, which would potentially increase the number of acquired scans even further. However, total image counts would not be sufficient at a steady-state radioactivity dose of 300 MBq, which is the maximal output attainable with the current target technology. Even if a technological advance allowed a larger radioactivity dose, the increased fraction of randoms during inhalation might prove a disadvantage.
Regional cerebral blood flow quantification using 10CO2.
In the authors' opinion, 10CO2 is not currently a practical tracer for quantitative measurements of rCBF. In theory, quantification is simple using the steady-state principle, providing that the arterial input concentration, taken as the mean value over the entire data acquisition period, could be measured. Because of the short half-life and subsequent rapid decay during arterial transport, the arterial input signal has to be sampled close to the organ in question, that is, the brain. Currently, partial volume effects induced by low scanner resolution does not allow a simple and reliable measurement of activity inside the carotid arteries. The ease of production and administration of H2 15O will make this compound the PET tracer of choice for rCBF quantification at most PET units, whereas 10CO2, because of the large number of data samples would be attractive primarily in human brain mapping experiments.
10CO2 positron emission tomography compared with existing techniques
H215O positron emission tomography.
As shown above, the short half-life of 10CO2 enables almost complete utilization of emitted tissue counts as opposed to H215O PET where only 15% to 35% will contribute depending on acquisition lengths. Using H215O PET, the authors would usually acquire 12 PET scans versus 64 using 10CO2 PET, and the integrated H215 O counts in a 90-second acquisition would be 5 times that of 10CO2 PET. Thus, if the total utilization of emitted counts is evaluated at identical subject radiation doses using the sum of integrated counts in all images in a session (total counts in all images/mSv), 10CO2 PET is only a slight improvement over H2 15O PET. The main reason for this is the high initial 10CO2 radiation dose absorbed during the tracer transport, mainly in the upper airways, with the fast decay reducing the net 10CO2 concentration delivered at the target organ. Thus, the main advantage of 10CO2 over H2 15 O is the possibility to partition a given radiation dose and convert idle scanner time into multiple behaviorally independent PET scans (Fig. 2). A rough visual evaluation of the 10CO2 image quality versus H2 15 O PET does not reveal major discrepancies at the level of resolution chosen (Fig. 3). The stereotactic normalization process used in the statistical analyzes was not affected by image noise as the average 10CO2 PET scan was used.
Functional magnetic resonance imaging.
One advantage using functional magnetic resonance imaging (fMRI) for human brain mapping is the possibility to perform multiple repeated measurements in the same subjects, which makes the techniques especially eligible for parametric study designs (Buchel et al., 1998). As the fMRI blood oxygen level-dependent (BOLD) signal is a composite of several different physiologic parameters (Kim et al., 1999), a physiologically more restricted activation signal based on rCBF only can have its advantages. Needless to say, the 10CO2 PET technique cannot compete with fMRI on availability or spatial and temporal resolution. Furthermore, 10CO2 PET is limited by the requirement of a mouth piece demanding a greater degree of patient/subject cooperation and prohibiting verbal report. However, as demonstrated in the current study, 10CO2 PET can compete with fMRI in delivering whole brain volume sampling of multiple repeated conditions of a restricted rCBF-based signal. This is a limited option using the H2 15 O PET technique, which is penalized by the tracer half-life.
Activation results
The horizontal and vertical extent of the visual input predicted activation in the posterior striatal cortex around foveal cortical representations (Sereno et al., 1995), as found in the current data (Fig. 3). Also as predicted, all subjects showed highly significant correlations with either second or third order polynomial functions with peak values located in the striatal cortex. The polynomial models could explain between 46% and 63% of the variance. No isolated first order components were located. In one subject (4;Table 2), activation in extrastriatal cortex was found in the left occipito-temporal junction, probably the motion-sensitive area V5/MT, which has also been described previously during checkerboard stimulation in other studies (Vafaee et al., 1998).
The average intrasubject COV at a given stimulus reversal frequency was 2.0% ± 0.7% SD and was not significantly different between conditions. Besides the stochastic nature of the decay, contributions to image noise may arise from varying levels of attention across scans. Attention can strongly and specifically influence neural processing in the striatal and extrastriatal cortex alike (Somers et al., 1999). For the 30-Hz condition, the average intrasubject COV was 2.2% ± 0.7% SD with a range of 1.1% to 3.0%. The COV values for the 2 subjects (2 and 5), where third order components were fitted, were 1.1% and 2.7%, respectively. Thus, an increased variability at 30 Hz for these two subjects could not explain the third order components. These should, however, be interpreted with caution as the regression is determined with the largest confidence in the interval with most data samples (0.03 to 15 Hz), making the regression sensitive to the 30-Hz point (Fig. 5).
The average maximal response relative to the 0.03-Hz condition was found at a smaller increase (8%) and at a larger average stimulus contrast reversal frequency (11.8 Hz;Table 2, Fig. 4) than predicted. As the curve after 8 Hz descends only gradually (Fox and Raichle, 1984, 1985), and the value of the maximal response is subject to differences in image resolution and analysis strategies, the current results are in overall agreement with the previous data.
Conclusion
10CO2 offers almost ideal characteristics as a PET tracer for the rCBF distribution with a short halflife enabling multiple independent measurements at short interval. This greatly improves the use of PET for human brain mapping studies compared with the existing H2 15 O PET technique, particularly for single subject studies and parametric design. The current study has demonstrated that 10CO2 PET is feasible and has validated the technique indirectly by replicating previous results qualitatively and quantitatively.
Footnotes
Acknowledgments:
The authors acknowledge Karin Stahr and the staff at the PET Center at Rigshospitalet, Copenhagen for their participation. The authors also gratefully acknowledge The John and Birthe Meyer Foundation for the donation of the Cyclotron and PET scanner. Jacob Holm wrote the checkerboard reversal program.