
Abstract
The functional activity of the intraparietal cortex was mapped with the [14C]deoxyglucose method in monkeys performing fixation of a central visual target, saccades to visual targets, reaching in the light during fixation of a central visual target, and acoustically triggered reaching in the dark while the eyes maintained a straight ahead direction. Different subregions of the intraparietal cortical area 7 were activated by fixation, saccades to visual targets, and acoustically triggered reaching in the dark. Subregions in the ventral part of the intraparietal cortex (around the fundus of the intraparietal sulcus) were activated only during reaching in the light, in which case visual information was available to guide the moving forelimb. In contrast, subregions in the dorsal part of the intraparietal cortical area 5 were activated during both reaching in the light and the dark, in which cases somatosensory information was the only one available in common. Thus, visual guidance of reaching is associated with the ventral intraparietal cortex, whereas somatosensory guidance, based on proprioceptive information about the current forelimb position, is associated with dorsal intraparietal area 5.
Accurate reaching toward an object of interest requires a precise neural representation of target location relative to the body. Visual and somatosensory information is used to compute the spatial location of objects, whereas information about our own movements constantly updates the distance between the object and the moving forelimb. Elucidation of the brain areas involved in processing sensorimotor information used for the guidance of reaching may provide an insight into the strategies the brain uses to guide voluntary movements.
Hierarchically located in between the visual and motor areas, the posterior parietal lobe receives convergent input from different sensory modalities as well as efference copy signals from motor areas to guide eye and forelimb movements (Kalaska, 1996; Andersen et al., 1997; Colby and Goldberg, 1999). Neurophysiologic and metabolic studies have demonstrated that area 7, in the lateral bank of the intraparietal sulcus (IPs), displays visual activity (Blatt et al., 1990; Colby et al., 1995) and helps program saccades to visual, memorized, and auditory targets (Gnadt and Andersen, 1988; Andersen et al., 1990; Colby et al., 1995; Mazzoni et al., 1996). Area 5, in the medial bank of IPs, displays visual (Colby and Duhamel, 1991; Savaki et al., 1993), somatosensory (Savaki et al., 1993; Duhamel et al., 1998), and skeletomotor activity (Georgopoulos and Massey, 1988; Kalaska et al., 1990) and guides reaching by maintaining a representation of the forelimb position based on proprioceptive feedback and motor efference information (Kalaska et al., 1983; Georgopoulos et al., 1984).
Goal-directed reaching is usually accomplished by an initial saccadic eye movement to foveate the target of interest, followed by a subsequent arm movement toward the same target. One aim of the current study was to dissociate the cortical regions in IPs which are involved in the control of eye movements from those involved in the control of forelimb movements. To this end, the [14C]deoxyglucose (14C-DG) quantitative autoradiographic method (Sokoloff et al., 1977) was used to map the metabolic activity in the brain of monkeys performing fixation of a visual target, saccades to visual targets, and reaching of a peripheral target in the light during fixation of a central visual target. The results of the first two experiments demonstrated that distinct subregions in the lateral intraparietal area 7 (7IP) are related to visual fixation and to saccadic eye movements. The results of the third experiment demonstrated that subregions in the dorsal part of the medial intraparietal area 5 (5DIP) and in the ventral intraparietal cortex around the fundus of IPs (areas 5VIP and 7VIP) are related to reaching with one forelimb in the light.
Another important problem is the dissociation between visual and somatosensory information used to guide reaching movements. In previous experiments, the authors used the 14C-DG method to map the local cerebral metabolic activity, during the performance of a visually cued reaching task, in visually intact monkeys and in monkeys with one hemisphere deprived of all known visual input by optic chiasm section and commissurotomy (Savaki et al., 1993). The different activations induced by the same behavior in the visually intact and the visually deprived monkeys led the authors to propose that the dorsal part of intraparietal area 5 is associated with the proprioceptive guidance of the moving forelimb, whereas the ventral part of the same area is related to the visual guidance of reaching. To test this hypothesis, the authors performed an additional experiment in the current study, in which the monkey had to reach from a central to a peripheral position in complete darkness while its eyes maintained a straight-ahead direction. Only somatosensory information is available to guide the forelimb during reaching in the dark (RD). In contrast, both visual and somatosensory information is available to guide the forelimb during reaching in the light (RL). Therefore, comparison of the distribution of activity in the IPs of the RD and the RL monkeys should allow for dissociation between subregions responsible for the somatosensory and the visual guidance of reaching. According to the authors' earlier proposal (Savaki et al., 1993), they predicted that only the dorsal intraparietal area 5 (5DIP) would be activated in the RD monkey, whereas the ventral intraparietal cortex (areas 5VIP and 7VIP) would be activated only in the RL monkey. In the current article, the authors provide evidence to support these predictions and consequently their earlier hypothesis. Furthermore, the distinct intraparietal cortical subregions that are involved in visual fixation, visually guided saccades, reaching in the light, and reaching in the dark are demonstrated for the first time in metabolic maps of high resolution.
MATERIALS AND METHODS
Experiments were performed in accordance with institutional guidelines complied with Greek and EU laws for the Care and Use of Laboratory Animals.
Subjects
Five adult female Macaca mulatta monkeys weighing between 3 and 4 kg were used. One monkey was an untrained control, whereas the other four monkeys were trained to perform four different tasks. All five monkeys had their heads fixed and a water delivery tube attached close to their mouth. For immobilization of the head, a metal bolt embedded in dental cement was surgically implanted on the head of each monkey with the use of mandibular plates that were secured on the bone by titanium screws (Synthes). Eye movements in the four experimental monkeys were recorded with implanted scleral search coils (Robinson, 1963). All surgical procedures were performed under general anesthesia (ketamine hydrochloride 20 mg/kg, intramuscularly) using aseptic techniques. Eye position was digitized online at a sampling rate of 500 Hz using the Spike2 software (Cambridge Electronics Design; Cambridge, U.K.). Saccades and reaching movements were made to a video (touch-sensitive) screen placed 23 cm in front of each monkey. Monkeys could not move their forelimbs during the fixation and saccade tasks and had to maintain fixation during the reaching tasks. Visual targets were red round illuminated spots of 1.5° diameter. Successful completion of each trial was rewarded with water.
Behavioral tasks
To use the smallest possible number of monkeys, the five behavioral tasks used in the current study were designed so that controlled behavioral parameters were gradually added. This way, all tasks were complementary to each other, and the major metabolic findings in each monkey per task were verified by those in the monkey of the following, more complex task (see Results for more detailed explanation).
The first monkey was an untrained control, seated in front of the nonfunctioning behavioral apparatus and receiving neither visual stimuli nor liquid reward during the 14C-DG experiment.
Fixation task
The second monkey had to fixate a central visual target located straight ahead (Fig. 1A). The monkey had to maintain fixation during the whole period of illumination of the target (4 seconds per trial) within a circular window of 2.5° diameter and was allowed to move the eyes only during the intertrial intervals (200 to 300 milliseconds). On the experimental day, this monkey maintained fixation for 75% of the time.
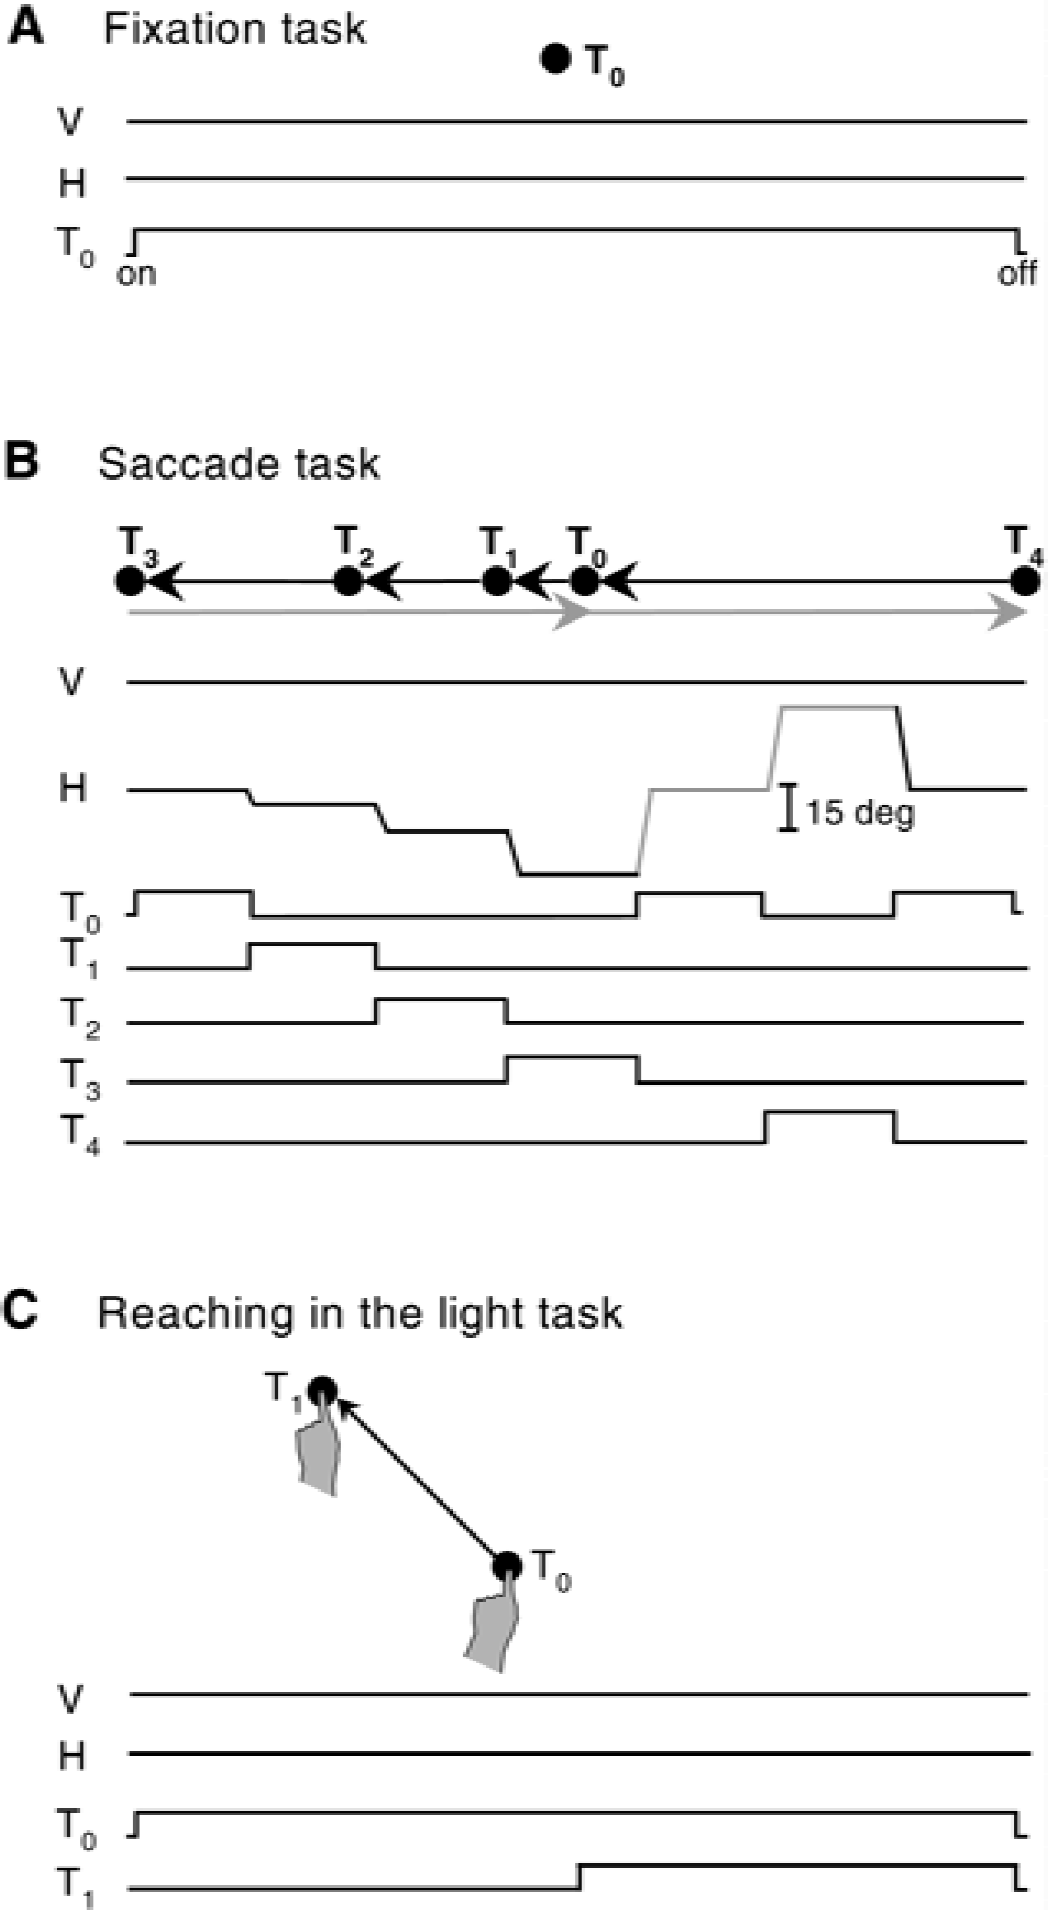
Schematics for behavioral paradigms and task events.
Saccade task
The third monkey was required to perform a sequence of visually guided horizontal saccades of 5°, 10°, and 15° to the left, then 2 saccades of 30° to the right, and finally a saccade of 30° to the left, as illustrated in Fig. 1B. The monkey had to fixate each illuminated target for 300 to 600 milliseconds until it disappeared and the next one was illuminated signaling a saccadic movement to the new location. Fixation was maintained within a circular window of 2.5° diameter. The minimum latency to move the eyes after onset of each target was set to 100 milliseconds to discourage anticipatory movements. The intertrial intervals ranged randomly between 500 and 800 milliseconds. On the experimental day, this monkey performed 55 leftward saccades of each amplitude (5°, 10°, 15°, and 30°) during the critical 5 first minutes of the 14C-DG measurement.
Reaching in the light task
The fourth monkey performed reaching movements in the light with the left forelimb, from a central to a peripheral visual target, during central fixation (Fig. 1C). The central target was located in the median sagittal plane at shoulder height, whereas the peripheral one was located 20° up left on a line inclined by 45° with respect to the horizontal and the midsagittal planes. The monkey was required to look at the illuminated central target and touch it with the index of its left forelimb for 800 to 1500 milliseconds, until the peripheral target was illuminated. Then, the monkey had to reach and touch the peripheral target and hold it for 500 to 1000 milliseconds while maintaining fixation of the central target. The minimum latency to move the forelimb was set to 250 milliseconds to discourage anticipatory movements. The maximum latency to reach the target was set to 1500 milliseconds, although the movement was usually completed in 500 to 600 milliseconds. The intertrial intervals ranged between 1000 and 1800 milliseconds. The monkey was required to hold eye and finger position within circular windows of 2.5° and 1.5-cm diameter, respectively. On the experimental day, this monkey performed 50 reaching movements during the critical 5 first minutes of the 14C-DG measurement.
Reaching in the dark task
The fifth monkey remained in the dark, where it performed reaching movements with the left forelimb from a central to a peripheral position on the touchscreen, while the eyes maintained a straight-ahead direction. View of its forelimb and of the touchscreen was occluded by a black barrier positioned vertically 10 cm in front of the monkey's eyes. The central and peripheral positions on the screen were at the same coordinates as the visual targets presented to the third monkey (same as in Fig. 1C). The monkey was required to hold eye and finger position within circular windows of 5° and 3.5-cm diameter, respectively. A speaker was placed 23 cm in front of the monkey, in the median sagittal plane, on top of the screen. After an auditory cue (90 Hz), the monkey had to look straight ahead in the dark, toward a location corresponding to the central position of the screen. Then the monkey had to reach (within 3000 milliseconds), touch the screen at the central position and hold it with the index of its left forelimb for 600 to 1000 milliseconds, until a second auditory cue (180 Hz) signaled a reaching movement to the peripheral position on the screen. Then, the monkey had to reach (within 2000 milliseconds) and touch the screen at the peripheral position and hold its forelimb there for 500 to 1000 milliseconds, while the eyes maintained the straight-ahead direction. The intertrial intervals ranged between 500 and 900 milliseconds. On the experimental day, this monkey performed 40 reaching movements during the critical 5 first minutes of the 14C-DG measurement.
[14C]deoxyglucose experiments
Each monkey was subjected to femoral vein and artery catheterization under ketamine anesthesia (20 mg/kg, intramuscularly) and was allowed 4 to 5 hours to recover. A pulse of 100 μCi/kg of 2-deoxy-D-[1-14C] glucose (specific activity 55 mCi/mmol, ARC) dissolved in saline was intravenously injected after the monkey started the behavioral task. Arterial samples were collected from the catheterized femoral artery during the succeeding 45 minutes, and the plasma 14C-DG and glucose concentrations were measured. At 45 minutes, the monkey was killed by intravenous injections of 50 mg sodium thiopental in 5 mL saline, and then a saturated potassium chloride solution. The brain was removed, frozen in isopentane at −50°C, and stored at −80°C. Twenty-μm-thick adjacent horizontal sections were cut serially in a cryostat at −20°C. Autoradiographs were prepared by exposing these sections (together with precalibrated 14C-standards) with medical x-ray film (Kodak EMC1) in x-ray cassettes. Intermediate sections were used for Nissl staining.
Quantitative densitometric analysis of autoradiographs was performed with a computerized image-processing system (Imaging Research, Ontario, Canada), which allowed integration of the local cerebral glucose utilization (LCGU) values over the entire extent of each area of interest. The definition of borders of cortical subregions was based primarily on their position relative to the identifiable fundus and crowns of the IPs (Fig. 2A and 2B). LCGU was calculated as in the authors' previous experiments (Savaki et al., 1993, 1996), from the appropriate kinetic constants for the monkey (Kennedy et al., 1978), by the original operational equation of the 14C-DG method (Sokoloff et al., 1977). Normalization of LCGU values was based on the average unaffected gray matter value pooled across all monkeys. Side-to-side percent differences within each monkey (%Dif in Table 1) were calculated as %Dif = (Contra − Ipsi)/Ipsi × 100, where Contra represents the LCGU average value in each cortical area of interest of the hemisphere contralateral to the moving forelimb, and Ipsi represents the respective ipsilateral LCGU value. Contra to Ipsi LCGU values were compared for statistical significances by the Kolmogorov-Smirnov test. Moreover, percent differences between monkeys (%DIF in Results) were calculated as either %DIF = (RD − RL)/RL × 100 or %DIF = (RL − RD)/RD × 100. For these calculations, the average LCGU value in each cortical area of interest contralateral to the moving forelimb in the RD and the RL monkeys was used. Regression analysis was performed to correlate the intensity of the fixation effect (LCGU values) in each hemisphere with the following behavioral parameters: (1) duration of fixation, (2) number of small amplitude contraversive saccades, (3) total number of small amplitude (contraversive and ipsiversive) saccades, (4) number of small amplitude ipsiversive saccades, (5) total number of contraversive (small and large amplitude) saccades, and (6) percentage of successful trials.
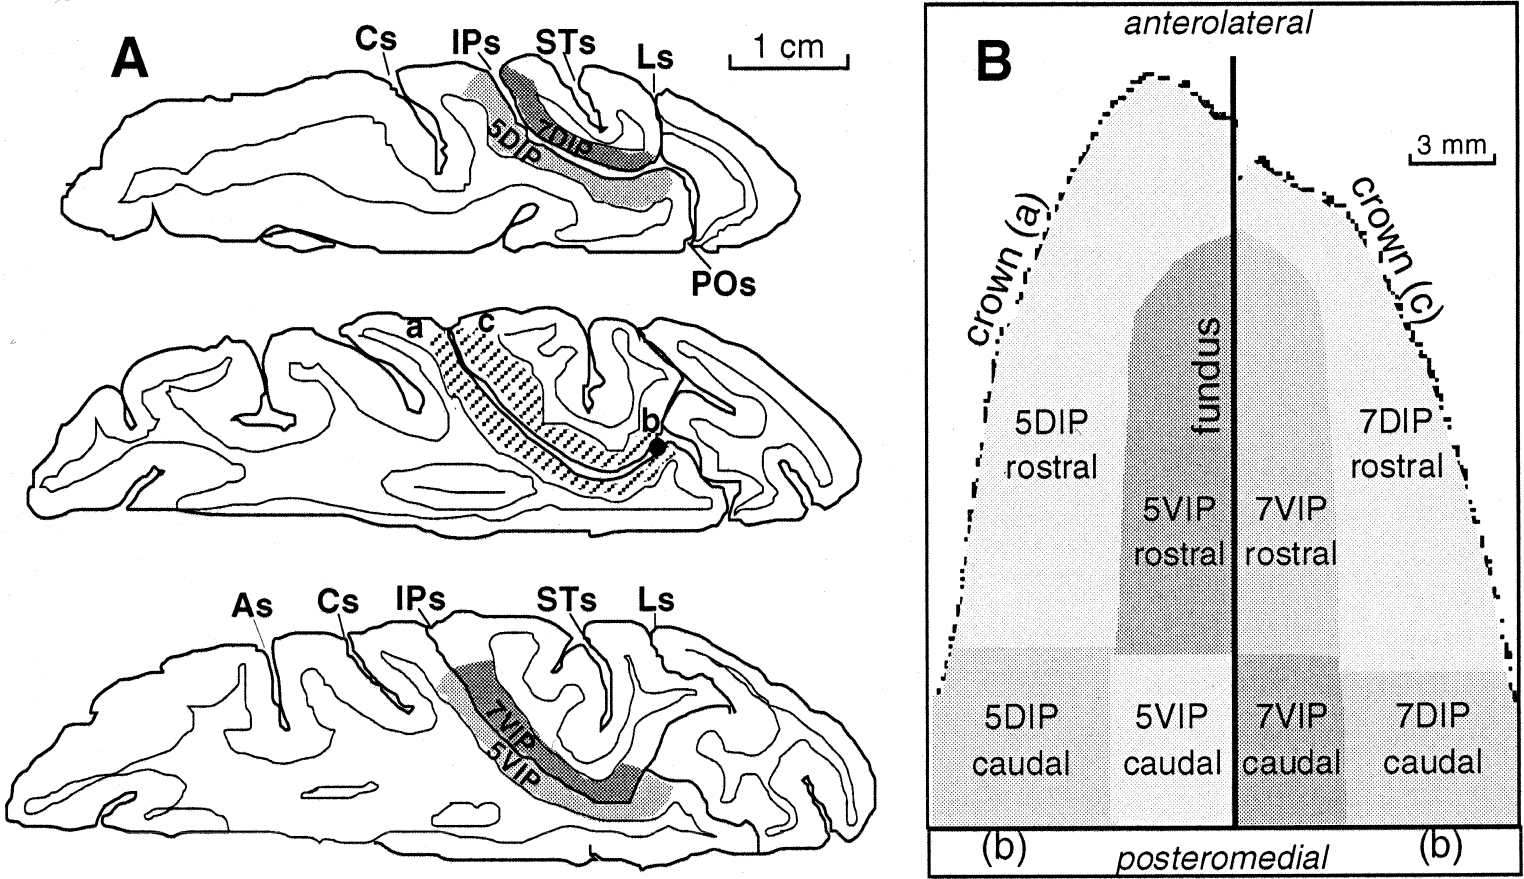
Reconstruction of the medial and lateral banks of intraparietal sulcus (IPs).
Metabolic effects in subregions of the intraparietal cortex
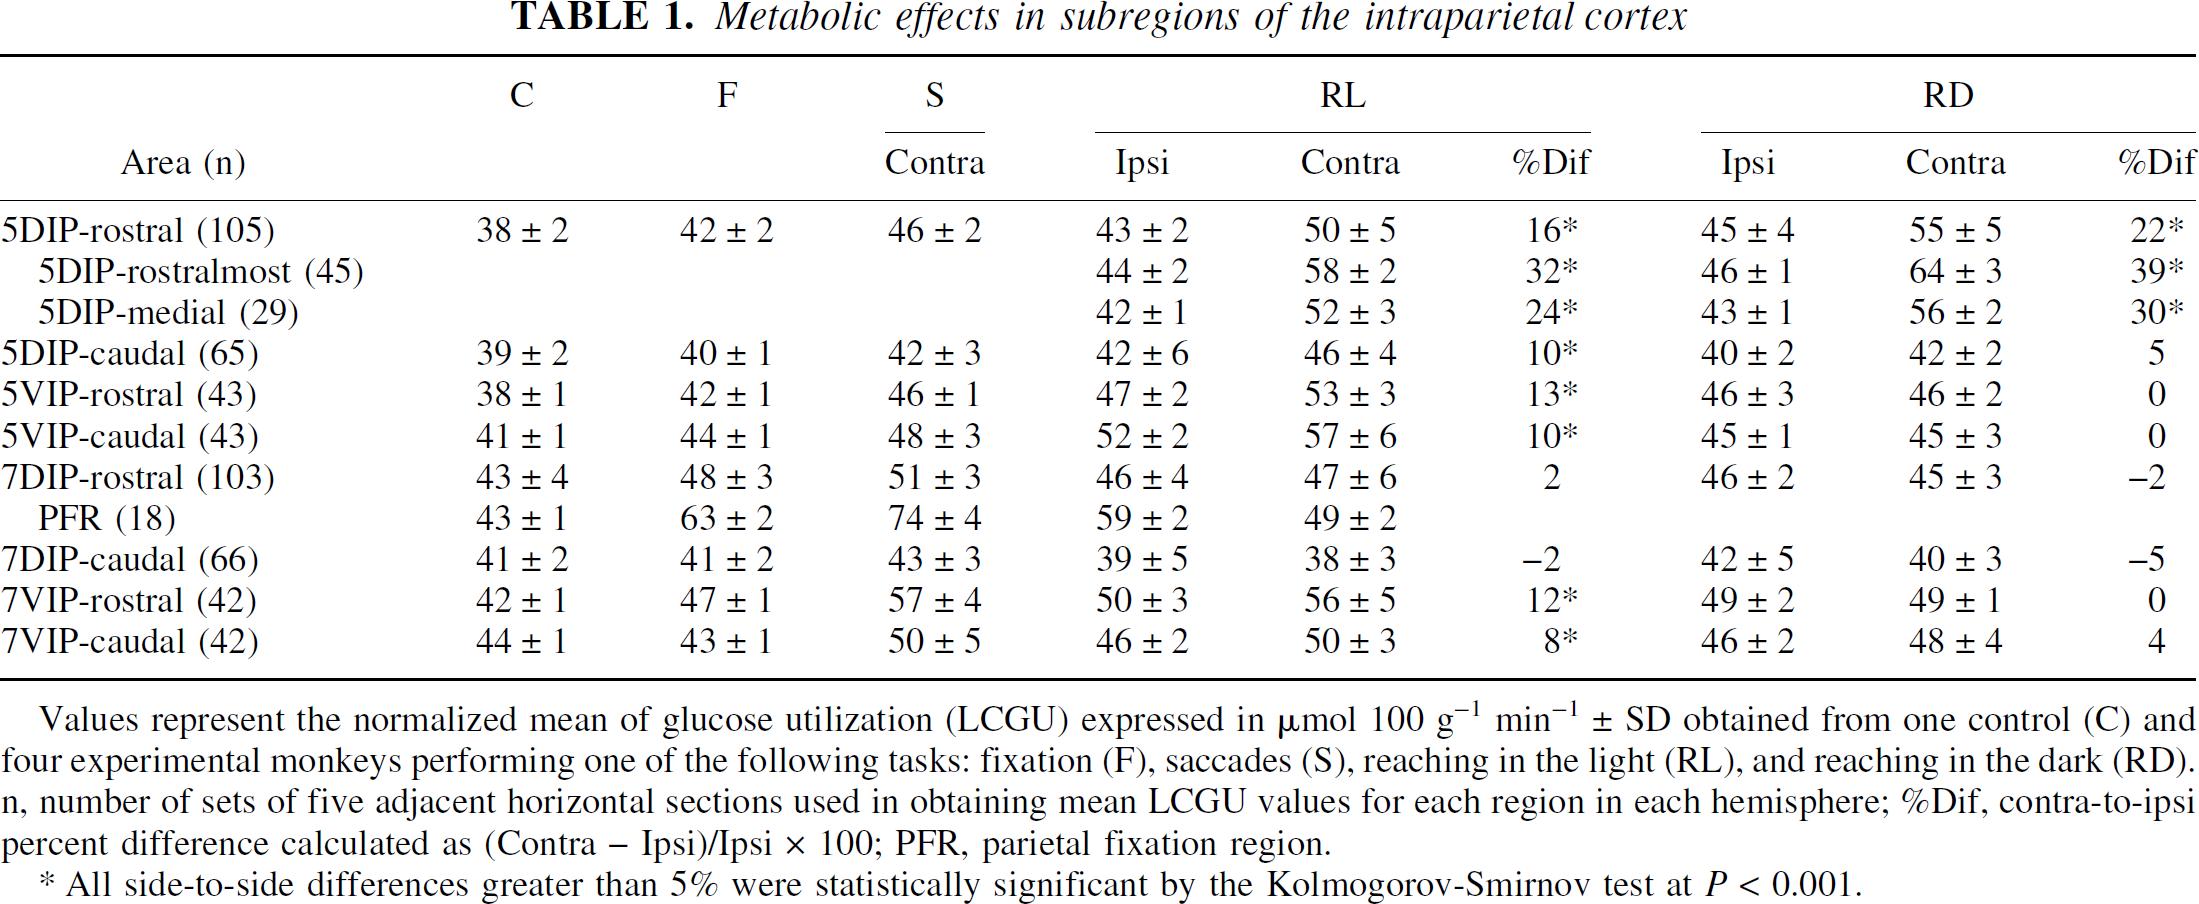
Values represent the normalized mean of glucose utilization (LCGU) expressed in μmol 100 g−1 min−1 ± SD obtained from one control (C) and four experimental monkeys performing one of the following tasks: fixation (F), saccades (S), reaching in the light (RL), and reaching in the dark (RD). n, number of sets of five adjacent horizontal sections used in obtaining mean LCGU values for each region in each hemisphere; %Dif, contra-to-ipsi percent difference calculated as (Contra – Ipsi)/Ipsi × 100; PFR, parietal fixation region.
All side-to-side differences greater than 5% were statistically significant by the Kolmogorov-Smirnov test at P < 0.001.
Two-dimensional reconstruction of cortical metabolic maps
Two-dimensional reconstruction of the spatio-intensive pattern of metabolic activity (LCGU) within the rostrocaudal and the dorsoventral extent of the unfolded IPs was generated in each hemisphere, as previously described (Dalezios et al., 1996; Savaki et al., 1997). In summary, the distribution of activity in the caudorostral extent in each section was determined by measuring LCGU values pixel by pixel (resolution 45 μm/pixel) along a line parallel to the surface of the cortex, covering all cortical layers. Each data array (a series of LCGU values in each horizontal section), resulting from image segmentation in the caudorostral direction, was aligned with the arrays obtained from adjacent horizontal sections (the total of 550 sections of 20-μm thickness which contained the whole extent of IPs) in the dorsoventral dimension of the brain. The caudalmost part of the IPs (the intersection of IPs with the parietoccipital sulcus, POs) was used for the alignment of adjacent data arrays (point b in Fig. 2A, and line b in Fig. 2B). The plotting resolution of both the caudorostral and the dorsoventral dimensions was 100 μm. Accordingly, each vertical line at a given dorsoventral level on the left half of the metabolic maps (Figs. 3 and 4) represents the distribution of the average activity in the medial bank along the rostrocaudal dimension in five serial sections. The vertical line at the same dorsoventral level on the right half of the metabolic maps represents the rostrocaudal distribution of the average activity in the lateral bank within the same five sections. Occasional missing data arrays in the dorsoventral dimension were filled using linear interpolation between neighboring values.
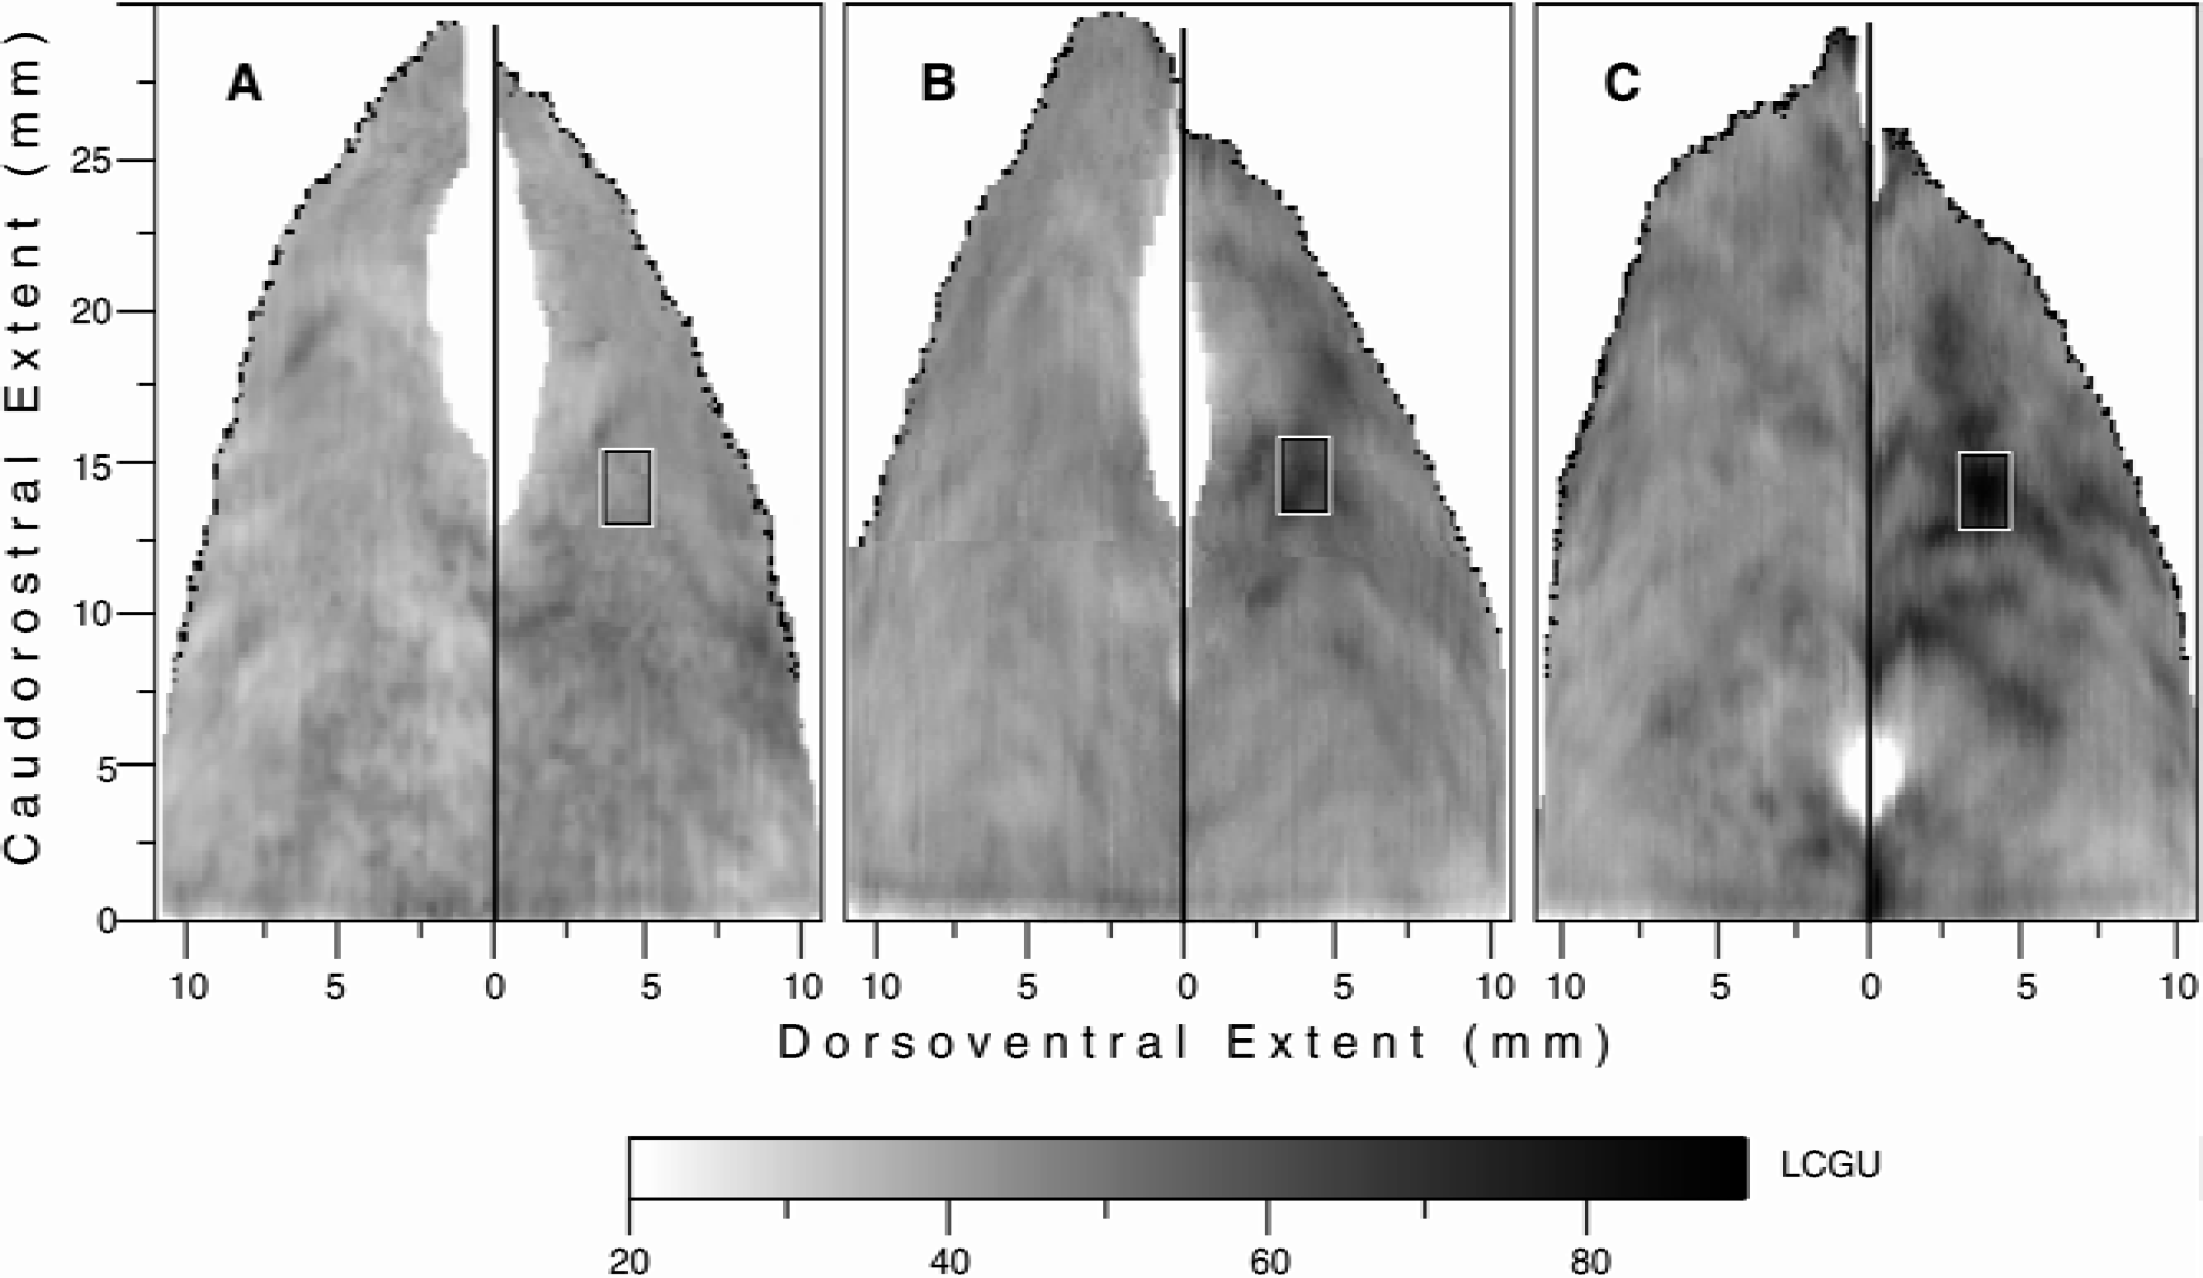
Activations in the intraparietal sulcus (IPs) induced by fixation and saccades to visual targets.
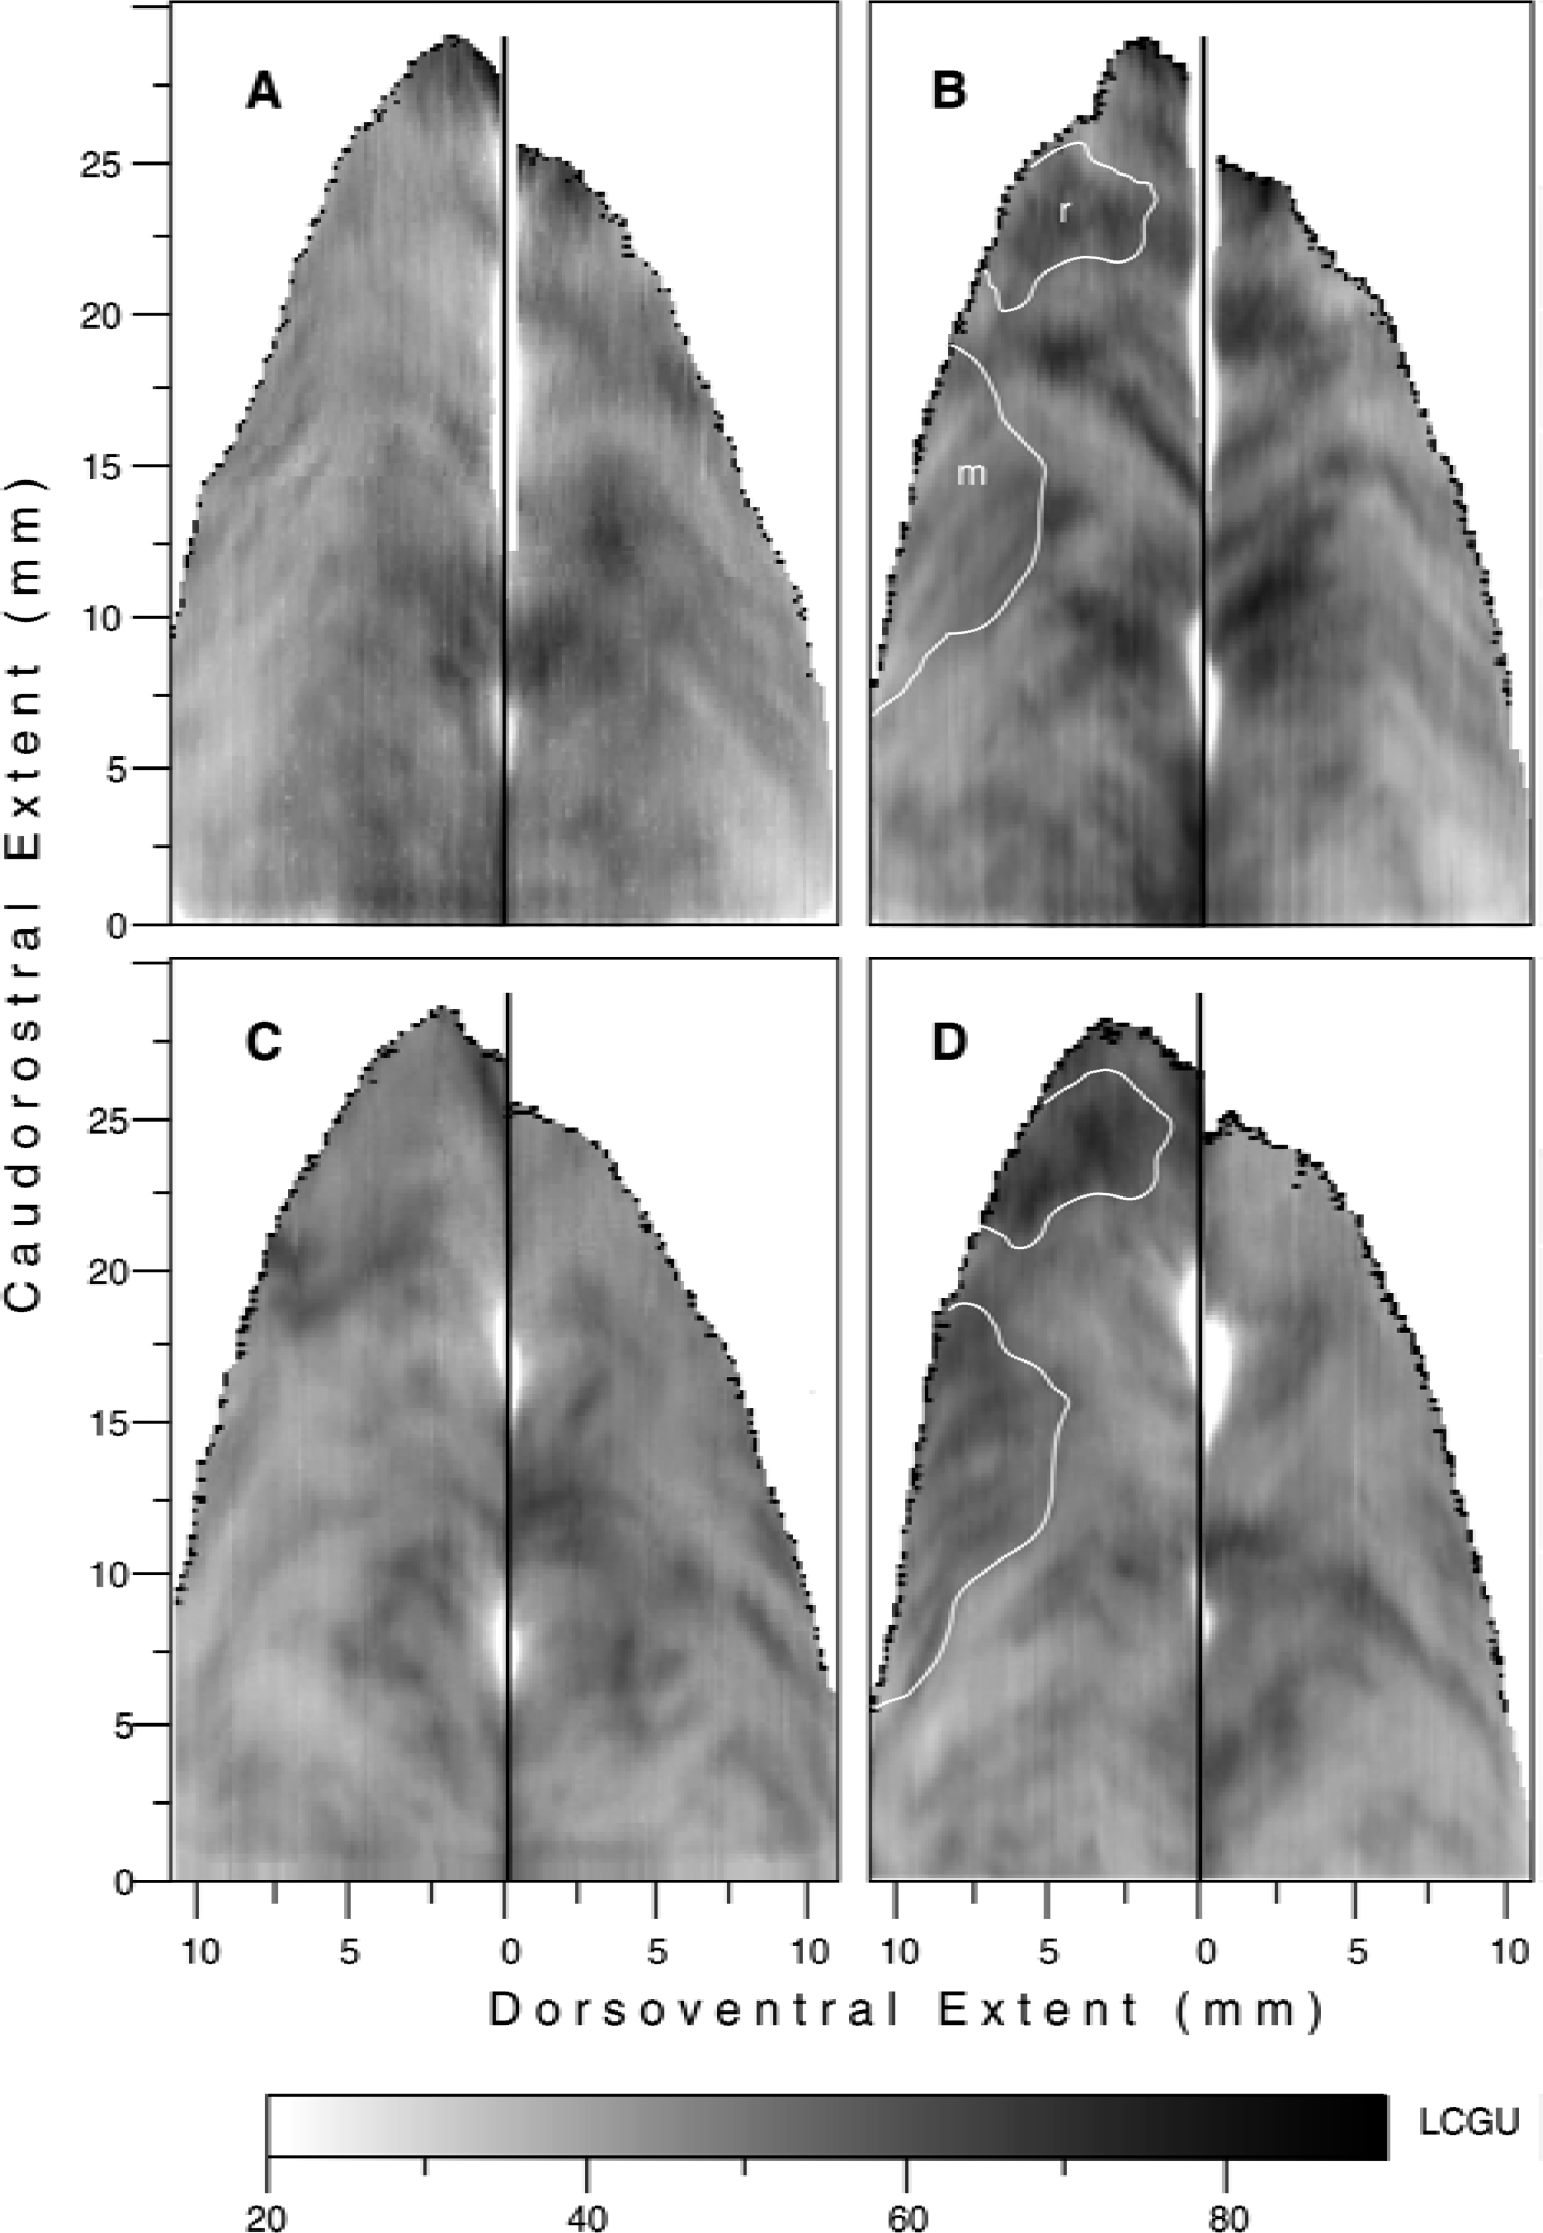
Activations in the intraparietal sulcus (IPs) induced by reaching in the light and reaching in the dark during fixation.
The maps of hemispheric differences (Fig. 5) were obtained by subtracting the metabolic map of the ipsilateral IPs cortex (Fig. 4C) from the map of the IPs contralateral to the moving forelimb (Fig. 4D) in the RD monkey and by subtracting the metabolic map of the IPs contralateral to the moving forelimb in the RD monkey (Fig. 4D) from the map of the IPs contralateral to the moving forelimb in the RL monkey (Fig. 4B). The fundus as well as the crowns of IPs were used for alignment of the maps used for subtraction.
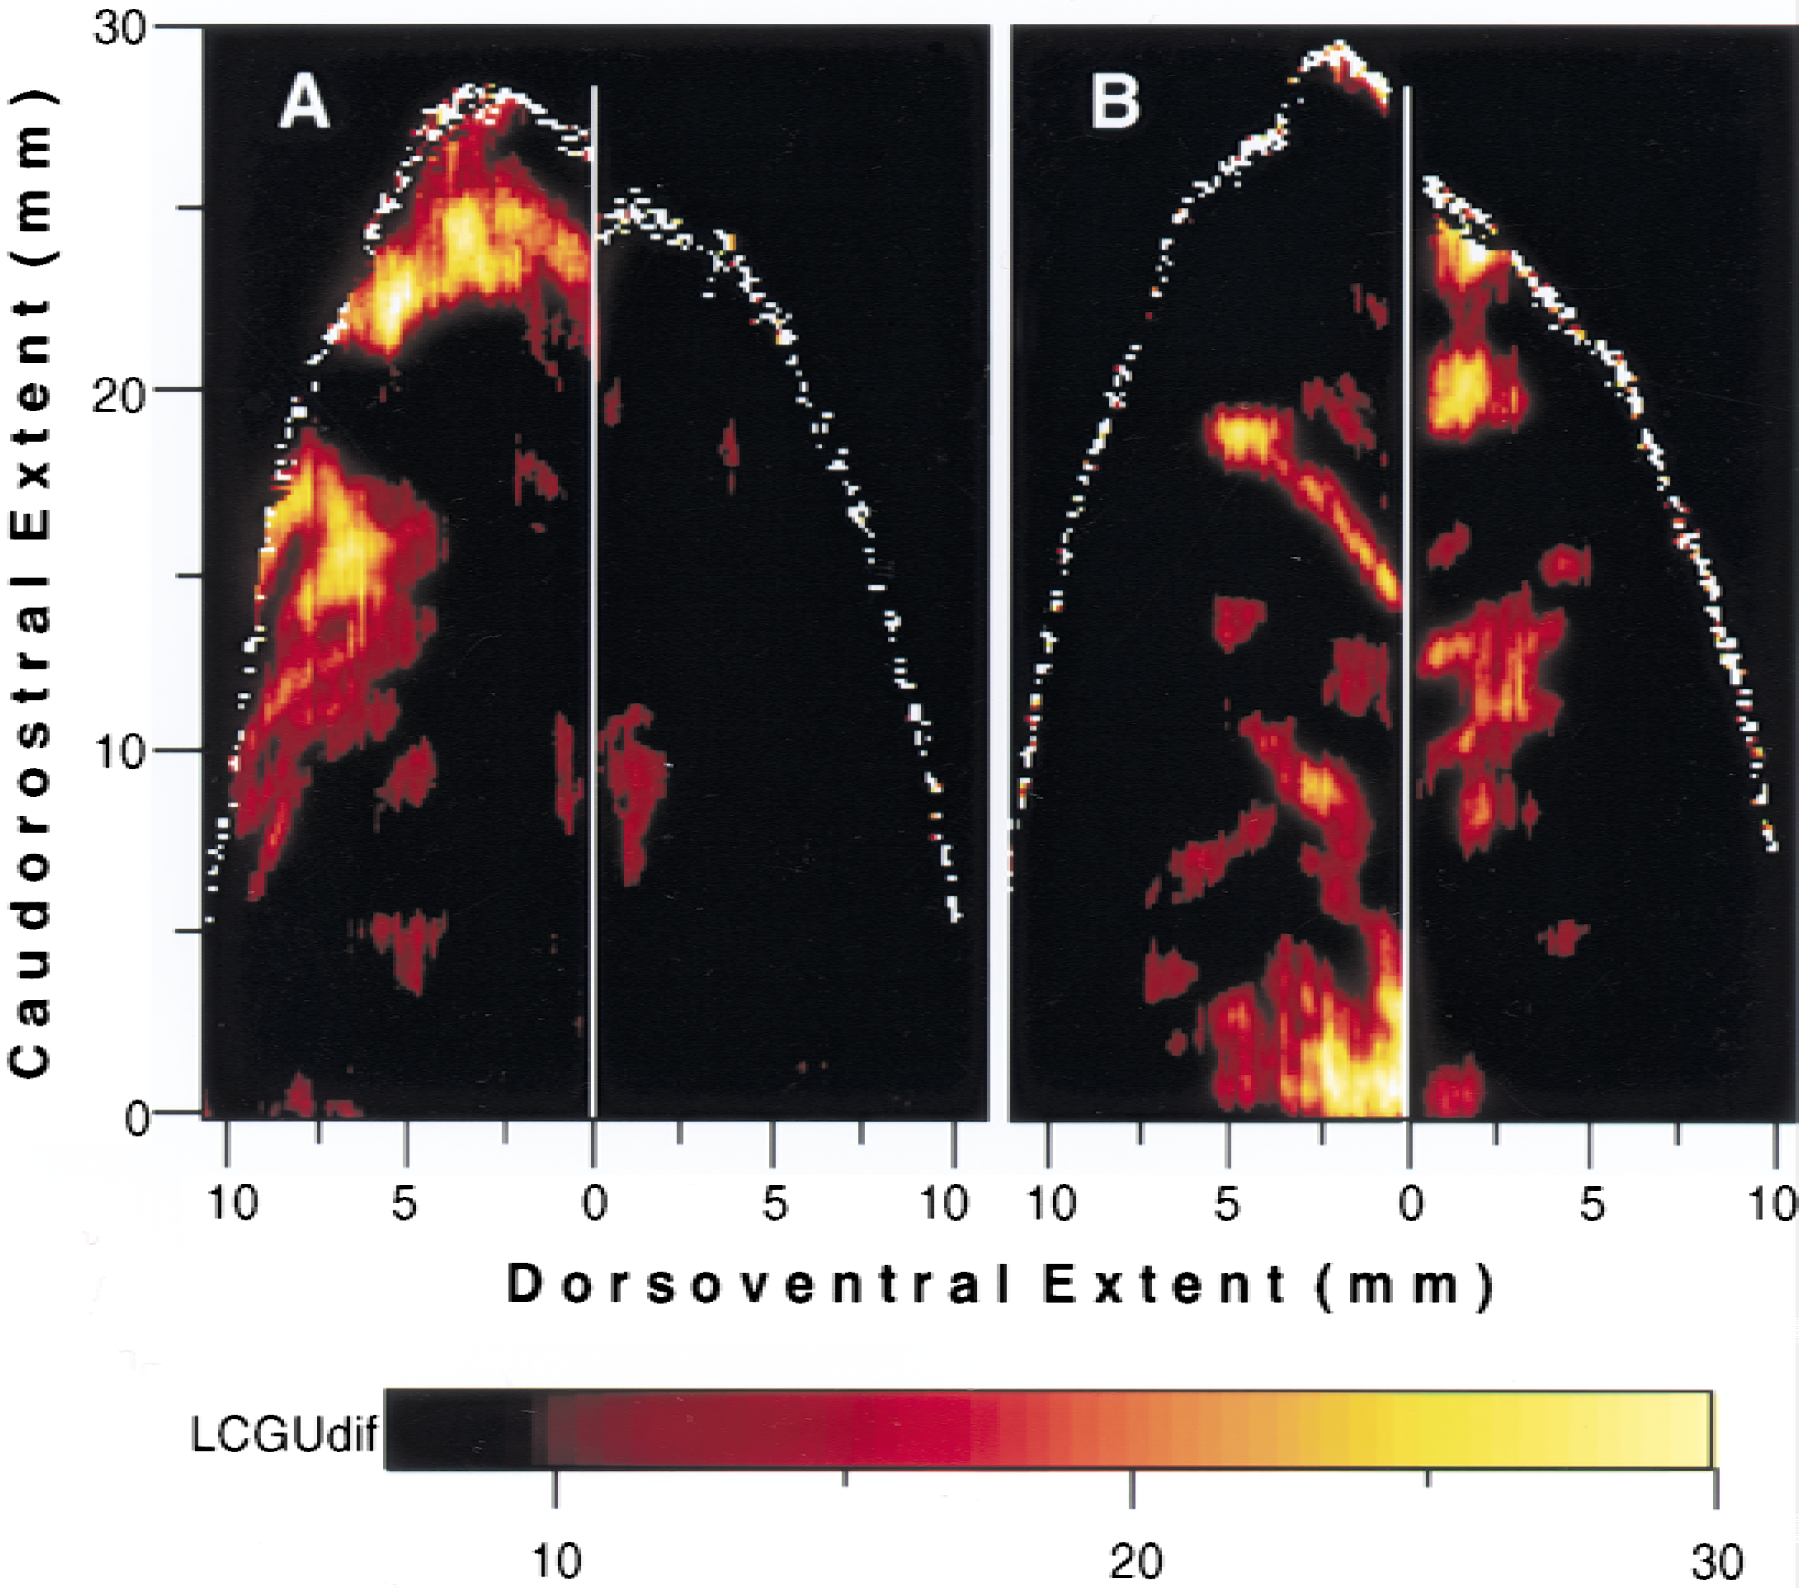
Subregions of intraparietal sulcus (IPs) involved in the somatosensory and visual guidance of reaching.
RESULTS
The 14C-DG method allows the visualization of patterns of brain activity in awake behaving monkeys, without invading them and their cerebral processes. The authors used this quantitative method to map the distribution of metabolic activity in the IPs of one control and four experimental monkeys performing one of four tasks: (1) fixation of a central visual target, (2) horizontal saccades of different amplitudes to visual targets, (3) reaching in the light during fixation of the central visual target, and (4) reaching in the dark while eyes maintained a straight-ahead direction. The distribution of metabolic activity in the entire caudorostral and dorsoventral extent of the IPs (Fig. 2A) was represented as a two-dimensional map in each one of the ten hemispheres of the present study. The medial and the lateral banks of IPs were subdivided into different subregions on the basis of the activations induced by the performance of the different tasks (Fig. 2B). This parcellation has been used in previous studies (Savaki et al., 1997; Savaki and Dalezios, 1999) and is now presented in detail, on the basis of functional criteria provided by the current study. The nomenclature used to describe this parcellation differs from what other authors have reported in recent literature. However, the use of this nomenclature is necessary to present quantitative results in activated regions that extend beyond the already reported ones. Area 5DIP covers the dorsalmost three fifths of the medial bank. Its rostral subregion (5DIP-rostral) is defined as the rostralmost three fourths of the entire rostrocaudal extent of the medial bank, reaching the fundus in the rostral tip of the bank. The remaining caudalmost one fourth (5DIP-caudal) extends caudally up to the intersection of the POs with the IPs. The delineation of areas 5DIP-rostral and 5DIP-caudal is based on the fact that the former area displayed major activations in contrast to the latter one in the reaching monkeys (Fig. 5). Area 5VIP covers the ventralmost two fifths of the medial bank (4 mm adjacent to the fundus) extending rostrally for 21 mm starting from the IPs-POs intersection. The parts corresponding to 5VIP-rostral and 5VIP-caudal cover the rostralmost two thirds and the caudalmost one third of area 5VIP, respectively. The same spatial relations are valid for the homologous subregions in the lateral bank of the IPs, that is, for areas 7DIP-rostral, 7DIP-caudal, 7VIP-rostral, and 7VIP-caudal. The delineation of rostral and caudal regions within the lateral bank is based on the differential activations induced by eye movements in these regions (Fig. 3). In most of the illustrated hemispheres (Figs. 3C, 4A to 4D), the fundus of the IPs is almost parallel to the horizontal plane of sectioning, and thus overlaps with the line of zero dorsoventrality. However, in 2 of the IPs maps (Fig. 3A and 3B), the rostral part of both banks 5 and 7 deviates from the line of zero dorsoventrality, apparently because of a different geometry of these sulci.
Fixation and saccade related regions in the IPs of the monkey brain
The two-dimensional reconstructed map of metabolic activity in the IPs of the right hemisphere in the monkey performing fixation of a central visual target displays a restricted region of enhanced metabolic activity in the lateral bank (Fig. 3B), which is not present in the respective IPs map of the untrained control monkey (Fig. 3A). This activation is located almost in the middle of the dorsoventral extent of the lateral bank (3 to 4 mm from the fundus) and rather rostrally (10 to 12 mm from its anterior tip). It lies within both areas 7DIP-rostral and 7VIP-rostral. The same activation was observed in the IPs map of the left hemisphere of the fixating monkey and not in the respective map of the untrained control subject (maps similar to those of the right hemispheres in Fig. 3B and 3A, respectively, and thus not illustrated). The absence of such activation in the IPs of the untrained control monkey indicates that the activated region in Fig. 3B may be related to either the fixation itself or to the performance of small amplitude saccades (0° to 2.5°) around the point of fixation. This area is referred to as the parietal fixation region (PFR). Quantification of the average LCGU value within the activated PFR in the fixating monkey (outlined by rectangle in Fig. 3B) and the corresponding region in the control monkey reveals a 47% increase in metabolic activity within the activated PFR.
The right hemisphere of the monkey performing contraversive horizontal saccades of 5°, 10°, 15°, and 30° displays activations within an extended region in the lateral bank of IPs (Fig. 3C). This region is referred to as the parietal saccade region (PSR). The activations within PSR appear as bands of increased metabolic activity that cover part of areas 7DIP-rostral and 7VIP-rostral. The most active subregion within the PSR of the monkey performing saccades (outlined by rectangle in Fig. 3C) overlaps topographically with the PFR of the fixating monkey, and is most probably related to the multiple short fixations of all visual targets for saccades required by the task.
The activation in 7IP of the left hemisphere in the RL monkey (Fig. 4A), which lies approximately 4 mm from the fundus and 12 mm from the anterior tip of the lateral bank, overlaps topographically with the PFR of the fixating monkey. PFR is activated in the RL monkey because this animal performed reaching during central visual fixation. Thus, by using complementary tasks, the activated PFR is demonstrated not only in the two hemispheres of the fixating monkey but also in the two hemispheres of the saccading and the RL monkeys. Rectangles of the same dimensions positioned at corresponding coordinates to those indicated in Fig. 3 were used for quantification of the LCGU within the PFR of all the analyzed hemispheres. Of interest is the gradual decrease of the PFR activation in the hemispheres of (1) the saccading (S) monkey, (2) the left and (3) right hemispheres of the fixating (F) monkey, (4) the ipsilateral and (5) contralateral hemispheres of the RL monkey, as well as (6) the control (C) monkey (74, 64, 63, 59, 49 and 43 μmol 100 g−1 min−1, respectively). Regression analysis was performed to reveal any possible correlation between the intensity of the PFR activation and several different behavioral parameters. The intensity of PFR activation in the different hemispheres is not correlated with the duration of fixation (2.8 minutes for the S monkey, 3.6 minutes for the F monkey, and 2.9 minutes for the RL monkey) during the critical 5 first minutes of the 14C-DG experiment (regression coefficient, r = 0.08, P > 0.1). In contrast, the intensity of the PFR activation is well correlated with the number of small amplitude contraversive saccades performed around the point of fixation (168 for the S monkey, 82 for the left and 138 for the right hemisphere of the F monkey, 63 for the ipsilateral and 18 for the contralateral RL hemispheres) during the 5 first minutes of the experiment (r = 0.92, P < 0.05). When the total number of small amplitude (contraversive and ipsiversive) saccades is used for the comparison, the r drops to 0.76 (P > 0.1). This drop of the regression coefficient is because of the inclusion of small amplitude ipsiversive saccades (43 for the S monkey, 138 for the left and 82 for the right hemisphere of the F monkey, 18 for the ipsilateral and 63 for the contralateral RL hemisphere), which are not correlated with the intensity of the PFR activation (r = 0.04, P > 0.1). Similarly, when the total number of contraversive (small and large amplitude) saccades (345 for the S monkey, 121 for the left and 178 for the right hemisphere of the F monkey, 197 for the ipsilateral and 143 for the contralateral RL hemisphere) is used for the comparison the r drops to 0.72 (P > 0.1). Finally, the authors examined the relation between the intensity of the PFR activation and the state of attention of the animal. Agreeably, the percentage of successful trials could reflect the state of attention of the monkey. Regression analysis demonstrates that the intensity of the PFR activation in the different hemispheres is not correlated with the percentage of successful trials (80 for the S monkey, 45 for the F monkey, and 70 for the RL monkey) during the 5 first minutes of the experiment (r = 0.06, P > 0.1). In conclusion, the results of the linear regression analysis indicate that 85% of the variance of the dependent variable (intensity of the PFR activation) can be accounted for by the number of small amplitude contraversive saccades performed around the point of fixation.
In summary, the metabolic effects induced by the performance of visual fixation and saccades to visual targets were confined in the intraparietal area 7 of the lateral bank in the IPs. The absence of any remarkable activation in the medial bank of the monkeys performing the fixation and saccade tasks indicates that intraparietal area 5 has no major involvement in the visual and saccadic aspects of these tasks.
Reaching related regions in the IPs of the monkey brain
The medial bank of the IPs was activated more strongly in the monkeys performing the reaching tasks, and mainly in the hemisphere contralateral to the moving forelimb (Fig. 4B and 4D).
Figure 4A and 4B represent the distribution of metabolic activity in the hemispheres ipsilateral and contralateral to the moving forelimb, respectively, of the monkey reaching from a central to a peripheral target in the light during fixation of the central visual target (RL). Both areas 5DIP and 5VIP are strongly activated in the hemisphere contralateral to the moving forelimb (Fig. 4B). Two activated regions are focused within area 5DIP-rostral in the contralateral hemisphere of the RL monkey (r and m outlined in Fig. 4B). The first one (r), which is located in the rostralmost part of area 5DIP, is more pronounced and displays 32% greater activity in the contralateral as compared with the ipsilateral hemisphere (Table 1, 5DIP-rostralmost). The second one (m), which is located caudally within the limits of area 5DIP-rostral, is greater by 24% in the contralateral than in the ipsilateral hemisphere (Table 1, 5DIP-medial). Several activations within area 5VIP of the RL monkey were bilateral, with the most pronounced ones running almost parallel to each other and covering the entire rostrocaudal extent in the hemisphere contralateral to the reaching forelimb. Some activations within area 7VIP of the RL monkey also were bilateral, with the most intense and extended ones running parallel to each other in the contralateral 7VIP-rostral.
Figure 4C and 4D represent the distribution of metabolic activity in the hemispheres ipsilateral and contralateral to the moving forelimb, respectively, of the monkey performing acoustically triggered reaching movements from a central to a peripheral position, in complete darkness, while its eyes maintained a straight-ahead direction (RD). Area 5DIP-rostral in the RD monkey displays two activated regions, the 5DIP-rostralmost and the 5DIP-medial, in the hemisphere contralateral to the moving forelimb (outlined in Fig. 4D), same way as in the RL monkey. Thus, by using complementary tasks, the activated regions 5DIP-rostralmost and 5DIP-medial are demonstrated not only in the RL but also in the RD monkey. These activations in the RD monkey display greater glucose consumption in the contralateral hemisphere as compared with the corresponding regions of the ipsilateral hemisphere by 39% and 30%, respectively. Comparison of these two effects in 5DIP-rostral in the RD and RL monkeys demonstrated that the activations were slightly greater in the RD monkey (Table 1). In contrast, area 5VIP of the RD monkey (Fig. 4D) did not display the pronounced activations observed in the RL monkey (Fig. 4B). A spatially restricted, moderately activated band is present in the lateral bank of the IPs in the RD monkey, bilaterally. Given that reaching was performed in complete darkness while the eyes remained stationary, this activated band cannot be attributed to visual stimulation or to voluntary saccades. This activation may be related to eye drifting during fixation in the dark. However, it cannot be excluded that this activation may be related to the auditory signals used as cues for reaching, because neuronal responses to auditory signals used as cues for saccades have been reported in the lateral bank of the IPs (Mazzoni et al., 1996).
The map generated after subtracting the cortical activity in the IPs ipsilateral to the moving forelimb (Fig. 4C) from that in the IPs contralateral to the moving forelimb (Fig. 4D) in the RD monkey is shown in Fig. 5A. In this map, the two activated regions 5DIP-rostralmost and 5DIP-medial are clearly delineated and demonstrate the unilaterality of the effect induced by RD. The outlines of these two activations in Fig. 5A were used to delimit the corresponding regions (r and m) in Fig. 4B and 4D. In the absence of visual input, these activations can only be attributed to somatosensory information used to guide the forelimb in the dark.
Both somatosensory and visual information is used to guide reaching in the light, whereas only somatosensory input is available to guide reaching in the dark. To reveal the regions associated with the visual guidance of reaching, the authors subtracted the map of the contralateral IPs in the RD monkey (Fig. 4D) from the equivalent map in the RL monkey (Fig. 4B). The generated map illustrates activated zones mainly in the ventral intraparietal cortex around the fundus of IPs (Fig. 5B). Quantitative comparison of the effects in the different subregions of the ventral intraparietal cortex demonstrated activations greater by 15% in area 5VIP-rostral, 27% in 5VIP-caudal, and 14% in 7VIP-rostral in the RL as compared with the RD monkey.
Based on the results of the two subtraction maps, the authors conclude that the dorsal part of intraparietal area 5 is involved in the somatosensory guidance of the reaching forelimb, whereas the ventral intraparietal cortex is implicated in the visual guidance of reaching.
DISCUSSION
The current results demonstrate that distinct subregions within the monkey intraparietal cortex are involved in different aspects of goal directed movements. This is the first time that high-resolution maps of the spatial distribution of metabolic activity in the entire intraparietal cortex have been generated to reveal the specific regions involved in visual fixation, voluntary saccades, reaching in the light, and reaching in the dark.
Subregions in the lateral bank of IPs involved in fixation and saccades
Parietal saccade region, a region associated with saccades to visual targets, was found in the lateral bank of IPs. The PSR is located in the rostral sector of 7IP and covers part of area LIP, as this has been defined on the basis of single unit recording (Andersen et al., 1990; Barash et al., 1991b) and microstimulation (Thier and Andersen, 1996), and the part of area VIP lying in the lateral bank of IPs close to the fundus (Colby et al., 1993). The activation of PSR in the current study is consistent with the well established saccadic (Barash et al., 1991a; Colby et al., 1995; Thier and Andersen, 1996) and visual (Blatt et al., 1990; Colby et al., 1993, 1995; Gottlieb et al., 1998) properties of areas LIP and VIP. However, the PSR in the current study may cover only a part of the saccade related intraparietal area because its activation was induced by single directional (only horizontal) saccades of different amplitudes. Indeed, preliminary observations in the authors' laboratory indicate that saccades to targets on a line inclined by 45° with respect to the horizontal plane activate a region that extends caudal to the presently illustrated PSR (Gregoriou GG, Moschovakis AK, Savaki HE, unpublished observations). The full extent of the saccade related intraparietal area will be revealed by the performance of saccades of different amplitudes in several directions.
Parietal fixation region, a region associated with fixation of a visual target, was found in the rostral sector of the lateral bank of IPs. The PFR lies in the anterior part of PSR, and posterior to AIP as this has been defined on the basis of neurophysiologic and anatomic studies (Sakata et al., 1995; Luppino et al., 1999; Murata et al., 2000). The location of PFR appears to be in register with the recently reported foveal representation in the rostral part of intraparietal area 7 (Ben Hamed et al., 1999). Its activation was consistent in both hemispheres of the monkey performing fixation of a visual target as well as in both hemispheres of the RL monkey. The PFR was also active in the monkey performing sequential horizontal saccades of different amplitudes, whereas it was not active in the control monkey. Because the intensity of the PFR activation varied in the different experimental hemispheres, the authors used linear regression analysis to examine whether this activation was correlated with certain behavioral parameters. No significant correlations were obtained with (1) duration of fixation, (2) total number of small amplitude (contraversive and ipsiversive) saccades, (3) number of small amplitude ipsiversive saccades, (4) total number of contraversive (small and large amplitude) saccades, and (5) percentage of successful trials. Taking into account that only the number of small amplitude contraversive saccades was significantly correlated with the intensity of the PFR activation in the different hemispheres, the authors suggest that the PFR activation is associated with the performance of small amplitude contraversive saccades around the point of fixation. Therefore, PFR may be the rostral part of PSR that is associated with small amplitude saccades.
In conclusion, this is the first time that a high-resolution map of functional activity induced by visually guided saccades of different amplitudes is generated, and a region related to fixation of a visual target is mapped in the lateral intraparietal area 7.
Subregions in the IPs involved in the visual and somatosensory guidance of reaching
The rostral part of the ventral intraparietal cortex (areas 5VIP-rostral and 7VIP-rostral) in the current study largely overlaps with area VIP as this has been defined on the basis of single unit recording (Colby et al., 1993). The current data demonstrate that area 5VIP (including 5VIP-rostral and 5VIP-caudal) is activated by visually guided reaching (Fig. 4B) and not in response to visual stimuli used as targets for saccades (Fig. 3C). Given that cells in area VIP display visual properties (Colby and Duhamel, 1991; Colby et al., 1993), the current finding indicates that visual information in this area is used to guide reaching and not to code target location per se. However, the activation of area 7VIP during both visually guided forelimb movements (Fig. 4B) and visually guided eye movements (Fig. 3C) indicates that this area encodes visual information about the location of stimuli used as targets for motor acts, whatever the effector used.
In the reaching tasks, area 5DIP-rostral was activated in the hemisphere contralateral to the moving forelimb in both the RL and RD monkeys. These two monkeys had in common only proprioceptive-somatosensory information available to guide the forelimb. Therefore, the activation of 5DIP-rostral should be attributed to the somatosensory guidance of reaching. Moreover, this activation was greater in the RD monkey, in which only somatosensory (and no visual) information was available to guide the forelimb. The higher activation of area 5DIP-rostral in the RD monkey as compared with that in the RL monkey may act as a compensatory mechanism to the absence of any visual information, in accordance with the authors' previous findings and suggestion (Savaki et al., 1993). The ventral intraparietal cortex (including both 5VIP and 7VIP) was activated mainly in the RL monkey, which was the only one with visual information available to guide the forelimb. Therefore, the activation of the ventral intraparietal cortex should be attributed to the visual guidance of reaching. Indeed, a similar activation to that around the fundus of IPs in the RL monkey also was observed in the IPs of a monkey performing reaching and grasping under visual fixation in the light (Raos VC, Papadaki P, Savaki HE, unpublished observations). The less lateralized effect in the ventral intraparietal cortex associated with visual processing as compared with that in dorsal intraparietal area 5 associated with somatosensory processing is consistent with previous findings (Colby et al., 1993; Savaki and Dalezios, 1999).
The functional dissociation of the dorsal intraparietal area 5 related to somatosensory guidance of reaching from the ventral intraparietal cortex related to visual guidance proves the authors' earlier hypothesis regarding the differential contribution of IPs cortical subregions in the control of reaching (Savaki et al., 1993; Savaki and Dalezios, 1999). Moreover, this dissociation is consistent with the following anatomic data. Area VIP receives visual input from areas MT, MST, FST (Maunsell and Van Essen, 1983; Ungerleider and Desimone, 1986; Boussaoud et al., 1990), and PO (Colby et al., 1988), and projects to the ventral premotor cortex (Luppino et al., 1999). More dorsally located areas MIP and PEip receive somatosensory input (Pandya and Seltzer, 1982; Pearson and Powell, 1985) and project to the dorsal premotor cortex (Matelli et al., 1998). Area MIP has been described as the middle one third (Colby et al., 1988; Matelli et al., 1998) of the caudal half of the medial bank. Accordingly, area MIP must cover part of the areas 5DIP and 5VIP, a fact consistent with the reported convergence of visual and somatosensory input (Pandya and Seltzer, 1982; Colby et al., 1988; Caminiti et al., 1996). Area PEip occupies the dorsalmost one third of the caudal half, and the whole rostral part of the medial bank (Matelli et al., 1998), thus overlapping with most of the area 5DIP-rostral. Two neuronal populations were labeled in PEip after injection in the dorsal premotor F2 arm field (Matelli et al., 1998). These two neuronal populations correspond topographically to subregions 5DIP-rostralmost and 5DIP-medial, which were both markedly activated in the current study (Fig. 5A).
Furthermore, the functional dissociation of the dorsal intraparietal area 5 related to somatosensory guidance of reaching from the ventral intraparietal cortex related to visual guidance is complemented by the following electrophysiologic data. Many neurons in VIP respond to visual stimuli located in the near extrapersonal space (Duhamel et al., 1998). Area MIP displays a range of properties from purely visual to bimodal to purely somatosensory, as the electrode moves from the fundus to the crown of the medial bank (Colby and Duhamel, 1991). The dorsal intraparietal area 5 responds to somatosensory stimuli (Mountcastle et al., 1975) and controls arm movements (Kalaska et al., 1990). Cells with movement-related activity associated with the execution of reaching are located around the crown of the medial bank of IPs, whereas cells with set-and signal-related activity associated with the planning of reaching are located deeper in the medial bank (Johnson et al., 1996). Finally, the current data are consistent with the results of a lesion study that has demonstrated that removal of the dorsal part of the medial bank causes misreaching in the dark, but has little effect on reaching in the light (Rushworth et al., 1997).
In conclusion, quantitative high-resolution maps of functional activity in the intraparietal cortex demonstrate, for the first time, the spatially distinct neuronal populations that are associated with the visual and the somatosensory guidance of reaching.
Footnotes
Acknowledgment:
The authors are indebted to Adonis Moschovakis for help and advice at all stages of the project.