
Abstract
Changes in cerebral blood flow (CBF) using laser–Doppler and microvascular O2 oxygen tension using oxygen-dependent phosphorescence quenching in the rat somatosensory cortex were obtained during electrical forepaw stimulation. The signal-averaged CBF response resulting from electrical forepaw stimulation consisted of an initial peak (t = 3.1 ± 0.8 seconds after onset of stimulation), followed by a plateau phase that was maintained throughout the length of the stimulus. In contrast, microvascular O2 tension changes were delayed, reached a plateau level (t = 23.5 ± 1.7 seconds after the onset of stimulation) that remained for the length of the stimulus and for several seconds after stimulus termination, and then returned to baseline. Using Fick's equation and these dynamic measurements, changes in the calculated cerebral metabolic rate of oxygen (CMRO2) during functional stimulation were determined. The calculated CMRO2 response initially was comparable with the CBF, but with protracted stimulation, CMRO2 changes were approximately one-third that of CBF changes. These results suggest that a complex relation exists, with comparable changes in CBF and CMRO2 initially occurring after stimulation but excessive changes in CBF compared with CMRO2 arising with protracted stimulation.
Recent neuroimaging techniques such as positron emission tomography and functional magnetic resonance imaging have provided insights into the organization of the brain. These methods directly monitor cerebral blood flow (CBF) changes and assess neural activity based on the assumption that a tight coupling exists between changes in neural activity and changes in CBF (Roy and Sherrington, 1890).
In the mammalian brain, oxidation of glucose through the tricarboxylic acid cycle provides most of the energy required for synthesis of adenosine triphosphate during basal conditions (Siesjo, 1978). Several studies have shown that functional stimulation leads to an increase in glucose metabolism with negligible changes in oxidative consumption (Ackermann and Lear, 1989; Fox et al., 1988). Thus, an uncoupling between changes in the cerebral metabolic rate of O2 (CMRO2) and the cerebral metabolic rate of glucose (CMRGlu) may exist (Fox and Raichle, 1986; Seitz and Roland, 1992; Ueki et al., 1988). An increase in nonoxidative glucose consumption has also been suggested from measurements of lactate production showing an increase during functional stimulation (Frahm et al., 1996; Prichard et al., 1991; Sappey-Marinier et al., 1992). However, Prichard et al. (1991) concluded that the small increases in lactate typically observed couldn't support a sustained increase in nonoxidative glucose metabolism. These results are supported by recent studies by Hyder et al. (1996, 1997), who showed comparable changes in the absolute values of CMRO2 and CMRGlu during forepaw stimulation in rats. These authors concluded that most of the energy required for the increased neuronal activity resulting from functional stimulation is supplied by glucose oxidation.
A similar parallelism exists with CBF and CMRO2. Using protracted functional stimulation paradigms, several studies in both humans and animals have measured changes in CBF and, either directly measured or calculated using a number of assumptions, CMRO2 at steady-state stimulation conditions. The results can be categorized into two main groups. Several studies have shown small or no task-induced increases in CMRO2 compared with CBF changes (Davis et al., 1998; Fox and Raichle, 1986; Fox et al., 1988; Hoge et al., 1999; Kim and Ugurbil, 1997; Madsen et al., 1995, 1998; Mandeville et al., 1999; Seitz and Roland, 1992); others have shown comparable changes in CMRO2 and CBF (Hyder et al., 2000a, 2000b; Kety and Schmidt, 1948; Marrett et al., 1993; Roland et al., 1987; Sokoloff et al., 1955). In all of the above studies, the dynamic changes in CMRO2 during stimulation could not be determined because CMRO2 measurements were obtained only during steady-state stimulation.
Oxygen-dependent phosphorescence quenching (ODPQ) can be used to monitor the transient changes in microvascular oxygen tension (Bakin et al., 1996). Oxygen-dependent phosphorescence quenching has a relatively rapid response time (seconds), accuracy to low microvascular oxygen pressures (<0.1 Torr), and a wide dynamic range and can be applied to measurements in vivo (Wilson et al., 1987, 1989). By measuring microvascular changes in Po2, the Ao2–Vo2 difference can be determined and dynamic changes in CMRO2 can be calculated. In the current article, the authors present dynamic changes in CBF, microvascular O2 tension, and calculated CMRO2 in the somatosensory cortex of rats before, during, and after functional activation resulting from periodic forepaw stimulation.
MATERIALS AND METHODS
Experimental preparation
Adult male Sprague-Dawley rats (300 to 340 g, n = 6) obtained from Charles River (Wilmington, MA, U.S.A.) were initially anesthetized with 1% to 2% halothane in 70% N2O/30% O2 through a face mask. The tail artery was cannulated with a polyethylene catheter for measurement of arterial blood pressure and arterial blood gases. Animals were tracheostomized, mechanically ventilated, and maintained on 1% halothane in 70% N2O/30% O2. The head was secured in a stereotaxic frame, a midline scalp incision was made, and the scalp was retracted from the frontoparietal cortex. A 4 × 5 mm area overlying the forepaw region of the somatosensory cortex was then thinned using a saline-cooled dental drill until only a thin translucent cranial plate remained. Halothane was discontinued after surgery and for at least 45 minutes before the acquisition of data. After surgery and during the stimulation studies, anesthesia was maintained using an initial dose of 60 mg/kg α-chloralose administered intraperitoneally, followed by hourly supplemental intraperitoneal doses of 30 mg/kg. The response to tail pinch was monitored before each supplemental dose of α-chloralose to ensure an adequate depth of anesthesia.
Body temperature was monitored with a rectal probe and maintained at 37.0°C ± 0.5°C using a heating pad. Arterial blood pressure was observed continuously and arterial blood gases were drawn approximately every 45 minutes. Ventilation parameters were adjusted to maintain Paco2 at 30 to 38 mm Hg.
Electrical stimulation and cerebral blood flow measurements
Electrical forepaw stimulation was performed using two subdermal needle electrodes inserted into the dorsal forepaw. A function generator (Global Specialties, New Haven, CT, U.S.A.) controlled the stimulus frequency and was fixed at 5 Hz. Stimulus amplitude was maintained at 2.0 mA using an isolation device (World Precision Instruments A-36V, San Diego, CA, U.S.A.). A micromanipulator on a stereotactic coordinate system (Stoelting, Wood Dale, IL, U.S.A.) was used to place the laser–Doppler probe (Model P435; Vasamedics, St. Paul, MN, U.S.A.) normal to the thinned skull at approximately 5 mm lateral to the bregma. All laser–Doppler measurements were recorded to approximately 1 mm in depth over of volume of approximately 0.5 to 1.0 mm3 and were recorded with a time constant of 0.5 seconds (Ances et al., 1998; Detre et al., 1998). The temporal resolution of laser–Doppler measurements was limited by the OPDQ measurements and was every 1.7 seconds.
Oxygen tension measurements
The phosphorescence decay of Oxyphor R2 (Pd-meso-tetra (4-carboxyphenyl) porphyrin dendimer; Oxygen Enterprises, Philadelphia, PA, U.S.A.) was measured in the cerebral circulation over the thinned skull. Oxyphor R2, an oxygen tension-sensitive phosphorescent dye that associates with albumin, was injected into the tail artery. Phosphorescence decay of this dye is quenched in the presence of oxygen, thereby permitting calibration of microvascular oxygen tension (Rumsey et al., 1988; Wilson et al., 1987). This technique can measure to a depth of 1 mm, similar to the area sampled by the laser–Doppler probe. Simultaneous O2 tension and laser–Doppler measurements could not be made because of overlap between frequencies. For all O2 tension measurements, a 2-mm-diameter probe was placed over the same region from which laser–Doppler results had been obtained. O2 tension measurements using ODPQ measured to a comparable depth of the laser–Doppler probe, with the temporal resolution limited to every 1.7 seconds (Rumsey et al., 1988; Wilson et al., 1987).
Percentage change in cerebral metabolic rate for oxygen
CMRO2 was calculated based on Fick's formula:

where CO2art = arteriolar O2 concentration and CO2ven = venous O2 concentration. The ODPQ technique provides data on oxygen tension (PO2) in the microvasculature. It was therefore necessary to convert the oxygen tension data into oxygen concentrations. The oxygen dissociation curve was used to convert oxygen tension to oxygen saturation (S2sat), which was then converted to oxygen concentration using the known relation between saturation and concentration. Based on the values of Pao2 in the experimental animals, the oxygen tension in the arterioles (PO2art) was assumed to be 60 mm Hg and did not change during the stimulation (McHedlishvili et al., 1997). When simulations were also run with PO2art set to 70 mm Hg, the calculated changes in CMRO2 were similar. PO2ven was derived from the phosphorescence signal, which has approximately a 10% arteriolar contribution, a 10% venule contribution, and an 80% capillary contribution (Rumsey et al., 1988; Wilson et al. 1987, 1988, 1989). It was assumed that venous blood that drains the region is in equilibrium with capillary blood, permitting the calculation of PO2ven. The conversion from oxygen tension to oxygen saturation also requires knowledge of blood pH. Capillary blood pH was assumed to be between 7.30 and 7.40 and to be unaltered as a result of stimulation (Sappey-Marinier et al., 1992; Ursino et al., 1989).
Conversion of oxygen saturation to oxygen concentration requires knowledge of both hematocrit and pH. Hematocrit was considered not to change significantly during stimulation (Bereczki et al., 1993; Keyeux et al., 1995), and arteriolar and capillary hematocrits were fixed at 35 and 30 mL/100 mL blood, respectively (McHedlishvili et al., 1997). As discussed above, the capillary blood pH was assumed to be between 7.30 and 7.40 and to be unaltered as a result of stimulation (Sappey-Marinier et al., 1992; Ursino et al., 1989). Oxygen concentration was taken to be the sum of bound oxygen (Cbound) and dissolved oxygen (Cdissolved) and was calculated from measured oxygen tension, oxygen saturation, and hematocrit (Zander, 1981):


where Cmax = 20 mL O2/100 mL blood, αp = 2.85 × 10⁻³ mL O2/100 mL plasma/mm Hg, and αrbc = 1.8 × 10⁻³ mL O2/100 mL water/mm Hg.
Although CBF measured with laser–Doppler is well correlated with absolute CBF (Haberl et al., 1989; Sharphedhedinsson et al., 1993), only relative data (as a percentage of baseline) are usually obtained with laser–Doppler flowmetry. Relative changes in CMRO2 can be quantitatively obtained from the relative changes in CBF:

Stimulation protocol
Measurements of CBF and blood O2 tension were made for repetitive periodic stimulation iterations that consisted of 1 minute off (no stimulus) and 1 minute on (stimulus). A single laser–Doppler iteration consisted of 600 data points acquired at 5 Hz; O2 tension was sampled every 1.7 seconds throughout the 2-minute iteration. For laser–Doppler and O2 tension measurements, a single trial consisted of 10 iterations. A laser–Doppler trial was performed before and after two O2 tension trials were obtained for each rat. Arterial blood pressure also was monitored continuously to ensure that CBF changes were not the result of systemic blood pressure changes (Ances et al., 1998; Detre et al., 1998).
Data analysis
For both CBF and microvascular O2 tension measurements, signal averaging was used across multiple periodic trials to increase the signal-to-noise ratio. The signal-averaged laser–Doppler data were saved as raw voltages and converted to percentage changes from baseline by dividing the corrected flow by the average baseline flow value obtained before stimulation. Signal-averaged laser–Doppler data were averaged in 1.7-second epochs to allow direct comparison with the O2 tension data that had been collected. O2 tension data were saved, interpolated, and signal-averaged over the 10 iterations. To calculate CMRO2 changes, microvascular O2 tension changes were converted to percentage changes from baseline by dividing the observed O2 tension by the average baseline O2 tension before stimulation. For each rat, measurements within a trial were averaged with data from multiple rats collated, and overall averages for changes in CBF, microvascular O2 tension, and calculated CMRO2 changes were determined along with intersubject standard deviations.
Data are expressed as mean ± SD. A one-way analysis of variance was performed on the CBF and the calculated CMRO2 changes obtained during different intervals of the stimulus, with a Tukey test performed when a significant difference was observed (Sigma Stat, SPSS, Chicago, IL, U.S.A.). For all analyses, differences were considered to be significant at P < 0.05.
RESULTS
Physiologic variables
Physiologic parameters for the current study were mean arterial pressure 117 ± 3 mm Hg, pH 7.41 ± 0.03, Paco2 34.7 ± 2.6 mm Hg, and Pao2 115 ± 6 mm Hg (n = 6). No significant changes in the physiologic variables were detected during stimulation.
Time course
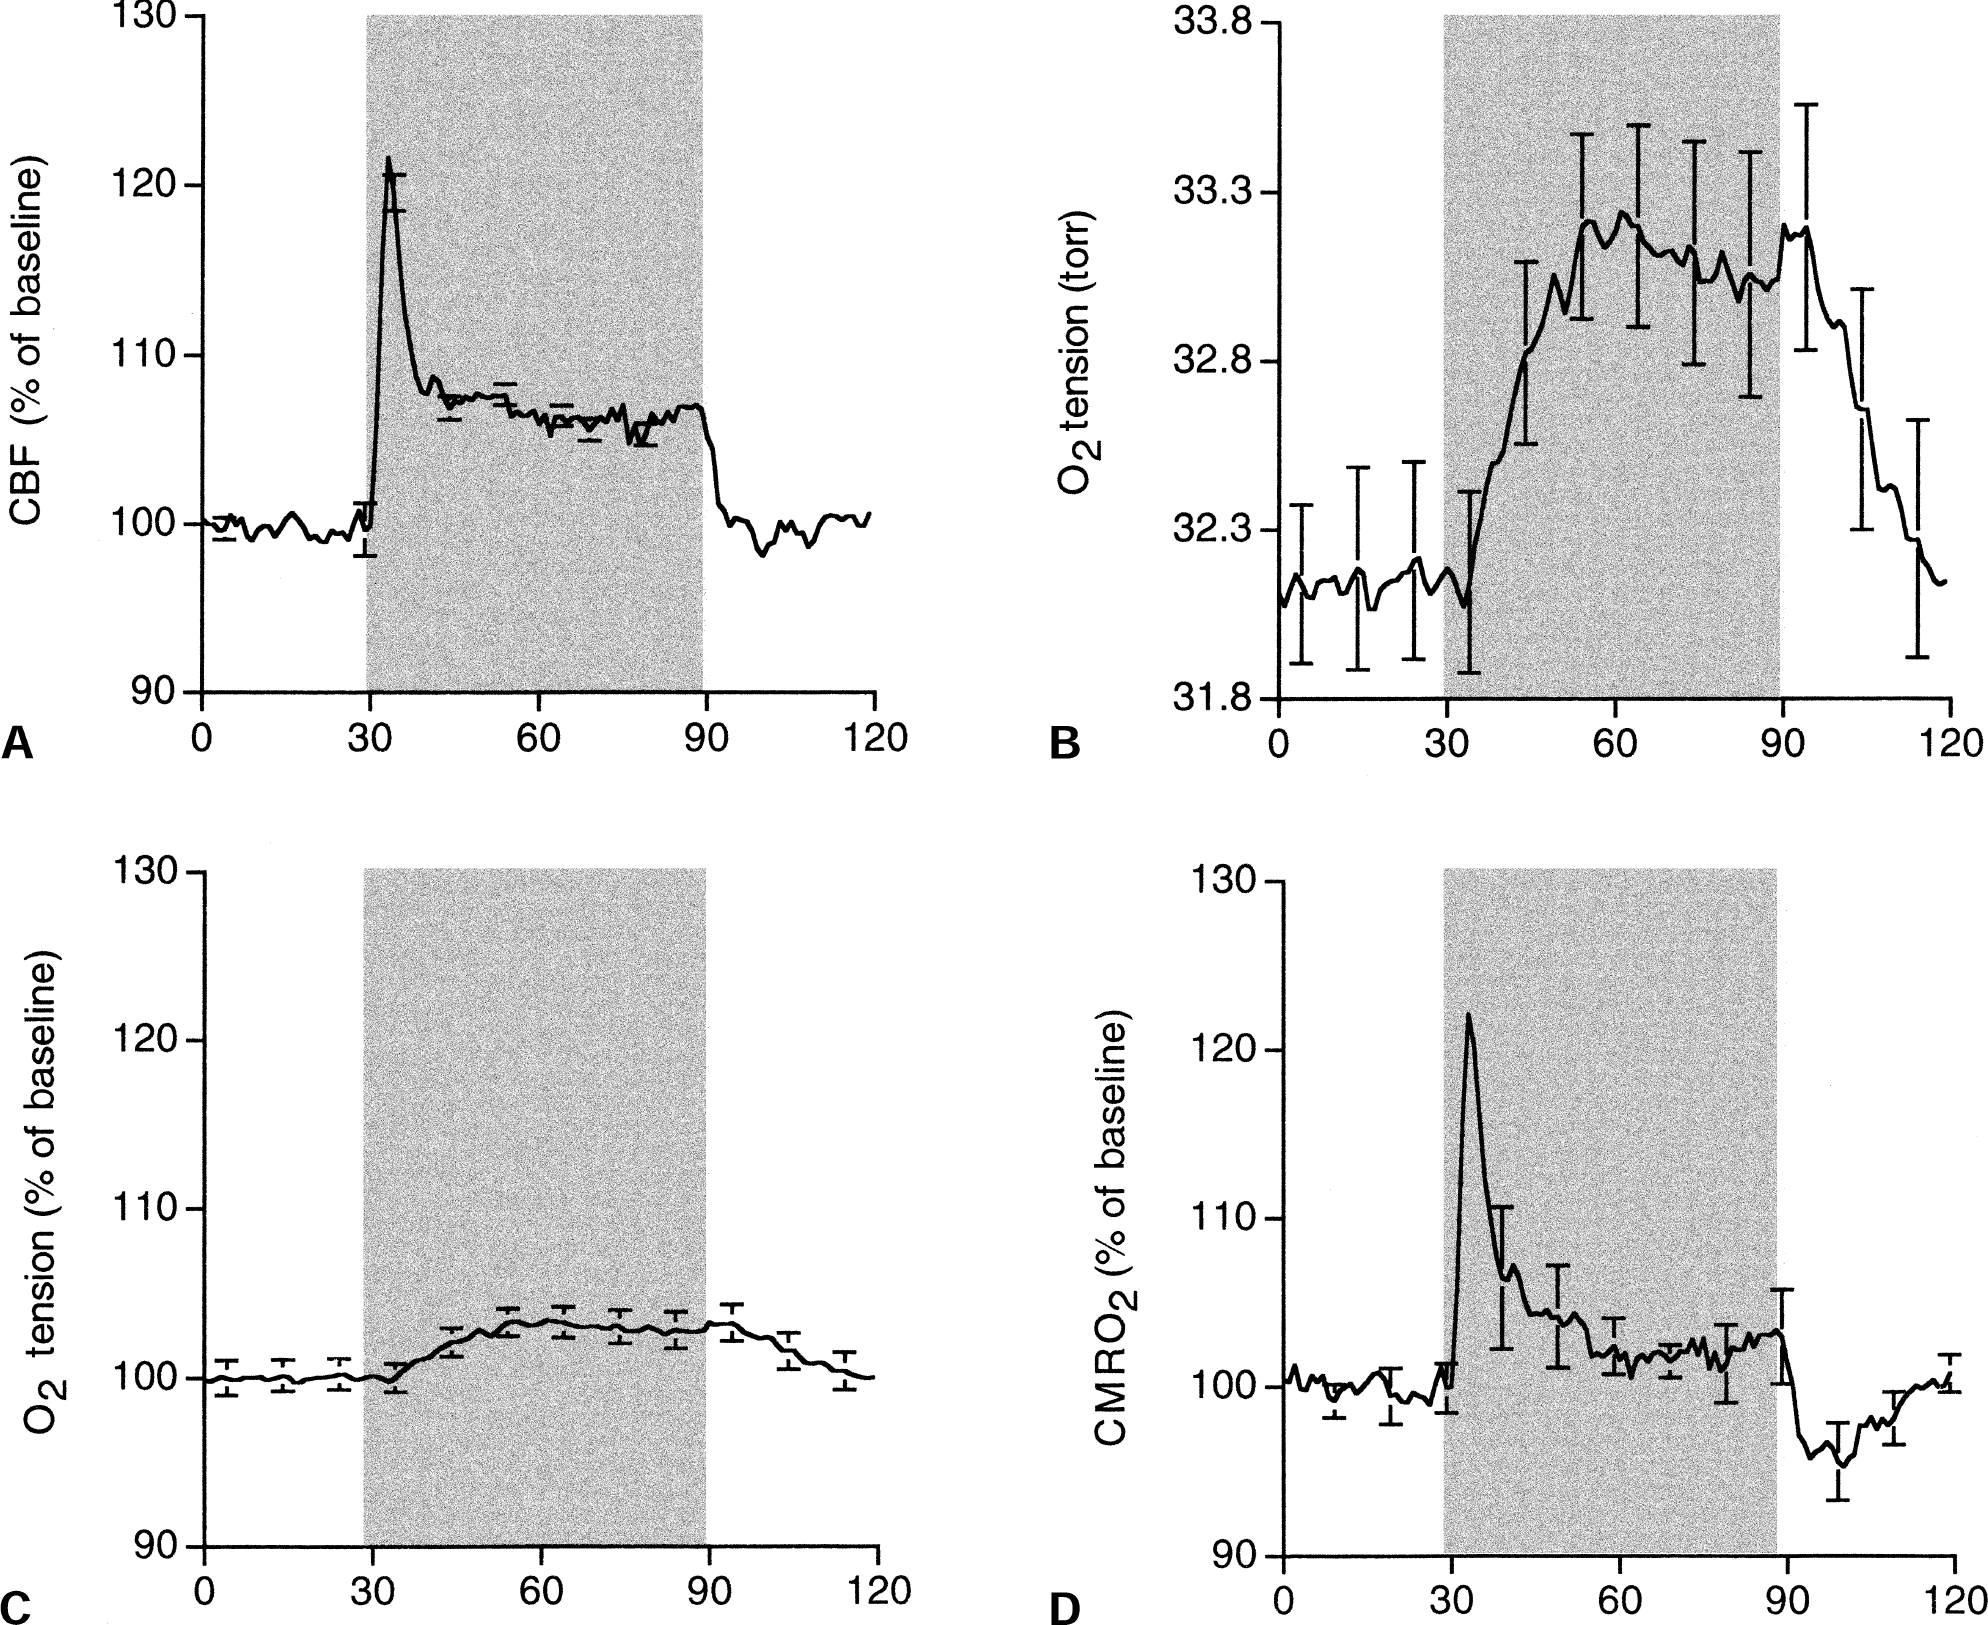
Figure 1 shows the time course of the signal-averaged percentage of baseline for CBF, absolute microvascular O2 tension changes, percentage of baseline for O2 tension, and the calculated percentage of baseline for CMRO2 during 1 minute of electrical forepaw stimulation. Functional stimulation led to an initial peak in the CBF response (t = 3.1 ± 0.8 seconds after onset of stimulation) followed by a plateau level of lower magnitude that was maintained for the length of the stimulus. These results are similar to those obtained previously using similar stimulus parameters (Ances et al., 2000a). In contrast, over a similar sampled area of the somatosensory cortex, the O2 tension response showed an initial delay of approximately 5 seconds. O2 tension then gradually rose to a plateau (t = 23.5 ± 1.7 seconds after the onset of stimulation), remaining elevated for the length of the stimulus and a few seconds after stimulation termination before returning to baseline. Baseline microvascular O2 tension was 32.1 Torr; it increased to 33.3 Torr during stimulation. Figure 1 also shows O2 tension as a percentage of baseline for the 1 minute of stimulation. A similar-shaped response was observed, with an approximately 4% change from baseline observed with stimulation. The calculated CMRO2 as a percentage of baseline was similar to the CBF. After an initial peak immediately after the onset of stimulation, the calculated CMRO2 was maintained at a reduced steady state that persisted for the length of the stimulus. After stimulation, a prominent poststimulus undershoot was present.
Time course of the signal-averaged
Changes for different time periods of the stimulus
Cerebral blood flow and calculated CMRO2 were averaged over 2 time intervals: the initial period after stimulus onset (30 to 40 seconds) and the last 30 seconds of the stimulus (60 to 90 seconds) (Table 1). Initially after stimulation, comparable changes in the percentage change in CBF from baseline and the calculated percentage change in CMRO2 from baseline were observed. The ratio of the change in CBF from baseline to the change in CMRO2 from baseline was 1.0 immediately after the onset of stimulation. However, with protracted stimulation a plateau existed for both the change in CBF from baseline and the change in CMRO2 from baseline. However, the magnitude of the changes in CBF from baseline was greater than the calculated change in CMRO2 from baseline. The percentage change in CBF from baseline was approximately threefold greater than the calculated percentage change in CMRO2 from baseline (2.93) with protracted stimulation.
Changes in % changes in CBF from baseline and calculated % changes in CMRO2 from baseline during stimulation
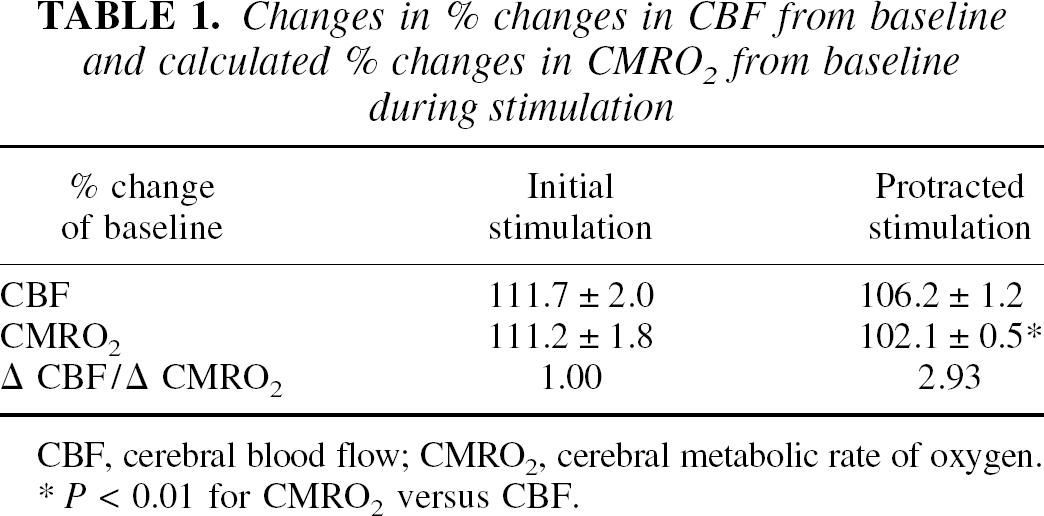
CBF, cerebral blood flow; CMRO2, cerebral metabolic rate of oxygen.
P < 0.01 for CMRO2 versus CBF.
DISCUSSION
There are two main results of the current article. First, the signal-averaged CBF response consisted of an initial peak followed by a plateau that was maintained for the length of the stimulus, whereas the microvascular O2 tension gradually increased to a plateau level that was maintained for the length of the stimulus. Second, the calculated CMRO2 response was similar in shape to the CBF response, with comparable percentage changes in CBF and CMRO2 initially occurring after activation, but greater percentage changes in CBF occurring compared with the percentage changes in CMRO2 with protracted stimulation.
The current results are compatible with those of previous studies that have hypothesized that the calculated CMRO2 increases immediately after stimulus onset as a result of increased neuronal metabolic demands (Davis et al., 1998; Malonek et al., 1997; Silva et al., 2000; Vanzetta and Grinvald, 1999). Although the authors' O2 tension measurements did not have the temporal resolution to resolve changes in oxygen utilization that precede changes in CBF, as has been previously observed using ODPQ (Vanzetta and Grinvald, 1999) and optical imaging (Malonek et al., 1997), the authors' calculated CMRO2 results are entirely consistent with these observations. The early dynamic changes in CMRO2 that are presented in the current article have not been previously observed in positron emission tomography studies, because CMRO2 measurements could be obtained only at steady-state levels of protracted stimulation (Fox and Raichle, 1986; Fox et al., 1988). The authors' results suggest an initial close relation between CBF and CMRO2 and agree with a recent study performed by the authors measuring neuronal activity, determined by somatosensory evoked potentials, for various stimulus durations (Ances et al., 2000b). For all stimuli, an initial burst of neuronal activity was observed immediately after stimulation. However, the neural activity, measured by the magnitude of the somatosensory evoked potentials, in particular the N1-P2 amplitude, decreased with increasing stimulus duration. These observations are consistent with the results seen in the current study, with the CBF and CMRO2 responses decreasing during protracted stimulation.
In the authors' experiments, protracted stimulation led to plateaus in CBF and CMRO2 responses. During this plateau phase, the magnitude of the CBF changes was significantly greater than that of the CMRO2 changes (P < 0.01, one-way analysis of variance). The ratio of the average percentage change in CBF from baseline to the average percentage change in CMRO2 from baseline during protracted stimulation was 2.93, well within the range of 2 to 5.8 previously observed using various techniques (Davis et al., 1998; Fox et al., 1988; Madsen et al., 1998; Seitz and Roland, 1992). These results suggesting that greater changes in CBF occur compared with CMRO2 are in agreement with the balloon model of Buxton and Frank (Buxton and Frank, 1997; Buxton et al., 1998). This model proposes that relatively large increases in CBF are required to support the small increases in CMRO2 resulting from a decrease in the oxygen extraction fraction with stimulation (Ogawa et al., 1993). The physiologic basis for the shift in the relation between CBF and CMRO2 changes remains unknown, but could be because of changes in the effective diffusivity of oxygen as proposed by Hyder et al. (1998).
At stimulus completion, differences also were observed between CBF and CMRO2. Whereas CBF returned to baseline, a significant poststimulus undershoot was observed in the calculated CMRO2. This poststimulus decrease may reflect an increase in adenosine triphosphate consumption (Hamer et al., 1978; Kintner et al., 1984). With protracted stimulation, the metabolic system could be maximally activated to meet the continued energy demands. At the end of stimulation, adenosine triphosphate consumption quickly decreases (Hamer et al., 1978), whereas a lag may occur in terminating CMRO2 activity. This lag could transiently generate an “abnormally high” energy state and lead to an undershoot in CMRO2.
In conclusion, a complex relation exists between the dynamic changes in CBF and CMRO2 during functional activation. The current results suggest a complex relation between the percentage changes in CBF and the percentage changes in CMRO2. Immediately after stimulation, the changes in CBF and CMRO2 are comparable, but with protracted stimulation the CBF changes are greater than the CMRO2 changes. The exact mechanisms for this switch remain unknown.
Footnotes
Acknowledgment:
The authors thank Anne Roc for her assistance with the figure.