
Abstract
The authors examined the steal phenomenon using a new mathematical model of cerebral blood flow and the cerebrospinal fluid circulation. In this model, the two hemispheres are connected through the circle of Willis by an anterior communicating artery (ACoA) of varying size. The right hemisphere has no cerebrovascular reactivity and the left is normally reactive. The authors studied the asymmetry of hemispheric blood flow in response to simulated changes in arterial blood pressure and carbon dioxide concentration. The hemispheric blood flow was dependent on the local regulatory capacity but not on the size of the ACoA. Flow through the ACoA and carotid artery was strongly dependent on the size of the communicating artery. A global interhemispheric “steal effect” was demonstrated to be unlikely to occur in subjects with nonstenosed carotid arteries. Vasoreactive effects on intracranial pressure had a major influence on the circulation in both hemispheres, provoking additional changes in blood flow on the nonregulating side. A method for the quantification of the crosscirculatory capacity has been proposed.
In focal head injury, a major therapeutic aim is the maintenance of cerebral blood flow (CBF) to the affected regions. This is not a straightforward problem because the distribution and maintenance of CBF depends on many factors. Potentially beneficial therapeutic maneuvers are poorly understood and can have undesirable consequences (Roberts et al., 1998). Intracerebral steal, a term popularized by Symon (Symon, 1968), refers to the paradoxical decrease of flow in the ischemic areas in response to vasodilator stimuli (Brawley et al., 1967; Hoedt et al., 1967). This behavior is attributed to shunting of blood flow away from nonautoregulating ischemic areas by the action of normally reactive vessels. The term “steal” has been suggested to be misleading because the underlying mechanism is rooted in a decrease in perfusion pressure (Wade and Hachinski, 1987). The concept of steal has been questioned and attributed to other sources such as a decrease in arterial pressure (Gogolak et al., 1985). Clinical studies have shown that the phenomenon has an ephemeral nature and can be documented only in a small proportion of patients and only in limited areas (Nariai et al., 1998; Olesen and Paulson, 1971). Furthermore, the demonstration of the effectiveness of the “inverse steal,” by attempting to increase the flow in ischemic areas by vasoconstriction on normally autoregulating brain regions, has not been straightforward in head-injured patients (Darby et al., 1988; Roberts et al., 1998).
Mathematical modeling can provide a valuable insight into this complex physiologic phenomenon (Cassot et al., 1995; Gao et al., 1997; Hudetz et al., 1982, 1993). Previous authors have concentrated on the vascular compartment neglecting the influence of the dynamics of the cerebrospinal fluid (CSF), which exerts pressure on the cerebral vasculature. In this article, the authors present an original model of bihemispheric CBF including compensatory mechanisms at all levels—anastomotic upstream compensation, autoregulation, and CSF pressure dynamics.
This model examines the potential effect of a large disparity between autoregulation in the cerebral hemispheres that can exist in clinical scenarios such as lateralized head injury, space occupying lesions, or stroke (Schmidt et al., 1999). The authors investigated the dependence of blood flow patterns on the extent of interhemispheric arterial communication. For the purpose of this study, the authors assumed normal carotid artery anatomy without stenosis. The aim was to determine the extent to which manipulations in arterial blood pressure and Paco2 produce large-scale steal effects.
MATERIALS AND METHODS
Model description
All simulations have been performed using dedicated software encapsulating a new model of bilateral CBF and circulation of CSF (Piechnik, 2000). The model has been created on the basis of the authors' earlier theoretical work on global CBF (Czosnyka et al., 1992, 1993, 1997). The diagrammatic representation of the model (Fig. 1) shows the simplified cerebrovascular anatomy for the left hemisphere and its electrical equivalent for the right hemisphere. The detailed electrical schematic is given in the Appendix with the mathematical description of its elements and the method for derivation of the results. The electric representation is a convenient basis on which mathematical equations are derived (Agarwal et al., 1969).
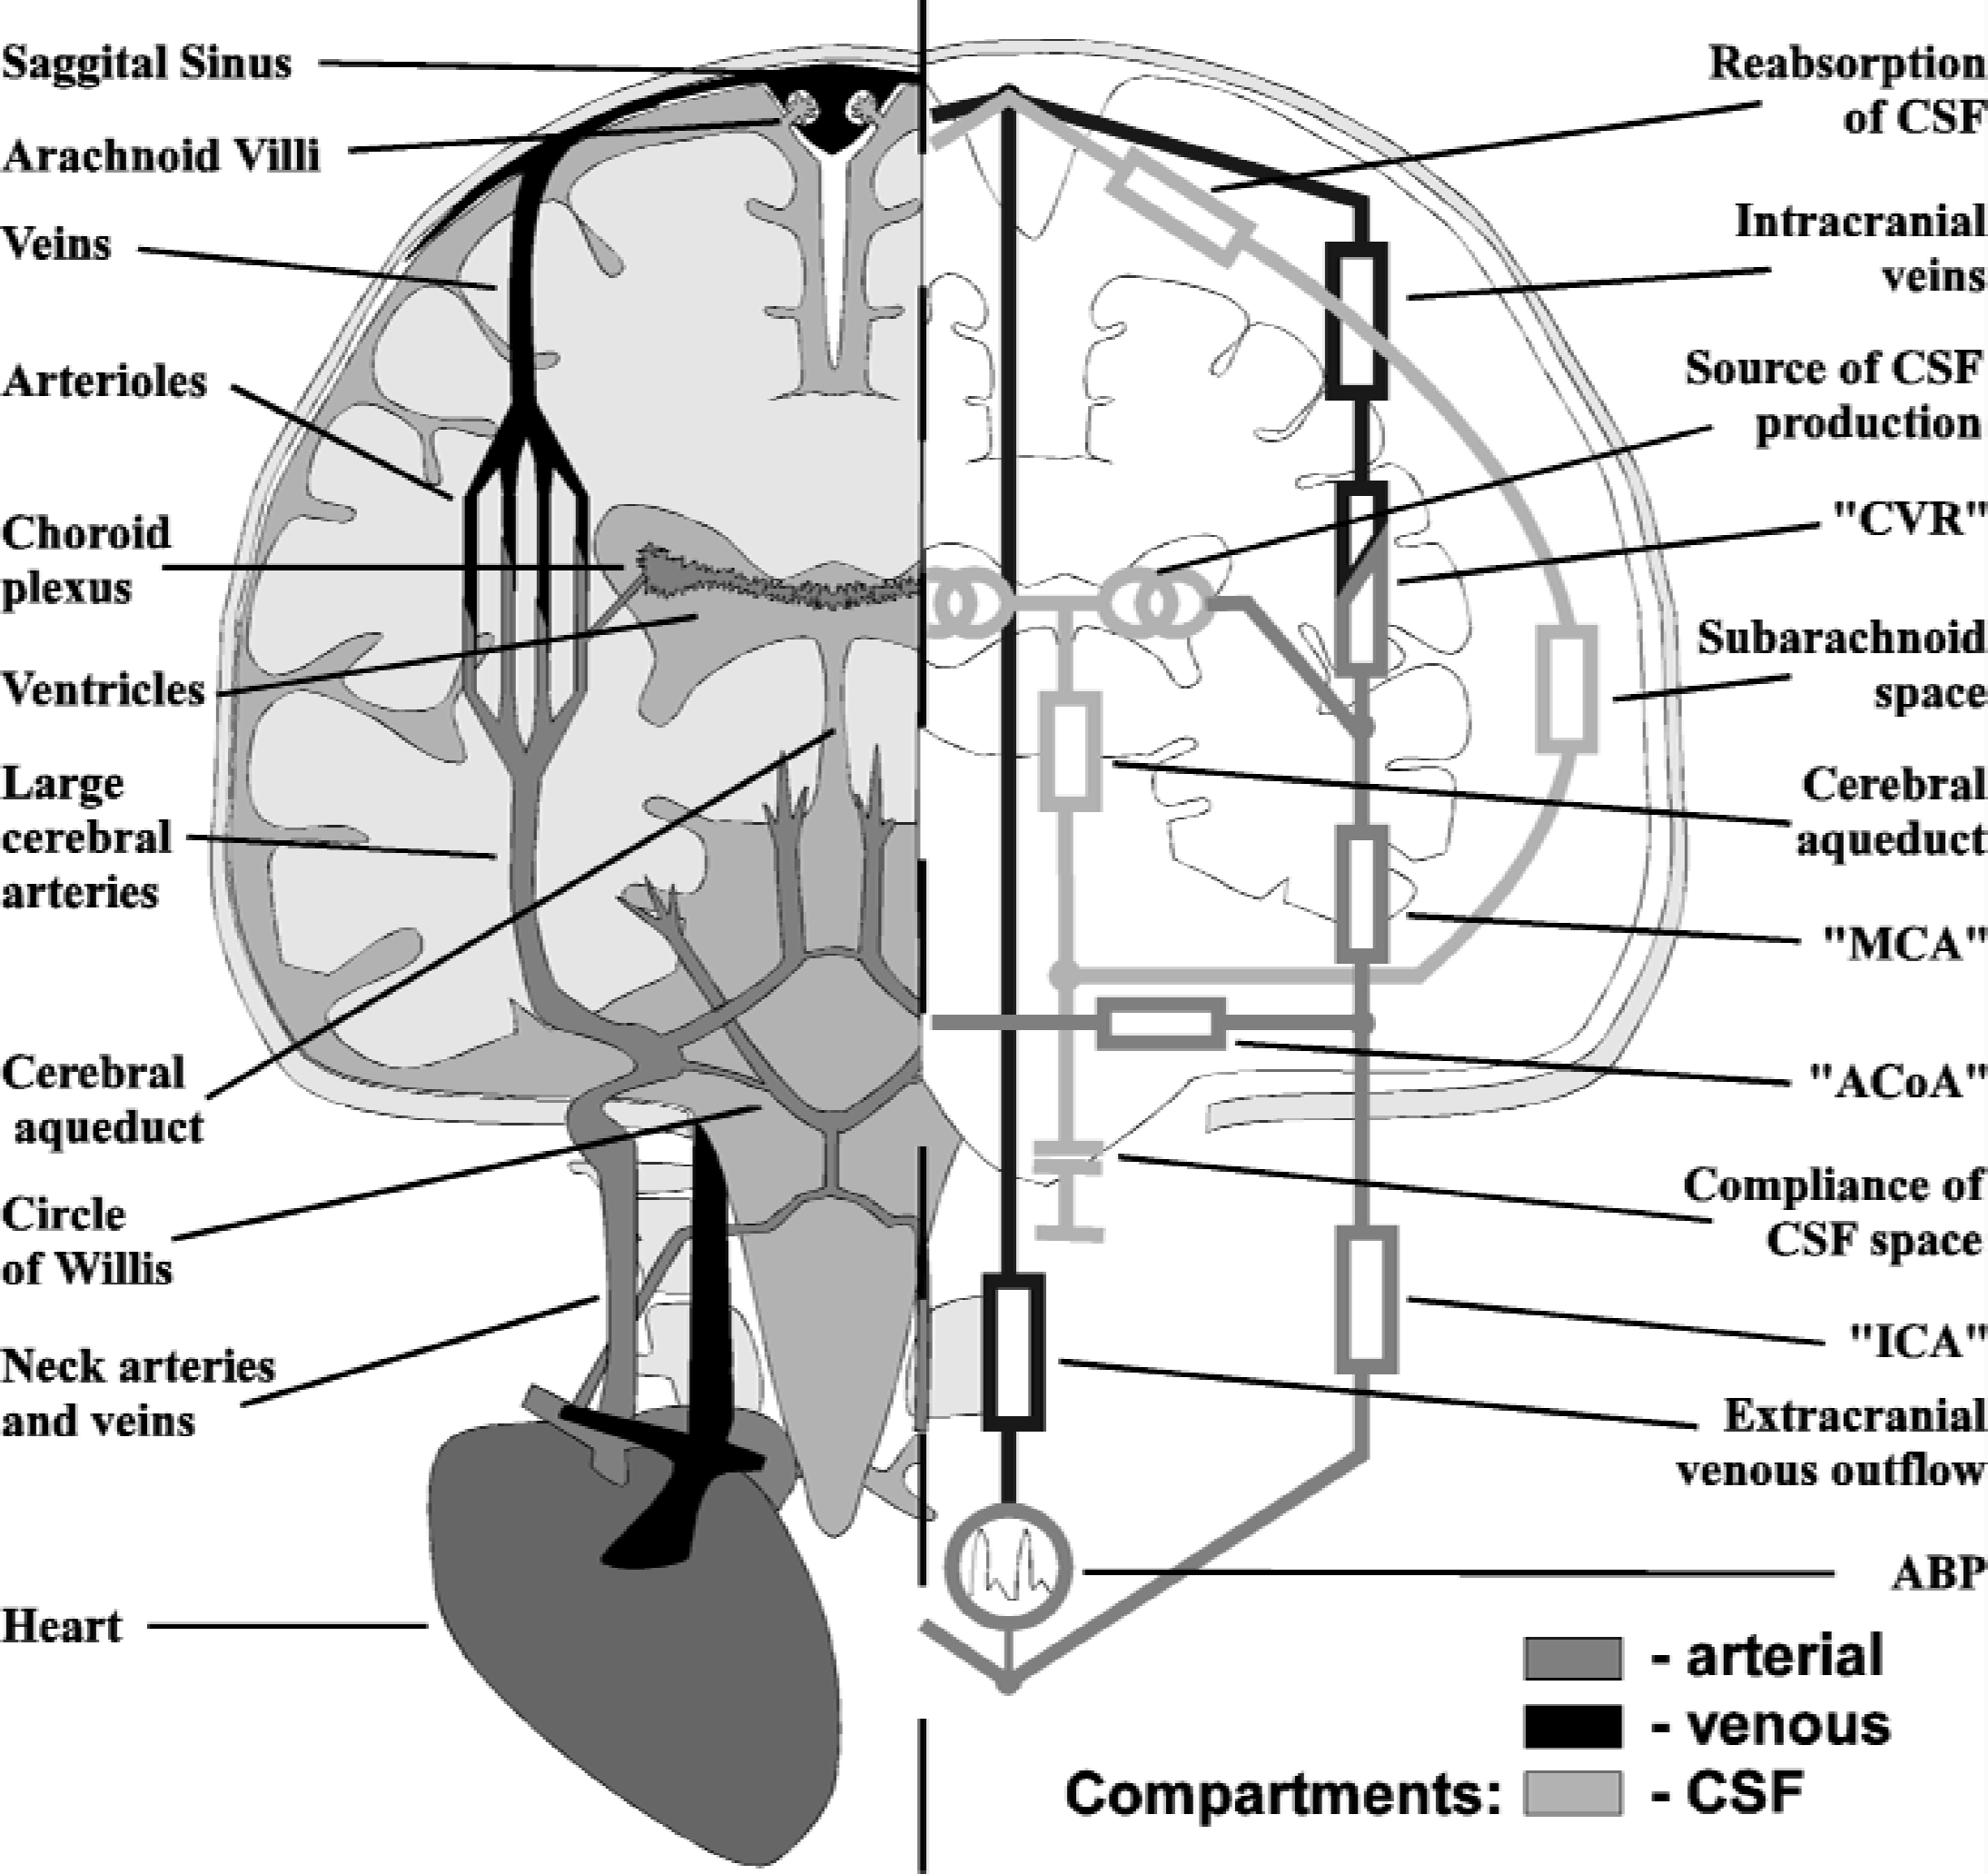
Schematic representation of the hydrodynamic structure of the model (left) and its electrical equivalent (right). The arterial, venous, and cerebrospinal fluid compartments are denoted by shading.
The input for the model is generated as an arterial blood pressure (ABP) pulse waveform that acts on two simulated, symmetrical neck arteries (internal carotid artery [ICA]) feeding into the circle of Willis. At the entrance to the cerebrospinal space, the arterial compartments of each hemisphere communicate through the anterior communicating artery (ACoA). This reflects the overall function of the anastomotic structure of the circle of Willis.
The large intracranial arteries downstream from the circle of Willis are represented as a single middle cerebral artery (MCA) on each side. The next element of the blood flow pathway reflects the largest vascular compartment of the model, simulating the whole regulating arterial and arteriolar network downstream from the distributing arteries. It also incorporates part of the draining venous system down to the level of the pial veins. The arterial part of the cerebrovascular system contains the myogenic and metabolic mechanisms responsible for cerebral autoregulation and these have been incorporated into the model. These mechanisms control the vascular diameter and hence determine the cerebrovascular resistance (CVR) constituted by this compartment. The regulating capacity was modeled differently for each hemisphere to simulate the cerebrovascular asymmetry (Fig. 2). The left hemisphere was assumed to be normally autoregulating, whereas the right was passive. The resistance values were selected to simulate symmetric, normal CBF for a cerebral perfusion pressure (CPP) of 90 mm Hg and Paco2 of 30 mm Hg.
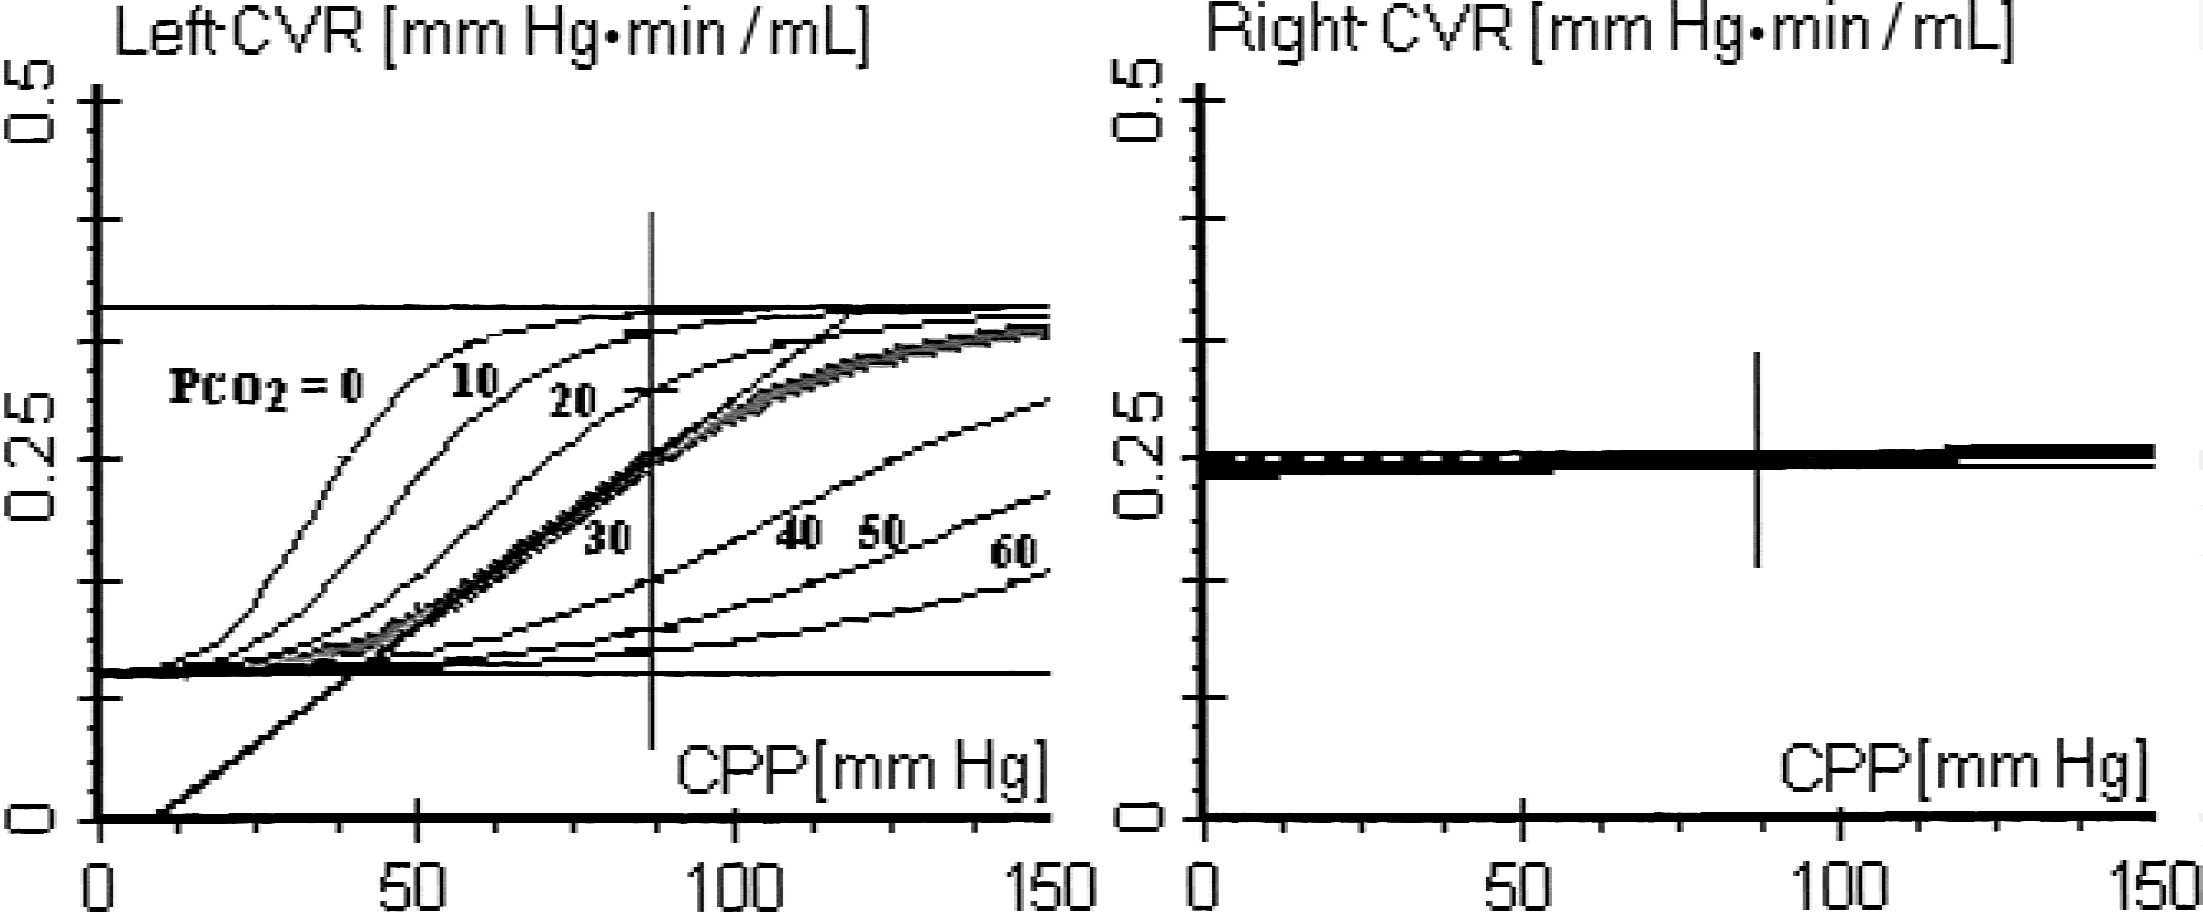
Cerebrovascular resistance (CVR) in the model as a function of cerebral perfusion pressure (CPP) and changing partial pressure of Paco2. The left side is autoregulating. The right side has a flat response corresponding to vascular paralysis.
Venous outflow from the brain has been divided into intra-and extracranial compartments. The intracranial venous outflow, symmetrical for each hemisphere, is modeled by taking into account the compression of the lacunae and bridging veins by the surrounding CSF. This mechanism assures that the difference between cerebral venous and intracranial pressures (ICP) is positive and nearly constant, as indicated by experimental studies (Johnston and Rowan, 1974; Nakagawa et al., 1974; Yada et al., 1973). At the exit from the cranium, the venous flow from the hemispheres joins at the venous sinuses. Finally, the extracranial venous return is represented by a single jugular vein.
In addition to cerebral blood circulation, the system for the production and reabsorption of CSF has also been represented in this model. From the ventricles, the CSF flows through the cerebral aqueduct to the cisterns, which are represented by the lumped compliance of the CSF space. The subsequent part of the circulation consists of CSF pathways that bifurcate towards the left and right subarachnoid spaces. They terminate at the arachnoid villi located in the dural sinuses, the site of CSF reabsorption into the blood circulation.
Experimental protocol
Two experiments were performed. Progressive systemic hypotension was obtained by programming a decrease in ABP, from hypertension to deep hypotension (120 mm Hg to 40 mm Hg, respectively) at a rate of change of 3 mm Hg/min. The second experiment consisted of a progressive CO2 challenge, changing Paco2 in steps of 5 mm Hg every 2.5 minutes from 10 to 85 mm Hg.
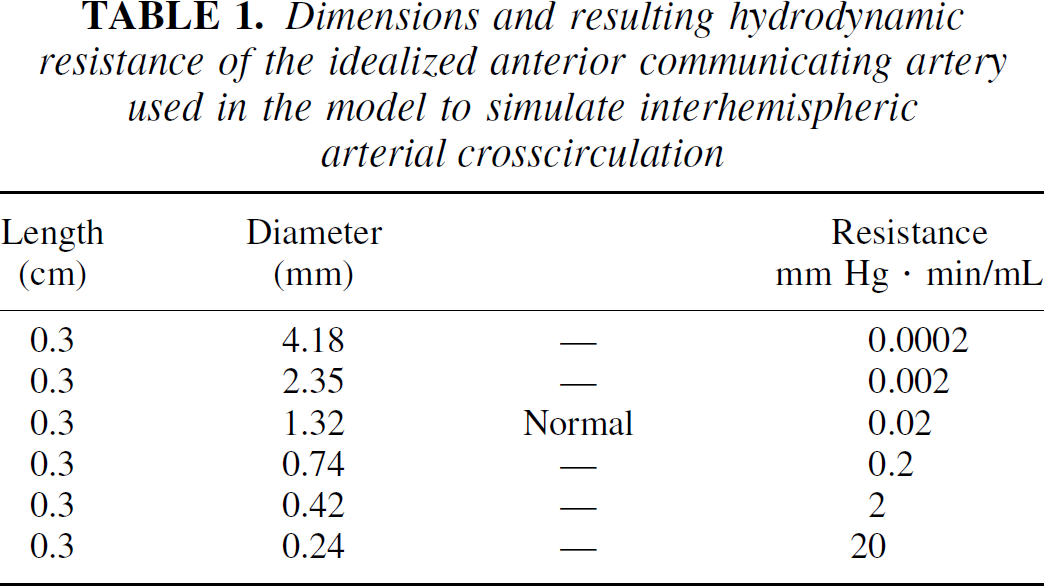
Both experiments were repeated for six different sizes of ACoA (Table 1). This corresponded to changing the resistance by an order of magnitude each time. A resistance of 0.02 mm Hg · min/mL corresponds to a normally sized ACoA. The lowest value of 0.0002, a decrease by 2 orders of magnitude, represents an extremely efficient crosscirculation. However, the largest resistance value of 20 corresponds to a practically absent ACoA.
Dimensions and resulting hydrodynamic resistance of the idealized anterior communicating artery used in the model to simulate interhemispheric arterial crosscirculation
The results of the simulation were averaged in 30-second epochs. For the CO2 challenge, only data from the final epoch was used when the response was stable.
RESULTS
Arterial blood pressure change
Blood flow in the large intracranial arteries (MCA) on the left side was regulated within the ABP limits, 70 to 110 mm Hg (Fig. 3A). The flow on the right side was pressure-passive for the whole range of ABP. The size of the ACoA had no effect on either left or right side MCA flow, as indicated by the closely overlapping results of the simulation (Fig. 3A). In contrast, flow in the neck arteries varied significantly depending on the resistance of ACoA (Fig. 3B). At the smallest ACoA diameter (Ø = 0.2 mm), the hemispheres were practically isolated from each other; the ICA flow closely resembled the MCA flow on the ipsilateral side. At larger ACoA diameters, the ICA flow converged towards the average flow of the left and right MCA. The equalization of ICA flow took place through the ACoA. Similarly, the flow through the ACoA was also significantly dependant on its size and on ABP (Fig. 4A). During hypotension the ACoA flow was diverted towards the regulating side. For larger than normal ACoA, the flow rates were up to 40 mL/min. The pressure difference at the level of the circle of Willis between the regulating and nonregulating side was minimal; at the level of MCA it never exceeded 1.2 mm Hg, even for the smallest ACoA size (Fig. 4B).
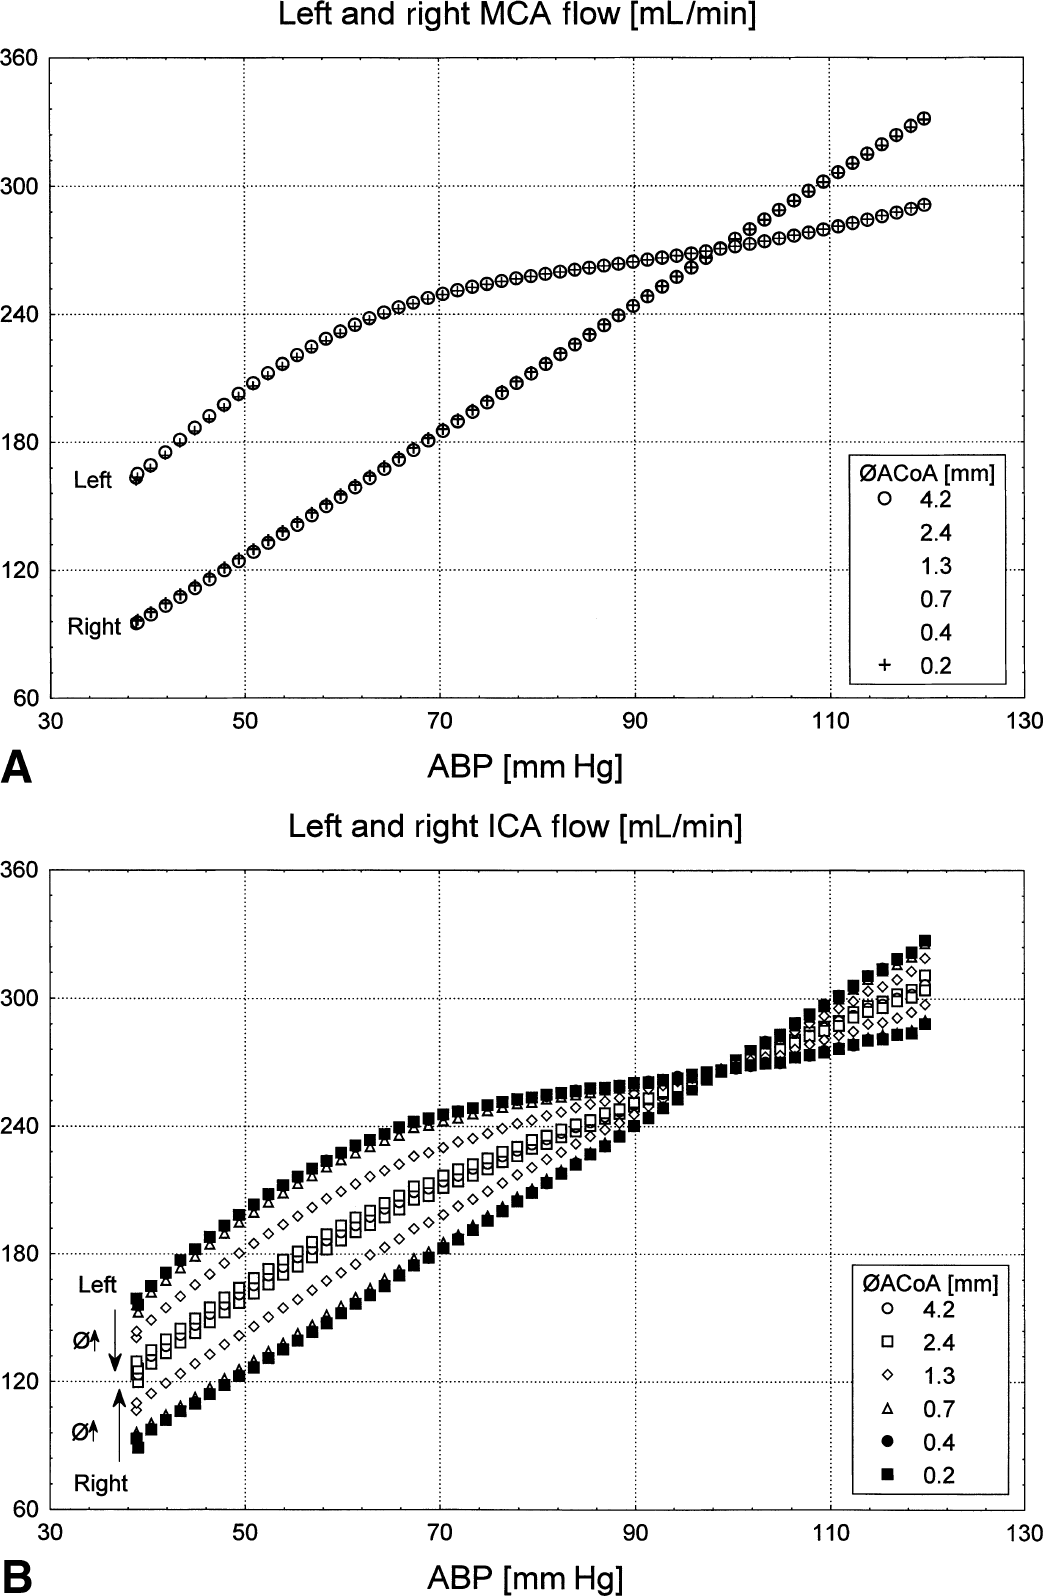
Effects of arterial blood pressure (ABP) changes on blood flow in
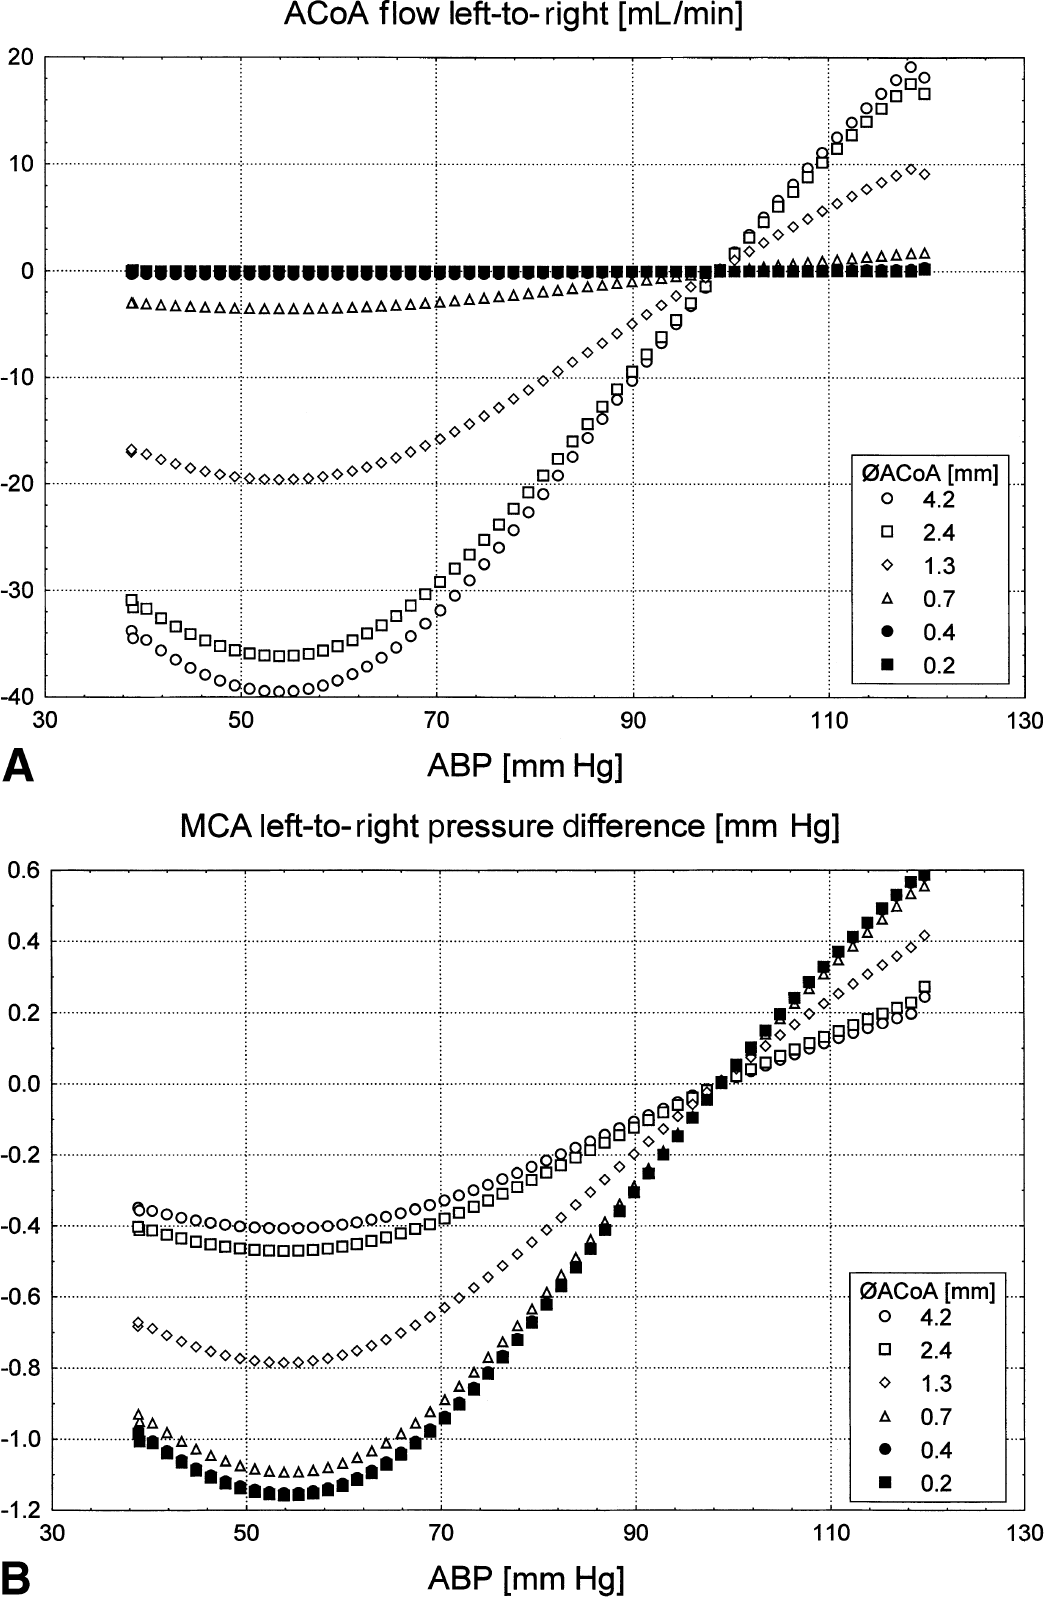
Side-to-side interaction during blood pressure changes.
Paco2 change
At the level of the MCA, the left side responded physiologically to increases in Paco2, with an initial exponential increase in the flow and saturation at greater Paco2 values (Fig. 5A). The right side was unresponsive, in fact the flow decreased slightly with increasing Paco2. The size of the ACoA only minimally influenced flow in MCA. The larger the ACoA size, the greater the CO2 response of MCA blood flow on the regulating side (up to 7 mL/min difference). There was a corresponding, but smaller, decrease in flow on the nonregulating right side (up to 4 mL/min).
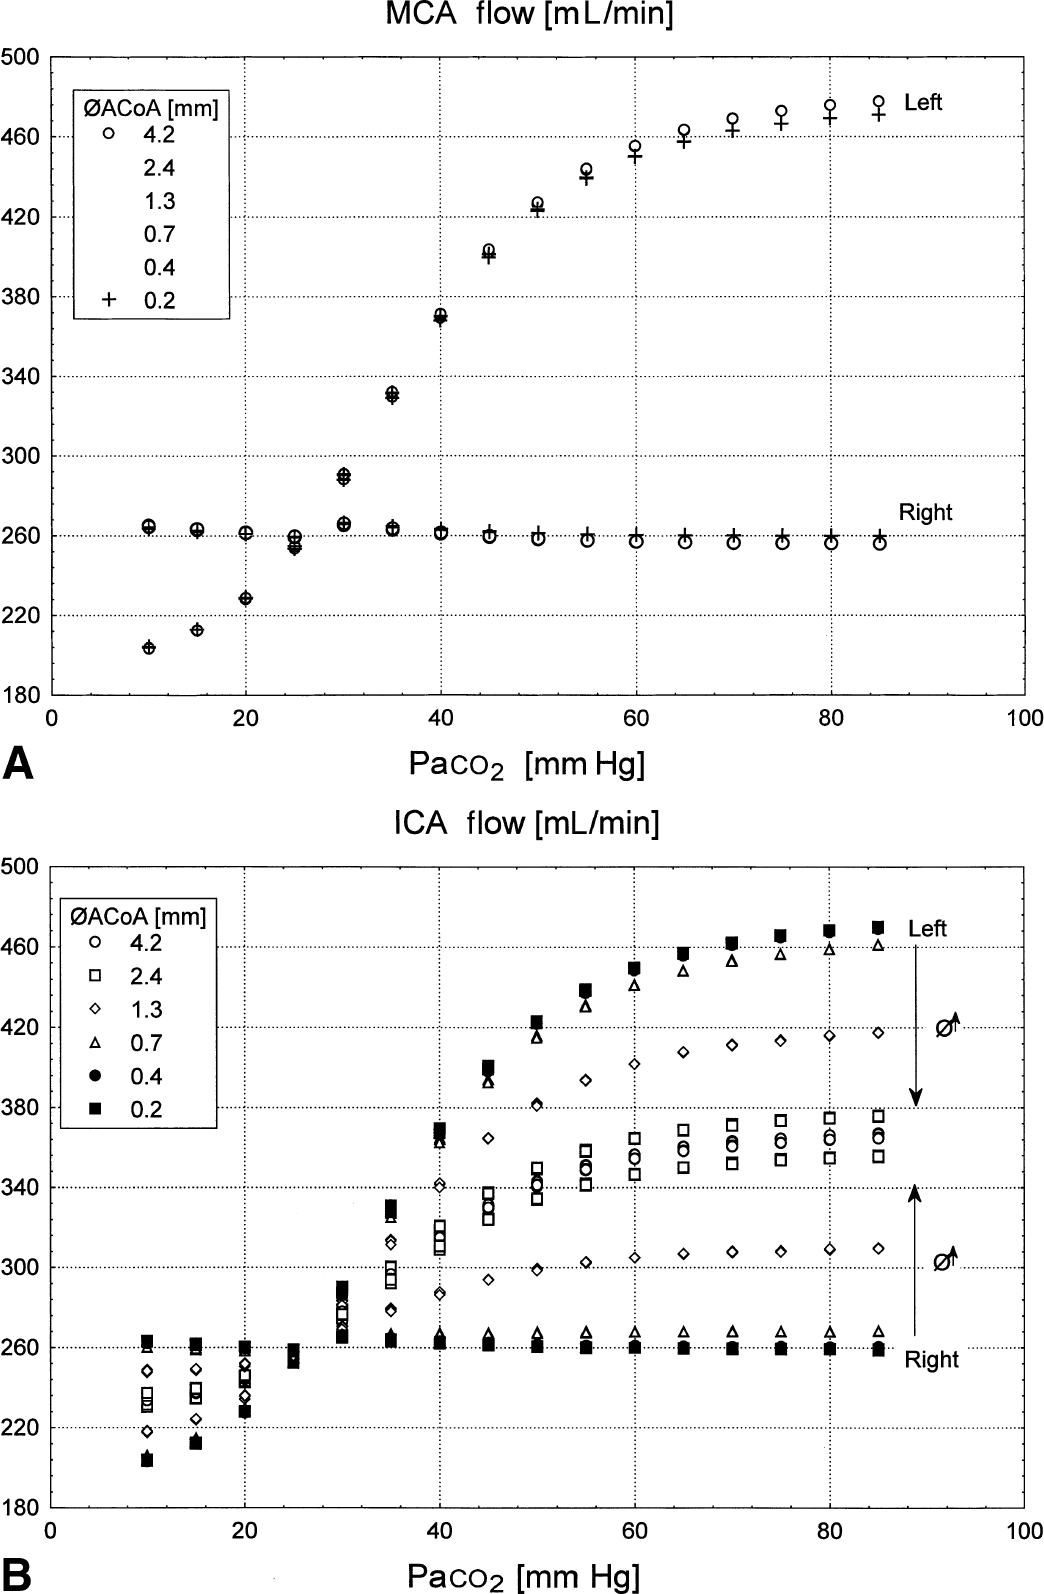
Response of the flow on the left and right side to a CO2 challenge.
When the communication between the sides was poor, the ICA flow was different between the left and right (Fig. 5B). On each side ICA resembled the ipsilateral MCA flow (Fig. 5B and 5A, respectively). However, when the size of the ACoA increased, ICA flow on left and right almost equalized, converging towards the average of the downstream flow on both sides. This equalization of ICA flow was provided by the ACoA. The ACoA flow was directed towards the regulating hemisphere and away from the nonregulating side when Paco2 was increased. The ACoA flow increased with the size of ACoA and with Paco2, and its absolute values were up to 120 mL/min.
Effect of CO2 and arterial blood pressure on intracranial pressures
There was no dependence of ICP on ACoA size (Fig. 6A). However, there was a proportional change in ICP in response to the change in ABP. Over the whole range of ABP, the change in ICP influenced local cerebral perfusion pressure considerably more than any change in the upstream MCA pressure because of varying ACoA diameter (approximately 7 mm Hg compared with approximately 1 mm Hg, respectively). Also, CO2 had a significant effect on ICP (Fig. 6B). The Paco2-induced vasodilatation increased ICP by increasing intracranial blood volume. This response was more pronounced for lower Paco2 levels and diminished when Paco2 increased over 50 mm Hg. The overall ICP change was approximately 4 mm Hg over the whole range of Paco2 (10 to 80 mm Hg).
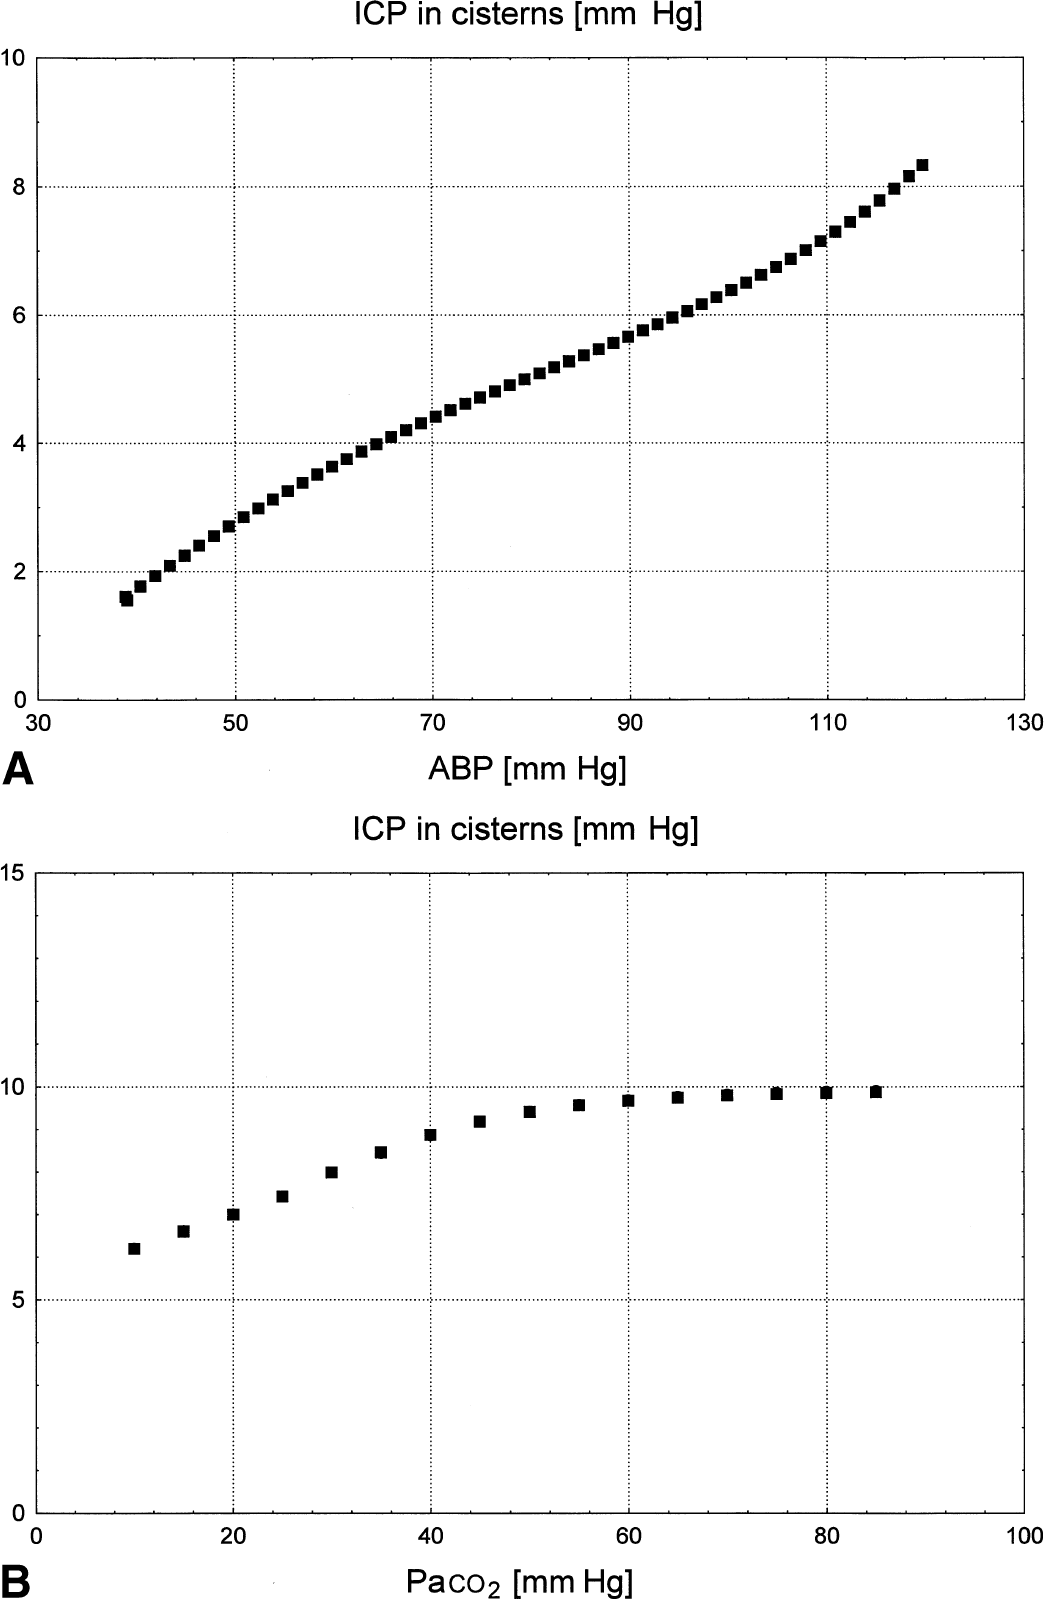
Plots of intracranial pressures (ICP) versus changes in
DISCUSSION
Clinical application of the model
The model assumes complete unilateral vasoparalysis with preserved autoregulation in the contralateral hemisphere. Although this may not be completely representative of the situation in the majority of head trauma cases, it does provide a convenient platform to observe the exaggerated effect of two large brain regions competing for blood delivery. Arterial stenosis is not modeled and this reflects the number of young subjects that contribute to the head trauma patient group. The aim of the model was to simulate a range of clinical conditions that might result in abolition of autoregulation in one hemisphere. These include volume-occupying lesions (hematomas or tumors), brain edema, or vasospasm resulting from subarachnoid hemorrhage. These conditions are likely to increase the vascular resistance in one segment of the cerebral circulation and cause vasodilatation in the regulating arteries. In the worst case, if the vasodilatory capacity was completely exhausted, the overall result would be pressure-passive as indicated by the unchanging CVR on the right side (Fig. 2).
Influence of the circle of Willis on the steal effect
The blood flow steal effect is produced through changes in the upstream perfusion pressure (Fig. 7). The vasodilatory stimulus creates additional demand on flow in the autoregulating brain, whereas the non-regulated areas remain passive. Because they share a common arterial supply, characterized by its proximal resistance, the additional demand decreases perfusion pressure upstream. Although this has no effect on the autoregulating side, which can respond with further vasodilatation, a pressure-passive flow decrease will develop on the nonautoregulating side—this is the so-called steal phenomenon (Wade and Hachinski, 1987). In the authors' model, perfusion pressure decreases faster in the reactive left hemisphere during hypotension-induced vasodilatation, resulting in an increased left-to-right pressure difference (Fig. 4B). The ACoA is a potential channel for the steal and at larger diameters greater transmission of this pressure drop will result. As a consequence, a greater reduction in flow will occur on the pressure-passive side (Figs. 3A and 5A). However, the authors found that under the assumptions of this model, the influence of the circle of Willis on downstream flow is minimal. The authors have shown that it is only the distribution of flow in the neck arteries that is influenced by the size of the ACoA and not downstream flow in the MCA (Figs. 3 and 5). The ACoA only acts to equalize flow between the arteries of the neck without affecting downstream flow.
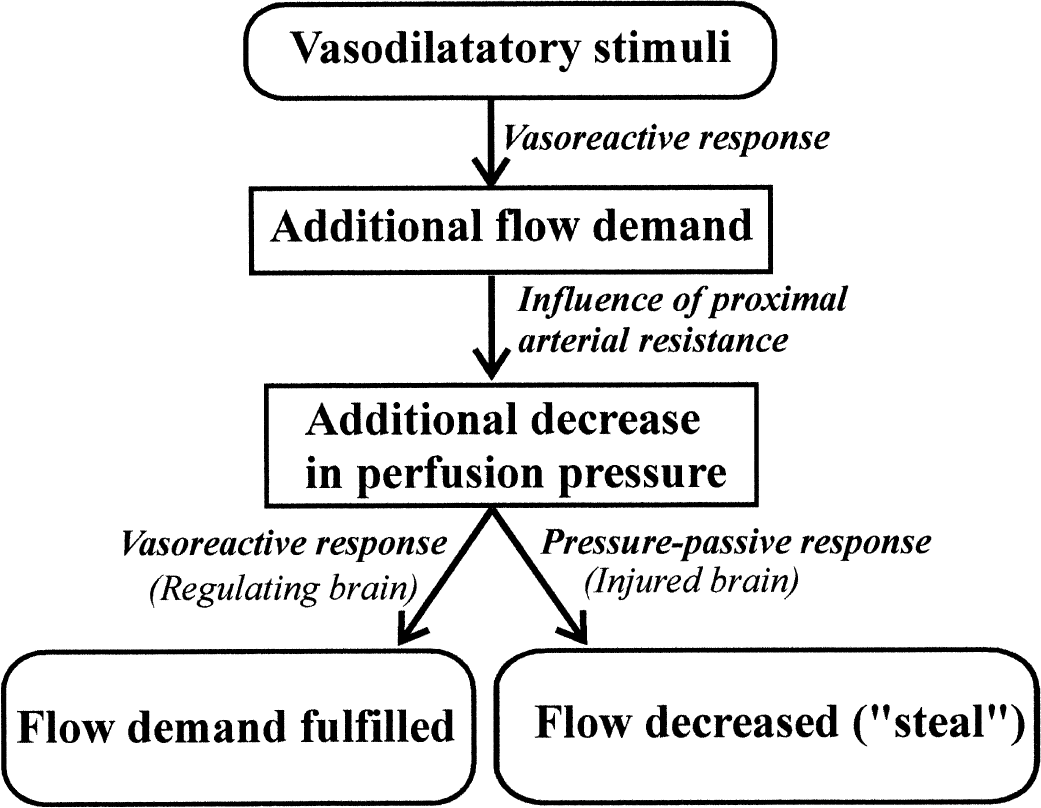
The steal effect results from additional flow demand created by the reactive part of the brain.
There was greater evidence of steal during hypercapnia than in hypotension, as indicated by the greater sensitivity of flow to the size of the ACoA. This may be attributed to the much larger flow changes produced by the CO2 challenge on the regulating side. However, despite this difference, the effect was still only visible as a small dissociation of the data points (compare Figs. 3A and 5A).
The normal arteries of the neck have minimal resistance compared with the downstream system. The unequal distribution of vascular resistances in patients with normal, nonstenosed, large arteries may explain the absence of studies demonstrating a steal effect in this patient group. Literature reports of the steal phenomenon are mainly limited to those patients with more severe cerebrovascular pathology, for example, carotid artery stenosis associated with transient ischemic attacks and moyamoya disease (Nariai et al., 1998; Olesen and Paulson, 1971). Furthermore, only rare examples of steal have been observed in animal models (Dettmers et al., 1993). It appears that a combination of adverse factors is required to propagate the “steal” effect. The results from this study suggest that the “steal” lacks a significant impact on side-to-side differences in the patient group without carotid artery stenosis, for example, in young subjects. Similarly, in the same patient group, the gains from hyperventilation therapy are unlikely to have a major effect through “inverse steal,” whereas it may have a potentially detrimental effect on the rest of the brain (Darby et al., 1988; Geraci and Geraci, 1996; Menon et al., 1999; Moore and Flood, 1993).
“Downstream” source of steal effect
The inclusion of CSF dynamics in the authors' model provided a much greater understanding of the effects of cerebrovascular maneuvers on the downstream side of the cerebral circulation. Both hypercapnia and arterial hypotension influenced the ICP. Despite both maneuvers being vasodilatory in nature, their effect was opposite. During gradual arterial hypotension, ICP steadily decreased, contrary to what is observed in the normal autoregulating brain. This presumably occurred because the volume-reducing effect of decreased arterial filling pressure exceeded the opposing effect of the volume-increasing vasodilatation on the regulated side. This effect is most likely propagated through the entire brain because of the connectivity of the CSF space. This had a compensatory effect on the unregulated side by effectively reducing the ABP-induced drop in CPP. Increase in CO2 increased ICP, which resulted in an additional flow reduction on the passive side. However, this slight flow reduction is not a steal effect because it occurred even for the smallest ACoA size (Fig. 5A). This may explain the wide variation of flow reactivity with a steal effect after the administration of papaverine in patients with intracranial tumors (Olesen and Paulson, 1971). In such cases, the dynamics of CSF would initially be challenged resulting in decreased volume compensation and an even greater increase in ICP and decrease in CPP. Under such circumstances, the loss of autoregulation in maximally dilated foci would result in a flow decrease. At the same time, the preserved side, although already challenged by vasodilator, still would be within the regulatory limits to compensate for the same CPP change on the basis of myogenic mechanism of autoregulation. In neurosurgical care after head injury, such a situation could be detected using standard ICP monitoring and treated within standard CPP-directed therapy (Paulson et al., 1972; Rosner et al., 1995).
Noninvasive detection of collateral flow capacity
In the current study, the authors found that with normal neck arteries, collateral flow through the ACoA compensates upstream (ICA) flow rather than downstream (MCA). It is possible that detecting differences in MCA flow reactivity may enable us to determine the efficiency of collateral flow at the level of the circle of Willis. This detection is based on comparing the afferent (ICA) and efferent (MCA) branch reactivity in both hemispheres. If downstream asymmetry is reproduced upstream, then it can be concluded that collateral flow is poor. When the ICA reactivity is similar on both sides and close to the average MCA reactivity, there must be a good anastomotic connection between the sides. This may be expressed as a side-to-side index of relative asymmetry (RAI). For example, it may be defined as:
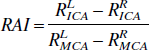
where Rsidevessel describes the reactivity of blood flow to a vascular challenge. The RAI value is independent of the vascular challenge used because the reactivity indexes cancel out. However, although the RAI values were similar between the indexes, the authors found a greater variation with the hypercapnic challenge when compared with hypotension (Fig. 8). One explanation for this is that at high Paco2 levels, CO2 reactivity approached zero in both hemispheres (Fig. 5A and 5B) so that the difference in reactivity between the hemispheres becomes too small to estimate ACoA size. The model does not enable one to study the influence of the posterior anastomoses and the vertebrobasilar arterial system on blood flow in the cerebral hemispheres. Nevertheless, the clinical interest is more concerned with the anterior circulation carrying majority of cerebral blood flow, which can be studied in this aspect using commercially available 4-channel transcranial Doppler monitors and specialized probe holders (Makinaga et al., 1992).
Relative asymmetry index calculated using either arterial blood pressure or Paco2 flow reactivity correlates with the size of the anterior communicating artery (ACoA).
Conclusion
Blood flow through the brain depends on pressure changes both upstream and downstream from the lesion area. For most neurotrauma patients, with normal, nonstenosed arteries of the neck, the influence of the upstream pressure changes because of “steal” was predicted as not essential for downstream flow when large brain areas are in question. The downstream pressure changes because of CSF dynamics were shown to possess the same ability to modulate the blood flow and this ability may increase further in head trauma patients. Close monitoring of ICP and CPP in response to vasoreactive maneuvers is the most straightforward way to resolve this problem.
Finally, the authors propose a noninvasive method for testing of the efficiency of the collateral circulation that is based on the observation of both the afferent (ICA) and efferent (MCA) flow from the circle of Willis.
Footnotes
APPENDIX
The detailed electric schematic is shown in Fig. 9. As shown on the simulated ICA, the compartments through which cerebral blood flow passes are represented as serial connections of two resistances that constitute the total compartmental resistance to flow. The lumped compliance of the vessel is connected to the middle of the vessel.
Table 2 lists the values of the static elements of the model. The resistance value of the ICA calculated by assuming the resting diameter of the ICA = 3 mm, the vessel length (18 cm) to represent the entire length from the aorta to the circle of Willis. The resistance was recalculated for the transmural pressure of 100 mm Hg, taking into account the elastic stretch of the vascular wall. This was achieved by assuming an exponential pressure-area relation (Drzewiecki et al., 1997; Drzewiecki and Pilla, 1998). The resulting resistance value was calculated from the Hagen-Poiseuille's formula assuming a blood viscosity of 0.4 poise and by doubling the result to account for significant losses of energy because of secondary flow effects in the neck arteries (Cherif et al., 1999; Slawomirski et al., 1999). Compliance was calculated as the pressure derivative of volume change resulting from the stretch of vascular wall.
The intracranial large arteries of each hemisphere are represented by a single MCA. The selection of length and diameter of the equivalent artery is difficult because it needs to represent a bifurcating network of arteries. The authors assumed a resistance of 0.01, which corresponds to a vessel 8-cm long and 2-mm resting diameter (Hillen et al., 1986). Compliance was increased four-fold greater than the value obtained from the single tube model (from 0.0024 to 0.01 mL/mm Hg). This reflects the greater volume capacity of the branching tree of vessels compared with the single tube. The values of the remaining linear elements describing the blood flow pathway—Rana, Rvo, and Cvo—were assumed arbitrarily.
The regulating arterial and arteriolar network downstream from distributing arteries is represented by nonlinear CVRl and CVRr. These elements incorporate part of the venous system of each hemisphere, up to the level of the pial veins. The mathematical description of the myogenic mechanism has been adapted with changes from Hoffmann (1985, 1987), which has been thoroughly tested in the authors' previous work (Czosnyka et al., 1992, 1993, 1997). In the model, the following effective formula was used:
In the formula above, CVR represents cerebrovascular resistance; CPPm represents the time averaged value of cerebral perfusion pressure, (the filter time constant was 6 seconds); CVRmax represents maximal CVR for upper autoregulation limit (= 0.35(left)/0.25(right) mm Hg · min/mL); CVRmin represents minimal CVR for lower autoregulation limit (= 0.1(left)/0.24(right) mm Hg · min/mL); CPPN represents constant (120 mm Hg) equal to 1.5 · (CPPmax – CPPmin); CPPmax, CPPmin represents asymptotic upper (120 mm Hg) and lower (40 mm Hg) pressure limits of autoregulation; CPPoffset represents constant offset enabling horizontal repositioning of CVR-CPP curve equal to CPPN − 0.5 · (CPPmax – CPPmin).
The metabolic mechanism was set to modify the CPPmax, CPPmin in such a way that the exponential flow response could be obtained (Aaslid et al., 1989; Czosnyka et al., 1993). The compliance of the cerebrovascular compartment was assumed to change inversely with CVR (Czosnyka et al., 1997). This reflects the fact that the downstream compliance is a function of the active vascular tone rather than a purely mechanical effect.
The scaling coefficient CAmax was 0.1 and 0.05 mL/mm Hg on the left and right side, respectively, so that the compliance of the cerebrovascular compartments was approximately 0.04 mL/mm Hg on both sides at 90 mm Hg of CPP.
Venous outflow from the brain has been modeled taking into account the compression of the lacunae and bridging veins. There are two basic models of collapsible venous outflow: the pressure follower (Hoffmann, 1985, 1987) and the Starling resistor (Ursino, 1990). In the current model, the authors used the formula more closely represented by the pressure follower model by making the conductivity of venous outflow progressively larger when the venous transmural pressure increased. The venous conductivity was calculated depending on the intracranial and venous pressure values.
In the formula above, Gv represents venous conductance, reciprocal of Rv; Rv represents venous resistance to flow; Pv represents venous pressure at the “middle” point of venous compartment, where the lumped venous compliance is connected; ICPs represents intracranial pressure at subarachnoid space surrounding the veins; Gv0 represents scaling coefficient (100 mL/min · mm Hg).
The CSF system consists of elements responsible for the production, movement, and reabsorption of CSF. The production is lumped in the ventricles. Two sources of production have been designed to reproduce both active energy-consuming excretion of CSF in the choroid plexus and passive bulk filtration of CSF from the parenchyma. However, the proportion between the two is still disputed (McComb, 1983). In the model, the latter mechanism was canceled by assuming conductances Gfl = Gfr = 0, it is the resistance being infinite. The active production was assumed to equal 0.17 mL/min on each side (0.34 mL/min total) and this is in agreement with literature values (Cutler et al., 1968; Ekstedt, 1977; Shapiro et al., 1980). The communication between the ventricles, cisterns, and the sagittal sinus is characterized by de facto arbitrary resistance values. The final resistances Rrl = Rrr = 14 mm Hg · min/mL represent the resistance of the arachnoid villi located on the dural sinuses, the final place of reabsorption of CSF into blood stream. In general, CSF reabsorption ceases at ICP values less than venous pressure measured at the sagittal sinus. This has been incorporated in the model by increasing reabsorption resistance to infinity for negative ICP. Despite defining an arbitrary distribution of the resistance along CSF pathway, the authors kept normal values of the overall resistance to flow of CSF. From the point of its origin in the ventricles to reabsorption at the arachnoid villi, this resistance corresponds to the well-accepted clinical average of 9 mm Hg · min/mL (Cutler et al., 1968; Ekstedt, 1977).
In the model, the authors used a lumped element Ci representing the overall compliance of CSF space.
where ICPi represents ICP in cisterns. Ci0 represents constant (= 5mL), inverse of elastance E. PZ represents optimal pressure (= 5 mm Hg). P0 represents equilibrium pressure (= 0 mm Hg).
Based on standard methods for numerical analysis of electronic circuits (Chua, 1975; Press et al., 1992), the model has been implemented in the form of 10 state equations using the values of the static parameters. The nonlinear elements were evaluated using the solution from the previous simulation step or a starting point obtained by the Newton-Ralphson iteration procedure. The state equations were formulated for each branch containing compliance as shown in the electrical schematic of the model (Fig. 9). Additional equations were used to derive pressures and flows at different elements of the model. The solution of the state equations in the time domain was performed using the 4th order Runge-Kutta method. Automatic step adjustment was used to keep step-to-step accuracy less than 0.001%. The analysis was performed using specialized software written in C++ (Borland C++Builder v.3.0 Professional, Borland International, Scotts Valley, CA, U.S.A.) running on a PC computer.