
Abstract
To determine the distribution of cerebral glucose and lactate between the intracellular and the extracellular space of the rat brain in vivo, the diffusion characteristic of glucose and lactate was compared with that of metabolites known to be mainly intracellular (N-acetylaspartate, choline, creatine, glutamate, myo-inositol, and taurine) using a pulsed-field-gradient 1H nuclear magnetic resonance technique. The detection of a glucose signal at large diffusion weighting provided direct experimental evidence of intracellular glucose in the rat brain. At large diffusion weighting, the apparent diffusion coefficient (ADC) of glucose and lactate was similar to that of the intracellular metabolites such as N-acetylaspartate, creatine, and glutamate. At small diffusion weighting, the ADC of glucose and lactate was increased, which was explained by a decreased relative contribution of intracellular glucose to the total signal. The calculated extracellular volume fraction of glucose (0.19 ± 0.05) and lactate (0.17 ± 0.06) was consistent with a substantial fraction of glucose and lactate signals being intracellular. The findings were direct in vivo evidence that the largest concentration gradient of glucose is at the blood-brain barrier and that glucose is evenly distributed in the brain in vivo between the intracellular and extracellular space.
It is generally assumed that the distribution volume of glucose (Glc) in the brain is similar to that of water (Lund-Andersen, 1979; Gjedde, 1992), demonstrated by biochemical extraction studies and indirect kinetic evidence (Gjedde and Diemer, 1983; Holden et al., 1991; Gruetter et al., 1996), and that Glc phosphorylation is rate-limiting for metabolism (Furler et al., 1991). Recent noninvasive studies suggest that Glc from blood initially enters a substantial compartment fast (Knudsen et al., 1990; Hasselbalch et al., 1996) and that the brain Glc concentration is a linear function of the Glc concentration in the blood (Gruetter et al., 1998a). These studies are consistent with a significant fraction of Glc being in the extracellular space. Changes in extracellular Glc concentration were measured with microelectrodes or microdialysis (Silver and Erecinska, 1994; Forsyth, 1996; Lowry et al., 1998). The direct assessment of intracellular Glc was reported for cell cultures (Foley et al., 1980; Teusink et al., 1998). Because of its fast turnover, the design of studies to separate Glc from different compartments in the brain (e.g., glia-neuron or intracellular-extracellular) is difficult, and autoradiography and biochemical methods have been used, which require postmortem analysis (Gjedde, 1992). Most noninvasive in vivo studies assess whole-tissue properties, for example, the determination of the brain Glc concentration, by nuclear magnetic resonance (NMR) spectroscopy (Gruetter et al., 1992; Gruetter et al., 1999 and references therein).
With diffusion-weighted 1H NMR spectroscopy, the intracellular signal has been previously separated from the extracellular signal because the apparent diffusion coefficient (ADC, Dapp) in the intracellular compartment is one order of magnitude lower at large diffusion weighting (van Zijl et al., 1991). Water and cerebral metabolites experience restrictions in their self-diffusion by membranes (van Zijl et al., 1994; Pfeuffer et al., 1998a), as demonstrated by NMR measurements at large diffusion weighting and varied diffusion times in immobilized cells and the rat brain (Assaf and Cohen, 1998; Pfeuffer et al., 1998d). Intracellular molecules show a restricted diffusion characteristic limiting the mean displacement of diffusing molecules at larger diffusion times. In the extracellular space, a hindered diffusion characteristic has been derived, the diffusion paths around the cells being longer compared with free diffusion (Nicholson and Phillips, 1981; Rusakov and Kullmann, 1998).
Substantial improvements in sensitivity and spectral resolution of localized 1H NMR spectroscopy at high magnetic fields were demonstrated recently (Gruetter et al., 1998b), resulting in a neurochemical profile of up to 18 metabolites that can be determined simultaneously in vivo(Pfeuffer et al., 1999b). This study determines the diffusion characteristic of multiple cerebral metabolites in vivo, combining large diffusion weighting and the high-resolution 1H NMR methods. With these techniques, the hypothesis was tested as to whether Glc and lactate (Lac) are distributed evenly between the extracellular and intracellular space. The relative extracellular volume fraction of Glc and Lac was determined on the basis of a comparison of the diffusion characteristic with that of metabolites known to be mainly intracellular. The study provides a direct experimental evidence for the quantitative, noninvasive, and localized in vivo detection of intracellular Glc in the rat brain.
MATERIALS AND METHODS
Animal preparation
Experiments were performed according to procedures approved by the Institutional Review Board's animal care and use committee. Male Sprague-Dawley rats (230 to 300 g, n = 20) were anesthetized by a gas mixture (O2:N2O = 3:2) with 2% isofluorane. The rats were ventilated at physiologic conditions by a pressure-controlled respirator (Kent Scientific Corp., Litchfield, CT, U.S.A.). The oxygen saturation was maintained above 95% and was continuously monitored by a pulse oximeter with its infrared sensor attached to the tail (Nonin Medical, Inc., Minneapolis, MN, U.S.A.). The body temperature was maintained at 37°C by warm water circulation and verified by a rectal thermosensor (Cole Parmer, Vernon Hills, IL, U.S.A.). Femoral arterial and venous lines were used for regular blood gas analysis (PaO2 ≈ 140 to 160 mm Hg, PaCO2 ≈ 35 to 40 mm Hg, pH ≈ 7.3 to 7.4) and intravenous infusion of Glc, respectively. Hyperglycemia was achieved by infusing Glc intravenously at 16 mg/min administered according to a previously described protocol (Patlak and Pettigrew, 1976).
1H NMR spectroscopy
All experiments were performed on a Varian INOVA spectrometer (Varian, Palo Alto, CA, U.S.A.) interfaced to a 9.4-tesla magnet with 31-cm horizontal bore size (Magnex Scientific, Abingdon, UK). The actively shielded gradient coil (11-cm inner diameter) was capable of switching 300 mT/m field gradients in 500 microseconds (Magnex Scientific, Abingdon, UK). Eddy current effects were minimized using methods and procedures described elsewhere (Terpstra et al., 1998). For radiofrequency transmission and reception at 400 MHz, a quadrature surface coil was used consisting of two geometrically decoupled turns with 14-mm diameter, constructed according to a previously described design (Adriany and Gruetter, 1997). The localization method was based on a STEAM sequence (STimulated Echo Acquisition Mode) using asymmetric pulses as described previously (Tkáč et al., 1999). The voxel was positioned on the midline 2 mm posterior and 3 mm ventral to the bregma. The line width of the singlet 1H metabolite resonances was 8 to 12 Hz (0.02 to 0.03 ppm) in vivo.
Diffusion weighting
As described previously (Callaghan, 1991), unipolar gradients for diffusion weighting of the 1H NMR signals of water and metabolites were placed during the τ delay in the STEAM sequence 90°-τ-90°-TM-90°-τ. The strength of the 1H diffusion attenuation was characterized by the parameter b, which subsumed the diffusion time tD = Δ − δ/3, as well as the gradient strength G, duration δ, and separation Δ, b = (γ2 · G2 · δ2) · tD. Units of the diffusion coefficient and the b value were [D] = μm2/ms = 10−9 m2/s and [b] = ms/μm2 = 109 s/m2. Experiments were performed with constant diffusion time tD, whereby the gradient strength was varied. In the first type of experiment, a b range from 0 to 5 ms/μm2 was covered, linearly increasing G (eight points). In the second type of experiment, four b values were chosen, at b = 0 as a reference and at 15, 30, and 50 ms/μm2. In both types of experiments, the signals were recorded interleaved at different b values with δ = 8 milliseconds, tD = 119 milliseconds, TE = 22 milliseconds, and TR = 4 seconds. Gradients were applied in all three directions simultaneously.
Experimental performance of the diffusion weighting was tested and calibrated in phantoms. The signal attenuation of water and trimethylphosphate was strictly monoexponential with diffusion coefficients of (1.97 ± 0.006) and (0.437 ± 0.0006) μm2/ms (mean ± SEM, T = 19°C). Diffusional anisotropy of the water signal in the specific voxel location in vivo was found to be 10% to 20% in x, y, and z direction (Pfeuffer et al., 1999a). Therefore, anisotropy effects of the metabolite diffusion in that voxel were considered negligible in our study.
Data analysis and quantification
Diffusion-weighted 1H NMR spectroscopy is extremely sensitive to small movements in a living animal. When simply summing the acquired data, the ensuing scan-to-scan phase variations lead to a decrease in intensity in the 1H metabolite spectra. This effect increased with larger diffusion weighting. To allow individual phase corrections, the data of each scan were stored separately. The sensitivity permitted the correction of the phase of single-scan metabolite spectra at all b values despite a fully suppressed water signal. The interface software for data conversion and processing was implemented with PV-WAVE (Visual Numerics, Inc., Boulder, CO, U.S.A.). Automatic phase correction of each spectrum before averaging therefore minimized signal loss from motion. Quantitatively, the additional decrease in metabolite signal intensity without the phase tracking procedure was approximately 10% at b = 5 ms/μm2 and overestimated the apparent diffusion coefficients Dapp, for example, of N-acetylaspartate (NAA) by 16%. Likewise, signal intensity was decreased by 60% at b = 50 ms/μm2 and overestimated the Dapp of NAA by 48% (data not shown).
Quantification of metabolite concentrations was based on frequency domain analysis using LCModel (Linear Combination of Model spectra of metabolite solutions in vitro) (Provencher, 1993), implemented at 9.4 Tesla as described elsewhere (Pfeuffer et al., 1999a). Briefly, in vivo spectral resonances were deconvoluted using a set of in vitro basis spectra by means of a constrained regularization algorithm. The method uses a linear combination of the experimentally determined spectral pattern of each metabolite. In vitro data were collected from NAA, N-acetylaspartylglutamate (NAAG), alanine, γ-aminobutyric acid, aspartate, choline-containing compounds (Cho), creatine (Cr), Glc, glutamine (Gln), glutamate (Glu), glutathione (GSH), myo-inositol (Ins), scyllo-inositol, Lac, phosphocreatine (PCr), phosphorylethanolamine (PE), and taurine (Tau). The underlying macromolecule (MM) background with a short T1 relaxation time was determined by minimizing the metabolite signals in an inversion recovery experiment with a suitable inversion recovery delay, and included as a MM model spectrum in the LCModel basis set (Pfeuffer et al., 1999b). The full spectral pattern of the metabolites was analyzed with LCModel to evaluate the overall metabolite intensities, which provided a higher precision than the evaluation of intensities from single, partially overlapping peaks.
For tests of statistical significance, two-tailed Student's t tests and one-way analysis of variance were used (Microcal Origin, Northampton, MA, U.S.A.).
Modeling
Although the current study design is based on a model-free approach by comparing the diffusion behavior of Glc and Lac to that of known intracellular metabolites, in this section we consider the differential effect of intracellular versus extracellular diffusion on the signal attenuation. Based on previous studies (van Zijl et al., 1994; Pfeuffer et al., 1998c, 1998d and references therein), the diffusion of metabolites in brain tissue is here described by two different characteristics: restricted diffusion in the intracellular space, and hindered diffusion in the extracellular space.
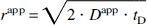
Intracellular diffusion. Assuming sufficiently long diffusion times, intracellular metabolites encounter restrictions by cellular boundaries, and the mean displacement r is limited by the cell dimensions. The apparent diffusion coefficient Dapp-determined from the slope of an experiment at a fixed diffusion time tD-is an order of magnitude lower than that of free diffusion and defines the apparent displacement rapp by the Einstein equation:
Although a detailed theoretical description includes a distribution of cell dimensions and spatial anisotropy as well as subcellular compartmentation and potential exchange between different compartments (Stanisz et al., 1997; Price et al., 1998; Pfeuffer et al., 1999a), the simplest phenomenologic model was used here. The diffusion attenuation of the signal of intracellular metabolites (components 1 and 2) with fractions pintra is defined as follows:
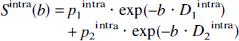
The fractions p2 and p1 = 1 − p2, as well as the diffusion coefficients D1 and D2, were empirically determined from the diffusion behavior of known intracellular metabolites. The fraction p1, which reflects relative signal contribution, is referred to as “apparent volume fraction” and is given as a percentage throughout the text.
Extracellular diffusion. The diffusion characteristic in the extracellular space is different because the mean displacement rapp is not limited with increasing diffusion time. The longer diffusion paths in the extracellular space (denoted by subscript 0) result in a hindered extracellular diffusion and a reduced diffusion coefficient compared with the free self-diffusion. The expected extracellular ADC was calculated from the self-diffusion coefficient using a tortuosity factor λ, which has been experimentally determined for healthy adult rat brain tissue to be approximately 1.5 (Nicholson and Sykova, 1998; Pfeuffer et al., 1998a):
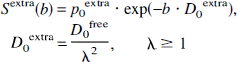
Diffusion of glucose and lactate. For metabolites such as Glc and Lac with both intracellular and extracellular signal contributions, the total signal is described by the superposition of extracellular and intracellular signal, that is, S = Sextra + Sintra and p0extra + p1intra + p2intra = 1. With an estimated D0extra ranging from 0.3 to 0.5 μm2/ms (D0free = 0.75 to 1.1 μm2/ms), which is at most a factor of two larger than the experimentally determined D1intra (Table 2), a triexponential fit was not considered to reliably discriminate between D0extra and D1intra within the experimental error. Therefore, a biexponential fit was used:
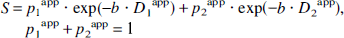
The apparent diffusion coefficient D1app, approximately a weighted average of D0extra and D1intra, and the apparent volume fraction p1app = p0extra + p1intra then subsumed the extracellular contributions.
To extract the extracellular volume fraction p0extra from the data, the following calculation was used. For intracellular metabolites such as NAA, p0extra was assumed to be negligible, and p1app = p1intra and p2app = p2intra. We defined a “intracellular component ratio” κintra, averaged over all intracellular metabolite data,
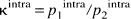
which is a phenomenologic constant characterizing the diffusion characteristic of the two intracellular components at the given experimental conditions (i.e., diffusion time and b range). When a similar restricted diffusion characteristic in the intracellular compartments for the considered metabolites is assumed, the relative extracellular fraction is given by
where kintra was determined from the data of intracellular metabolites, (Eq. 2 and 5), that is, p0extra = 0. The parameter p2app was fitted by nonlinear least square analysis of the experimental data to the biexponential decay function defined in Eq. 4.
In summary, the extracellular volume fraction p0extra of metabolites with extracellular contributions was calculated from the relative volume fraction p2app at large diffusion weighting.
Fitting
Log-linear fit. The apparent diffusion coefficients (ADC, Dapp) of the metabolites were determined from the negative slope of the signal attenuation versus b value, that is, ln S = −b · Dapp.
Log-linear regression was used for both of the experiments, that is, for data in the b range of 0 to 5 and 15 to 50 ms/μm2. By convention, the apparent diffusion coefficient was termed ADC at small b values as used in previous studies. In our biexponential model, we used Diapp with the index indicating the corresponding component. To justify a log-linear fit as an approximation for the second component of a biexponential decay, it was assumed that the contributions of the first component (Eq. 4) were less than 5% for b > 15 ms/μm2 corresponding to a lower limit for D1app of 0.2 μm2/ms.
Biexponential fit. The pooled data in the full b range of 0 to 50 ms/μm2 were analyzed by biexponential fitting constraining the sum of the volume fractions to 1 (p1 + p2 = 1). To establish statistical significance for the model parameters p2app, D1app, and D2app of the biexponential fit, a Monte Carlo simulation was performed with 104 trials, as described previously (Press et al., 1992). The scatter of the signal intensities at each b value was approximated with a Gaussian distribution having a SD, which was calculated from the experimental data. The confidence region ellipses were calculated in the two-dimensional parameter space (p2app, D2app) for each metabolite by a two-dimensional probability distribution and two-dimensional Gaussian fit. This method allowed determination of the probability that groups of metabolites in the (p2app, D2app) parameter space are different, despite a covariance between the model parameters.
RESULTS
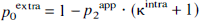
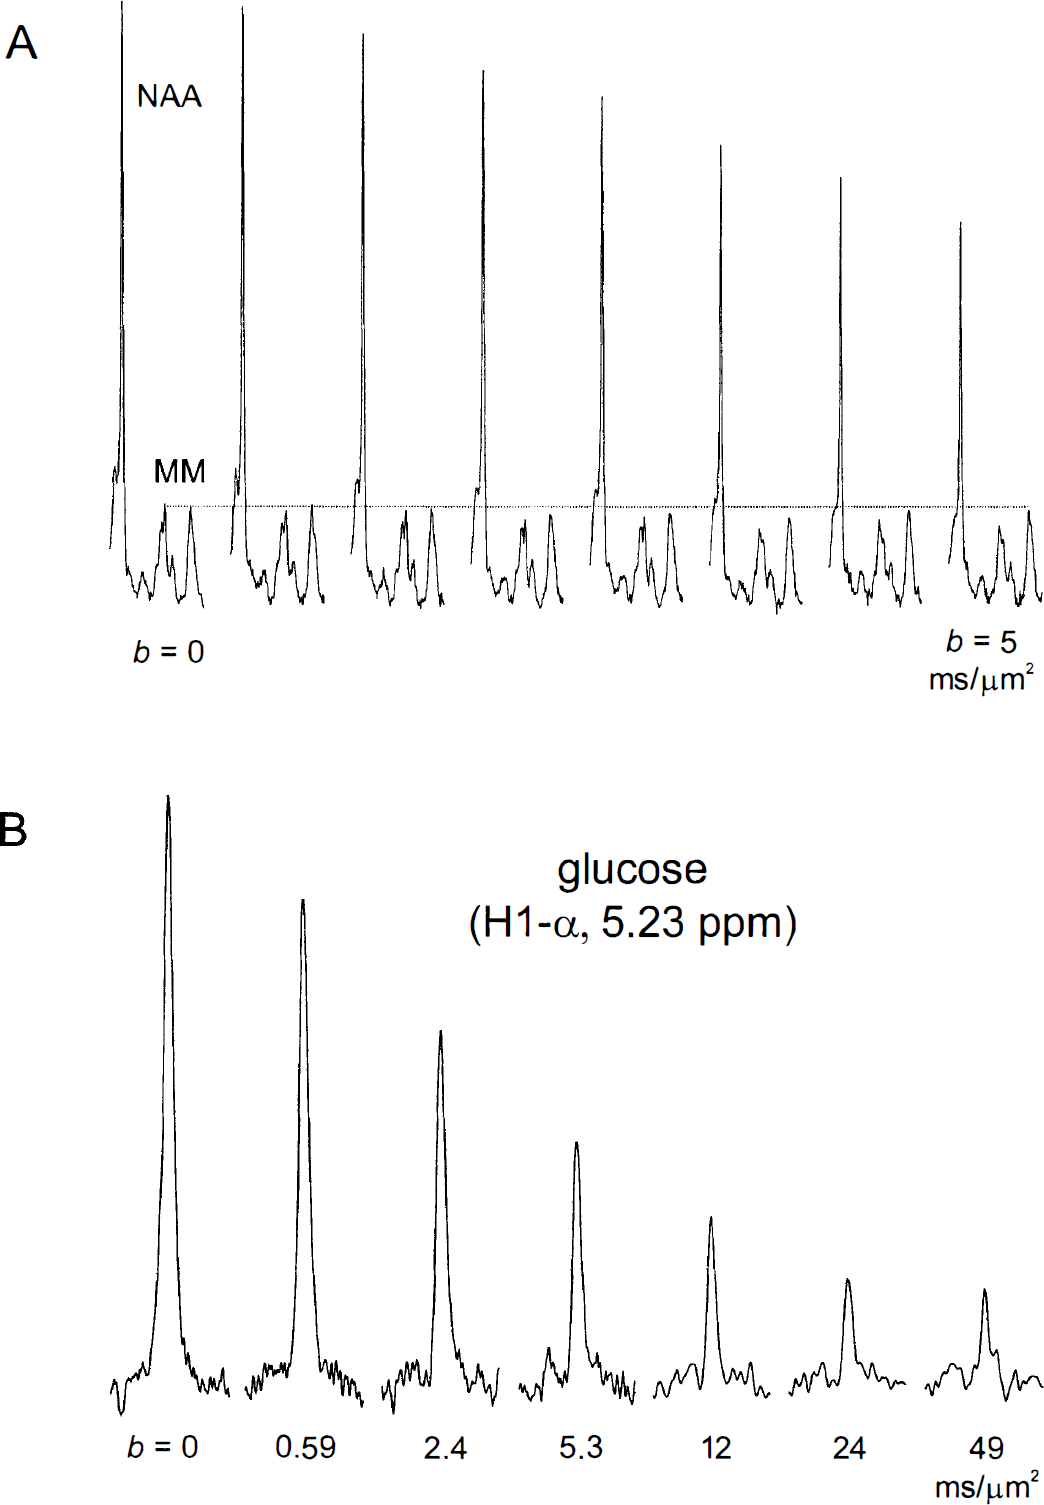
The cerebral metabolite concentrations in the volume-of-interest, as determined by LCModel analysis (Pfeuffer et al., 1999b), were consistent with biochemical literature data. The Glc concentration was (3.5 ± 0.5) mmol/g w.w. (mean ± SD, n = 10) in rats without Glc infusions, and was (8.1 ± 1.2) μmol/g wet weight (n = 17) in hyperglycemic rats with intravenous Glc infusion. The Lac concentration was (1.9 ± 0.3) μmol/g w.w. (n = 20). At TE of 20 ms, contributions of relatively broad MM resonances were recognized throughout the whole 1H NMR spectrum in vivo from 0.8 to 4.4 ppm (Fig. 1A). Since the diffusion of MM is much slower than for metabolites, a MM model spectrum was included in the basis set of the LCModel analysis to account for these resonances, especially at large diffusion weighting.
Localized 1H nuclear magnetic resonance (NMR) spectra of rat brain in vivo with the contributions of macromolecules, lactate (Lac)
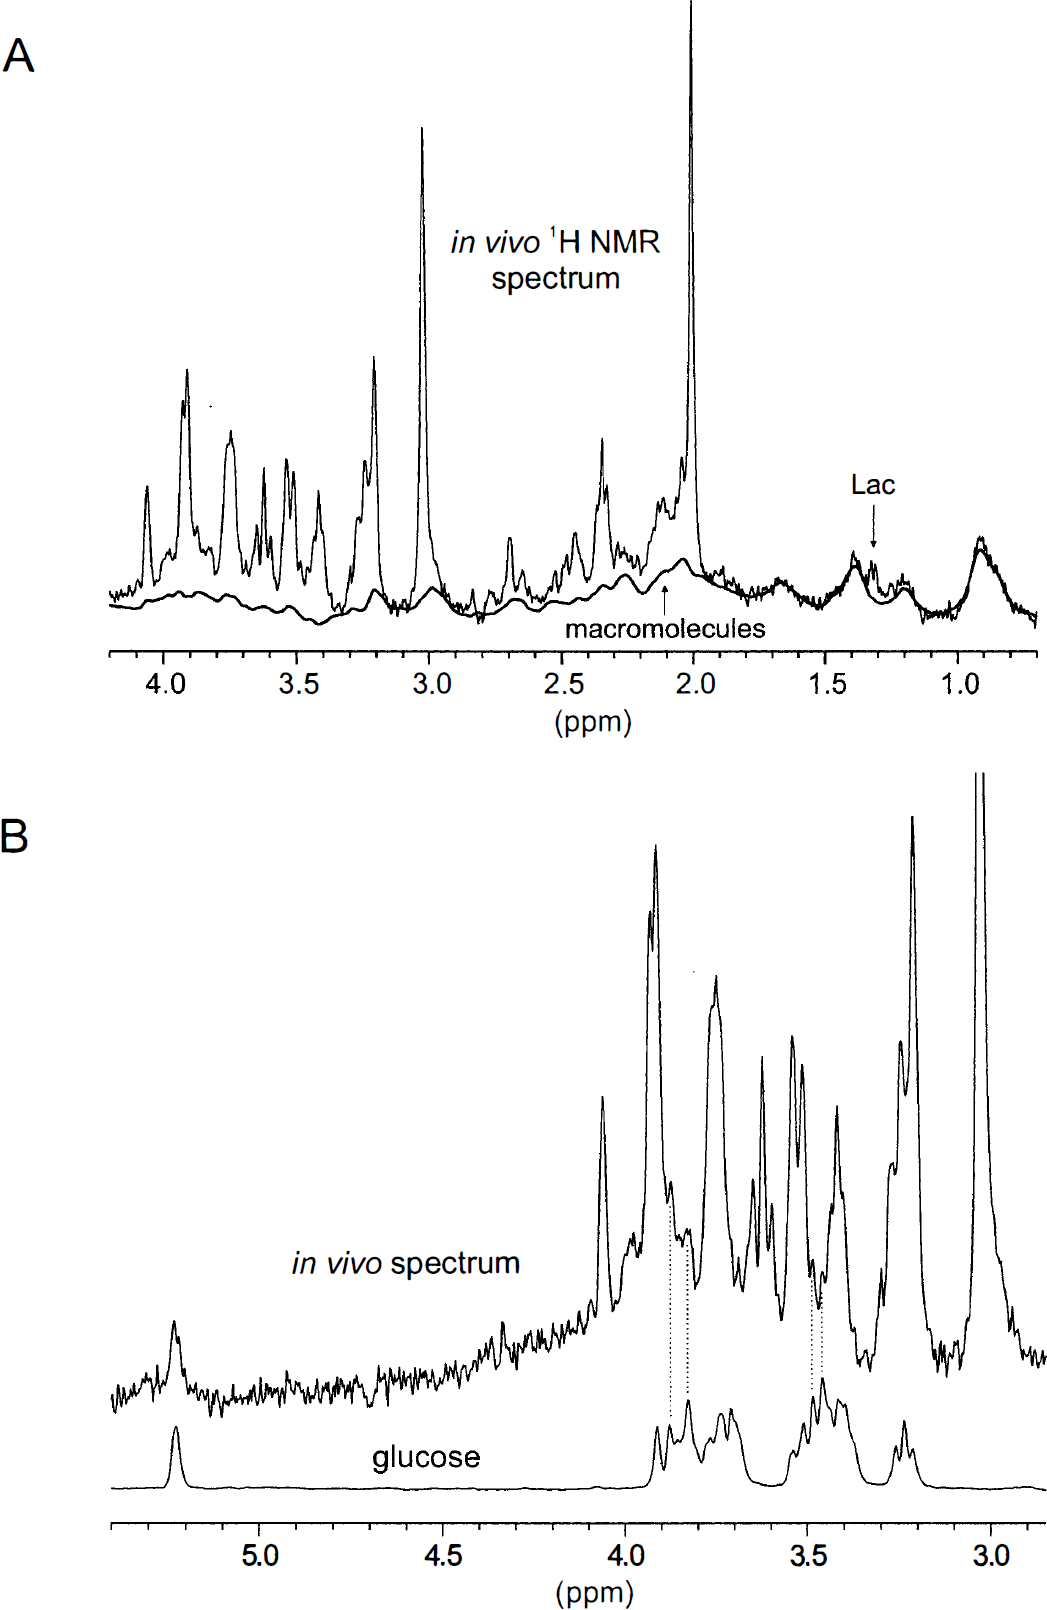
The contribution of Glc to the in vivo spectrum is shown in Fig 1B. The Glc resonances were detected at 5.23 ppm (H1-α) and also at 3.95 to 3.65, 3.55 to 3.35, and 3.25 ppm. Peaks at 3.87, 3.83, 3.49, and 3.46 ppm were discernible, as indicated by the dotted lines in Fig. 1B. The Lac resonances were detected at 1.32 and 4.11 ppm (Fig. 1A). The 1H NMR metabolite resonances in the rat brain in vivo were indicated in detail in Fig. 2A in the spectral region of 4.2 to 1.8 ppm (i.e., NAA, Cho, Cr, Gln, Glu, Ins, PCr, PE, and Tau; see legend to Fig. 2).
The 1H NMR spectra of rat brain in vivo without
Diffusion characteristic of cerebral metabolites
With a diffusion weighting of b = 5.5 ms/μm2 (Fig. 2B), the metabolite intensities were reduced by 40% to 50% compared with the spectrum without diffusion weighting (Fig. 2A). The diffusion attenuation (b range from 0 to 5 ms/μm2) of NAA (2.01 ppm) and of MM resonances demonstrated that the NAA signal was reduced up to 45% corresponding to an ADC of 0.11 μm2/ms (Fig. 3A). In contrast, the signals from MM remained almost constant in the range of b values, consistent with their large molecular weight (Behar and Ogino, 1993). The signal decays from MM with short T1 relaxation time were monoexponential up to b = 50 ms/μm2 with a diffusion coefficient of (0.0063 ± 0.0004) μm2/ms (rapp = 1.2 μm), corresponding to a signal attenuation (S/S0) of only 27% at the maximal b = 50 ms/μm2.
Series of 1H NMR spectra at increasing diffusion weighting.
To compare with previous in vivo studies of metabolite diffusion, a separate set of diffusion-weighted experiments was performed at small b values from 0 to 5 ms/μm2.
The signal attenuation of NAA is plotted in Fig. 4A (solid diamonds). The ADC of NAA, Glu, Cr, Ins, Tau, and GSH were between 0.10 and 0.12 μm2/ms with errors less than 5% (Table 1). The excellent interassay reproducibility can be assessed from the fact that normalized signal intensities (e.g., of NAA, Cr + PCr, and Glu) were not distinguishable between metabolites and between different rats (data not shown).
Apparent diffusion coefficients (Dapp) and volume fractions (papp) of metabolites of 1H NMR spectra in rat brain in vivo determined by bi-exponential analysis
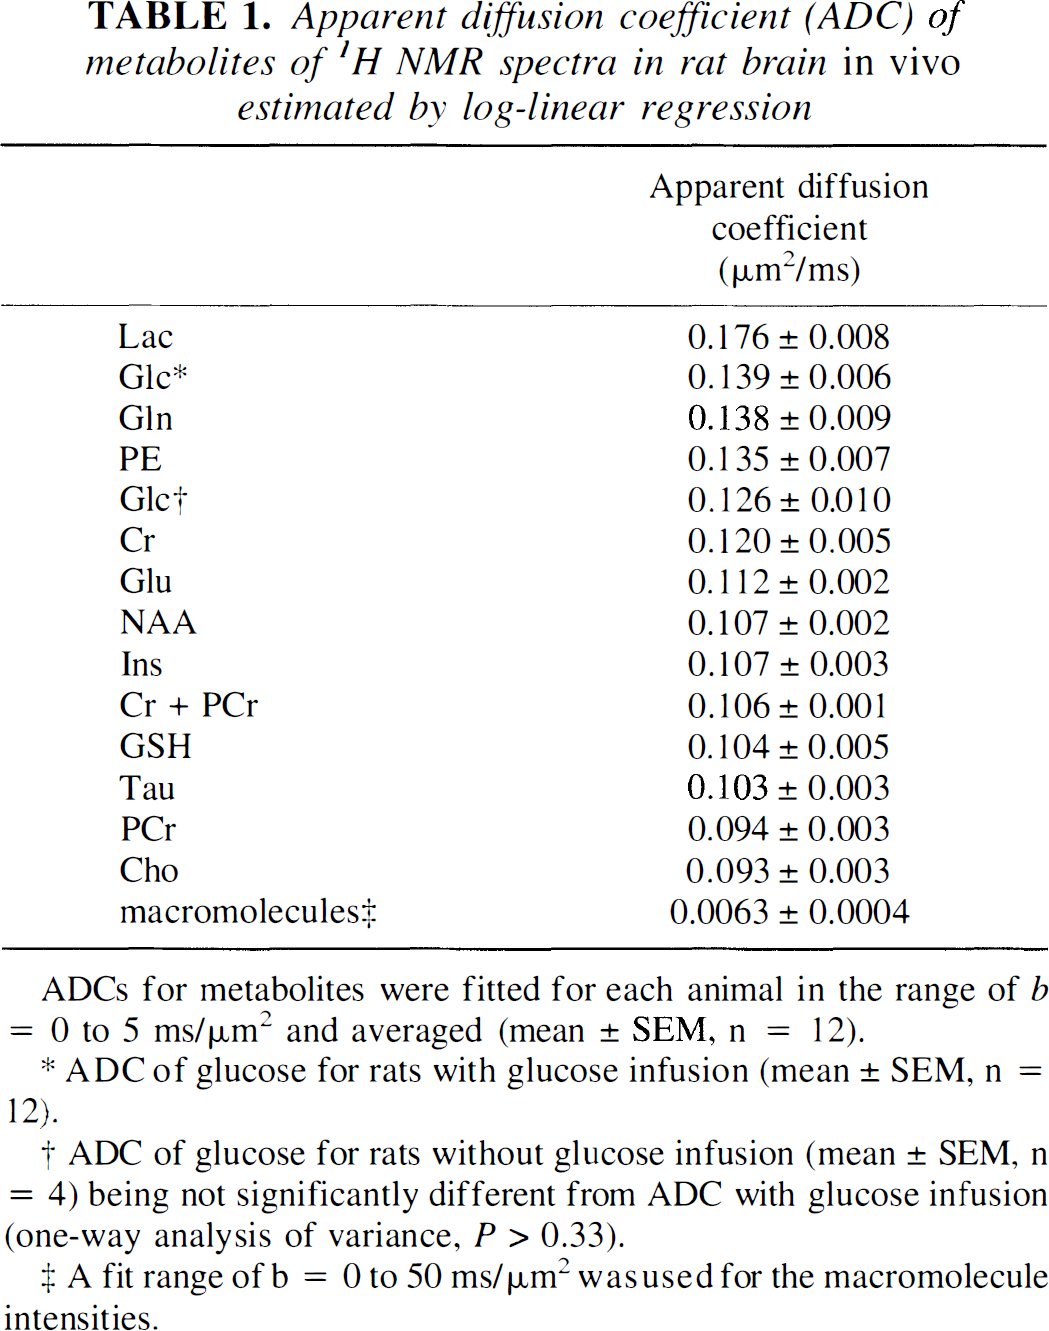
ADCs for metabolites were fitted for each animal in the range of b = 0 to 5 ms/μm2 and averaged (mean ± SEM, n = 12).
ADC of glucose for rats with glucose infusion (mean ± SEM, n = 12).
ADC of glucose for rats without glucose infusion (mean ± SEM, n = 4) being not significantly different from ADC with glucose infusion (one-way analysis of variance, P > 0.33).
A fit range of b = 0 to 50 ms/μm2 was used for the macromolecule intensities.
Apparent diffusion coefficient (ADC) of metabolites of 1H NMR spectra in rat brain in vivo estimated by log-linear regression
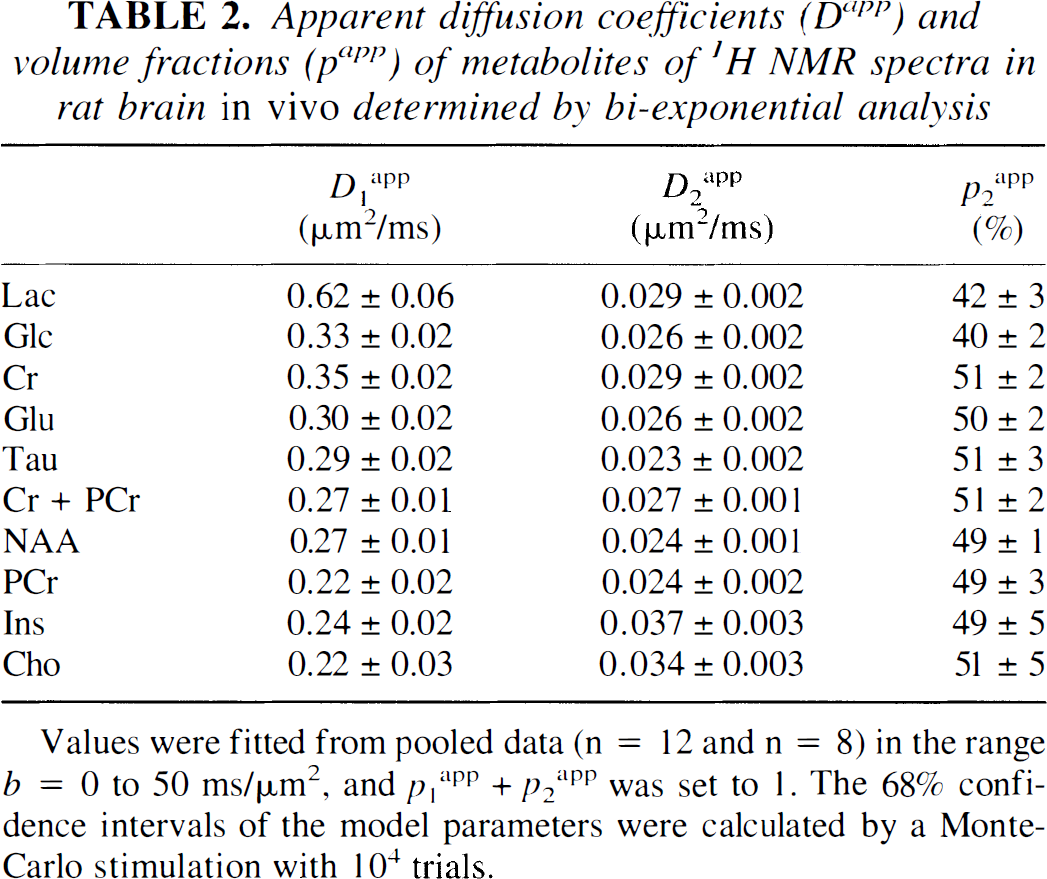
Values were fitted from pooled data (n = 12 and n = 8) in the range b = 0 to 50 ms/μm2, and p1app + p2app was set to 1. The 68% confidence intervals of the model parameters were calculated by a Monte-Carlo stimulation with 104 trials.
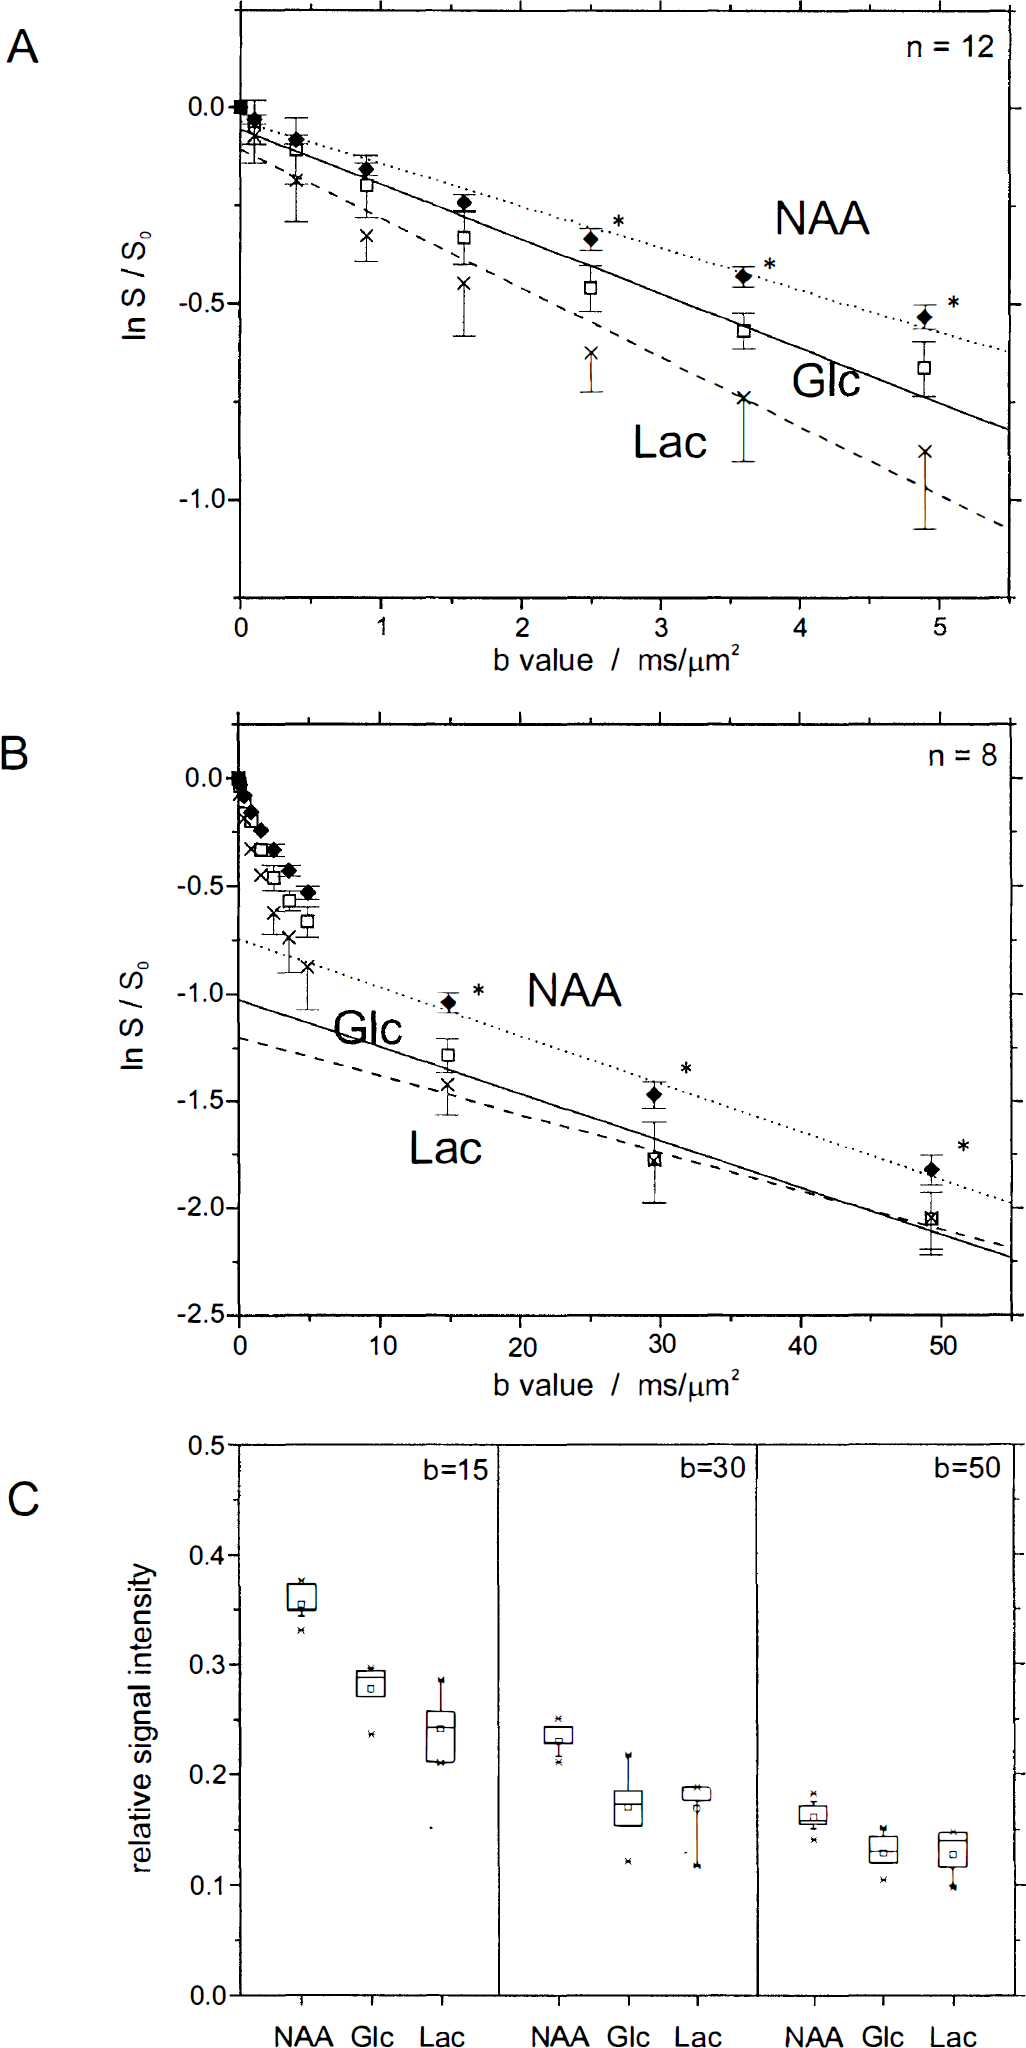
Diffusion-attenuated 1H NMR signal intensities of the metabolites NAA (♦), Glc (□), and Lac (×). Shown are measurements of the apparent diffusion coefficients performed at b < 5 ms/μm2
Glucose (open squares) and Lac (cross symbols) and their fitted curves for the ADC (solid and dashed lines) are presented in Fig. 4A, with an increased signal attenuation at larger diffusion weighting compared with NAA. The relative signals of Glc and Lac at b = 2.5, 3.6, and 4.9 ms/μm2 were lower than the NAA signals (t test, P < 0.001). A small 10% increase of the ADC of brain Glc with compared to without Glc infusion (Table 1) was not significant (one-way analysis of variance, P > 0.33).
To assess the diffusion characteristics of cerebral metabolites at large diffusion weighting, four data points with b values up to 50 ms/μm2 were measured and normalized to S0. The signal intensities for NAA (solid diamonds), Glc (open squares), and Lac (cross symbols) are shown in Fig. 4B (mean ± SD, n = 8) as well as the log-linear fit in the range of 15 to 50 ms/μm2 (dotted, solid, and dashed lines). Figure 4C shows the differences in signal intensities at the b values of 15, 30, and 50 ms/μm2 in the box plots for NAA, Glc, and Lac, which clearly demonstrate that normalized Glc and Lac signals are significantly lower than NAA signals (t test, P < 0.002).
Intracellular volume fraction of cerebral glucose and lactate
Log-linear fit. The log-linear fit of the data at large b values (15 to 50 ms/μm2) yielded D2app (slope) and p2app (intercept) for each metabolite and each animal (n = 8). The averaged p2app was (48.7 ± 0.9)% (mean ± SEM, n = 56) for the intracellular metabolites NAA, Cr, PCr, Glu, Tau, Cho, and Ins. For Glc and Lac, the D2app was similar to the grand mean of the other metabolites, but p2app was decreased (t test, P < 0.001) and was 37.2% ± 1.5% for Glc and 32.2% ± 2.4% for Lac (mean ± SEM, n = 8).
Biexponential fit. For a full quantitative assessment, the diffusion-weighted signals were pooled and fitted with the biexponential model of Eq. 4 (Table 2). The volume fractions papp are plotted in Fig. 5A as a function of the diffusion coefficients Dapp, indicating the fast decaying signal components (D1app) by open squares and the slow components (D2app) by solid squares. Most metabolites had volume fractions p2app around 50% (shaded areas). In an enlarged view (Fig. 5B), the slowly decaying components provided a p2app of 50.2% ± 1.1% and a D2app of 0.028 ± 0.005 mm2/ms (all metabolites except Glc and Lac, mean ± SD). A different behavior was observed for Glc and Lac: the p2app were decreased (Table 2), being different from the intracellular metabolites (P < 0.01), which was determined from a Monte Carlo simulation of the errors in the biexponential model.
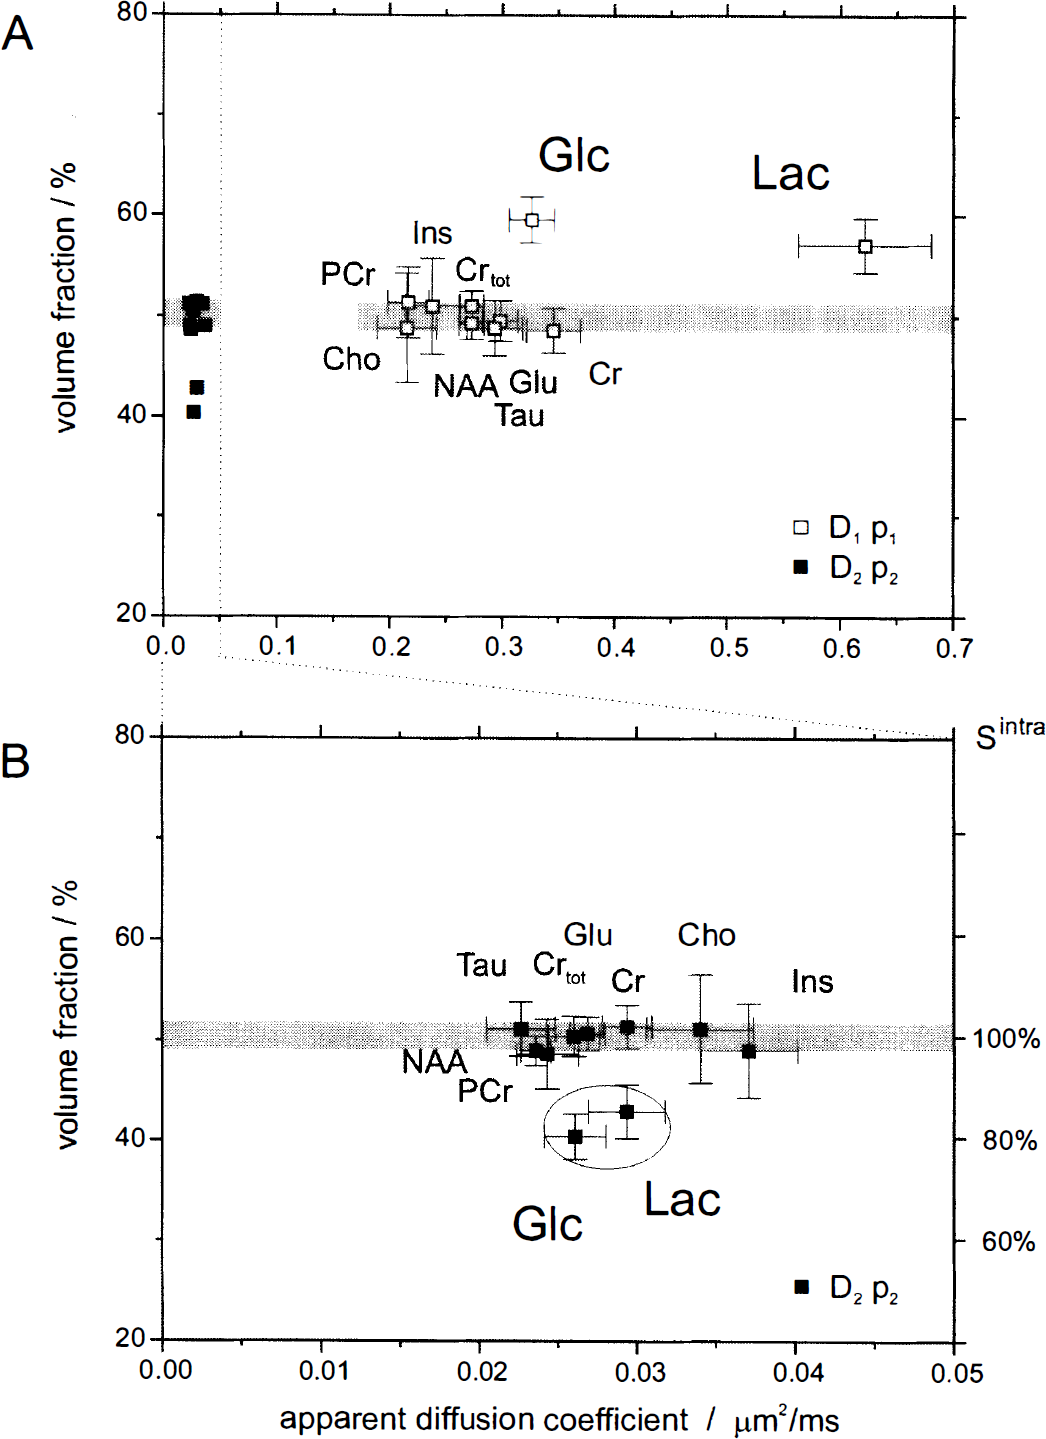
Results of a biexponential analysis of the diffusion-attenuated 1H NMR metabolite signal intensities in rat brain in vivo.
The intracellular component ratio κintra = p1intra/p2intra (Eq. 5) was calculated from the intracellular metabolite data as 0.99 ± 0.02 (mean ± SEM, n = 8), which was incidentally near 1. Using this value as a phenomenologic constant, the relative extracellular volume fraction p0extra was estimated from Eq. 6 to be 19% ± 5% for Glc and 17% ± 6% for Lac.
DISCUSSION
Diffusion of intracellular metabolites
With localized 1H NMR spectroscopy at high magnetic fields, it was possible to determine noninvasively the diffusion characteristic of metabolites in the rat brain in vivo such as Glc, resting Lac, Tau, Ins, glutamine, and Glu. The Glc concentrations under normal conditions were in agreement with previous values from the rat brain (Mason et al., 1992) and were elevated more than twofold in the brain with intravenous infusion of Glc. In this study, diffusion-weighted 1H NMR spectroscopy has been used with a similar range of small b values compared with previous studies (Wick et al., 1995; van der Toorn et al., 1996; Duong et al., 1998; Dreher and Leibfritz, 1998; Dijkhuizen et al., 1999). Our ADC values, fitted in the range of 0 to 5 ms/μm2, are in good agreement with these studies but with slightly lower values (Table 1). This can be explained by the longer diffusion time of 120 milliseconds used in our study compared with 10 to 20 milliseconds, which has been shown to reduce the ADC corresponding to the restricted diffusion of intracellular metabolites (Helmer et al., 1995; Assaf and Cohen, 1998; Pfeuffer et al., 1998d). In addition, a single-scan phase correction was applied, which generally leads to an inherent decrease in ADC by signal recovery (Posse et al., 1993; Ziegler et al., 1995). Comparing the monoexponential fits (straight lines) in Fig. 4A with the experimental points, a curvature was recognizable in the semilogarithmic plot, consistent with a multiexponential signal attenuation (Fig. 4A). Therefore, the ADC is expected to further increase when measured over an even smaller range of b values.
The diffusion attenuation for the MM signals (associated with a short T1) was monoexponential up to 50 ms/μm2 with a small diffusion coefficient (D = 0.006 μm2/ms), which reflects the increased molecule size and the inherent decrease in mobility (Behar and Ogino, 1993). At b = 5 ms/μm2, an attenuation of 3% was estimated for MM signals (Fig. 3A), supporting our assertion that signal loss from motion was minimized in our study.
Extending the diffusion weighting by a factor of 10, a biexponential attenuation was evident for all measured metabolites. Given that most metabolites (e.g., NAA or Cr) are primarily located in the intracellular space, the decrease in the apparent diffusion coefficients Dapp must reflect the structural boundaries, characterized by the different apparent displacements rapp of the two components. Averaged over all intracellular metabolites, rapp was 8.0 ± 0.7 μm and 2.6 ± 0.2 μm for the components 1 and 2 at the diffusion time of 119 milliseconds (mean ± SD), which were calculated from the apparent diffusion coefficients D1app and D2app (Table 2) according to Eq. 1. These dimensions have been assigned to the bodies and axons of cells (Assaf and Cohen, 1998), but interpretation might be more complicated, considering a distribution of cell diameters, influences of anisotropic morphologic features (Stanisz et al., 1997), and multiple compartments (e.g., glial, neuronal, or subcellular compartments). Notice that a multiexponential signal decay in the brain may not necessarily directly reflect distinct compartments but also can be explained by the structure of restricting boundaries of a single compartment (see Pfeuffer et al., 1999a and references therein) such as the axons, dendrites, or glia. Analytic expressions for diffusion in two-dimensional (sheets) and one-dimensional (tubes) geometries have been calculated that are considerably non-monoexponential (Callaghan, 1991). In conclusion, caution must be used when assigning components of a multiexponential signal decay to a physiologic compartment.
Diffusion characteristic of glucose and lactate
To reduce the influence of assumptions inherent to a given model, we used the diffusion behavior of known intracellular metabolites as a phenomenologic standard. The similarity of p2app for all intracellular metabolites (Table 2) support our assumption that the intracellular component ratio p1intra/p2intra was constant for the overall intracellular compartment at the given experimental conditions, as evidenced by p2app being indistinguishable for most concentrated metabolites NAA, Cr, PCr, Tau, and Glu. Therefore, κintra was calculated by averaging p1intra/p2intra over all intracellular metabolites.
The observation that the ADC and D2app of most metabolites are similar (Tables 1 and 2) indicates that the diffusion barriers and cellular restrictions dominate the effect on the diffusion coefficient and that most metabolites, from a macroscopic view, can be considered to be in a similar environment (diffusion time scale of 120 milliseconds). Interestingly, Ins showed an increased D2app (but constant p2app), suggesting that it has a different intracellular distribution space. Based on measurements with cell cultures, it has been proposed recently that Ins is located mainly in the glial cells (Brand et al., 1993). In contrast, NAA, localized to the neuronal compartment (Birken and Oldendorf, 1989), has the smallest D2app compared with the other metabolites. The different D2app are consistent with a larger and smaller apparent displacement rapp in the glial and neuronal compartment, respectively. However, it has to be established by further experiments whether the dependency of D2app on the subcellular distribution space generally holds for all metabolites.
Both Glc and Lac exhibited a restricted diffusion characteristic similar to that of the intracellular metabolites, leading to the detection of signal at large b values and a D2app that was comparable to the intracellular metabolites (Table 2). The detection of Glc signals at large b values (Fig. 3B) is consistent with a characteristic of restricted diffusion for Glc in the intracellular space, which is described by a small Dapp in the order of 0.02 μm2/ms. The signals in Fig. 3B provide the direct, noninvasive evidence for a significant intracellular Glc concentration in the rat brain in vivo during hyperglycemia.
To assess the signal attenuation of extracellular Glc (Sextra, see Eq. 3), D0extra was estimated to be 0.4 μm2/ms from the measured free diffusion constant of D0free(Glc) = 0.8 μm2/ms (T = 37°C) using Eq. 3. A hindered diffusion characteristic was assumed for the extracellular space (λ = 1.5). At b = 5 ms/μm2, the signal from extracellular Glc Sextra then was attenuated to 0.17 · S0, and at b = 50 ms/μm2 to 2 · 10−8 · S0. In the multiexponential fit, it was not possible to differentiate D0extra from D1intra because the values were close and, therefore, were fitted with a single, composite D1app (Eq. 4). For Lac, which is a smaller molecule with a larger mobility (Longsworth, 1953), the experimentally measured free diffusion constant is increased to D0free(Lac) = 1.1 μm2/ms (T = 37°C). Therefore, the larger D1app of Lac (Table 2) is consistent with Lac being a smaller molecule than Glc.
Signal contributions from plasma Glc were considered to have a minor effect on the determination of the extracellular volume fraction of Glc. A plasma Glc concentration in vessels of about 30 mmol/L (Mason et al., 1992) averages to 0.3 to 0.6 mmol/L in brain, which was below 5% of the tissue Glc signal. In addition, the signal of plasma Glc in perfused vessels is expected to be attenuated by small diffusion gradients (Neil et al., 1994), reducing the contribution of plasma Glc to the fast decaying component well below 5%. Similarly, signal contributions of Glc from ventricles and extracerebral spaces in the midline were considered to be strongly reduced by diffusion weighting. Recent microdialysis findings (Lowry et al., 1998; McNay and Gold, 1999) show that the extracellular Glc concentration in the awake rat was 0.5 to 1 mmol/L and that it is affected by neuronal activity. In our study using anesthetized animals, higher extracellular Glc levels were measured, and similar concentrations in the extracellular and in the intracellular space were found, which was not possible to assess using microdialysis.
It has been demonstrated in several studies that the diffusion attenuation of intracellular metabolites (e.g., NAA) is multiexponential and depends on the diffusion time (Assaf and Cohen, 1998; Pfeuffer et al., 1998d), which is characterized by D1intra and D2intra in our model (Eq. 2). To avoid excessive dependence on theoretical models, we used the experimental diffusion attenuation curves of known intracellular metabolites as a gauge and assumed that intracellular Glc or Lac has the same characteristic. This was supported by our observation that diffusion coefficients were independent of the molecule size for all concentrated intracellular metabolites. The difference between such an empirical internal standard for intracellular compounds and Glc/Lac can be explained by signal contributions from Glc and Lac in the extracellular space. Unfortunately, the estimated extracellular diffusion constant D0extra is difficult to distinguish from the intracellular diffusion component D1intra, as observed recently (Duong et al., 1998). Therefore, we assumed the extracellular diffusion to be the same as the faster decaying intracellular diffusion component. Using the slower decaying intracellular signal components (D2intra), the volume fraction p0extra of the extracellular compartment could be determined. In the study by Duong et al., a biexponential diffusion behavior was not detected with the small b values and short diffusion time used. The choice of the diffusion time regime is a critical parameter for the separation of hindered and restricted diffusion behavior in the brain in vivo, which may have masked the differences between extracellular and intracellular ADC in that study.
The anisotropy of the diffusion for water molecules was only 10% to 20% in the specific volume chosen (Pfeuffer et al., 1999a), which does not affect the conclusions of our report. However, no data in the literature report anisotropy for metabolites in the brain in vivo, such as NAA, and we are not aware of any mechanism that would cause the anisotropy being different between Glc/Lac and NAA.
The effects of transport of Glc or Lac across cell membranes were assumed to have negligible impact. An exchange of metabolites from an intracellular, highly restricted compartment to an extracellular, less restricted compartment could affect the diffusion-weighted signal attenuation, depending on the diffusion time. It has been shown that intracellular-extracellular exchange additionally attenuated the intracellular water signal at large b values (Pfeuffer et al., 1998a, 1998e). For metabolites, the intrinsic diffusion is about threefold slower because of the larger molecule size, and their membrane permeability is considerably decreased compared with water. Therefore, exchange effects were estimated to have a minor influence in our experiment with a diffusion-sensitive period of about 120 milliseconds.
Intracellular volume fractions
The increased ADC of Glc and Lac at small b values (Table 1) can be explained by a decreased fraction p2app of the component at large b values, whereby its slope (D2app) was not different from the intracellular metabolites (Table 2). The larger ADC of Glc and Lac also correlates with the fact that these metabolites have significant extracellular concentration in the brain. To test the hypothesis of whether diffusion properties or extracellular-intracellular volume fraction could be altered because of the hyperglycemic conditions used, the ADC of Glc at small b values was compared in rats without and with Glc infusion (Table 1). The unchanged ADC of Glc under both conditions strongly suggests that D2app and the extracellular-intracellular volume ratio does not change with hyperglycemia.
It has been previously pointed out that the similarity of the Glc concentration in the extracellular space compared with whole brain gave strong evidence that Glc is equally distributed in the brain and has a considerable intracellular fraction (Silver and Erecinska, 1994). The determined relative extracellular volume fraction of 19% for Glc supports this conclusion based on direct, noninvasive experimental evidence. Assuming the intracellular volume fraction in the brain to be 78% to 80% (Vorisek and Sykova, 1997), our study implies that steady-state Glc concentrations are equal in the intracellular and extracellular space within the experimental error.
Conclusions
From the observation of the Glc signals at large diffusion weighting, it can be concluded that a substantial fraction of the Glc signal is intracellular. This is further supported by the diffusion characteristic of Glc, which is similar to that of intracellular metabolites. This is the first report of a completely noninvasive simultaneous assessment of the intracellular-extracellular distribution of both Glc and Lac in vivo. The estimated relative extracellular signal of Glc (19%) at hyperglycemia is consistent with the relative extracellular volume and indicates that the distribution of Glc in the brain is approximately even in the extracellular and intracellular space. This supports the notion that the largest concentration gradient of Glc is at the blood-brain barrier, where the Glc concentrations are about a factor of two to three higher than in the brain (Gruetter et al., 1998a). These methods can be extended to assess the extracellular fraction of metabolites noninvasively and to monitor their changes in pathologic animal models, such as changes of extracellular Lac in brain lesions and tumors.
Footnotes
Abbreviations used
Acknowledgements
The authors thank Professors Kamil Ugurbil and Michael Garwood, Minneapolis, for support, and Professor Dieter Leibfritz, Bremen, and In-Young Choi, Minneapolis, for helpful discussions.