
Abstract
Rapid transport of lactate from activated brain regions to blood, perhaps reflecting enhanced metabolite trafficking, would prevent local trapping of labeled metabolites of [6-14C]glucose and cause underestimation of calculated CMRglc. Because the identities of glucose metabolites lost from activated structures and major routes of their removal are not known, arteriovenous differences across brains of conscious normoxic rats for derivatives of [6-14C]glucose were determined under steady-state conditions in blood during K+-induced spreading cortical depression. Lactate was identified as the major labeled product lost from brain. Its entry to blood was detected within 2 minutes after a pulse of [6-14C]glucose, and it accounted for 96% of the 14C lost from brain within approximately 8 minutes. Lactate efflux corresponded to 20% of glucose influx, but accounted for only half the magnitude of underestimation of CMRglc when [14C]glucose is the tracer, suggesting extensive [14C]lactate trafficking within brain. [14C]Lactate spreading within brain is consistent with (1) relatively uniform pattern labeling of K+-treated cerebral cortex by [6-14C]glucose contrasting heterogeneous labeling by [14C]deoxyglucose, and (2) transport of 14C-labeled lactate and inulin up to 1.5 and 2.4 mm, respectively, within 10 minutes. Thus, newly synthesized lactate exported from activated cells rapidly flows to blood and probably other brain structures.
Keywords
Lactate is synthesized in brain in amounts that vary with metabolic and physiologic status. For example, brain lactate content and lactate efflux from brain are lower in anesthetized compared with conscious rats, and brain lactate level rises rapidly when glucose utilization (CMRglc) is stimulated (Hawkins and Mans, 1983). Because lactate is an end product of glycolysis, elevated lactate level is often interpreted as an index of a shift from oxidative to glycolytic metabolism to produce ATP for the working brain (e.g., Lear and Ackermann, 1989). Lactate is a diffusible compound and it can be exported to extracellular fluid for clearance from brain to blood or for use by other cells as fuel. Microdialysis studies have shown that extracellular lactate level rises under various conditions, including handling, swimming, restraint, noise exposure, and tail pinch (Schasfoort et al., 1988; De Bruin et al., 1990; Takita et al., 1992; Fellows et al., 1993). Little lactate is lost from the brain in resting normal rats (Siesjö, 1978), but lactate output from brain to cerebral venous blood can rise from a basal level of about 4% of glucose influx to 13% shortly after a metabolic challenge (Hawkins et al., 1973). The blood-brain barrier in adult brain is permeable to lactate but the barrier is thought to restrict lactate efflux from brain to blood, and clearance of accumulated lactate from brain might be caused mainly by its utilization within brain (e.g., Kuhr et al., 1988). A novel explanation for transitory variations in lactate level comes from a model of glutamate-induced aerobic glycolysis in cultured astrocytes and hypothetical coupling of functional metabolic activity in neurons and astrocytes in brain in vivo; removal of glutamate released into the synaptic cleft by cotransport with sodium into astrocytes elevates intracellular Na+ level, stimulating Na+/K+ ATPase activity, aerobic lactate production, and lactate efflux to extracellular fluid (Pellerin and Magistretti, 1994). Lactate exported to the culture medium by astrocytes in vitro is assumed to be available for consumption by surrounding neurons in vivo but little is known about the distribution of metabolic substrates in activated brain in vivo (Tsacopoulos and Magistretti, 1996). The lactate might be retained in the activated tissue and oxidized locally, it could be exported to blood, or it could spread to other regions of the brain.
The possibility of rapid and extensive trafficking of lactate from activated brain structures to blood is suggested by results obtained in parallel in vivo assays of CMRglc in conscious rats with [6-14C]glucose and [14C]deoxyglucose. For example, graded increases in the frequency of on-off photic stimulation over the range 0 to 33 Hz progressively increased CMRglc in the superior colliculus when [14C]deoxyglucose was the tracer, whereas only a small increase in CMRglc was registered at 4 Hz with [6-14C]glucose and there were no further incremental changes in CMRglc as the magnitude of stimulation increased, suggesting rapid loss of labeled products from the activated tissue (Collins et al., 1987). Glucose utilization was also greatly underestimated with [6-14C]glucose compared to with [18F]fluorodeoxyglucose when simultaneously assayed with both tracers in the same animal during photic stimulation and hippocampal seizures (Ackermann and Lear, 1989). In both of the above studies, efflux of labeled products from the activated structures was ascribed to rapid lactate transport from brain but lactate levels and efflux were not assayed. Unfortunately, local loss of metabolites from small structures such as the superior colliculus and hippocampus cannot be determined because of inaccessibility of their venous drainage systems. When arteriovenous differences across the brain were assayed in paralyzed and ventilated rats (with or without sedation or anesthesia), no significant efflux of [14C]lactate from brain of normal rats or rats with bicuculline-induced seizures was detected; 14CO2 was reported to be the major product of [6-14C]glucose lost from activated brain, and its loss was low and slow (Hawkins et al., 1985, 1994). Because the physiologic state of the animal can influence the magnitude and routes of glucose metabolism (Hawkins and Mans, 1983; Siesjö, 1978) and newly synthesized lactate derived from [6-14C]glucose has a high specific activity (i.e., half that of [6-14C]glucose, Adachi et al., 1995), lactate trafficking in normoxic conscious rat brain might be more extensive than generally believed. Thus, apparent methodological discrepancies might reflect, in part, large local shifts in glucose metabolism and trafficking of metabolites of glucose that cannot be detected by global metabolic measurements (e.g., arteriovenous differences). Because lactate can serve as fuel for adjacent normal tissue, knowledge of mechanisms and routes of lactate spreading from its site of synthesis is relevant to understanding glial-neuronal interactions in normal working brain and to functional metabolic imaging of CMRglc under normal and pathophysiologic (e.g., stroke, tumors, hypoxia, and mitochondrial dysfunction) conditions.
The objectives of the present study were to establish whether trafficking of newly synthesized metabolites of glucose from brain to blood or to other brain regions does occur in normoxic conscious rats, and, if so, to determine the magnitude, time courses, and identities of major classes of these compounds. Because metabolite loss from the cerebral cortex can be readily measured by sampling venous blood from the superior sagittal sinus, spreading cortical depression was used as an experimental condition to increase both CMRglc and lactate production. Spreading cortical depression has the advantage that changes in rates of CMRglc throughout the entire cerebral cortex are readily induced in conscious rats by topical application of KCl to produce heterogeneous increases in CMRglc (e.g., 30% to 100%) in many structures (Shinohara et al., 1979) that fall within the range of enhanced CMRglc produced by physiologic stimulation (e.g., 50% to 80% increases in barrel cortex during whisker movement; Melzer and Smith, 1995). During spreading depression extracellular glutamate and lactate levels rise (Scheller et al., 1992; Fabricius et al., 1993), and glutamate uptake from the interstitial fluid by astrocytes should increase. Tissue lactate levels are elevated and lactate labeling by [6-14C]glucose rises, whereas amino acid labeling falls; also, CMRglc is underestimated by 50% when assayed with [6-14C]glucose, indicating loss of large amounts of labeled products from the cerebral cortex (Adachi et al., 1995). Thus, spreading depression should permit evaluation of the major routes of lactate efflux from activated tissue, quantitative determination of the fraction of glucose transported from brain to blood as lactate, and estimation of the magnitude of lactate spreading within brain. The results demonstrate that lactate efflux from K+-activated tissue to blood is rapid and continuous but accounts for only about half the underestimation of CMRglc, suggesting swift spreading of similar quantities of lactate to other brain regions.
MATERIALS AND METHODS
Materials
[6-14C]Glucose (specific activity, 52 mCi/mmol), L-[14C(U)]lactic acid (177 mCi/mmol), and [methoxy-14C]methoxyinulin (12.4 mCi/g) were purchased from DuPont NEN (Boston, MA, U.S.A.). The radiochemical purity of [14C]glucose was assayed before use by phosphorylation with ATP and yeast hexokinase, followed by chromatography using anion exchange high-performance liquid chromatography (HPLC) as described below; the purity was found to be greater than 98%. Before use, the [14C]inulin was dissolved in 1 mL of 0.9% NaCl and chromatographed on Sephadex G25 M columns (PD-10, Pharmacia LKB Biotechnology, Uppsala, Sweden) to remove any labeled low-molecular weight compounds (Cohen, 1969). Yeast hexokinase (E.C. 2.7.1.1), glucose-6-phosphate dehydrogenase (E.C. 1.1.1.49), lactate dehydrogenase (E.C. 1.1.1.27), and glutamate-pyruvate aminotransferase (E.C. 2.6.1.2) were obtained from Boehringer-Mannheim (Indianapolis, IN, U.S.A.). Evans Blue was obtained from Sigma Chemical Company (St. Louis, MO, U.S.A.). Analytical grade anion (Dowex AG 1-X8, 100 to 200 mesh, formate form) and cation (Dowex AG 50W-X8, 100 to 200 mesh, H+ form) exchange resins were purchased from BioRad (Hercules, CA, U.S.A.). Disposable columns, rubber septa, and hanging cups for collection of 14CO2 were obtained from Kontes Scientific (Vineland, NJ, U.S.A.).
Animals
Normal male Sprague-Dawley rats weighing 300 to 450 g (Taconic Farms, Germantown, NY, U.S.A.) were fasted overnight to stabilize their plasma glucose levels. On the following day burr holes (2 mm diameter), placed about 2.5 mm lateral and 4.0 mm posterior to bregma on one (for unilateral KCl application) or both (for bilateral KCl application) sides of the midline, were drilled through the skulls of anesthetized rats (1% to 1.5% halothane in 70% N2O, 30% O2) with a microdissecting trephine; the exposed, intact dura was covered with Gelfoam (Upjohn, Kalamazoo, MI, U.S.A.) soaked in 0.9% saline. To sample cerebral venous blood during bilateral spreading cortical depression, a catheter (Radiopaque FEP Teflon intravenous catheter, Abbocath T [24-gauge × 3/4-inch], Abbott Hospitals, Inc., North Chicago, IL, U.S.A.) was inserted into the superior sagittal sinus according to the procedure of Frerichs et al. (1989). In brief, the torcular was exposed by a craniectomy (6 × 8 mm) and the catheter, attached to PE-60 tubing (Clay Adams, Parsippany, NJ, U.S.A.) and mounted on a micromanipulator, was introduced into the torcular and advanced 1 mm into the superior sagittal sinus. The catheter was fastened to the dura with a small amount of Super Bonder 414 (Loctite Corp., Newington, CT, U.S.A.) and cemented to a miniscrew placed in the skull with cranioplastic cement (Plastics One, Roanoke, VA, U.S.A.), the needle and guide wire were removed, and the tubing was filled with heparinized saline (200 U/mL) and plugged with fishline. Catheters (PE-50) were inserted in a femoral vein and both femoral arteries, xylocaine ointment was applied to all wounds, and the rats were restrained by a loose-fitting plaster cast placed around the lower torso. Surgery time ranged from 110 to 150 minutes; at least 2.5 hours were allowed for recovery before the experimental procedure.
Rectal temperature was monitored with a thermistor (Yellow Springs Instrument Co., Yellow Springs, OH, U.S.A.) and maintained at 37°C with a thermostatically controlled heating lamp. Arterial blood PO2, PCO2, and pH were determined with a Model 170 pH/Blood-gas analyzer (Corning Medical Scientific, Medfield, MA, U.S.A.). Arterial blood hematocrit was determined from blood samples after centrifugation. Mean arterial blood pressure was measured with a Micro-Med Analyzer (Micro-Med, Inc., Louisville, KY, U.S.A.) that had been calibrated with an air-damped mercury manometer. Arterial plasma glucose concentration was measured with a Glucose Analyzer 2 (Beckman Instruments, Fullerton, CA, U.S.A.).
All animal use procedures were in strict accordance with the NIH Guide for Care and Use of Laboratory Animals and were approved by the local Animal Care and Use Committee.
Experimental procedures
Arteriovenous differences across the cerebral cortex were determined for unlabeled glucose and lactate and also [6-14C]glucose and 14C-labeled metabolites when the rate of CMRglc was bilaterally stimulated by K+ in conscious normoxic rats. Arteriovenous differences were not determined in resting animals because it is well established that there is little efflux of lactate from normal control brain and that nearly all of the glucose consumed by brain is oxidized (e.g., Siesjö, 1978). Bilateral spreading cortical depression was induced in conscious rats by placement of cotton freshly soaked in 5 mol/L KCl on the exposed, intact dura and maintained by reapplication of KCl at 15 minutes (Shinohara et al., 1979). Within about 5 minutes after the first bilateral application of KCl the rats exhibited a marked forelimb (hindlimbs were restrained in a plaster cast) paraparesis and hypomyotonia that was maintained throughout the experimental period. About 20 minutes after induction of spreading depression (i.e., 5 minutes after the second KCl application) [6-14C]glucose (125 μCi/kg) was injected intravenously as a pulse, and timed blood samples were simultaneously withdrawn from the femoral artery and superior sagittal sinus into airtight, heparinized glass syringes at a rate of about 0.15 to 0.2 mL/min. Four pairs of samples were drawn at intervals after the pulse, each of approximately 2 minutes' duration (i.e., about 0 to 2, 2 to 4, 4 to 6, and 6 to 8 minutes after the pulse). Each sample was immediately injected through an air-tight rubber septum into weighed, sealed flasks containing 2.0 mL of 0.75 mol/L HClO4 and a hanging cup containing filter paper soaked with 0.2 mL of 1 N NaOH. The flasks were reweighed to determine blood volume, and shaken for 3 hours at room temperature to collect the 14CO2. The filter paper and cups were assayed for their 14C contents by liquid scintillation counting (Beckman Model 5801) using external standardization. The precipitated blood protein was separated from the supernatant fraction by centrifugation, and the acid extracts of blood were frozen until assayed for unlabeled and 14C-labeled metabolites as described below.
The patterns of labeling of cerebral cortex by [14C]deoxyglucose or [6-14C]glucose were determined in conscious rats with unilateral or bilateral spreading depression by quantitative autoradiography in 5- to 7-minute experiments for both tracers so that the labeling period was the same for both tracers. As previously determined, about 50% and 75% of the [14C]deoxyglucose in brain is phosphorylated by 5 to 7 minutes in the control and activated cerebral cortex, respectively, compared with about 80% and 90% metabolism of glucose in the control and activated cortex, respectively; the [14C]deoxyglucose autoradiographs, therefore, reflect mainly metabolism in the K+-activated tissue (Adachi et al., 1995). In brief, a pulse of tracer was injected intravenously at about 20 minutes after unilateral or bilateral KCl application, and timed samples of arterial blood drawn for determination of the integrated specific activity in plasma. At 5 to 7 minutes after the bolus of [14C]deoxyglucose or [6-14C]glucose, the animals were killed with an overdose of pentobarbital, brains quickly removed and frozen at about −45°C, and serial coronal sections cut, dried, and exposed to x-ray film (Sokoloff et al., 1977). Local 14C levels were determined with a microcomputer imaging device (MCID, Imaging Research, Ontario, Canada).
Separation of 14C-labeled metabolites in blood extracts
Portions of each perchloric acid extract from all 48 arterial and venous blood samples from six rats were applied to 1 mL (0.8 × 2.5 cm) Dowex 50-H+ columns at 4°C, and the columns were washed with 14 mL of ice-cold water to recover acidic and neutral compounds in the effluent fraction; amino acids and cationic compounds were then eluted from the columns with 14 mL of 2 mol/L HCl and 2 mol/L NaCl. The Dowex 50 column effluent fractions were adjusted to pH 7 to 8, their volumes determined, and portions applied to 1.4 mL (0.8 × 3.3 cm) Dowex 1-formate columns to separate [14C]glucose and other neutral compounds from acidic compounds. The Dowex 1 columns were washed with 14 mL of ice-cold water to recover the nonacidic compounds in the effluent fraction, then acidic compounds were eluted with 14 mL of 2 mol/L HCl and 2 mol/L NaCl; final volumes of each fraction were determined. Portions of the column effluent and eluate fractions were assayed for their 14C contents by liquid scintillation counting. Recoveries of 14C from the columns averaged 100.0% ± 3.3% (mean ± SD, n = 61).
Determination of labeled and unlabeled glucose and lactate in extracts of blood
[14C]Glucose and 14C-labeled lactate in each of 40 acid extracts of whole arterial and venous blood from five of the six rats were separated on a CarboPac PA1 anion exchange column with a Dionex BioLC HPLC System equipped with a pulsed amperometric detector (Dionex Corp., Sunnyvale, CA, U.S.A.) using the elution schedule designed to separate hexoses from their metabolites in extracts of brain, i.e., 0.085 mol/L NaOH from 0 to 15 minutes, 0.1 mol/L NaOH plus 0.4 mol/L sodium acetate from 15.1 to 30 minutes, and 0.2 mol/L NaOH from 30.1 to 45 minutes (Adachi et al., 1995). Samples were collected at either 0.5- (between 4 and 8 minutes) or 1-minute intervals, acidified with glacial acetic acid, and assayed for their 14C contents by liquid scintillation counting; recovery of 14C in tissue samples from the CarboPac column was approximately 100%. Glucose eluted at about 6 minutes, and its acidic derivatives were recovered in later-eluting fractions. Unlabeled glucose in the extracts was detected with the pulsed amperometric detector, and its concentration in each sample was quantified by comparison of the area under the peak with those obtained from standards; similar values were obtained for unlabeled glucose when assayed with hexokinase and glucose-6-phosphate dehydrogenase (Lowry and Passonneau, 1972). Because tissue samples contain unlabeled and labeled compounds that might coelute with glucose, portions of some samples were separated before and after derivatization of the glucose with ATP and hexokinase. Virtually all of the 14C and the unlabeled compounds recovered in the glucose fraction were converted to glucose-6-phosphate.
We previously calibrated elution times of selected organic acids and amino acids (compounds that are not detected with a pulsed amperometric detector) with 14C-labeled lactate, alanine, glutamine, glutamate, α-ketoglutarate, and pyruvate (Adachi et al., 1995). 14C-Labeled alanine and glutamine eluted at 4 to 5 minutes, [14C]lactate eluted at 10 to 12 minutes, and 14C-labeled glutamate, pyruvate, and α-ketoglutarate, and unlabeled glucose-6-phosphate all eluted at 18 to 20 minutes. The 14C in extracts of whole blood labeled in vivo with [14C]glucose that was recovered in the same HPLC fraction as the [14C]lactate standard was confirmed to be labeled lactate by incubation of samples with NAD, glutamate, lactate dehydrogenase, and glutamate-pyruvate transaminase (Lowry and Passonneau, 1972) to convert the labeled lactate sequentially to pyruvate and then to alanine that could be recovered in the HPLC fraction eluting at 4 to 5 minutes. The quantities of unlabeled lactate in extracts of blood were determined with the enzymatic assay and measurement of NADH fluorescence.
Movement of 14C-labeled lactate and inulin within brain
Rats were maintained under halothane (1.5% in 70% N2O, 30% O2) anesthesia throughout the experimental procedure. A burr hole was drilled through the skull about 6 mm anterior to the lambdoid suture and 2 mm to the left of midline, and a 1-μL Hamilton syringe (No. 700, 26-gauge needle, 0.48 mm in diameter) was inserted into the tissue to a depth of either 2 or 6 mm from the surface of the skull. Then 0.5 μL of [14C(U)]lactate or [14C]inulin (0.05 μCi dissolved in 0.9% NaCl, 10 mmol/L sodium phosphate buffer, pH 7.2 to 7.4) was slowly injected over a 2-minute interval, i.e., at a rate of about 0.25 μL/min, and allowed to spread from the injection site for 8 minutes, the period of time corresponding to the total duration of the assays to determine arteriovenous differences (see above). To minimize leakage of injectant, the needle was not withdrawn until about 30 seconds before the rat was killed by decapitation, i.e., at 10.2 ± 0.1 minutes after initiating the injection. The brains were rapidly removed, frozen in isopentane at about −45°C, and stored at −80°C until cut into 20-μm-thick coronal sections in a cryostat at about −20°C. The sections were immediately dried on a hot plate at about 60°C, and four of every 10 sections were exposed to SB-5 Medical x-ray film (Kodak, Rochester, NY, U.S.A.). In each autoradiograph the areas of high optical density corresponding to the location of 14C-labeled compounds were measured with a Microcomputer Imaging Device (Imaging Research Inc., Brock University, St. Catherines, Ontario, Canada) calibrated with area and spatial distance standards. The mean area for each group of four consecutive 20-μm-thick serial sections was used to calculate the volume for that set of 10 sections (i.e., a 0.2-mm-thick piece of tissue); the sum of these values gave the total volume of labeled tissue for each animal. There was sometimes labeling of subdural or periventricular tissue caused by obvious leakage of injectant along the needle track to the brain surface or into a ventricle; values obtained from these animals were not included with results from animals in which there was no such leakage. The maximal distance from the injection site that the labeled tracer moved was calculated as half the distance between the limits of detectable 14C in the caudal-to-rostral direction, determined from the number and thickness of 14C-labeled sections.
RESULTS
Physiologic variables
All rats were normoxic before and during spreading cortical depression. Application of KCl did not alter PaO2, PaCO2, and pH in arterial blood (P > 0.08, paired t test). Values (means ± SD, n = 6) obtained before and 24 minutes after KCl application, respectively, were PaO2, 89.7 ± 1.8 and 90.6 ± 1.3 mm Hg; PaCO2, 37.8 ± 0.9 and 38.7 ± 0.4 mm Hg; and pH, 7.43 ± 0.01 and 7.41 ± 0.01.
Lactate accounts for most of the 14C lost from brain to blood during spreading depression
Newly synthesized (i.e., 14C-labeled) lactate exported to the extracellular space can traverse the blood-brain barrier for clearance by blood, be taken up and further metabolized by neighboring cells, or spread to other regions within the brain for removal or metabolism. Lactate transport from brain to blood was previously established to be very low in normal, resting adult rat brain (i.e., less than 5% of glucose uptake; Hawkins et al., 1973; Siesjö, 1978), but other studies suggested that when CMRglc is stimulated there might be rapid loss of lactate from brain to blood (Collins et al., 1987; Ackermann and Lear, 1989, 1993; Adachi et al., 1995). Efflux of labeled compounds derived from [6-14C]glucose into cerebral venous blood was, therefore, examined by determining arteriovenous differences across the cerebral cortex of conscious rats during an 8-minute interval, starting at about 20 minutes after induction of bilateral spreading cortical depression. Serial pairs of samples of arterial and cerebral venous blood were drawn at 2-minute intervals, and each sample was fractionated to separate CO2, acidic, basic, and neutral compounds; arteriovenous differences were then determined for each of these four major classes of compounds in each of the four sample pairs from each of six rats. Negative arteriovenous differences for labeled acidic metabolites were detected within 2 minutes after the pulse of [6-14C]glucose, and larger quantities were lost during subsequent sampling intervals (Fig. 1). Labeled acidic compounds accounted for 95.9% ± 2.3% (mean ± SD, n = 6) of the total 14C lost from the brain. Analysis of separate portions of the paired arterial and venous samples demonstrated that lactate is the major 14C-labeled acidic metabolite lost from brain to blood. Arteriovenous differences for total 14C were nearly the same as those for 14C-labeled lactate that was purified by HPLC, and all of the 14C-labeled compounds recovered in the HPLC fraction containing lactate could be removed by enzymatic derivatization of lactate in vitro before analysis (data not shown; see Methods).
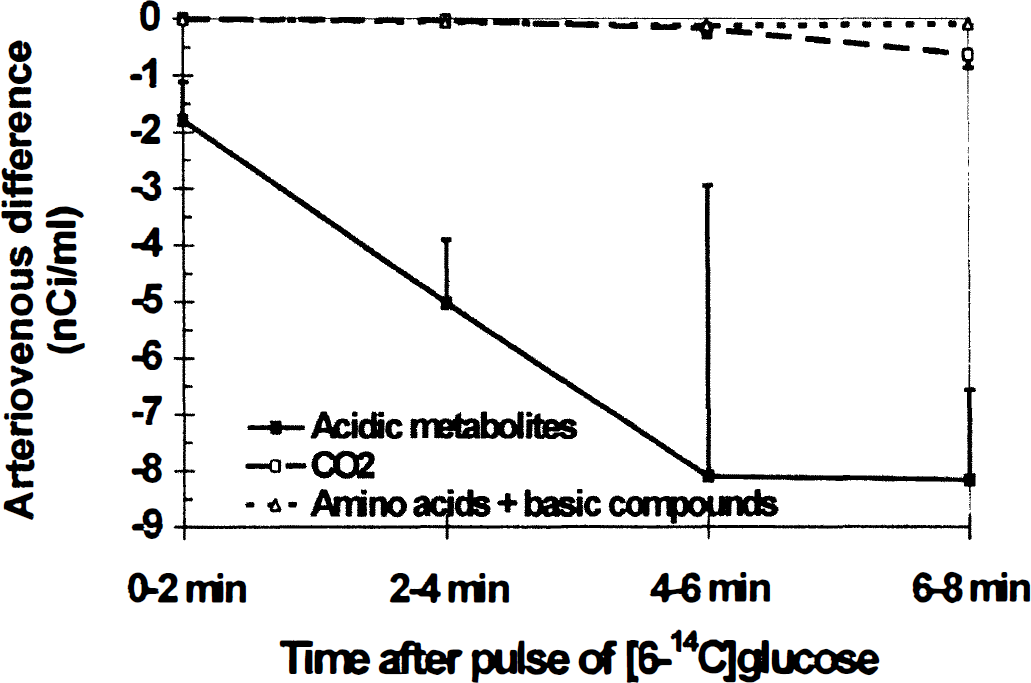
Temporal profiles of efflux of labeled metabolites of [6-14C]glucose from brains of conscious, normoxic rats to cerebral venous blood during bilateral spreading cortical depression. Spreading cortical depression was induced and maintained by topical application of KCl to the intact dura of conscious rats for 20 minutes before an intravenous pulse of [6-14C]glucose. Four timed, sequential pairs of samples of arterial and cerebral venous blood were simultaneously drawn over approximately 2-minute intervals and assayed for their contents of 14C-labeled CO2, acidic metabolites, and amino acids plus basic compounds; arteriovenous differences for each class of compounds were determined in each pair of samples (see Methods). Negative values indicate efflux from brain to blood. Points are means; vertical bars represent 1 SD (n = 6). Arteriovenous differences were statistically significantly different from zero (t test) for acidic metabolites at all times (P < 0.05 at 0 to 2 and 4 to 6 minutes; P < 0.01 at 2 to 4 and 6 to 8 minutes), 14CO2 at 4 to 6 (P < 0.05) and 6 to 8 (P < 0.01) minutes, and amino acids plus basic compounds at 6 to 8 minutes (P < 0.01).
Outflow of other labeled derivatives of [6-14C]glucose from brain during spreading cortical depression was low and slow. Flux of 14CO2 to blood gradually increased with time after the pulse, and accounted for 3.3% ± 1.8% of the 14C loss (Fig. 1); 14CO2 release was probably delayed because of dilution of 14C in the large unlabeled amino acid pools. Loss of labeled amino acids plus basic compounds was negligible, i.e., 0.8% ± 0.7% of total 14C (Fig. 1). A few pairs of samples were also assayed for labeled neutral metabolites of [14C]glucose (e.g., sorbitol); after removal of [14C]glucose by derivatization to [14C]glucose-6-phosphate with hexokinase, arteriovenous differences for labeled neutral compounds were negligible (data not shown). To summarize, transport of labeled lactate from cerebral cortex to blood was rapid and continuous, and accounted for nearly all of the 14C lost from brain during the 8-minute experimental interval.
Glucose and lactate fluxes between blood and brain
Levels of glucose and lactate were also assayed in all of the timed pairs of samples of arterial and cerebral venous blood from five of the six rats to estimate the fraction of unlabeled and labeled glucose carbon leaving the brain as lactate. The arterial blood levels of unlabeled glucose (Fig. 2A) and lactate (Fig. 2B) in the conscious rats were within the normal range and essentially constant between 20 to 28 minutes after initiation of bilateral spreading cortical depression; the mean (± SD, n = 20) values for the entire sampling interval were 7.32 ± 1.67 and 0.87 ± 0.34 μmol/mL for glucose and lactate, respectively. The levels of [6-14C]glucose in arterial and venous blood were highest just after the intravenous pulse of tracer, and gradually decreased with time (Fig. 2C). Appearance of 14C-labeled lactate in cerebral venous blood gradually increased with time, whereas that in arterial blood was stable between 2 and 8 minutes (Fig. 2D).
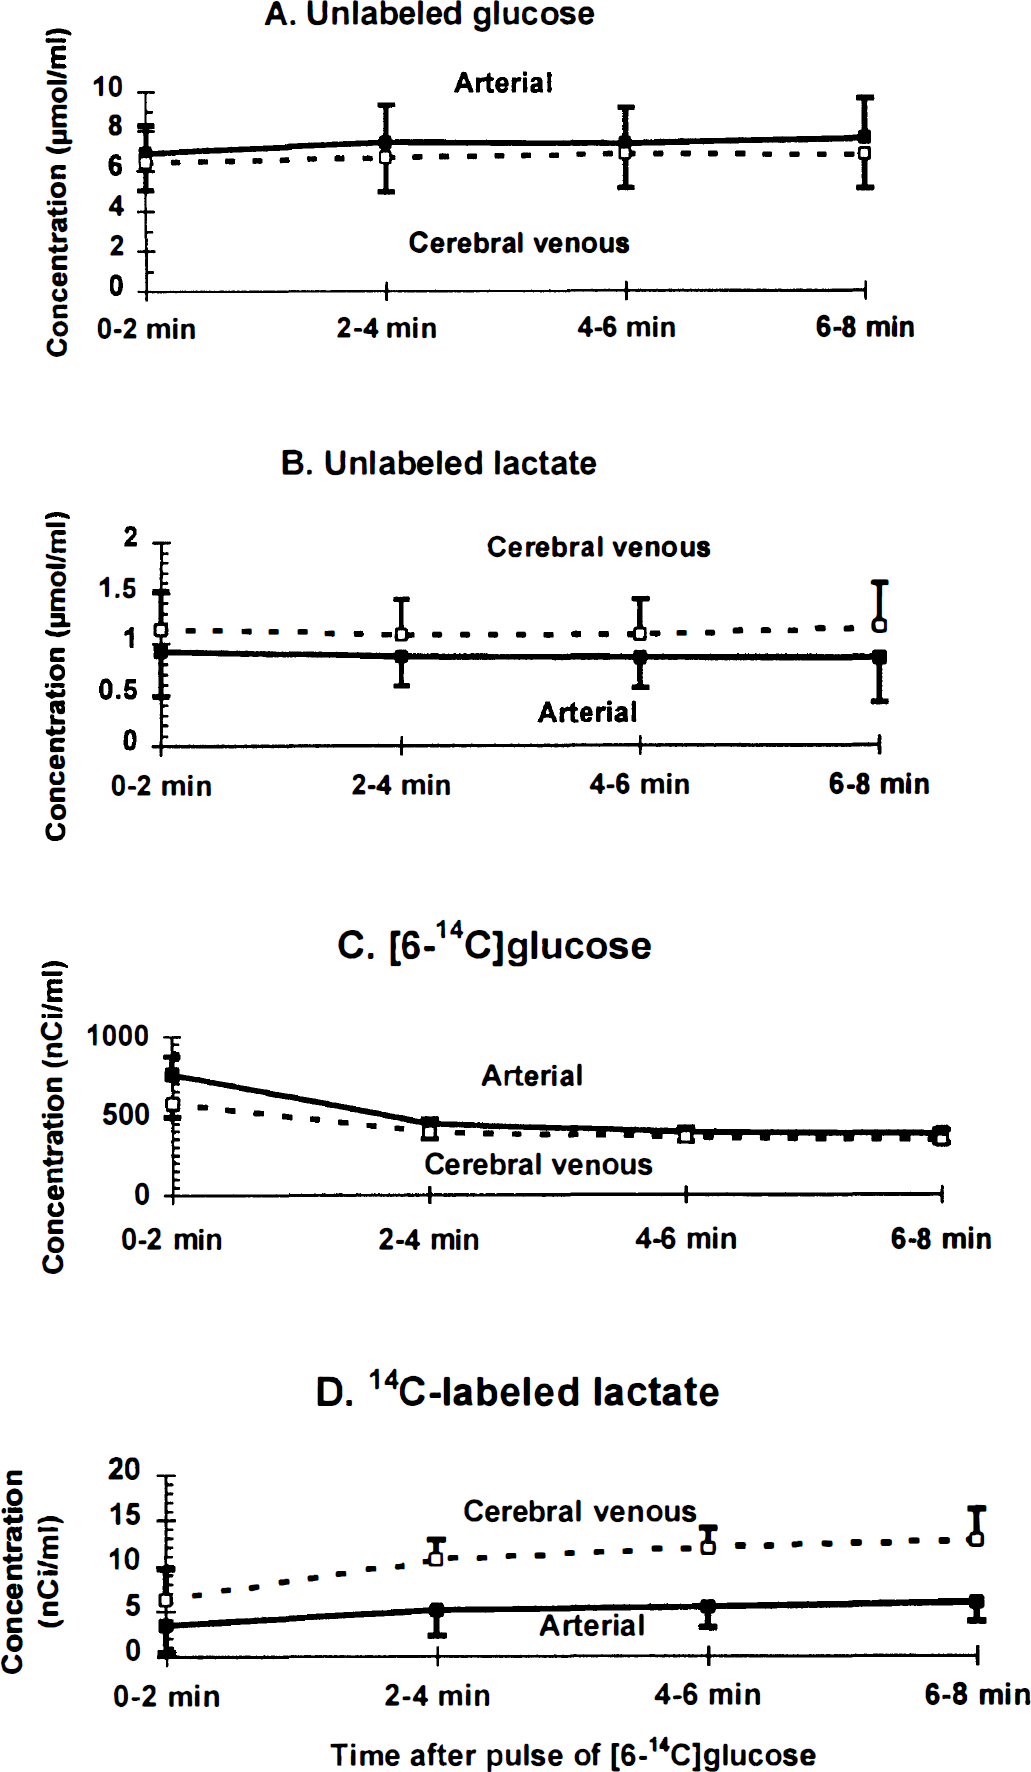
Blood levels of glucose and lactate during bilateral spreading cortical depression. The concentrations of unlabeled
After a short lag, the fractional efflux of [14C]lactate from cerebral cortex to venous blood equaled that of unlabeled lactate. The blood levels (Fig. 2A and B) and arteriovenous differences (i.e., 0.62 ± 0.16 and −0.27 ± 0.13 μmol/mL, respectively; mean ± SD, n = 20) (Fig. 3A) for unlabeled glucose and lactate were nearly constant throughout the 8-minute experimental interval, indicating that these metabolites were close to steady-state conditions in blood; efflux of lactate to blood, therefore, corresponded to 22% ± 12% of the glucose entering the brain (Fig. 3C). An equivalent proportion (i.e., 21% ± 7%) of [6-14C]glucose entering brain was also lost as [14C]lactate between 2 and 8 minutes after the pulse of tracer (Figs. 3B and 3C; also see Fig. 1 [note the different scale]). Because the relative losses of labeled and unlabeled glucose from brain to blood were similar (Fig. 3C), and the specific activity of brain lactate was approximately half that of blood and brain glucose (Adachi et al., 1995), brain glycogen was probably not a significant precursor of the lactate flowing into cerebral venous blood during the sampling period; conversion of unlabeled glycogen to lactate (Dringen et al., 1993) would reduce the specific activity of brain lactate and diminish the loss of 14C-labeled lactate to blood. To summarize, during spreading depression there is a large (i.e., greater than fourfold) increase in the rate of efflux of unlabeled lactate from brain under steady-state conditions in blood. The newly synthesized lactate entering cerebral venous blood was derived from blood-borne [6-14C]glucose; this lactate was produced intracellularly in brain, traversed the cell membrane to the extracellular space, and crossed the blood-brain barrier for clearance. The rapid, continuous outflow of approximately equivalent amounts of unlabeled lactate and 14C-labeled (newly synthesized) lactate constitutes enhanced trafficking of lactate from brain cells.
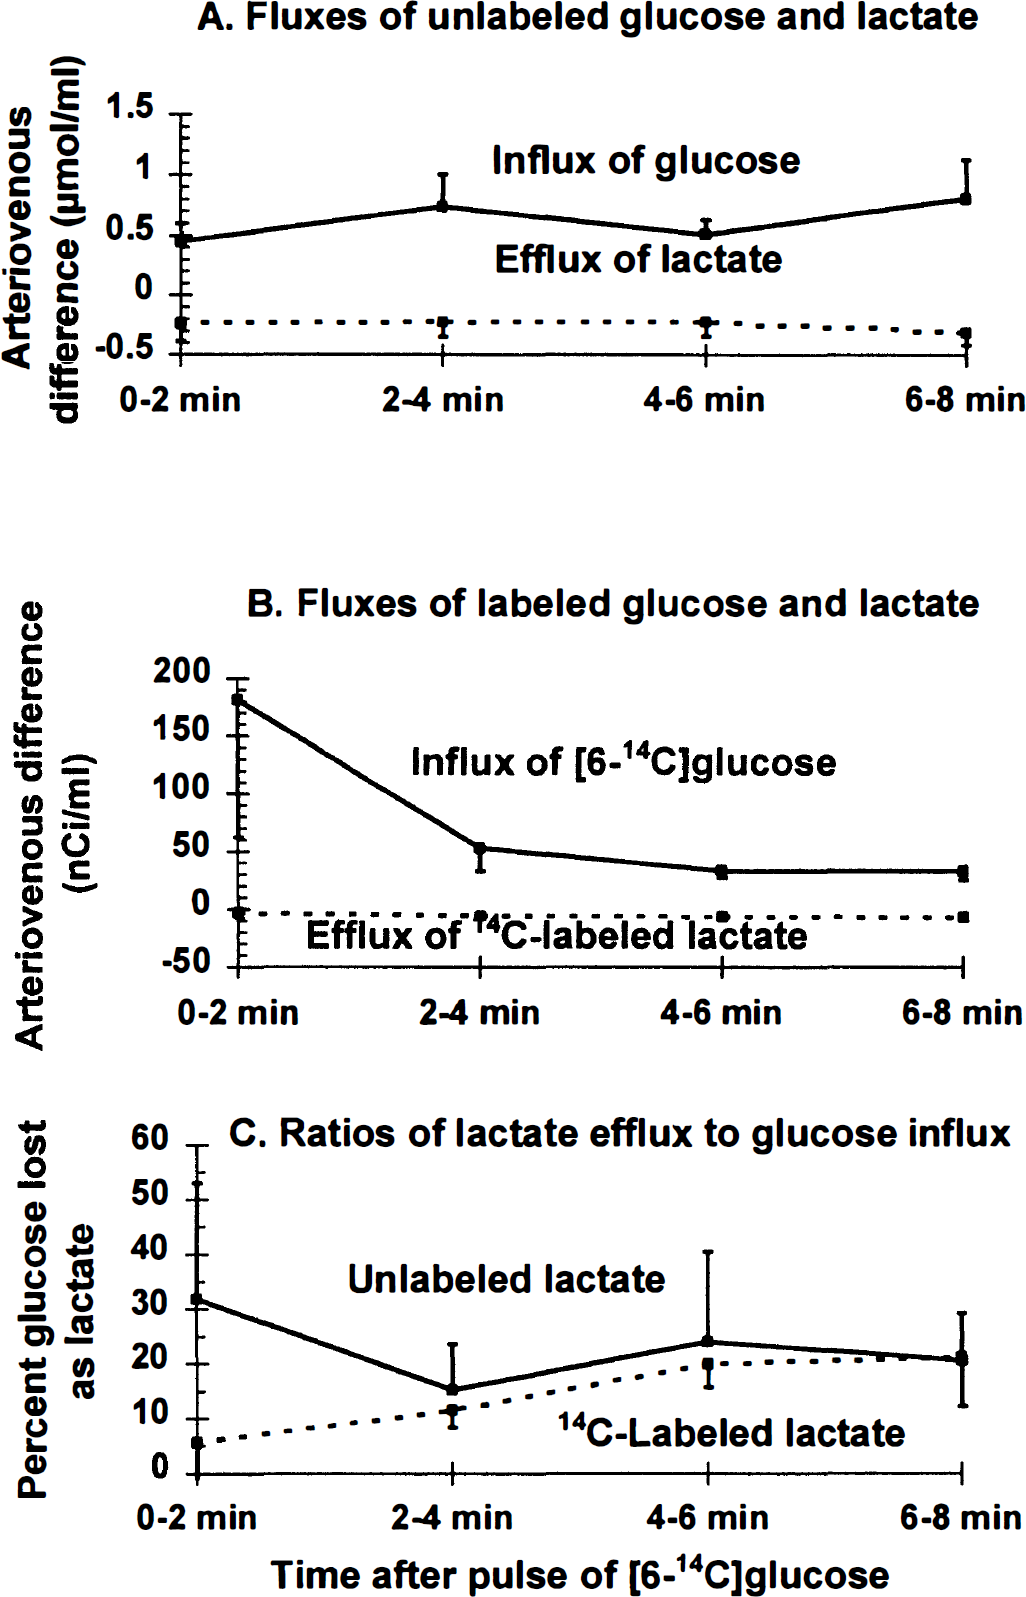
Transport of lactate from brain to cerebral venous blood during bilateral spreading cortical depression. Arteriovenous (A-V) differences were determined for unlabeled
Movement of 14C-labeled lactate and inulin within brain
Rapid transport of labeled lactate across the blood-brain barrier contributes to the low value for calculated CMRglc during spreading cortical depression when assayed with [6-14C]glucose (i.e., 50% underestimation; Adachi et al., 1995), but accounts for less than 45% of the magnitude of underestimation of CMRglc (i.e., lactate efflux was, on average, 21% of glucose influx; Figs. 1, 2 and 3). Because the blood-brain barrier in adult rats is less permeable to lactate than neural cellular membranes are (Drewes and Gilboe, 1973; Cremer et al., 1979; Kuhr et al., 1988; Lear and Kasliwal, 1991; Nedergaard and Goldman, 1993), a large fraction of the lactate entering the brain extracellular space could be expected to be retained within the brain. Some of this label was retained in the K+-activated cerebral cortex but not in quantities sufficient to accurately register the increase in CMRglc during spreading depression.
Spreading of endogenously produced 14 C-labeled metabolites of [6- 14 C]glucose. [14C]Deoxyglucose is phosphorylated to [14C]deoxyglucose-6-phosphate by hexokinase and trapped intracellularly; by 5 to 7 minutes, about 75% of the deoxyglucose is phosphorylated in the K+-activated tissue compared with about 50% in the contralateral hemisphere (Adachi et al., 1995). Autoradiographs obtained from rats with unilateral spreading cortical depression and labeled with [14C]deoxyglucose during a 5- to 7-minute experimental period were heterogeneous (Fig. 4, top panels). The highest levels of 14C were in the dorsal (i.e., <0.25 mm from the cortical surface) and ventral (i.e., about 0.9 to 1.5 mm below the surface) regions of K+-activated, ipsilateral cerebral cortex, whereas the middle zone (i.e., about 0.5 to 0.75 mm from the cortical surface) of the K+-treated hemisphere was less strongly labeled (Fig. 4, top right panel). By visual inspection of the autoradiographs, this bimodal labeling pattern was variable but evident throughout the activated cerebral cortex (i.e., not restricted to the coronal sections near the KCl application site; data not shown), and it did not occur in the contralateral untreated cortex (Fig. 4, top left panel). Similar results were obtained in two rats with the routine 45-minute experimental period for deoxyglucose (data not shown). The dorsalto-ventral labeling profiles were variable, and average laminar changes in 14C concentration throughout the entire brain or from various cortical regions in different rats were therefore not determined. However, increased metabolic activity was most prominent in the ventral cortical layers in all of the animals; when assayed by computer-assisted densitometry, the 14C concentration ranged from about 1.7 to 2.5 times that of the ventral zone in the untreated control cortex (Fig. 4, top right panel). The middle zones of the K+-treated hemispheres had 14C concentrations similar to or higher than those in the corresponding contralateral untreated hemispheres, i.e., this region is not hypometabolic. In the dorsal zone, large left-right differences were observed in four of the six animals (Fig. 4, top right panel), but the dorsal region was not heavily labeled in two rats.
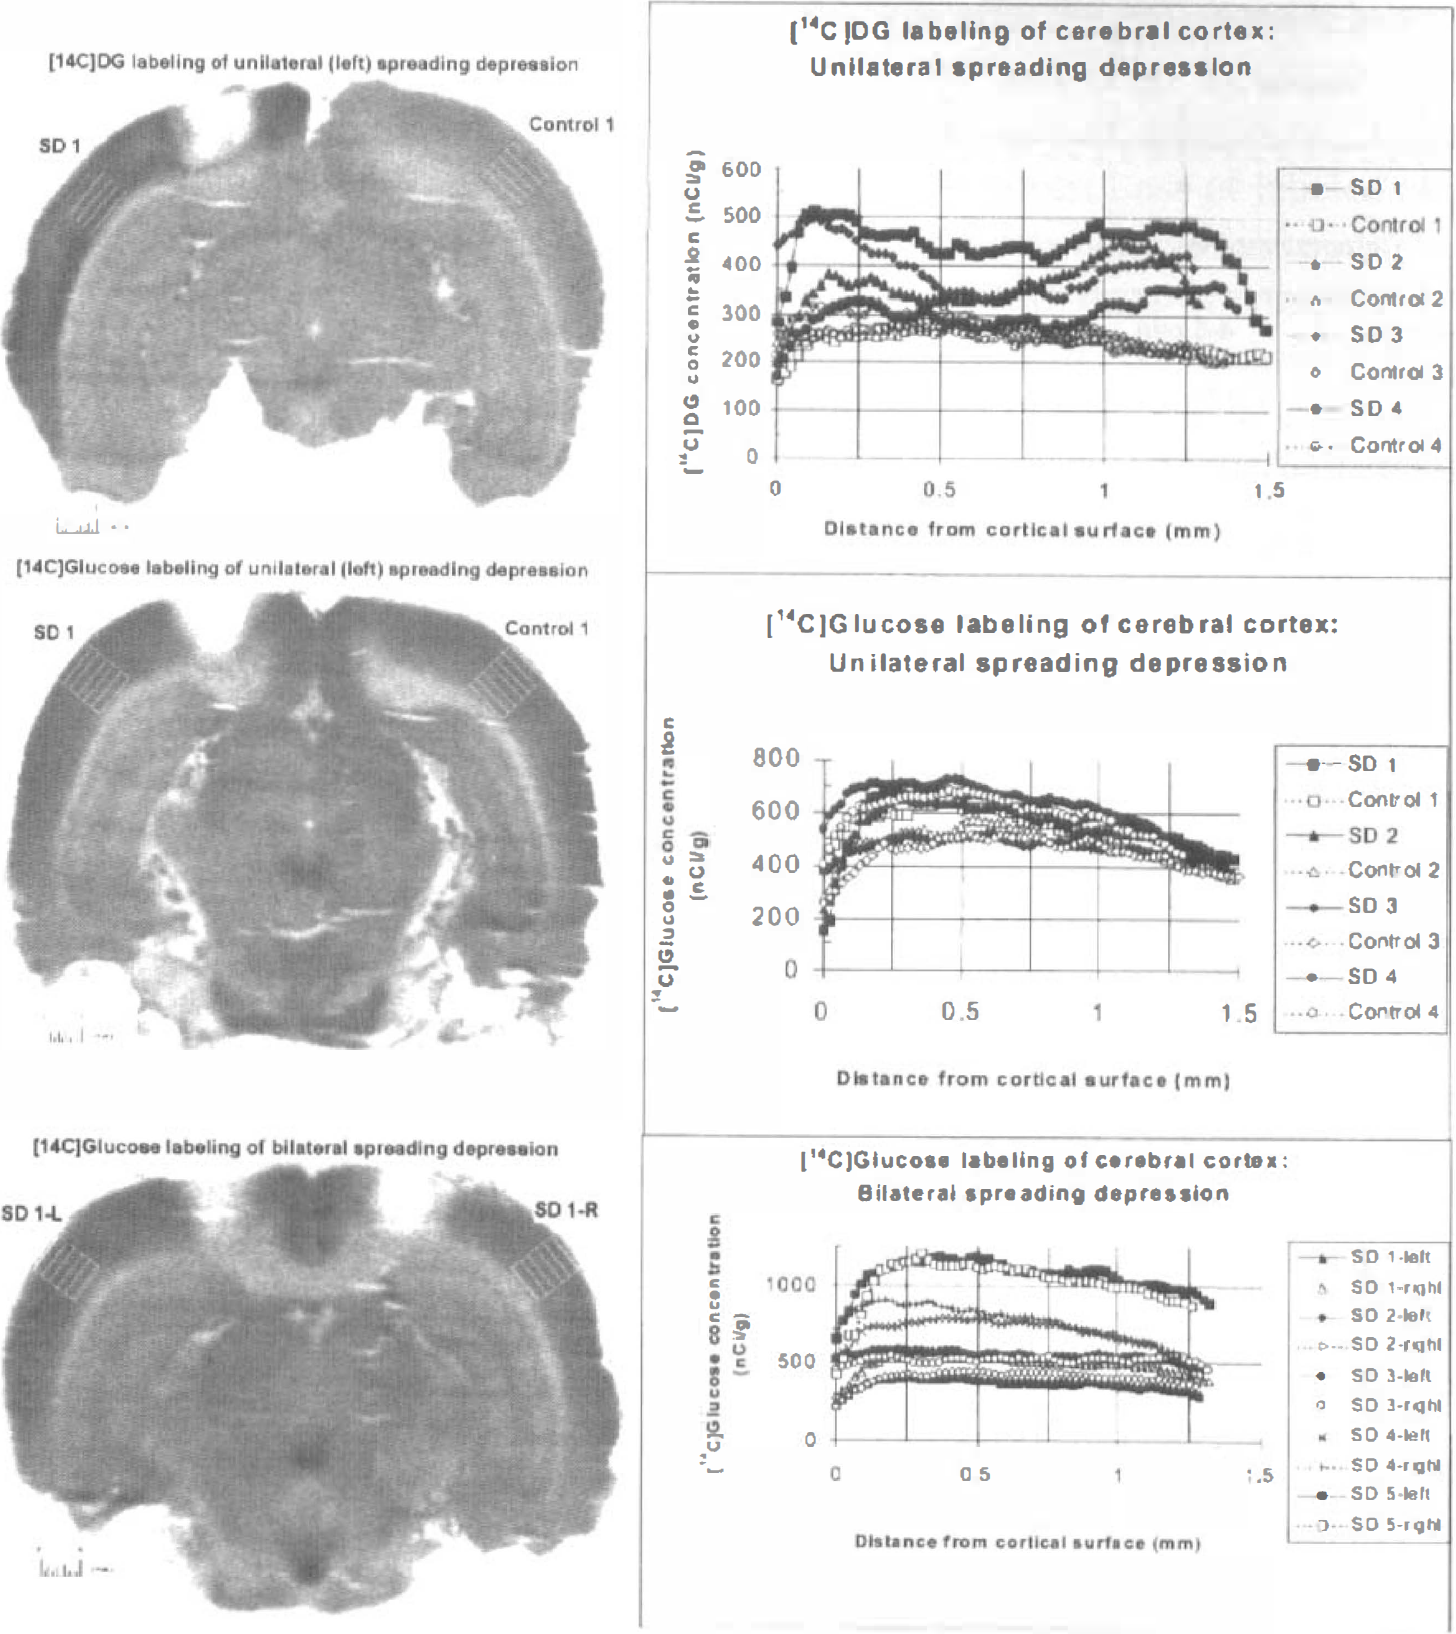
Labeling patterns obtained during spreading cortical depression with [14C]deoxyglucose and [6-14C]glucose. Rats were injected with [14C]tracer at 20 minutes after topical application of KCl to the exposed dura of the cerebral cortex; the experimental period was 5 to 7 minutes for both tracers (see Methods). The left panels are representative autoradiographs of unilateral or bilateral spreading depression at the level of the KCl application sites; the application sites are the areas with very low optical density located in the dorsal cerebral cortex approximately 1 mm lateral to the midline in the left cortex (top and middle panels) or in both the left and right cortex (bottom panel). The grid boxes in each of the autoradiographs identify the regions in which dorsal-to-ventral 14C concentration gradients in cerebral cortex were determined by computer-assisted densitometry (see Methods) and illustrated in the graphs in the corresponding right panels. The parallel lines in the grid boxes in the autoradiographs are spaced at 0.25-mm intervals and correspond to the gridlines spaced at 0.25-mm intervals in the abscissa in the graphs. The right panels illustrate dorsal-to-ventral profiles of the 14C concentration gradients for left and right cortex of four to five rats. Numbers identify results from different animals; the data identified as rat 1 in each right panel are the profiles for the left and right cortex of the autoradiograph in the corresponding left panel; for clarity, data from all six rats per group are not shown. The hemispheres subjected to spreading depression are denoted by the abbreviation “SD” that are identified by filled symbols (or “×” or “+” in one of the rats with bilateral KCl application); control indicates the untreated hemisphere, identified by open symbols. The left and right hemispheres in rats with bilateral spreading depression in bottom left panel are denoted by L and R, respectively. The tissue 14C levels were not normalized to the integrated specific activity in arterial plasma in each animal and, therefore, reflect differences in the amount of tracer injected into each animal; these animal-to-animal variations in tissue 14C content are most evident in the [14C]glucose-injected rats and separate the dorsal-to-ventral concentration profiles from the various animals (lower panel).
In sharp contrast to the results obtained with [14C]deoxyglucose, the labeling patterns obtained with [6-14C]glucose during unilateral spreading cortical depression were similar in the activated and untreated cerebral cortex (Fig. 4, middle left panel), and there were no marked left-right differences in the most ventral cortical layers (Fig. 4, middle right panel). Induction of spreading depression in both hemispheres did not alter this labeling pattern (Fig. 4, bottom panels). In rats subjected to either unilateral or bilateral spreading depression the middle cortical zone had 14C concentrations equivalent to or higher than the those in the more superficial or deeper layers (Fig. 4, middle and bottom right panels). These results suggest rapid spreading of labeled metabolites of glucose, presumably lactate, from the more hypermetabolic dorsal and ventral cortical layers to the less active midcortical areas, thereby reducing the apparent CMRglc in the activated regions and enhancing apparent CMRglc in the neighboring zones (compare glucose and deoxyglucose autoradiographs, Fig. 4). In spite of any intracortical trapping of labeled metabolites, the 50% underestimation of CMRglc with [6-14C]glucose in K+-activated tissue (Adachi et al., 1995) (i.e., failure to trap labeled metabolites is reflected by the small left-right differences in the [6-14C]glucose autoradiographs, Fig. 4) and recovery of only about half the quantity of labeled glucose metabolites in cerebral venous blood (i.e., equal to about 20% of the glucose uptake, Figs. 1, 2 and 3) indicates that there must have been efflux of an equally large quantity of 14C from cerebral cortex to other brain regions or clearance of labeled metabolites by routes not sampled by the sagittal sinus, or both.
Spreading of injected labeled tracers. As a first step in assessment of the potential range of lactate spreading in brain in vivo, tracer amounts of 14C-labeled lactate or inulin were directly injected into brains of halothane-anesthetized rats and the volume of tissue labeled within 10 minutes assayed. Spreading of [U-14C]lactate and its labeled derivatives through the tissue fluid space can be restricted by uptake into cells and intracellular trapping caused by further metabolism and also by efflux from brain across the blood-brain barrier. On the other hand, inulin is an uncharged, nonmetabolizable polymer composed of D-glucose plus D-fructose (MW ≈ 5,000) that is restricted to the extracellular space; it was used to estimate the range of tracer movement in the interstitial fluid. The upper panel of Fig. 5 illustrates the volume of tissue labeled by [U-14C]lactate in serial coronal sections in each of six rats as a function of rostral-to-caudal distance from the injection site (peak value); radial spreading of 14C from the injection site was similar in the rostral and caudal directions in four of the six rats. The volume of labeled tissue (8.4 mm3) was, on average, 17 times greater than that of the injectant (i.e., 0.5 μL), and the 14C derived from [U-14C]lactate and any of its labeled metabolites moved as far as 1.5 mm from the injection site within 10 minutes (Fig. 5, upper panel); the mean distance at half peak height was about 0.9 ± 0.2 mm (mean ± SD, n = 6). In four additional animals, there was some leakage of tracer along the needle track or entry of tracer into the ventricular or subarachnoid spaces; the distance from the injection site and volume of labeled tissue were much higher when the tracer was able to spread within brain through the cerebrospinal fluid system (labeling profiles are not shown; see legend to Fig. 5). The relationship of lactate spreading to the size of various anatomic structures of rat brain is illustrated in the lower panel of Fig. 5 and shows that lactate can move from a point source to the dorsal and ventral boundaries of the cerebral cortex within 10 minutes. Lactate spreading within brain is, therefore, sufficiently extensive that it could have caused the uniform labeling pattern obtained with [6-14C]glucose in the K+-activated tissue (compare Figs. 4 and 5) as well as loss of label from the activated cerebral cortex to other brain structures.
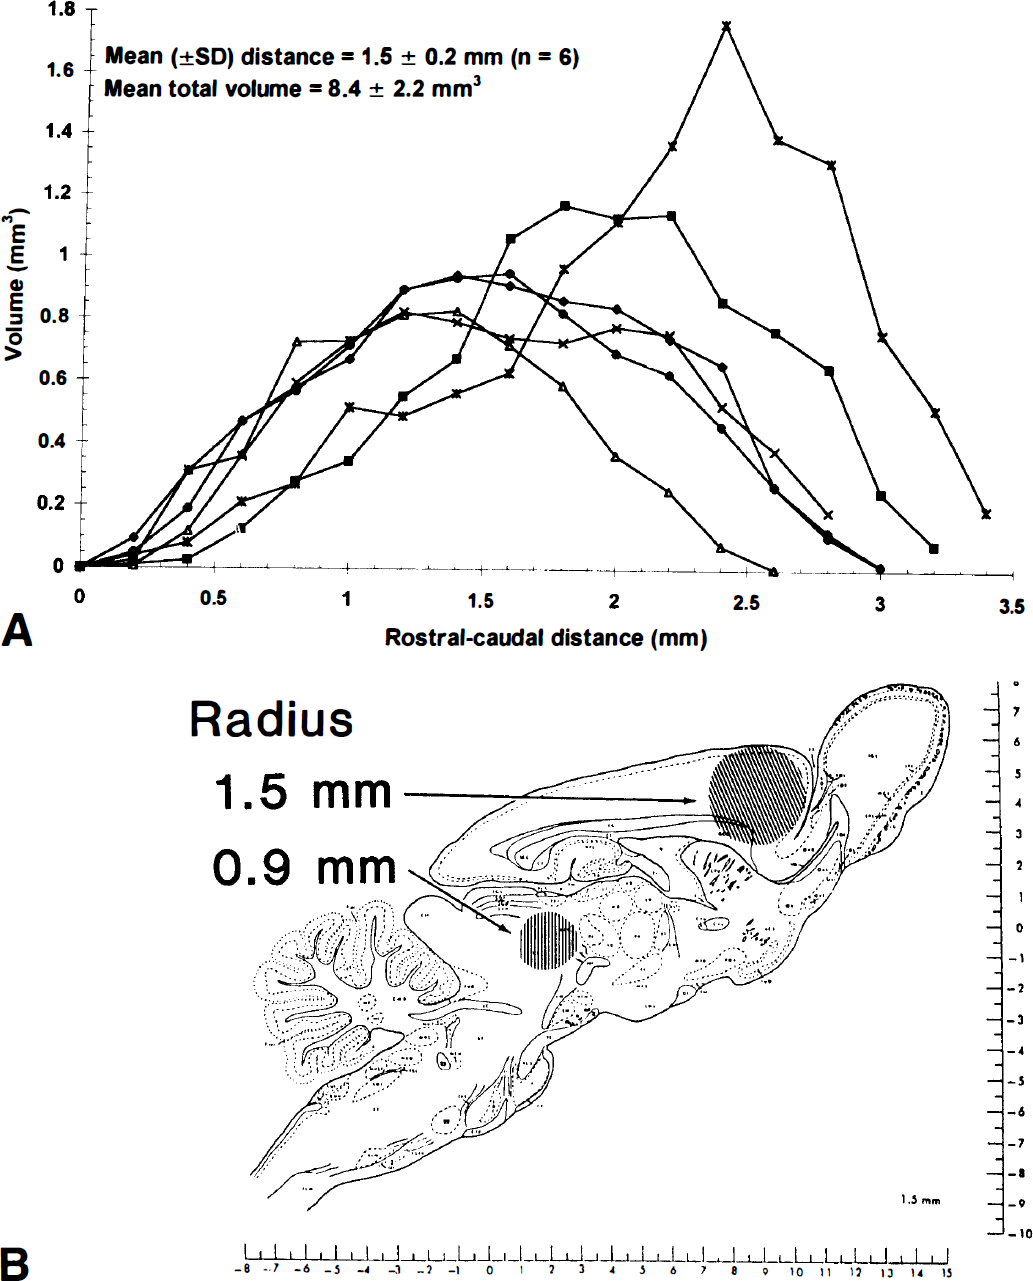
Lactate spreading within brain.
When [14C]inulin was the tracer, both the maximal distance from the injection site (2.4 ± 0.9 mm, mean ± SD, n = 5) and the volume of labeled tissue (51.0 ± 13.7 mm3; 102 times the volume of the injectant, i.e., 0.5 μL) were much greater than the respective values for lactate. Thus, restriction of the tracer to the extracellular space led to a 1.6-fold increase in maximal distance spread from the injection site and a sixfold higher volume of labeled tissue, even with a large increase in the size of the tracer.
DISCUSSION
Range and consequences of metabolite trafficking
Fate of additional glucose consumed during spreading depression. Rapid, continuous production and efflux of lactate from K+-activated tissue in normoxic, conscious animals is a prominent feature of spreading cortical depression. The results of our previous (Adachi et al., 1995) and present studies suggest that most of the additional glucose consumed by the activated compared with contralateral untreated cerebral cortex between 20 and 28 minutes after initiation of spreading cortical depression was converted to lactate and quickly lost from K+-activated tissue. Efflux of other labeled compounds, including other acidic compounds, amino acids, and 14CO2, was delayed and low. A high rate of lactate synthesis and loss was unexpected because these rats had normal, adequate levels of blood oxygen, and oxidative metabolism and oxygen consumption are known to increase during spreading depression (Rosenthal and Somjen, 1973; Mayevsky and Chance, 1974; Mayevsky and Weiss, 1991); the duration of spreading depression in the present study (i.e., 28 minutes) might have influenced the magnitude of lactate production. Oxidative metabolism was not assessed in the present study and elevated CMRO2 is not ruled out; regardless of any changes in CMRO2, lactate production and efflux increased substantially.
Trafficking of newly synthesized lactate. Concentration gradients emanating from lactate-producing cells would be dissipated by various transport mechanisms, including diffusion and carrier-mediated transport across cell membranes and the blood-brain barrier, diffusion in the extracellular space, bulk flow of cerebrospinal fluid, and perivascular flow (Fenstermacher et al., 1974; Szentistvanyi et al., 1984; Nicholson, 1985; Rennels et al., 1985; Bradbury et al., 1981; Ichimura et al., 1991; Ghersi-Egea et al., 1996). Whether lactate spreading is mainly by means of diffusion, bulk flow, or carrier-mediated transport processes remains to be established; in the latter case, the transport would be influenced by the lactate concentration and the kinetic properties, location, and quantity of monocarboxylic acid transporters.
Efflux of lactate from extracellular fluid to blood is readily determined relative to glucose influx in the same arteriovenous sample, but movement within brain is complex and difficult to assess quantitatively. Lactate and inulin spreading within brain of anesthetized rats are illustrated in the lower panel of Fig. 5 to show the potential range of tracer movement and impact on CMRglc in the autoradiographs shown in Fig. 4. The circles have diameters that correspond to 60% (i.e., 0.9 mm, the distance at half peak height) and 100% (i.e., 1.5 mm) of the maximal distance for lactate movement within 10 minutes in anesthetized rats; 1.5 mm is also about 60% of the maximal distance (i.e., 2.4 mm) for movement of the inulin. The smaller circle clearly exceeds the size of many brain structures, and 1.5 mm is at least half the thickness of the rat cerebral cortex (Fig. 5, lower panel); note that the dorsal-to-ventral thickness of the cerebral cortex varies throughout the brain (see Figs. 4 and 5). Thus, lactate trafficking could have caused the relatively homogeneous optical density of the K+-activated cortex in [14C]glucose autoradiographs, which sharply contrast the higher labeling of the superficial and deep cortical layers by [14C]deoxyglucose (Fig. 4). The magnitude of the extracellular volume at the injection site can influence the tissue concentration profiles as a function of distance (Morrison and Dedrick, 1986; Dykstra et al., 1992), but [14C]lactate concentration as a function of distance was not determined in the present study. It is not known how anesthesia would affect the extent of metabolite spreading. The volume of tissue labeled by lactate might increase during anesthesia because of reduced metabolism and lower local trapping or increased clearance across the blood-brain barrier; on the other hand, reduced blood flow in anesthetized rats might diminish any pulsatile-dependent spreading. To resolve this issue, a procedure (e.g., infusion by microdialysis) that allows comparisons between conscious and anesthetized rats must be used. Regardless of the degree of correspondence of the magnitude of spreading in the conscious and anesthetized animals (Figs. 4 and 5), large amounts of lactate were lost from the activated tissue in conscious rats. Because lactate was the major product lost from brain (Figs. 1, 2 and 3), the structures highly labeled by [14C]deoxyglucose but not by [14C]glucose probably produced the most lactate (Fig. 4), supporting the use of these two tracers to detect brain regions that synthesize and export lactate (Ackermann and Lear, 1989; Lear and Ackermann, 1989). However, calculated CMRglc and lactate production in brief autoradiographic studies should be interpreted with caution because of inaccuracies in the estimate that can arise from uncertainties in the true values of the rate constants and the strong influence of rate constants on calculated metabolic rates in such experiments (Sokoloff, 1982; also see below).
Metabolite trafficking through brain tissue is illustrated by movement of lactate and inulin, but it is unlikely to be restricted to these compounds. For example, sucrose can spread a maximal radial distance of about 1.5 mm from a microdialysis probe in 14 minutes (Dykstra et al., 1992), and [14C]sucrose injected into the lateral ventricle is rapidly distributed throughout brain in a heterogeneous manner through various flow pathways (Ghersi-Egea et al., 1996). Electrolytes and other small ions also diffuse similar distances in vivo, 1 to 1.5 mm within 10 minutes (Smith and Rapoport, 1986; Nicholson and Rice, 1987). Dopamine can move 1.0 to 1.5 mm within 2 minutes (Doucet et al., 1986; Bjelke et al., 1991; Schneider et al., 1994), and biogenic amine spreading in striatum is reduced by 50% when dexamethasone or mannitol is injected to shrink the extracellular space (Bondareff et al., 1970). Horseradish peroxidase distributes widely throughout the perivascular space within 6 minutes after injection, and its spreading is lessened by dampening aortic pulsation (Rennels et al., 1985); perivascular movement is complex and the rate might vary with conditions (Ichimura et al., 1991). Thus, entry of lactate into the subarachnoid or perivascular spaces or ventricular system would result in widespread distribution within brain. Extracellular movement of nutrients, electrolytes, neurotransmitters and modulators, and proteins might be more complex and extensive than generally recognized. Rapid movement of catecholamines and neuroactive peptides has led to the hypothesis that volume transmission (i.e., intercellular communication in brain by spread of chemicals through extracellular space) might have an important role in nonsynaptic interactions and regulation of neural activity (Fuxe and Agnati, 1991).
Influence of metabolite trafficking on CMR glc . Rapid outflow of unlabeled and 14C-labeled lactate from adult rat brain to blood after metabolic challenge (Hawkins et al., 1973; Figs. 1, 2 and 3) supports the inference that lactate trafficking was probably a major factor in the underestimation of CMRglc in activated tissue when labeled glucose was the tracer (Collins et al., 1987; Ackermann and Lear, 1989, 1993). However, calculated values for unmetabolized [14C]glucose and [14C]deoxyglucose remaining in the precursor pool and the integrated specific activity of the brain precursor pool are inaccurate in brief autoradiographic experiments and can cause discrepant results (Sokoloff, 1982); for example, measured and predicted tissue precursor levels varied by as much as several fold (Adachi et al., 1995). In addition, local, extensive production and trafficking of lactate could alter both the actual and calculated rate of consumption of glucose in surrounding structures. For example, export of large amounts of lactate from glycolytic tissue (e.g., cerebral cortex during spreading depression, an ischemic penumbra, or a brain tumor) to adjacent areas could reduce the actual rate of glucose utilization in the surrounding structures by providing an alternative energy source, thereby reducing local demand for glucose or by raising the levels of glycolytic intermediates, eventually causing glucose-6-phosphate levels to increase and inhibit hexokinase. In glucose-labeling studies, the specific activity of brain lactate quickly reaches the theoretical maximum (i.e., half that of [6-14C]glucose by 5 to 7 minutes; Adachi et al., 1995), and movement of labeled lactate from and within the brain would have a significant impact on calculated CMRglc, more than that of amino acids, which have much lower specific activities. [14C]Lactate loss to blood during spreading depression was high, i.e., equivalent to 20% of glucose uptake, but accounted for less than half the magnitude of underestimation (i.e., 50%) of calculated CMRglc determined with [6-14C]glucose (Adachi et al., 1995), suggesting that a similar quantity of lactate was swiftly transported from cerebral cortex to other structures within the brain. Because the blood-brain barrier would restrict lactate efflux (Drewes and Gilboe, 1973; Cremer et al., 1979; Kuhr et al., 1988) movement of labeled diffusible metabolites within brain would cause CMRglc to be underestimated in metabolically activated structures because of product loss and overestimated in neighboring structures that metabolize and trap the label. Lactate trafficking could, therefore, diminish regional differences in actual and calculated CMRglc as illustrated in Fig. 4 (middle and lower panels). Substantial lactate movement within brain would also prevent accurate determination of both local increases in CMRglc using labeled glucose and estimation of local rates of glycolysis as the difference in calculated CMRglc obtained with [18F]fluorodeoxyglucose and [6-14C]glucose (Ackermann and Lear, 1989), even with correction for estimated lactate loss to blood (Blomqvist et al., 1990; Lear and Kasliwal, 1991).
Substrate trafficking and metabolic interactions between neurons and glia
Cultured glial cells convert both glucose and glycogen to lactate, which is then exported to the culture medium (Walz and Mukerji, 1988a, 1988b; Dringen et al., 1993; Magistretti et al., 1993; Pellerin and Magistretti, 1994; Poitry-Yamate et al., 1995; Tsacopoulos and Magistretti, 1996), and presumably this exported lactate is available for neuronal consumption in vivo. Retinal Müller cells do export lactate to photoreceptor cells (Poitry-Yamate et al., 1995; Tsacopoulos and Magistretti, 1996), but it is not known whether astrocytes in mature brain in vivo metabolize glucose mainly to lactate in response to increased energy demand. Technical limitations of in vivo studies (e.g., assessment of local metabolite loss from small structures and tracking metabolism of glucose in various cell types) make it very difficult to test directly the hypothesis that glucose is metabolized to lactate by specific cell types in activated structures and exported to blood, to other brain cells, or to other brain regions. The relatively uniform 14C concentrations in the [14C]glucose autoradiographs (Fig. 4) and range of lactate spreading (Fig. 5) are consistent with local metabolic interactions between lactate-producing and lactate-consuming cells in vivo to cause local trapping of the label, but any trapping of lactate within the cerebral cortex was small in magnitude compared with net loss of lactate and other labeled metabolites from activated tissue (Figs. 1, 2 and 3). Thus, tight local coupling of lactate production by glia and consumption by neurons, if it occurs under basal conditions in vivo, is unlikely to be maintained under pathophysiologic conditions (Hawkins et al., 1973; Ackermann and Lear, 1989, 1993; Figs. 1, 2, 3, 4 and 5). Assuming that lactate loss accounts for the CMRglc underestimates in the activated visual pathway (Collins et al., 1987), tight coupling is also unlikely when glucose metabolism is enhanced by physiologic stimulation because calculated CMRglc in the superior colliculus rose by only 30% in response to 4- to 33-Hz on-off photic stimulation when assayed with [6-14C]glucose; CMRglc was underestimated even at the lowest level of stimulation and labeling by glucose did not change as the frequency of visual stimulation was incrementally increased from 4 to 8, 16, and 33 Hz, whereas labeling by [14C]deoxyglucose nearly doubled over the same range (Collins et al., 1987), suggesting a low threshold for lactate outflow from the activated structure.
It must be emphasized that under different physiologic or experimental situations changes in brain lactate level or lactate efflux to blood might not be the full or even appropriate explanation for discrepant CMRglc values obtained with glucose and deoxyglucose or for an apparent mismatch between CMRglc and CMRO2 (Fox et al., 1988; Madsen et al., 1995a); such studies must be interpreted with caution because the thresholds for lactate production and efflux from brain are not known. For example, preliminary results from our laboratory demonstrated that the ratio of oxygen to glucose uptake into brain was depressed during and shortly after generalized sensory stimulation (i.e., gentle brushing of the whiskers, head, back, and tail with a soft brush), but lactate efflux to blood did not increase and the rise in brain lactate content was much too small to account for the glucose taken up in excess of oxygen (Madsen et al., 1995b). In fact, labeling of amino acids by [6-14C]glucose increased during sensory stimulation, indicating enhanced oxidative metabolism (Dienel et al., 1997). At onset of stimulation under non-steady-state conditions, transient energy demands might be met by a burst of glycolysis, followed by a slower rise in oxidative metabolism; on the other hand, glycolytic intermediates might increase to sustain higher fluxes through the oxidative pathways, and changes in lactate concentration do not necessarily reflect only an increase in the glycolytic pathway.
Metabolic heterogeneity and compartmentation within brain are well established (e.g., Borowsky and Collins, 1989), and oxidative enzymes, e.g., cytochrome oxidase (Hevner and Wong-Riley, 1989; Melzer and Smith, 1995; Murphy et al., 1995) and succinate dehydrogenase (Riddle and Purves, 1995), are used as histochemical markers for somatic sensory barrel cortex and optical dominance columns. Oxidative capacity is high in many brain structures, and a global twofold to threefold increase in CMRO2 can be maintained for at least 2 hours in vivo to support intense functional activity, e.g., seizures (Siesjö, 1978). Spatially localized demands for ATP (e.g., transport across membranes) might be preferentially satisfied by glycolysis, but a 100% increase in glycolytic metabolism would provide less ATP than a barely detectable 5% increase in CMRO2. If glycolysis does, in fact, increase in activated astrocytes, astrocytic CMRO2 might fall, thereby providing more oxygen for adjacent, functionally activated (e.g., synaptic) structures to oxidize increased amounts of glucose or lactate. Unfortunately, in vivo assays of local CMRO2 are not possible in small animals, and in vivo autoradiographic determination of CMRglc cannot distinguish between the contributions of astrocytes and neurons. New approaches must be developed to assess local oxidative metabolism in specific cell types to better understand the functional metabolic interactions between glia and neurons in working brain.
Footnotes
Acknowledgment
The authors thank Dr. Louis Sokoloff for his generous support of this project.