
Abstract
This study argues that, in contrast to accepted excitotoxicity theory, O2/glucose deprivation damages neurons acutely by eliciting ischemic spreading depression (SD), a process not blocked by glutamate antagonists. In live rat hippocampal slices, the initiation, propagation, and resolution of SD can be imaged by monitoring wide-band changes in light transmittance (i.e., intrinsic optical signals). Oxygen/glucose deprivation for 10 minutes at 37.5°C evokes a propagating wave of elevated light transmittance across the slice, representing the SD front. Within minutes, CA1 neurons in regions undergoing SD display irreversible damage in the form of field potential inactivation, swollen cell bodies, and extensively beaded dendrites, the latter revealed by single-cell injection of lucifer yellow. Importantly, glutamate receptor antagonists do not block SD induced by O2/glucose deprivation, nor do they prevent the resultant dendritic beading of CA1 neurons. However, CA1 neurons are spared if SD is suppressed by reducing the temperature to 35°C during O2/glucose deprivation. This supports previous electrophysiologic evidence in vivo that SD during ischemia promotes acute neuronal damage and that glutamate antagonists are not protective of the metabolically stressed tissue. The authors propose that the inhibition of ischemic SD should be targeted as an important therapeutic strategy against stroke damage.
Excitotoxicity theory asserts that excess release of glutamate caused by metabolic compromise initiates a cascade of events that, in the short term, leads to immediate (acute) neuronal death. Ultimately, over hours and days, neurons that have experienced a less severe reduction in blood flow may undergo delayed death mediated by second messengers such as elevated intracellular Ca2+. The proposed central role of glutamate as the primary cause of ischemic injury has stimulated widespread study of glutamate antagonists as potential therapeutic agents to reduce stroke damage. The disappointing results have been attributed to the toxicity of the antagonists or the need to administer agents before an ischemic insult. However, there is also the possibility that elevated glutamate levels during brain ischemia and trauma is fundamentally an effect, rather than the initiator, of neuronal injury (Obrenovitch and Urenjak, 1997a).
We began to have doubts about the primary role of glutamate in acute ischemic brain injury during recent studies using intrinsic optical signal imaging. We expected that hippocampal slices exposed to simulated ischemia (i.e., O2/glucose deprivation [OGD]) should respond in a manner similar to that evoked by glutamate agonists. That is, the response should be an immediate, uniform, and gradually developing increase in light transmittance across CA1 and granule cell regions. Moreover, the response should be blocked by glutamate receptor antagonists (Andrew et al., 1996; Polischuk et al., 1998). Instead, signal onset was delayed by several minutes and took the form of a sudden, focal initiation that propagated outward as a wave across the tissue, despite the tissue being uniformly compromised. This optical signal front was correlated with the onset of a temporary negative shift in the extracellular voltage (Obeidat and Andrew, 1998; Basarsky et al., 1998), the electrical signature of spreading depression (SD) (Somjen et al., 1992).
Spreading depression is a profound depolarization of neurons and glia that migrates across gray matter (Somjen et al., 1992). During stroke, it can arise near the ischemic core (termed the anoxic depolarization) and spread into normoxic tissue. Nedergaard and Astrup (1986) first suggested that SD might promote ischemic brain damage, which subsequently was supported by several studies (Hernandez-Caceres et al., 1987; Nedergaard and Hansen, 1988; Marrannes et al., 1988; Lauritzen and Hansen, 1992; Nellgard and Wielock, 1992; Back et al., 1996; Takaoka et al., 1996). These same studies showed that SD induced under nonischemic conditions produced no damage. In hippocampal slices, irreversible changes in light transmittance developed over several minutes during OGD, but only in regions where SD migrated (Obeidat and Andrew, 1998). The assumption of neuronal damage was tentatively based on the rapid development of a distinct and irreversible reduction in light transmittance in those dendritic regions engaged by SD during simulated ischemia.
Based on these findings, there were two objectives of the current study: (1) to examine whether SD propagation under ischemia-like conditions leads to tissue damage, as measured with intrinsic optical signal imaging, evoked field potentials, histologic study, and single-neuron injection of the fluorescent dye lucifer yellow; and (2) to examine if glutamate antagonists protect the hippocampal slice from damage as predicted by excitotoxicity theory.
EXPERIMENTAL PROCEDURES
Hippocampal slice preparation
Methods were described recently (Obeidat and Andrew, 1998). Briefly, a male Sprague-Dawley rat, 21 to 28 days old, was placed in a rodent restrainer and guillotined, and the brain was excised under cold artificial cerebrospinal fluid (aCSF). Transverse slices (400 μm) were cut and incubated at 22°C in oxygenated (95% O2/5% CO2) aCSF for a minimum of 1 hour before transfer to the recording chamber.
The aCSF superfused the slices at 1 mL/min and was used as a vehicle for drug administration. The aCSF contained (in mmol/L): NaCl 120.0, KCl 3.3, NaHCO3 26.0, MgSO4 1.3, NaH2PO4 1.2, D-glucose 11.0, and CaCl2 1.8 (pH 7.3 to 7.4). The osmolality of the aCSF was 292 ± 2 mOsm, as measured with a freezing point depression osmometer. The pH was 7.3 to 7.4. For OGD experiments, 95% O2 was replaced with 95% N2, and the glucose concentration was lowered to 1 mmol/L (from 11 mmol/L). NaCl was added to osmotically balance the solution. Glutamate receptor blockers were the nonspecific antagonist kynurenate, the NMDA receptor antagonist 2-amino-5-phosphonovalerate (AP5), and the non-NMDA receptor antagonist 6-cyano-7-nitroquinoxiline-2,3 dione (CNQX). Kynurenate (2 mmol/L), CNQX (10 μmol/L), or AP5 (50 μmol/L) were dissolved in aCSF and bath-applied for at least 30 minutes before starting an experiment. These concentrations are effective in blocking intrinsic optical signals evoked by glutamate and its agonists (Andrew et al. 1996). All chemicals were obtained from the Sigma Chemical Co. (St. Louis, MO, U.S.A.)
Measurement of extracellular field potentials and the spontaneous negative shift
Electrophysiologic techniques were described previously (Obeidat and Andrew, 1998). The recording micropipette was placed in the CA1 stratum pyramidale of the hippocampal slice. A concentric bipolar electrode (Rhodes Electronics, Woodland Hills, CA, U.S.A.) was placed in the CA2 stratum radiatum to stimulate CA1 neurons orthodromically through the Schaffer collaterals of CA3 axons. A current pulse (0.1 to 1.5 mA; 0.1-millisecond duration; 0.25 Hz) was applied to produce a near-maximal amplitude population spike. Digitized data were signal averaged (6 sweeps per trace), displayed, and plotted using pCLAMP software (Axon Instruments, Foster City, CA, U.S.A.). The recording pipette also measured a negative direct current shift if SD occurred.
Imaging intrinsic optical signals
Intrinsic optical signals were monitored at 22°C, 35°C, or 37.5°C using techniques previously described (Obeidat and Andrew, 1998). The saline depth was kept above 1 mm to avoid potential signal reversals resulting from “lensing” by the tissue and fluid (Kreisman et al., 1995). When viewed with transmitted light, healthy slices displayed a dark CA1 pyramidale region. Slices with translucent cell body regions (denoting swelling) were considered unhealthy and were discarded. Video frames were acquired at 30 Hz using a COHU 4910 charge-coupled device (CCD camera, San Diego, CA, U.S.A.), which was set at maximum gain and low black level. At a gamma setting of 1.0, the CCD input/output was linear. Frames were averaged and digitized using an image processor board (DT2867 or DT3155, Data Translation) in a pentium computer controlled by Axon Imaging Workbench (AIW) software (Axon Instruments). Each series of averaged images was stored on a writeable CD disk.
Experiments entailed acquiring an averaged image at intervals of 2.5 seconds (64 frames at 30 Hz) or at 8.5 second (256 frames at 30 Hz), depending on the anticipated rate of the response. The slices were transilluminated by a halogen lamp fitted with a long pass filter (more than 690 nm). The first averaged image in a series (Tcont) was subtracted from each subsequent experimental image (Texp) to reveal areas in the slice where light transmittance changed over time. To quantify and graphically display data, zones of interest were boxed using the AIW software. Light transmittance was expressed as the intensity of the difference image (Texp − Tcont) divided by the gain set by the AIW software program. This value was expressed as a percentage change of the intensity in the zone through division of the control value of the zone; that is, the percent change in light transmittance equals
Notice that Tcont in the denominator normalized plotted data across regions differing in translucence, since a region like CA1 radiatum (RAD) with a high T value showed greater change than more opaque regions like the CA1 PYR. Although plotted data were normalized in this way, software limitations did not permit normalizing the digital images, so two pseudocolor bars provided approximations of light transmittance change in dendritic and cell body regions. The control image was displayed using a gray intensity scale. A graphics program (Corel-DRAW) was used to arrange and label images. Data were plotted using either Microsoft Excel or SigmaPlot for Windows (Jandel Scientific).
Histology
For histologic analyses, imaged hippocampal slices were fixed for 24 hours in Bouin's fixative, stored in 70% ethanol, and processed for paraffin embedding. Sections (7 μm) were stained with hematoxylin/eosin and photographed using a 40× objective.
Single CA1 pyramidal cell injection
Immediately after image acquisition, hippocampal slices were fixed overnight in 4% paraformaldehyde in 0.1 mol/L phosphate buffer and stored in buffer at 4°C until single-cell injection. A micropipette filled with 10% lucifer yellow was stepped through CA1 PYR under epifluorescence optics while dye was ejected with a negative current pulse (1 to 5 nA). An initially dim cell body profile signified a successful impalement. The neuron was filled for 10 to 20 minutes, and several cells were filled within one slice. Slices were refixed overnight, cleared in dimethylsulfoxide to reduce background opacity, and photographed using a 10× objective under fluorescence optics. Individual neurons within the cleared slice were photographed in several focal planes. Dendritic regions also were imaged at higher magnification (40× objective; 4× zoom) using a laser scanning confocal imaging system (Biorad MRC-600 or MRC-1024) equipped with a 488-nm laser. Optical sections (3 μm) of dendritic regions were acquired and stacked using Confocal Assistant shareware.
Data were expressed as mean ± standard deviation. Statistical analysis was performed with a one-way analysis of variance followed by Tukey's test to identify significant differences between experimental groups (p < 0.05).
RESULTS
The effects of OGD for 10 minutes at 37.5°C were monitored in slices using simultaneous electrophysiologic recording and intrinsic optical signal imaging as shown in Fig. 1. Initiation of SD was represented as a focal light transmittance (LT) increase in proximal CA1 dendrites, in this case, the apical dendrites in CA1 RAD (Fig. 1A). The extracellular microelectrode recorded both the negative shift during the light transmittance increase (Fig. 1B, top) and the evoked field potential (Fig. 1B, bottom). The maximum amplitude of the negative shift (the electrophysiologic hallmark of SD) ranged from 2 to 15 mV, and the signal returned to near baseline between 5 and 10 minutes. The time course of light transmittance change also was recorded (Fig. 1B, middle). The onset of the negative shift coincided with the light transmittance front sweeping by the electrode. After SD, the synaptically evoked population spike did not recover (Fig. 1B, lower right). In addition, the CA1 cell bodies swelled irreversibly (Fig. 1B, CA1 PYR) and light transmittance in CA1 dendrites was irreversibly reduced (Fig. 1B, CA1 RAD). Figure 1C is a series of pseudocolored images during and after SD onset induced by OGD for 10 minutes. From a broad focal point, the signal spread in both directions across the CA1 region (4:36 to 5:42) but only partly invaded the granule cells (GC) of the dentate gyrus. The CA3 region was not engaged. By 13 minutes, the signal in CA1 RAD and oriens (OR) had reversed. It is this endpoint of electrical silence and irreversible light transmittance change that may represent acute cellular damage in the CA1 region despite the fact that the negative shift returns to near baseline (see Discussion). We investigated this endpoint further later.
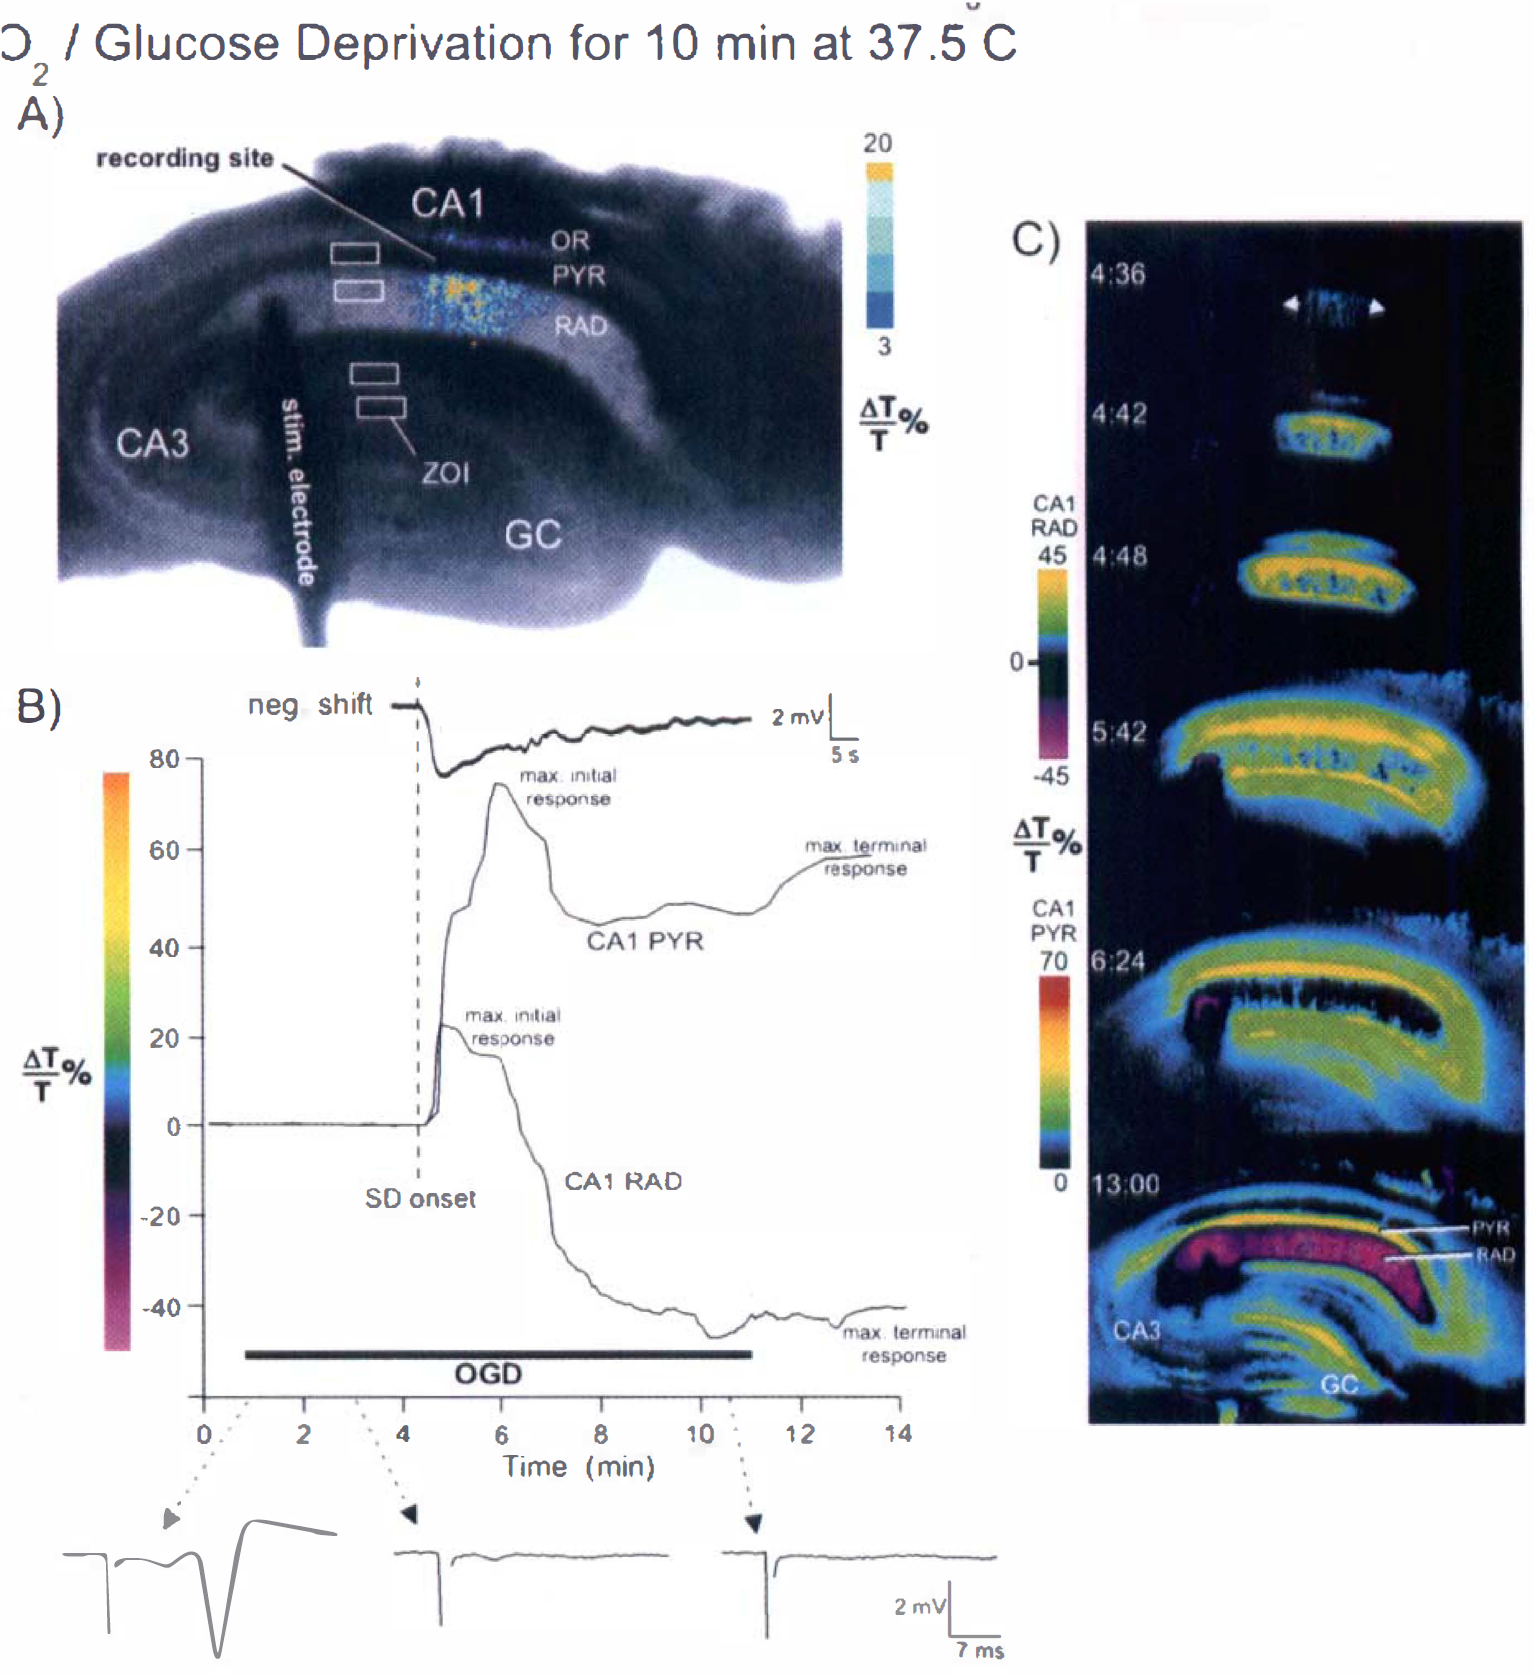
Simultaneous extracellular field recording and intrinsic optical signal (IOS) imaging during spreading depression (SD) induced by O2/glucose deprivation (OGD).
Neuronal changes resulting from spreading depression
To assess the cause of the irreversible light transmittance changes observed at 37.5°C, comparably treated control tissue was required. We reported previously (Obeidat and Andrew, 1998) that OGD for 10 minutes at 35°C is not long enough to induce SD. Although light transmittance did increase at 35°C in CA1 RAD (Fig. 2A) and CA1 PYR (Fig. 2B), Fig. 2C demonstrates that the increase was small (less than 20%) compared with 37.5°C (Fig. 1). The minor response was not altered by pretreating slices with the nonspecific glutamate receptor antagonist kynurenate (Fig. 2). Slices at 35°C, then, served as controls on the basis that they did not undergo SD but were deprived of O2/glucose for the same 10-minute period.
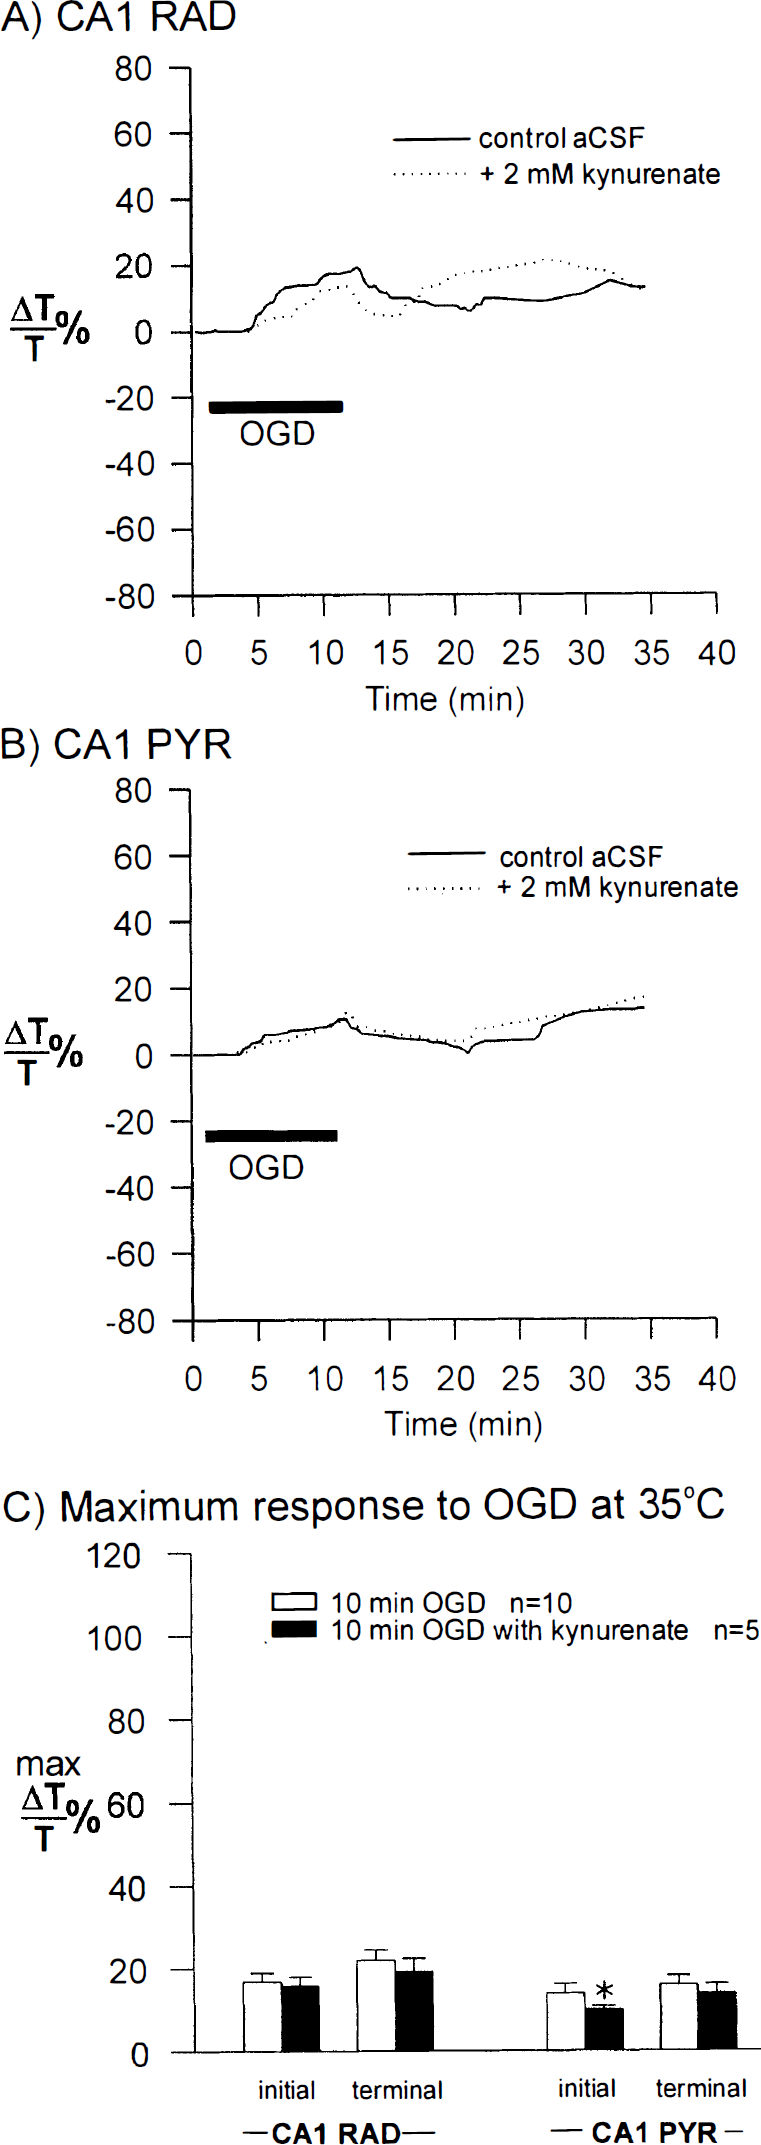
Oxygen/glucose deprivation at 35°C. In contrast to 37.5°C (Fig. 1), OGD for 10 minutes at 35°C did not evoke SD. It caused only minor light transmittance increases in both CA1 RAD
Injection of the fluorescent dye lucifer yellow into CA1 single pyramidal neurons (n = 9) was carried out in six control slices after OGD at 35°C. In some slices, the evoked CA1 field potential was monitored before fixation and injection (Fig. 3A, left). Although the evoked postsynaptic response disappeared within 3 to 4 minutes at 35°C, the response completely returned after a 10-minute reintroduction of control aCSF. Injected neurons in these control slices had a normal appearance, displaying smoothly contoured arbors with dendritic spines (Fig. 3A, right, and Fig. 4A1–4). Slices deprived of O2/glucose for 10 minutes at the higher temperature of 37.5°C lost their evoked field potential after 3 minutes (Fig. 3B, left), but as a result of SD (not shown), the field potential did not return. Eighteen of 19 injected CA1 neurons in slices experiencing SD displayed distinct dendritic “beading,” consisting of dilations along secondary and tertiary processes. Interposed segments were lightly stained or lacked staining altogether (Figs. 3B and 4B1–4). Beading was particularly obvious in the CA1 OR region.
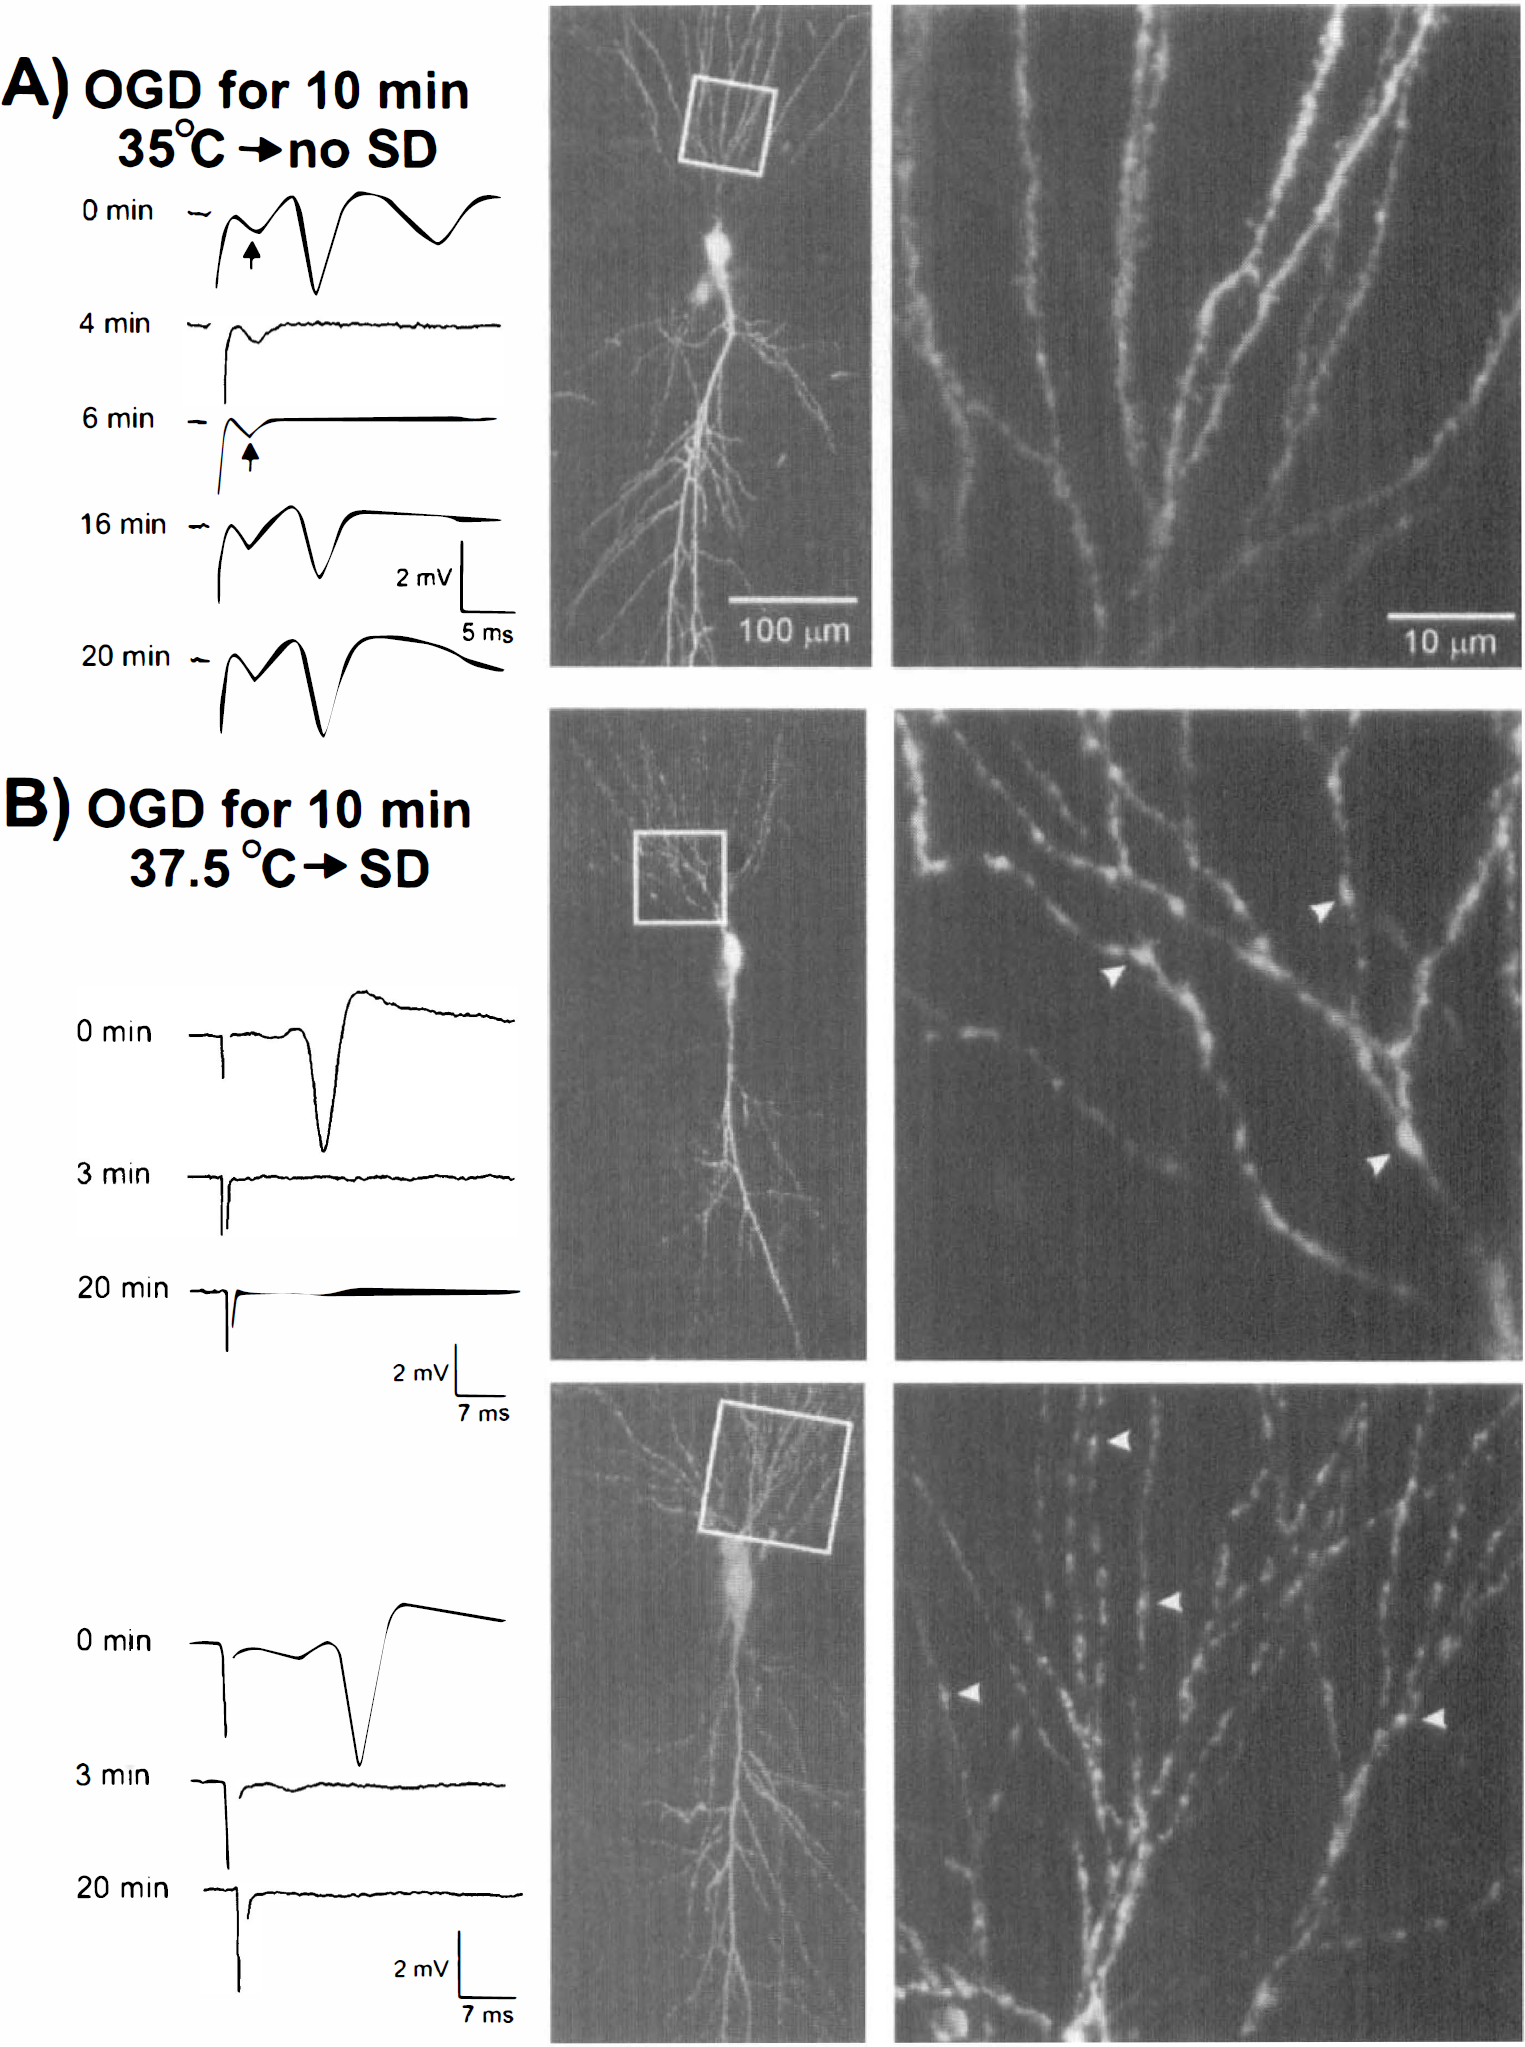
Irreversible loss of the evoked field potential during OGD at 37.5°C associated with SD-induced neuronal damage.
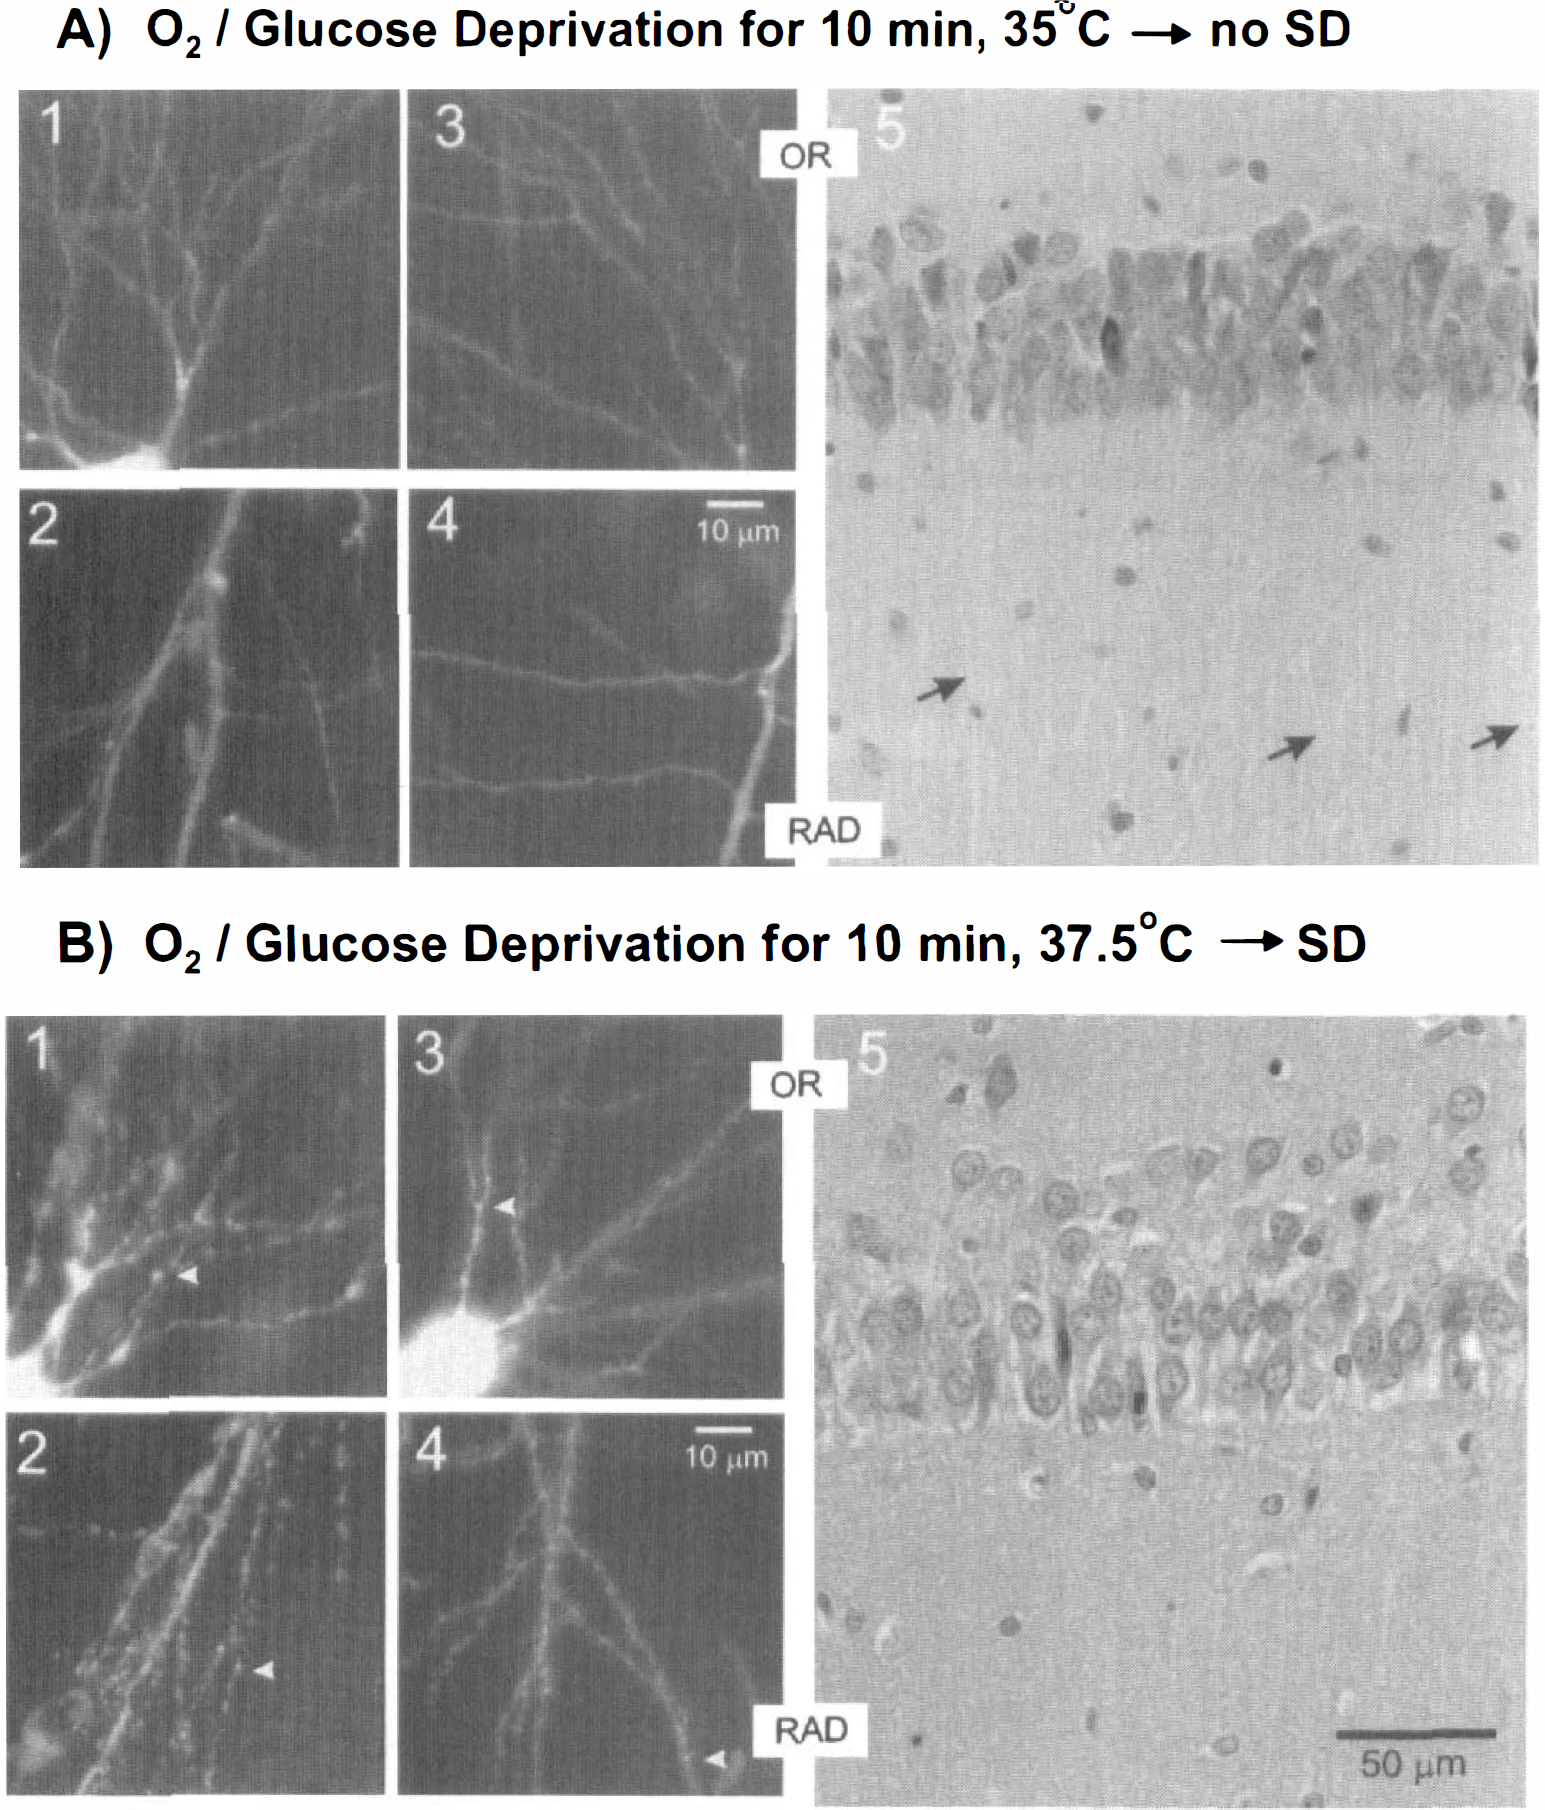
Confocal microscopy of lucifer yellow-filled CA1 neurons revealed dendritic changes not detectable within histologic sections.
Compared with control slices (n = 7) (Fig. 4A5), slices that underwent SD (n = 10) histologically appeared to be damaged (Fig. 4B5). The CA1 cell bodies generally were paler and more disrupted and their nuclei were larger in diameter. The primary apical dendrites in CA1 RAD, normally visible in control tissue (Fig. 4A5, arrows), were less distinct in tissue that experienced SD (Fig. 4B5). Both the CA1 OR and RAD neuropil were grainy in appearance.
Effects of glutamate antagonists
If glutamate receptors play a role in SD onset and in the acute neuronal damage that follows in its wake, then glutamate receptor antagonists such as the nonspecific blocker kynurenate should accomplish one or more of the following: (1) inhibit SD initiation, (2) inhibit SD propagation, or (3) reduce ensuing tissue damage. At first glance, preapplication of 2 mmol/L of kynurenate for 30 minutes appeared to be protective. That is, after OGD for 10 minutes at 37.5°C, there was some swelling, but SD did not develop. There were no large irreversible transmittance changes after deprivation (Fig. 5B), unlike in normal aCSF (Fig. 5A). In other words, kynurenate treatment appeared to block the transmittance reduction in CA1 RAD and reduce swelling in CA1 PYR, both of which follow SD (Fig. 5A). However, there were several cases where pretreatment with glutamate antagonists (2 mmol/L kynurenate, 50 μmol/L AP5, or 10 μmol/L CNQX) permitted a SD-like response near the end of the 10-minute OGD exposure (Fig. 5B, dashed line). Compare full-blown SD in Fig. 5A with the smaller responses in Fig. 5B, where maximal transmittance values were less and the signal did not remain negative. Thus, although the pooled data imply that glutamate antagonists were protective (Fig. 5C), these partial SD-like responses suggest that the antagonists were only delaying SD onset rather than blocking it.
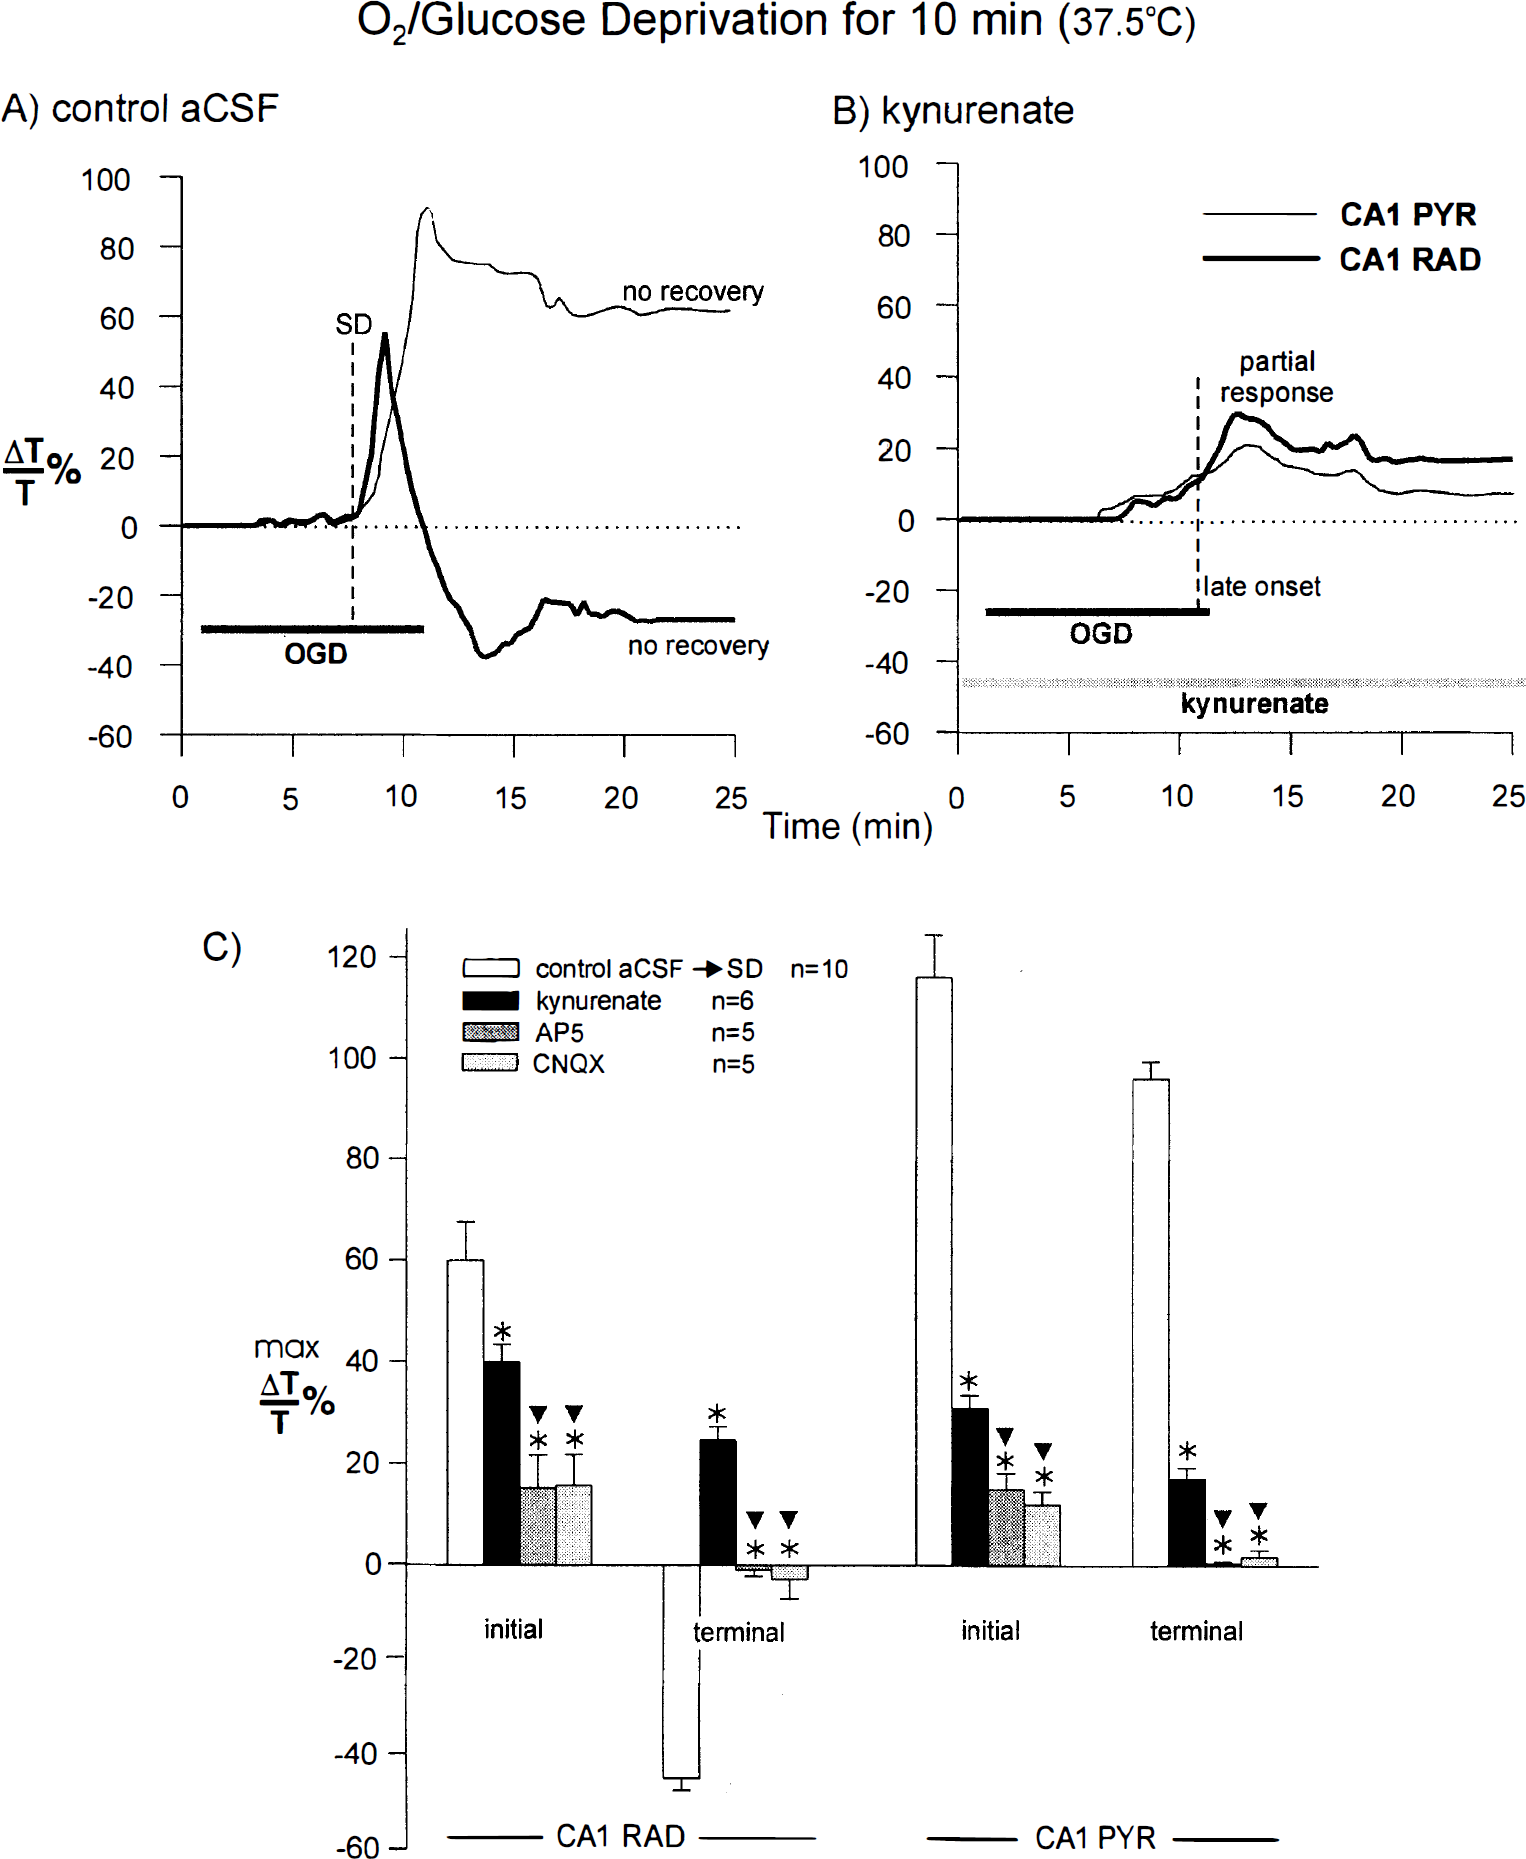
Apparent “protection” from SD by glutamate receptor antagonists results from a delay in SD onset. Apparent SD blockade by glutamate antagonists reveals a partial SD-like event in slices during 10 minutes of OGD at 37.5°C. Compared with control SD
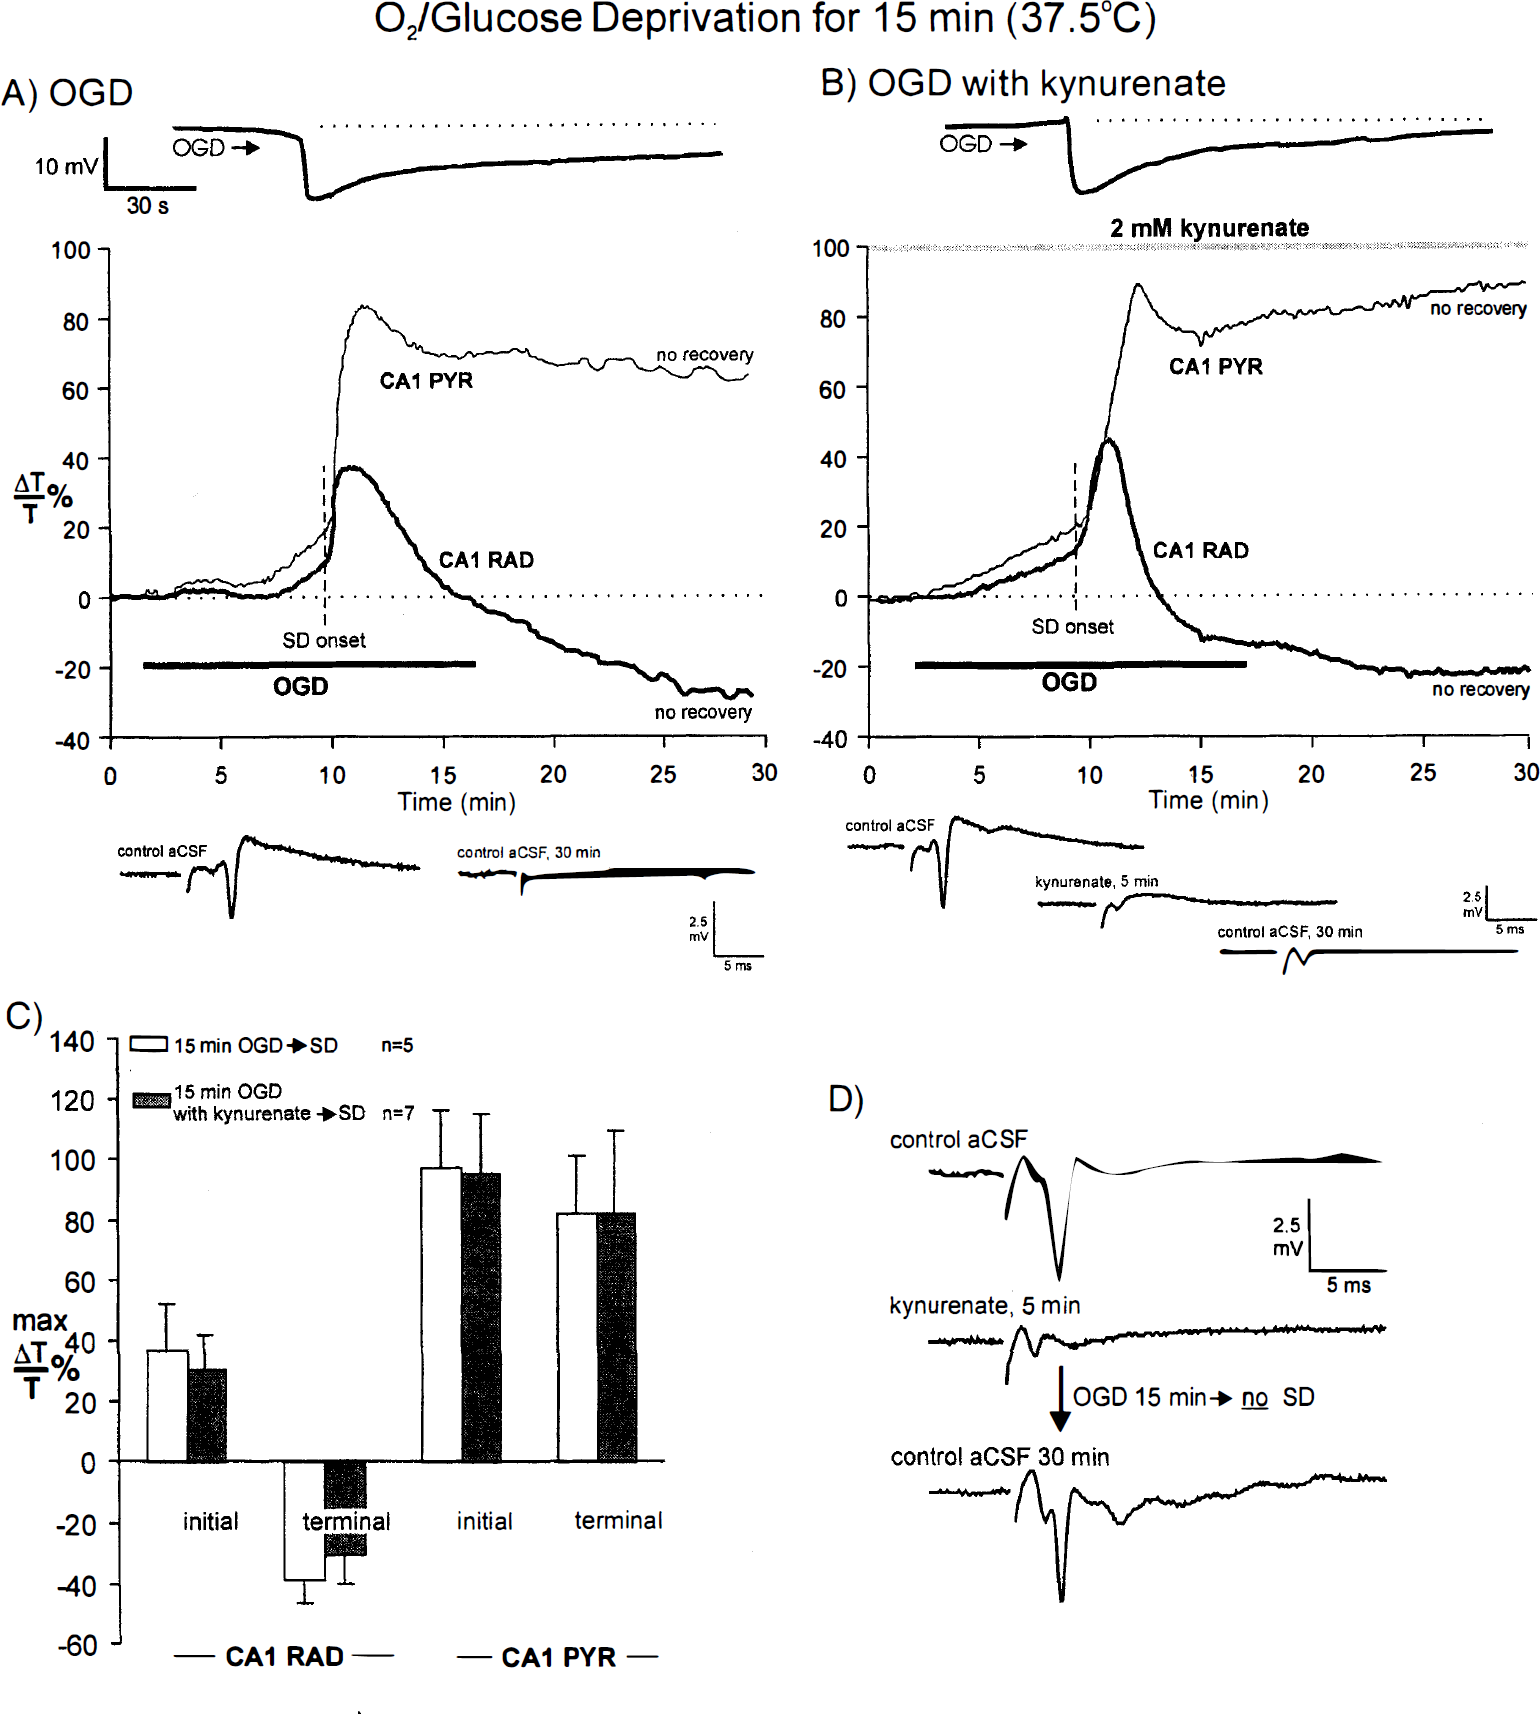
This possibility was tested by extending the OGD period to 15 minutes at 37.5°C. Compared with control OGD (Fig. 6A), kynurenate treatment did not affect SD in seven of seven slices (Fig. 6B). Electrophysiologic recording showed that the negative shift was unaffected in time to onset and amplitude in slices pretreated with 2 mmol/L kynurenate (Fig. 6B, top trace). Moreover, the evoked CA1 orthodromic response, which was permanently lost after SD (Fig. 6A, bottom traces), was likewise lost in kynurenate-treated tissue despite the demonstrable blockade of synaptic input by the antagonist (Fig. 6B, bottom traces). Regarding the optical signal, the SD front initiated, propagated, and terminated in a normal fashion with the engaged dendritic regions developing the typical light transmittance decrease (indicative of dendritic beading). Compare Figs. 6A and 6B. Monitoring of the CA1 cell body region revealed that the normal transmittance increase in PYR (Fig. 6A) was not affected by kynurenate treatment, both initially and at the termination of the experiment (Fig. 6B). These nonrecoverable optical signals further indicate that kynurenate treatment did not block SD or protect CA1 dendrites and somata. Rarely and for unknown reasons, a slice exposed to 15 minutes of OGD did not undergo SD. In all five slices, the evoked field potential returned to control levels after 30 minutes of recovery. Figure 6D shows an example where the slice was treated with kynurenate (SD also could fail in nontreated slices). Thus, permanent loss of the synaptic response required a prior SD event.
DISCUSSION
Spreading depression and ischemia
Under normoxic conditions, SD is associated with symptoms of migraine aura, especially scintillating scotoma. This shimmering blind spot appears to migrate across the visual field but probably results from a sequential inactivation of the primary visual cortex by SD (Lauritzen, 1987). Electrophysiologic studies show that SD represents a profound increase in membrane permeability propagating across the cerebral cortex as a wave of depolarizing inactivation, first demonstrated by Leao (1944). At SD onset, extracellular Na+, Ca2+, and Cl− levels immediately plunge (because of cellular uptake), whereas extracellular [K+] soars from 3 to above 60 mmol/L (Kristian and Siesjo, 1997). In vivo studies show that SD elicited by mechanical stimulation or high K+ application to the cortical surface does not result in neuronal damage, unlike SD evoked by ischemia (Hernandez-Caceres et al., 1987; Nedergaard and Hansen, 1988; Marrannes et al., 1988; Lauritzen and Hansen, 1992; Nellgard and Wielock, 1992; Back et al., 1996; Takaoka et al., 1996).
The presence of oxygen and glucose are essential for neural functioning. With the global ischemia of cardiac arrest, synaptic transmission quickly fails. A minute or more passes before neurons undergo an abrupt reduction of membrane potential. This “anoxic depolarization” marks the onset of an SD-like depolarization induced by ischemia. Likewise, with focal ischemia, SD suddenly erupts within or near the infarct site and propagates outward into the penumbra, the surrounding region of partial metabolic compromise (Nedergaard and Hansen, 1993; Kristian and Siesjo, 1997). Propagation may continue into uncompromised tissue (Nedergaard, 1996), where the process takes on the properties of classic SD described by Leao (1944). Early in the postischemic period, repeated episodes of SD may extend the damage of the ischemic core into the ever-narrowing penumbra (reviewed by Obrenovitch, 1996).
The brain slice made uniformly “ischemic” displays a negative shift that usually returns to near baseline. This implies neuronal recovery, yet optical and synaptic signals indicate serious neuronal damage. The return to baseline may represent recovery of glial membrane potential, although this remains to be tested with intracellular recording.
Many brain slice studies of ischemia examine the effects of hypoxia alone on cortical slices. By maintaining the glucose concentration near physiologic levels (5 mmol/L) the anoxic depolarization (i.e., anoxic SD) is avoided. Whereas this promotes eventual recovery of lost synaptic function, it poorly simulates ischemia in gray matter for two reasons. First, ischemic tissue in the intact animal is hypoglycemic. Second, even mildly compromised tissue during focal ischemia still undergoes SD that originates near the ischemia core (Nedergaard, 1996). Thus, in all but the mildest ischemia, SD should be a factor.
We recently presented evidence that SD induced by OGD in the hippocampal slice caused tissue damage (Obeidat and Andrew, 1998). We concluded that the energy demand for SD alone is not a burden, but it becomes overwhelming with the added stress of OGD, causing profound depolarization from which the neurons do not recover (see Obrenovitch and Urenjak, 1997a). The lack of recovery is distinguished by maintained swelling in the CA1 PYR layer (CA1 cell bodies) accompanied by a reduction in light transmittance within CA1 dendritic layers. Although cell shrinkage caused by hyperosmotic aCSF reduces transmittance (Andrew and MacVicar, 1994; Andrew et al., 1997), the overall tissue swelling continues, but the expected LT increase is overwhelmed by some stronger light-scattering phenomenon (Jarvis et al., 1999). Our CA1 cell injections point to dendritic beading as the source. The diameter of the beads and the fine interbead regions approximate the wavelength of the incident light, maximizing their scattering power (Sick and LaManna, 1995; Andrew et al., 1999). It is not possible to rule out a glial component to the signal. The dendritic beading has been observed in cultured neocortical neurons after OGD (Park et al., 1996) and in situ in CA1 pyramidal neurons injected with horseradish peroxidase after brief transient ischemia (Hori and Carpenter, 1994). It also arises in neurons in vivo after seizure, glutamate agonist exposure, or electrical stimulation (see Obeidat and Andrew, 1998). Whereas beading may represent damaged or dying neurons, cultured nerve cells also can recover from beading over many minutes (Park et al. 1996).
Spreading depression onset is temperature sensitive
At 35°C, there was only a small, slow increase in light transmittance within the CA1 region evoked by 10 minutes of OGD. The signal was not affected by pretreatment with kynurenate and so represents swelling that is not mediated by glutamate receptors. Ten minutes of OGD failed to evoke SD, whereas raising the temperature by 2.5°C always induced SD across the CA1 region. Without SD, no irreversible intrinsic optical signals or loss of electrical responsiveness developed. This suggests that the 2.5°C reduction in the current study protected hippocampal slices by inhibiting SD. Chen et al. (1993) showed that hypothermia (30°C) significantly delayed the anoxic depolarization onset after middle cerebral artery occlusion. Moreover, they showed that subsequent SDs (presumably initiated in the penumbra) were blocked, reducing the infarct size to nondetectable levels.
Single CA1 pyramidal cells deprived of O2/glucose at 35°C in our study displayed normal, smoothly contoured dendrites after injection with lucifer yellow. Likewise, hippocampal slices maintained at 37° to 38°C but without OGD displayed normal (nonbeaded) dendrites and histologic features (Jarvis et al., 1999). In contrast, neurons from slices exposed to 10 minutes of OGD and held at 37.5°C (which induces SD) displayed markedly beaded dendrites, coinciding with the permanent loss of evoked synaptic transmission. These results indicate that lower temperature protected neurons by inhibiting the onset of SD.
Questioning the glutamate excitotoxicity hypothesis
The sequence of LT change induced by OGD at 37.5°C is not a scenario predicted by accepted excitotoxicity theory. A gradual extracellular increase in glutamate release from depolarized neurons during OGD in the slice preparation should mimic the uniform and gradual response observed after bath application of glutamate or its agonists (Andrew et al., 1996; Polischuk et al., 1998). However, the abrupt focal origin and the propagating nature of the SD signal suggests that neuronal damage resulted instead from SD propagation. If so, could the damage be prevented by pretreatment with one of several glutamate antagonists? In this regard, we were careful to test antagonists at concentrations known to effectively reduce intrinsic optical signals evoked by bath application of glutamate agonists (Polishchuk and Andrew, 1996; Andrew et al., 1996).
At 37.5°C, where the 10-minute OGD exposure consistently induced SD, preapplication of kynurenate, AP5, or CNQX appeared to block SD. However, there were several slices where light transmittance suddenly increased late in the 10-minute exposure period, suggesting that a full SD event did not develop before return to normal aCSF. The possibility that the antagonists only slightly delayed SD onset was confirmed by extending the OGD period from 10 to 15 minutes. Then, SD usually initiated shortly after the 10-minute mark. Propagation of SD and subsequent LT reduction in CA1 RAD (indicating dendritic beading) and LT increases in CA1 PYR (indicating cell body swelling) were comparable with control slices without kynurenate pretreatment. Therefore, kynurenate treatment did not block SD or the subsequent CA1 dendritic damage. A combination of 50 μmol/L AP5/10 μmol/L CNQX also was ineffective in blocking SD in three of three hippocampal slices and seven of seven neocortical slices (Jarvis and Andrew, 1998). In this regard Aitken et al. (1988), using interfaced hippocampal slices, also found that NMDA antagonists did not prevent SD induced by hypoxia, nor did they promote recovery of the postsynaptic population spike. Opposite conclusions were made by Clark and Rothman (1987), but their slices exposed to hypoxia for 30 minutes were near normoglycemic (7 mmol/L) and held at 34°C, which represented less metabolically demanding conditions. It is possible that the glutamate antagonists delayed SD onset to just beyond the 30-minute mark, so that return to normal conditions after 30 minutes of hypoxia without SD would appear to protect their slices.
The findings of the current study are in keeping with previous work in vivo, showing that ischemic SD is not blocked by glutamate antagonists. In sharp contrast, these same studies show that SD in normoxic tissue induced by focal K+ application or by mechanical stimulation is blocked by NMDA (but not by non-NMDA) receptor antagonists (Hernandez-Caceres et al., 1987; Marrannes et al., 1988; Lauritzen and Hansen, 1992; Nellgard and Wieloch, 1992; Back et al., 1996; Takaoka et al., 1997). This suggests that normoxic SD (analogous to the nondamaging SD of migraine aura) is more dependent on depolarization partly driven by NMDA receptor activation than is ischemic SD.
Obrenovitch and Urenjak (1997a, 1997b) present a strong case for glutamate receptor blockade simply reducing depolarization, thereby lowering the metabolic energy requirements for recovery. Their overall thesis is that elevated glutamate levels are not the initiator, but rather one of several contributing effects of ischemia-induced excitotoxicity. It has been proposed that the glutamate hypothesis of excitotoxicity represents an overinterpretation of data from cultured neurons, which has been hastily applied to the intact animal (Verity, 1991; Hossmann, 1994; Obrenovitch and Urenjak, 1997a). Indeed, cultured neurons usually lack the enwrapping astrocytes, which attenuate neuronal death by removing extracellular glutamate (Rosenberg and Aizenman, 1989; Dugan et al., 1995). In addition, the native properties of neurons are altered by harvesting them before maturation, by their length of time in culture, by serum contents of the culture medium, and by the loss of an extracellular/intracellular volume ratio. These problems are avoided in the hippocampal slice preparation, which, in addition, robustly supports SD induced by OGD.
For reasons unknown to us, occasionally a slice at 37.5°C resists SD, although deprived of O2 and glucose for 15 minutes or more. Significantly, the field potential returns to a healthy control level after 20 to 30 minutes of recovery. This indicates that it is SD during metabolic compromise, not metabolic compromise alone, that elicits acute neuronal damage.
Our study shows that damage induced by OGD depends on the generation of SD, which, as observed in ischemic conditions in situ, is not blocked by glutamate receptor antagonists. This lack of protection also is observed in the neocortical slice preparation (Jarvis and Andrew, 1998). These results implicate the inhibition of SD as a potential therapeutic strategy to reduce stroke damage.
Footnotes
Abbreviations used
Acknowledgements
The authors thank Dr. Leo P. Renaud (Loeb Research Institute, Ottawa Civic Hospital) for use of the confocal microscope and Mr. Andrew Risdale for technical assistance.