
Abstract
Spreading depolarizations (SD) occur in high frequency in patients with malignant hemispheric stroke (MHS). Experimentally, SDs cause marked increases in glutamate and lactate, whereas glucose decreases. Here, we studied extracellular brain glutamate, glucose, lactate, pyruvate and the lactate/pyruvate ratio in relationship to SDs after MHS. We inserted two microdialysis probes in peri-infarct tissue at 5 and 15 mm to the infarct in close proximity to a subdural electrode strip. During 2356.6 monitoring hours, electrocorticography (ECoG) revealed 697 SDs in 16 of 18 patients. Ninety-nine SDs in electrically active tissue (spreading depressions, SDd) were single (SDds) and 485 clustered (SDdc), whereas 10 SDs with at least one electrode in electrically inactive tissue (isoelectric SDs, SDi) were single (SDis) and 103 clustered (SDic). More SDs and a significant number of clustered SDs occurred during the first 36 h post-surgery when glutamate was significantly elevated (> 100 µM). In a grouped analysis, we observed minor glutamate elevations with more than two SDs per hour. Glucose slightly decreased during SDic at 5 mm from the infarct. Directions of SD-related metabolic changes correspond to the experimental setting but the long sampling time of standard microdialysis precludes a more adequate account of the dynamics revealed by ECoG.
Keywords
Introduction
Lesion progression is one of the most serious in-hospital complications of ischemic stroke. Recently, we demonstrated that a significant proportion of patients with malignant hemispheric stroke (MHS) suffer from delayed infarct progression even after decompressive hemicraniectomy. 1 Among many pathways, spreading depolarization (SD) might be one of the main contributors to this delayed secondary infarct progression.
Cerebral ischemia is among the most potent triggers for SD and can induce its most malignant variant, the so-called terminal SD.2–5 Terminal SD typically originates in the core region two to five minutes after onset of severe ischemia and the onset of SD marks the beginning of the countdown for cellular death.2,6–8 Neurons will only survive if tissue reperfusion allows cellular repolarization before the end of the countdown.9–11 The cell death results from toxic intraneuronal changes induced by SD, such as the intracellular calcium and sodium surge, 8 but also depends on a number of other factors including the selective vulnerability of specific types of neurons 12 and the remaining level of perfusion. 13 Over time, further SDs arise at the rim of the persistently depolarized ischemic core due to energy supply demand mismatch and disturbed clearance of metabolites from the extracellular space,14,15 thereby recruiting further tissue into necrosis. Accordingly, the cumulative burden of SDs was shown to correlate with infarct size after middle cerebral artery occlusion16,17 and dynamics of infarct growth 18 and experimental SDs triggered outside of the penumbra were shown to result in stepwise enlargement of the necrotic core.19–21
Experiments with glutamate-sensitive microelectrodes in animals showed that the onset, sustainment and resolution of SD, as measured by the negative DC shift, was synchronous with a marked extracellular rise in glutamate both in naïve and ischemic tissue. 22 In naïve tissue, inhibition of glutamate uptake significantly prolonged both the DC shift of SD and the glutamate increase in a dose-dependent manner. Such prolonged SDs resulted in lesions, whereas no lesions occurred (i) after short-lasting SDs under control conditions, (ii) when no SD was triggered in the presence of glutamate uptake inhibition or (iii) after high concentration glutamate injection into naïve tissue without SD where glutamate is rapidly taken up. Furthermore, in ischemic tissue, glutamate only increased in synchrony with SDs and the durations of negative DC shifts and glutamate increases were strongly correlated. 22 The magnitudes of the initial glutamate peak were similar between potassium-triggered SD in naïve tissue and SD in ischemic brain but the durations were different. The longer durations of both depolarization and glutamate increase in ischemic tissue is due to the fact that the recovery from SD and the glutamate increase requires activation of ATP-dependent membrane pumps. Microdialysis samples are collected over a prolonged period of time, and glutamate accumulates in the samples the longer it remains elevated in the extracellular space. This may in part explain why microdialysis-based glutamate signals in animals were larger following SDs in ischemic compared to naïve tissue. 23
Other prominent SD-induced changes in the extracellular space include a marked increase in lactate and a decrease in glucose that can be measured by different techniques such as rapid sampling microdialysis 24 or enzyme-based microelectrodes. 25 These changes are interesting because certain patterns of metabolic variables have been identified as potential biomarkers for patient outcome. For example, increased lactate/glucose ratio (L/G) was measured in peri-lesional brain tissue and associated with unfavorable outcome in patients with traumatic brain injury (TBI).26,27 In addition, ‘metabolic crisis’, defined by a high lactate/pyruvate ratio (L/P) was associated with poor prognosis.28,29
Decades after the discovery of SD by Leão, 30 it has become evident that SDs also occur in human brain undergoing acute injury.3,15,31–37 Similar to experimental studies, SDs are observed in patients by the propagating DC shift, or slow potential change. Characteristic patterns, including temporal clusters of SDs, and the SD-induced spreading depression of spontaneous cortical activity can be recognized and quantified. 38 In patients with TBI, rapid sampling microdialysis technology revealed an abrupt increase in extracellular lactate and a decrease in glucose analogous to the experimental studies.39,40 Using standard-sampling microdialysis, clustered SDs were associated with subtle increases in glutamate in patients with TBI and aneurysmal subarachnoid hemorrhage.41,42 The aim of the present study was to investigate whether SDs in patients with MHS are associated with altered microdialysis values of glutamate, glucose, lactate, pyruvate or the lactate/pyruvate (L/P) ratio.
Materials and methods
The study was carried out on the basis of the Cooperative Studies on Brain Injury depolarizations (COSBID) study protocol (www.cosbid.org) and was approved by the local research and ethic committee of the Charité – Universitätsmedizin Berlin (EA4/118/13). Research was conducted in accordance with the Declaration of Helsinki.
Forty-seven patients with MHS – defined as subtotal or total middle cerebral artery infarction with or without additional infarction of the anterior or posterior cerebral artery – and the clinical indication for decompressive hemicraniectomy were screened for eligibility in the study between 19 May 2009 and 30 April 2011. Eighteen patients were included after informed consent was obtained from legal representative. Previously, we reported on glutamate, glucose, lactate and pyruvate changes in relationship with infarct progression in these 18 patients. 1 Here, we investigated the co-registered electrocorticographic (ECoG) data with special emphasis on SDs. Detailed patient management, microdialysis catheter placement and infarct rim assessment by laser speckle imaging are described elsewhere in detail. 1
In brief, for decompressive surgery, all patients were anaesthetized with propofol and remifentanil. After bone removal and durotomy, the infarct border on the cortical surface was determined by cortical perfusion assessment with laser speckle imaging (LSI) (MoorFLPI; Moor Instruments Ltd, Axminster, United Kingdom). Infarcted tissue was identified according to a previously determined LSI-specific cortical perfusion drop below 40% compared to non-infarcted tissue.1,43 Thereafter, two microdialysis catheters (100 kDa; CMA, Stockholm, Sweden) were implanted sub-pially in the still viable peri-infarct cortex with a distance of 5 and 15 mm to the infarct. In addition, a six-contact subdural platinum ECoG recording strip (Ad-Tech Medical, Racine, WI) was positioned over the peri-infarct tissue so that both microdialysis probes were covered by the recording strip.
After surgery, the patients were transferred to the intensive care unit. Intracranial pressure (ICP) was monitored via an external ventricular drain or intracranial pressure probe. Blood gases, electrolytes, and glucose were controlled every 4 h and a neurologic examination was performed at least twice per day.
ECoG data recording and data analysis
Bipolar ECoG activity was assessed with a GT205 amplifier (0.01–100 Hz) (ADInstruments, New South Wales, Australia) as previously described.15,33,37 ECoG data were monitored with a Powerlab 8/SP analogue/digital converter and LabChart-7 software (ADInstruments, New South Wales, Australia) at 200 Hz. SD was defined by the sequential onset of a propagating, polyphasic slow potential change in adjacent channels, corresponding to the negative slow voltage variation described by Leão. 2 The accompanying ECoG depression was defined by a rapid reduction of power in the highpass-filtered (lower frequency limit: 0.5Hz) ECoG amplitude.33,37 When no spontaneous activity was present during onset of the polyphasic slow potential change in at least one channel, SDs were classified as isoelectric spreading depolarizations (SDi).34,38 Otherwise, they were classified as spreading depressions (SDd). The duration of the depression period was determined as the interval between depression onset and onset of activity restoration using mathematical integration of the power of the highpass-filtered ECoG activity (time constant decay: 60 s) as described previously. 33 SDs were classified as clustered if three SDs occurred within three or fewer consecutive recording hours. 44
Microdialysis
Microdialysis catheters were perfused at a rate of 0.3 μl/min with artificial cerebrospinal fluid (NaCl 147 mmol/L, KCl 2.7 mmol/L, CaCl2 1.2 mmol/L and MgCl2 0.85 mmol/L; CMA, Stockholm, Sweden). Vial changes were performed every hour and samples were immediately analyzed at bedside for concentrations of glutamate, glucose, lactate and pyruvate with the CMA 600 Microdialysis Analyzer (CMA, Stockholm, Sweden). Microdialysis values were not corrected for recovery.
Data presentation and statistics
Data are presented as mean ± standard deviation. Baseline characteristics were compared with student’s t-test. SDs and microdialysis data were recorded for the first 5.5 days post-surgery. Changes in microdialysis values over time and incidence of SDs were compared by repeated measures one-way analysis of variance (RM ANOVA) with subsequent Holm–Sidak post hoc test for multiple comparisons. Hourly microdialysis values were used to compare changes before and after single SDs. For better comparison, values were depicted as relative changes compared to the mean from the 3 h before SD. To compare metabolites during single (SDds) or clustered (SDdc) SDd and during single (SDis) or clustered (SDic) SDi, the mean of each hourly sampled vial during SDds or SDis, respectively, was assessed per patient. The mean of values 3 h before SD served as control. Values were compared by a one-way analysis of variance (ANOVA) with subsequent Holm–Sidak post hoc test for multiple comparisons versus control. P < 0.05 was considered statistically significant.
Results
Demographic, clinical and postoperative monitoring data.
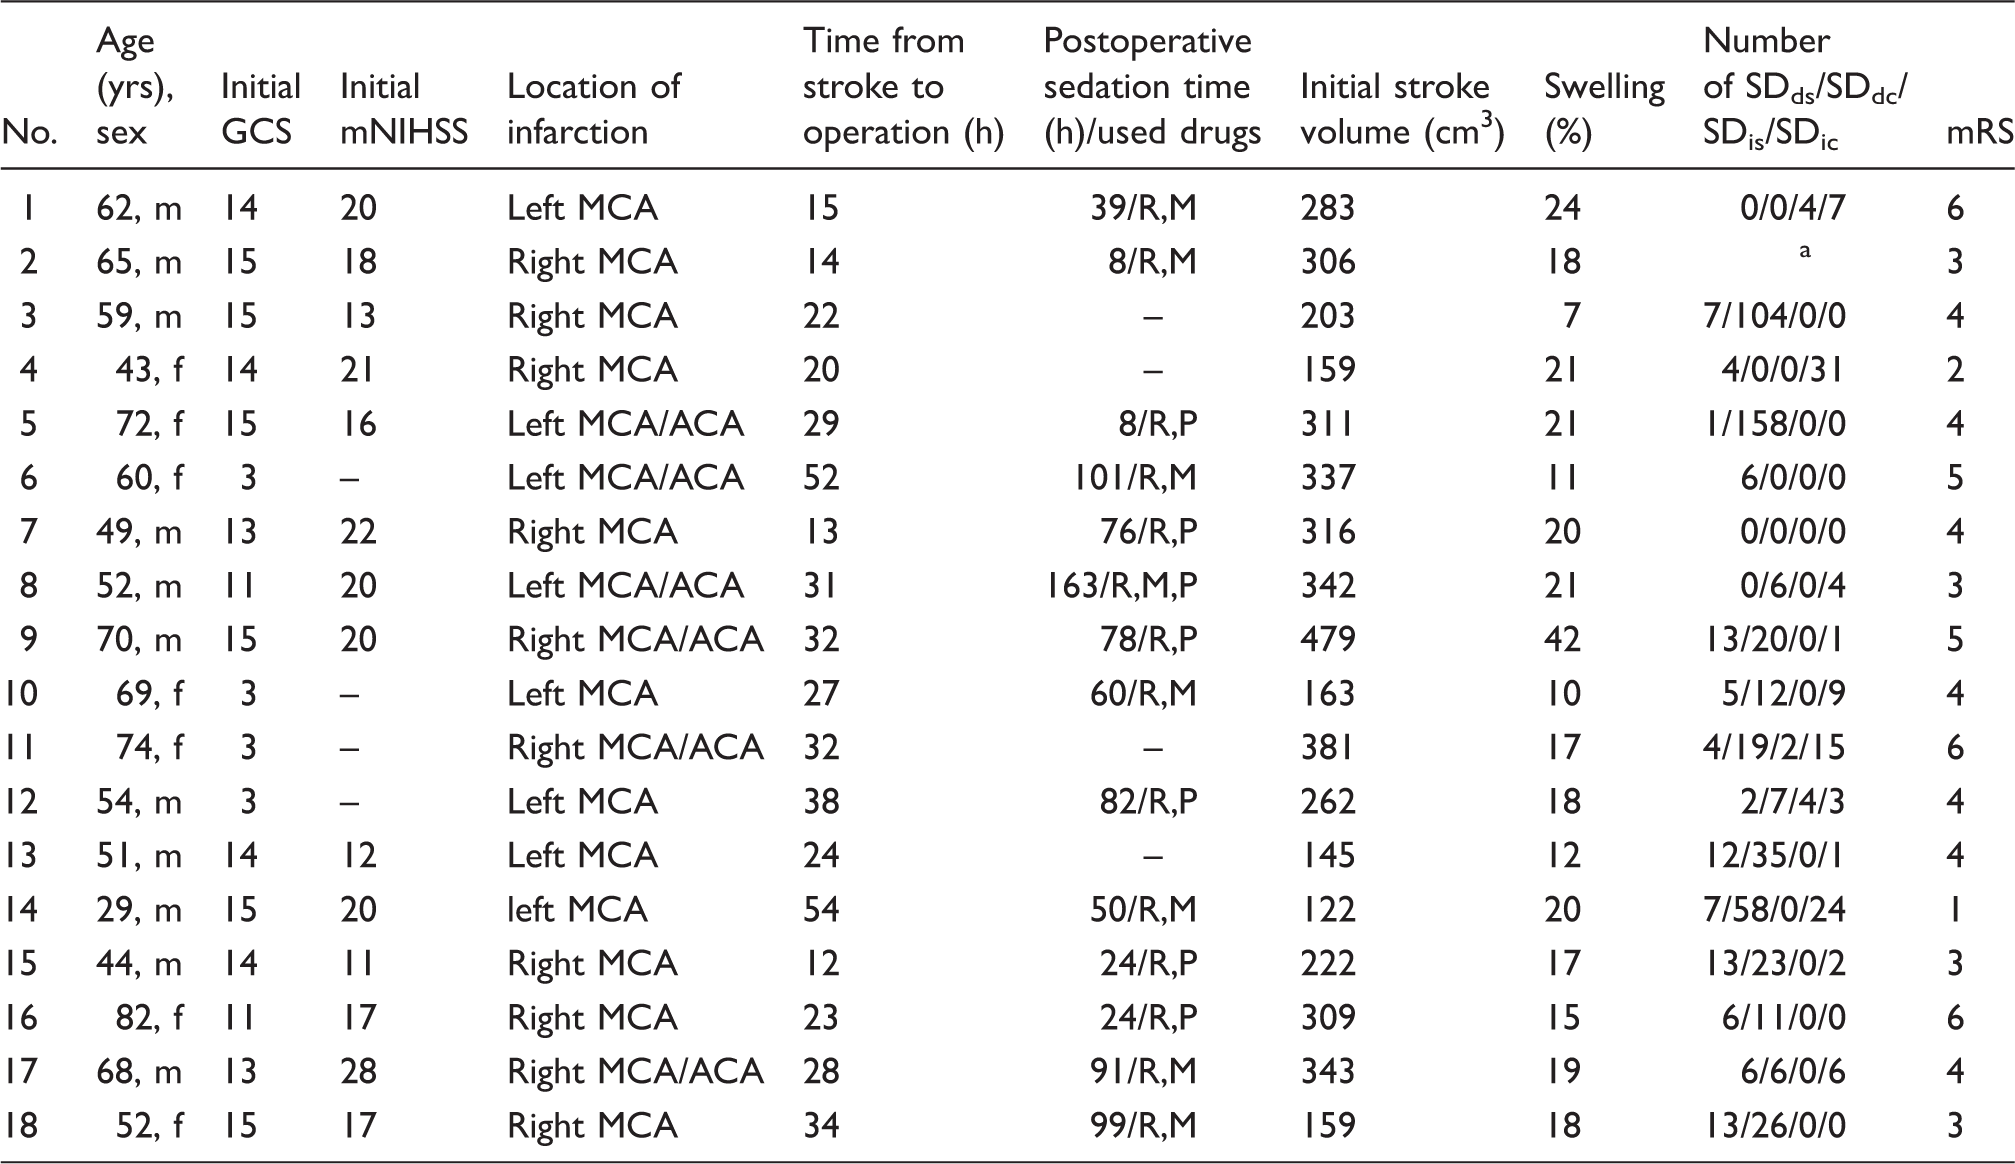
yrs: years; m: male; f: female; GCS: Glasgow Coma Scale; mNIHSS: Modified National Institutes of Health Stroke Scale; MCA: middle cerebral artery; ACA: anterior cerebral artery; R: remifentanil; M: midazolam; P: propofol; SDds: single spreading depression; SDdc: clustered spreading depression; SDis: single isoelectric spreading depolarization; SDic: clustered isoelectric spreading depolarization; mRS: modified Rankin Scale.
Electrocorticography not analyzable due to artifacts.
A high number of SDdc and SDic during the early observation period is associated with significantly elevated glutamate levels
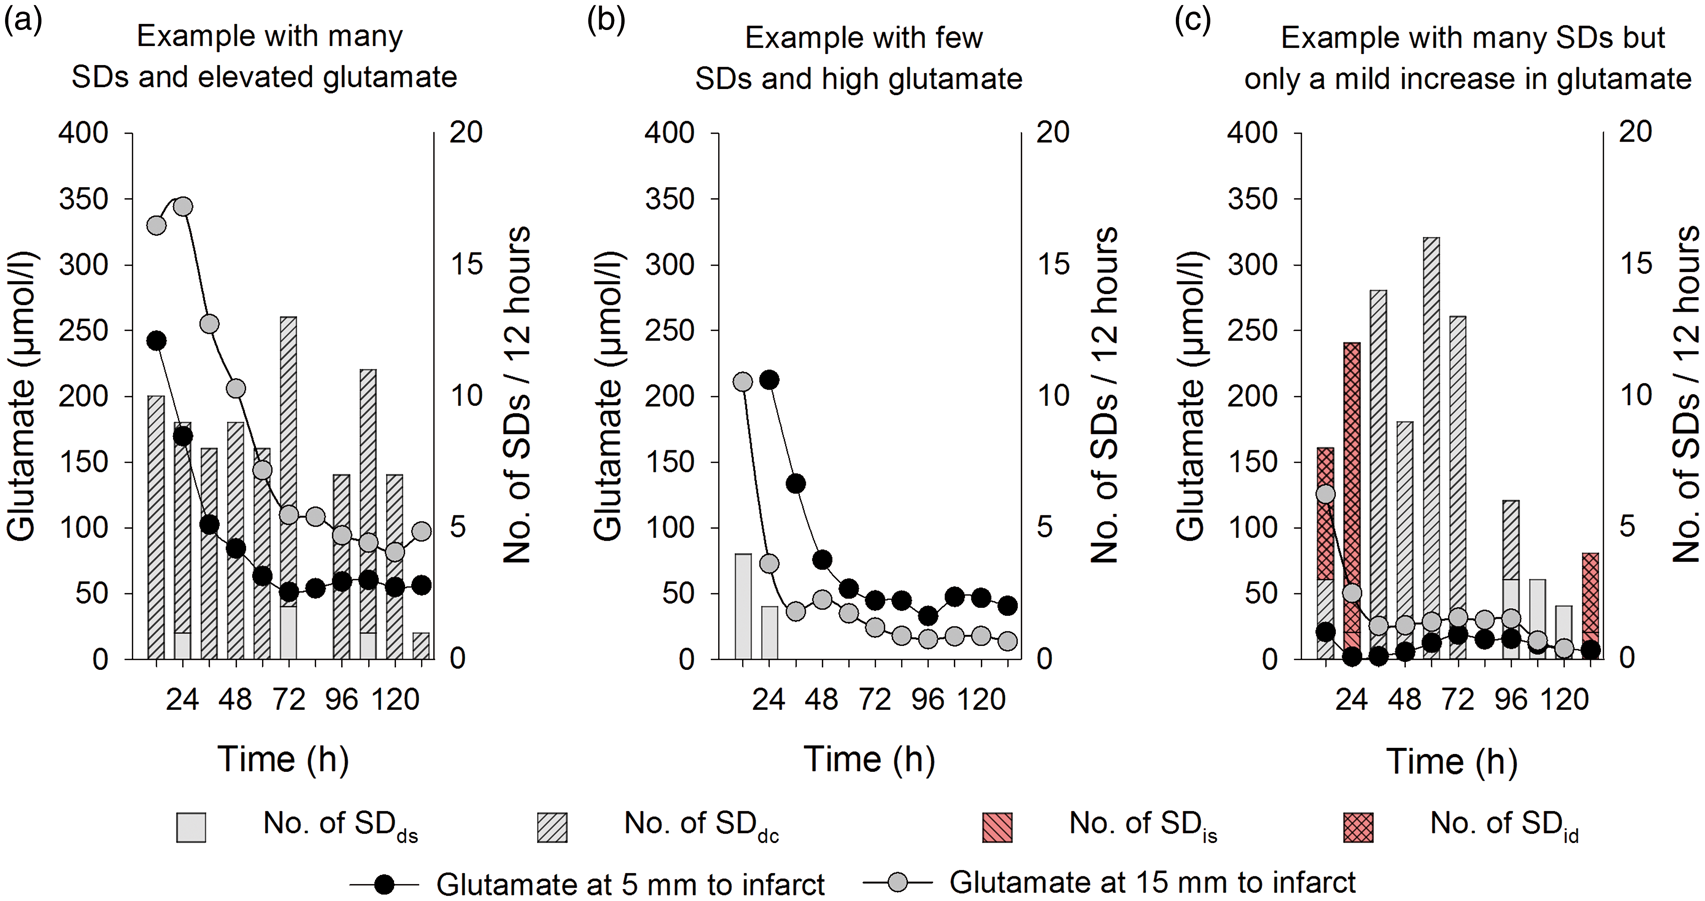
The mean number of SDds and SDis per 12-h recording time is depicted in Figure 1(a). As illustrated, the number of SDs gradually decreased over time. SDdc and SDic occurred almost exclusively during the first three days post-surgery. Overall, the high number of clustered SD during the early period was paralleled by significantly elevated glutamate levels (Figure 1(b)) while glucose, lactate, pyruvate and L/P ratio 5 and 15 mm from the infarct displayed no significant change during the monitoring period. However, in individual patients, we also observed a large number of SDs together with an elevated (Figure 2(a)) or non-elevated glutamate level (Figure 2(c)). In addition, elevated glutamate levels were also observed when only few SDs occurred (Figure 2(b)).
Mean number of SDds, SDdc, SDis and SDic per 12-h recording time per patient (a). The initial high incidence of SDdc and SDic was paralleled by significantly elevated glutamate levels (> 100 µM) (b). Error bar indicates standard deviation. Asterisk mark significant changes against the indicated time points (SDds: single SD; SDdc: clustered SD; SDis: single isoelectric SD; SDic: clustered isoelectric SD). Individual patients displayed either a high number of SDs paralleled by significantly elevated glutamate levels (a; patient nr. 5), while other patients displayed elevated glutamate levels with only a few SDs (b; patient nr. 6) or a large number of SDs was associated with only a mild increase in glutamate levels (c; patient nr. 13). Microdialysis probes were placed with a distance of 5 or 15 mm to the infarct.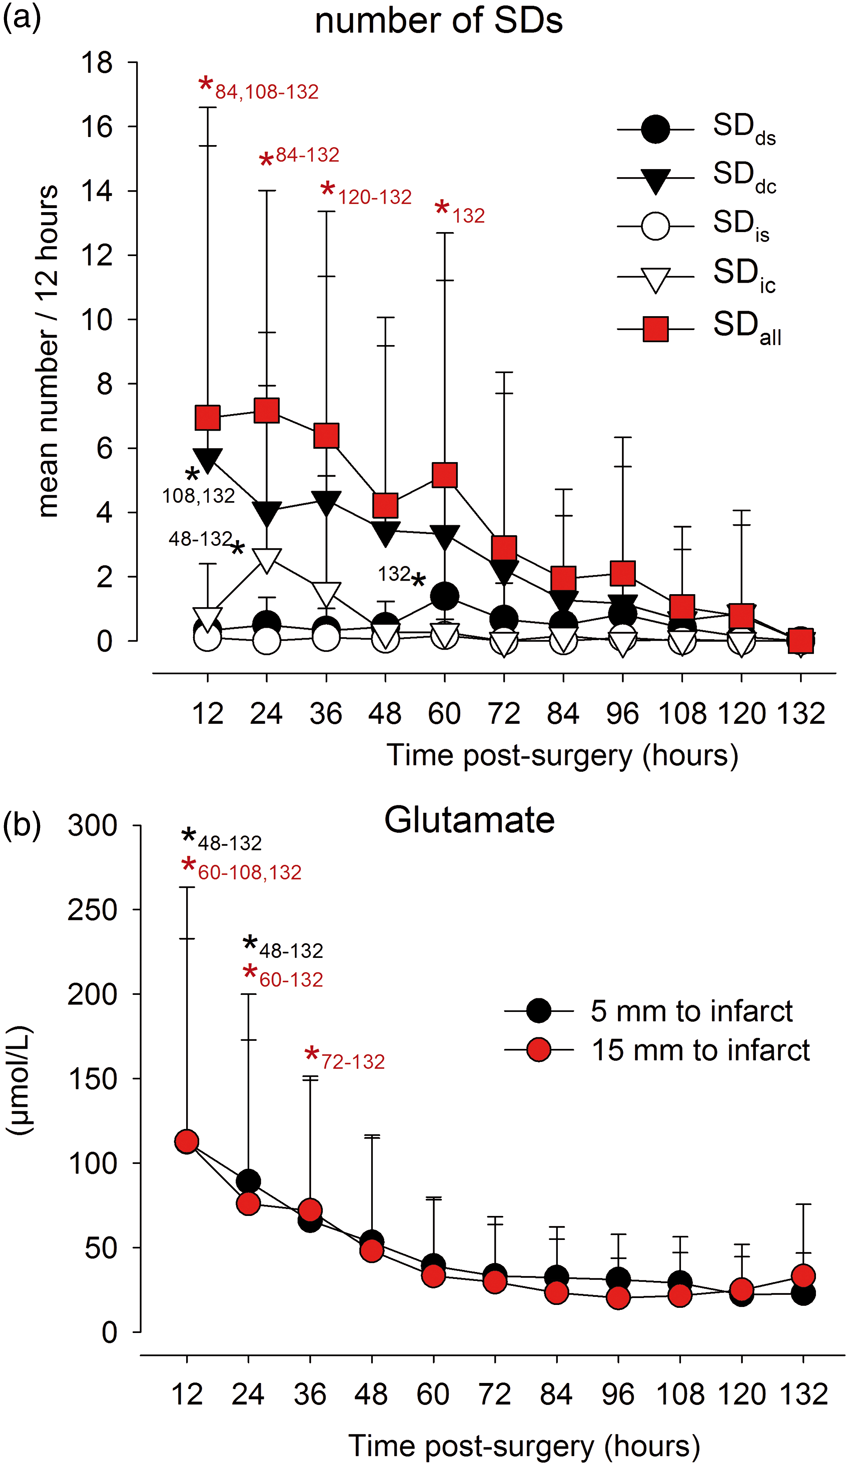
SDds are not associated with changes in microdialysate glutamate, glucose, lactate or pyruvate
Only one SDis and 28 SDds were recorded without a second SD before or after the 3-h time window. To perform a robust before-after SD analysis in microdialysate glutamate, glucose, lactate and pyruvate only the 28 SDds were used for further statistical analysis. At baseline, (mean of the 3 h before SD), microdialysate glutamate concentrations 5 and 15 mm from the infarct were 24.9 ± 40.3 µmol/L and 15.1 ± 22.1 µmol/L, respectively. Glucose, lactate, pyruvate and L/P ratio 5 and 15 mm from the infarct were 1.8 ± 1.7 and 1.8 ±1.5 mmol/L, 6.9 ± 2.6 and 5.1 ± 2.7 mmol/L, 184 ± 90 and 144 ± 72 µmol/L, and 44.5 ± 23.8 and 40.1 ± 23.3. During and after a single SDds, no significant changes in microdialysate concentrations were noted (Figure 3).
Lack of significant changes in microdialysate glutamate (a), glucose (b), lactate (c), pyruvate (d) values or lactate/pyruvate ratio (e) before and after single SDds in the peri-infarct tissue of patients with MHS.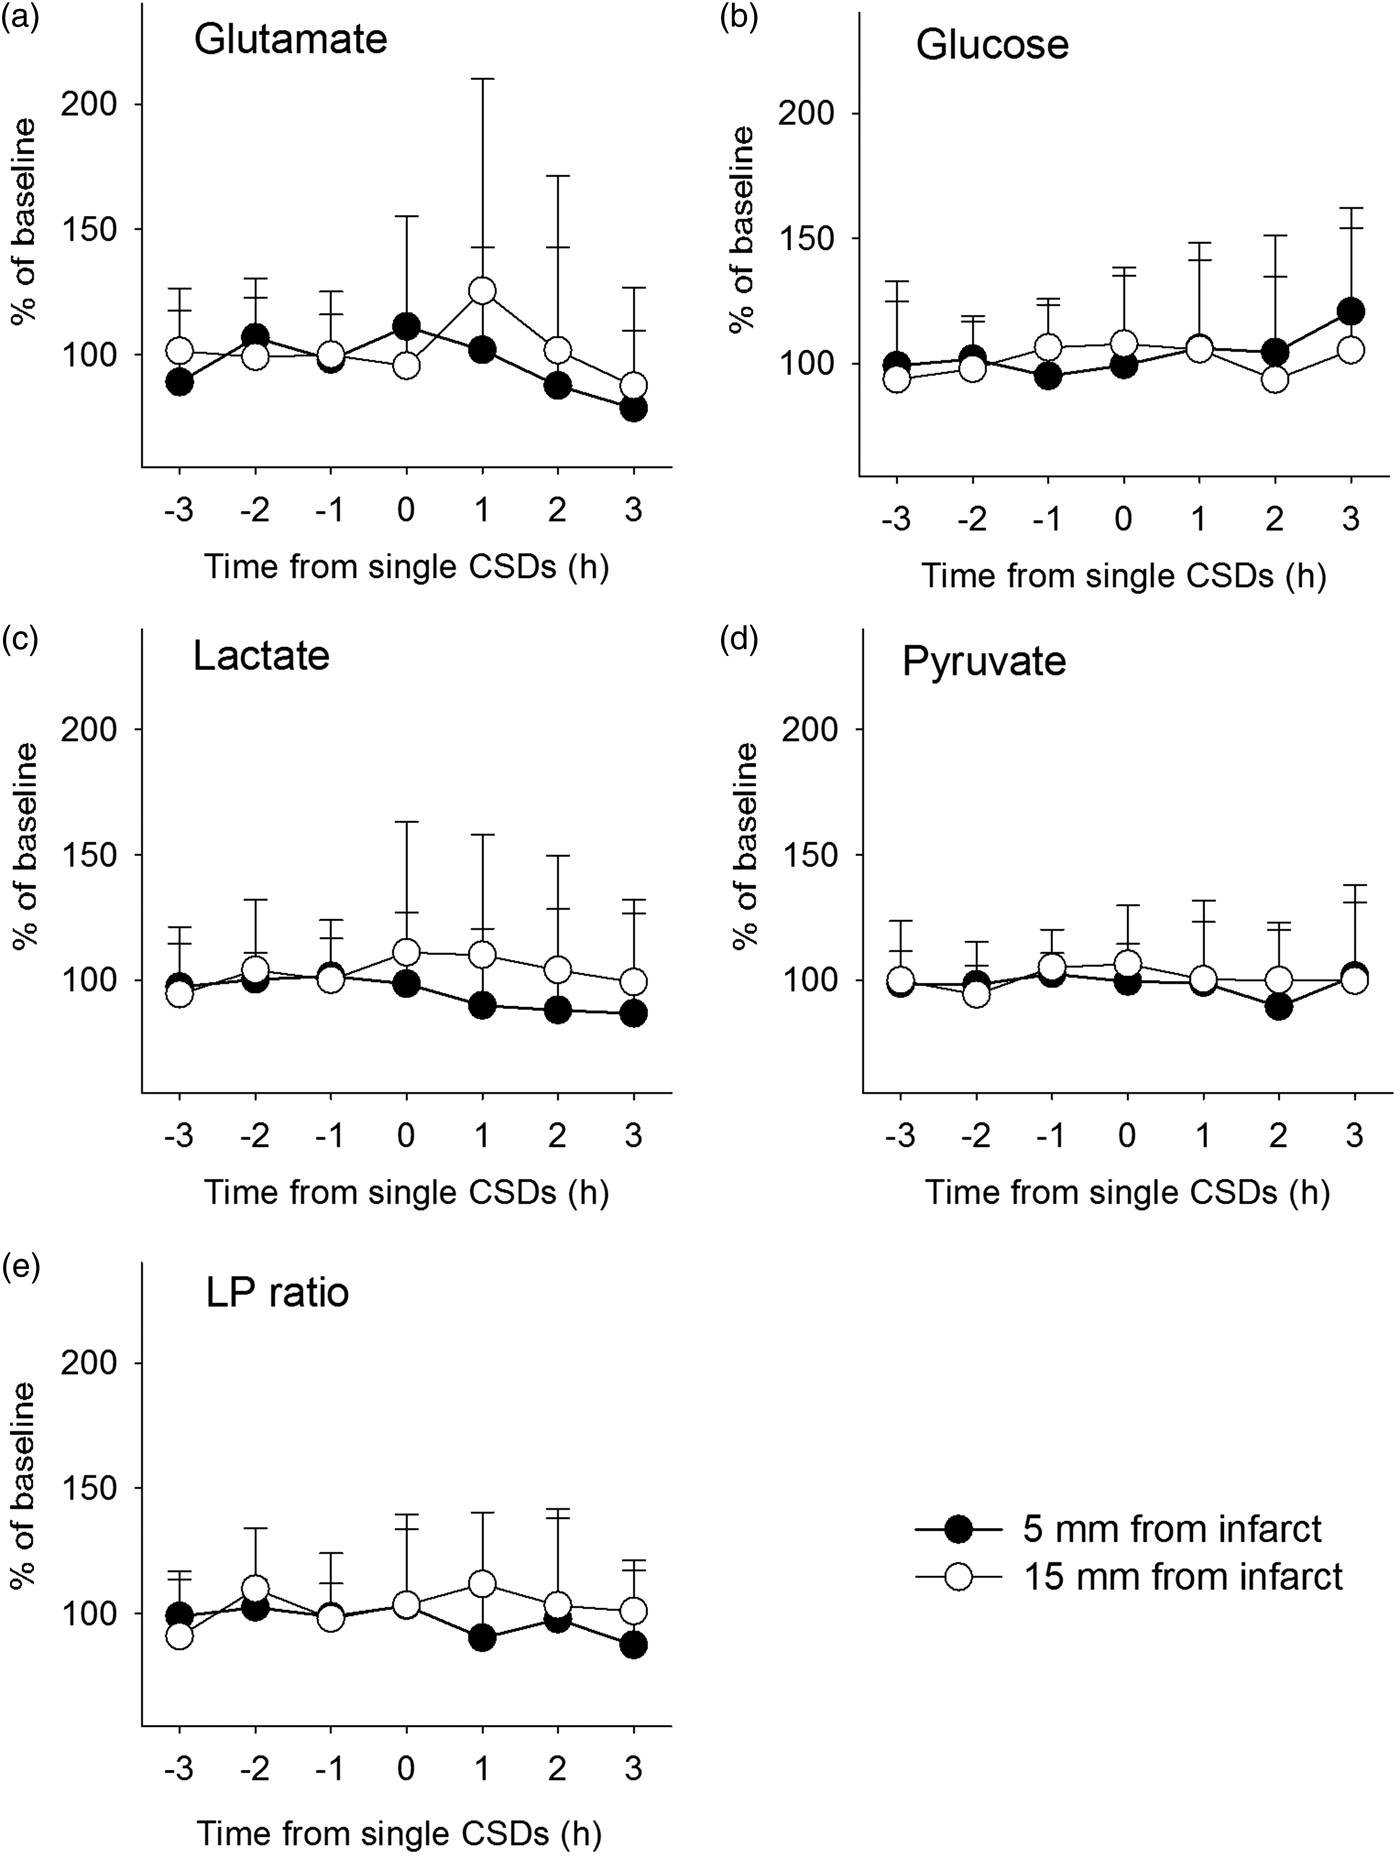
Minor changes of glutamate and glucose are associated with SD when compared to control periods without SD in the same patients
In a second approach, we analyzed microdialysate levels of glutamate, glucose, lactate, pyruvate and L/P ratio in samples with SDds, SDdc, SDis, and SDic compared to control values in the same patients recorded during time periods without SD (sampled 3 h before any type of SD). There were no significant differences between controls and any of the SD subtypes, except a significant decrease of glucose sampled during SDic at 5 mm to the infarct (Figure 4). Additionally, we also analyzed our data with a stricter clustering criterion of more than tw SDs per hour, including any type of SD.
45
When SDs occurred at this high rate, glutamate levels were significantly higher than controls.
Microdialysate glutamate (µmol/L) (a, f), glucose (mmol/L) (b, g), lactate (mmol/L) (c, h), pyruvate (µmol/L) (d,i) and lactate / pyruvate ration (e, j) values (median; interquartile range, and 10–90% values) in the hourly sampled microdialysis vial during SDds, SDdc, SDis or SDic at 5 mm (a–e) and 15 mm (f–j) to the infarct. In addition, samples with more than two SDs during the 1 h sampling time and the mean of all SDs were compared. Values of the microdialysis vial 3 h before SD served as control (no SD). There was a mild increase in glutamate in the samples when more than two SDs occurred within one hour and a slight decrease of glucose during SDic. Asterisks mark significant differences versus control (no SD).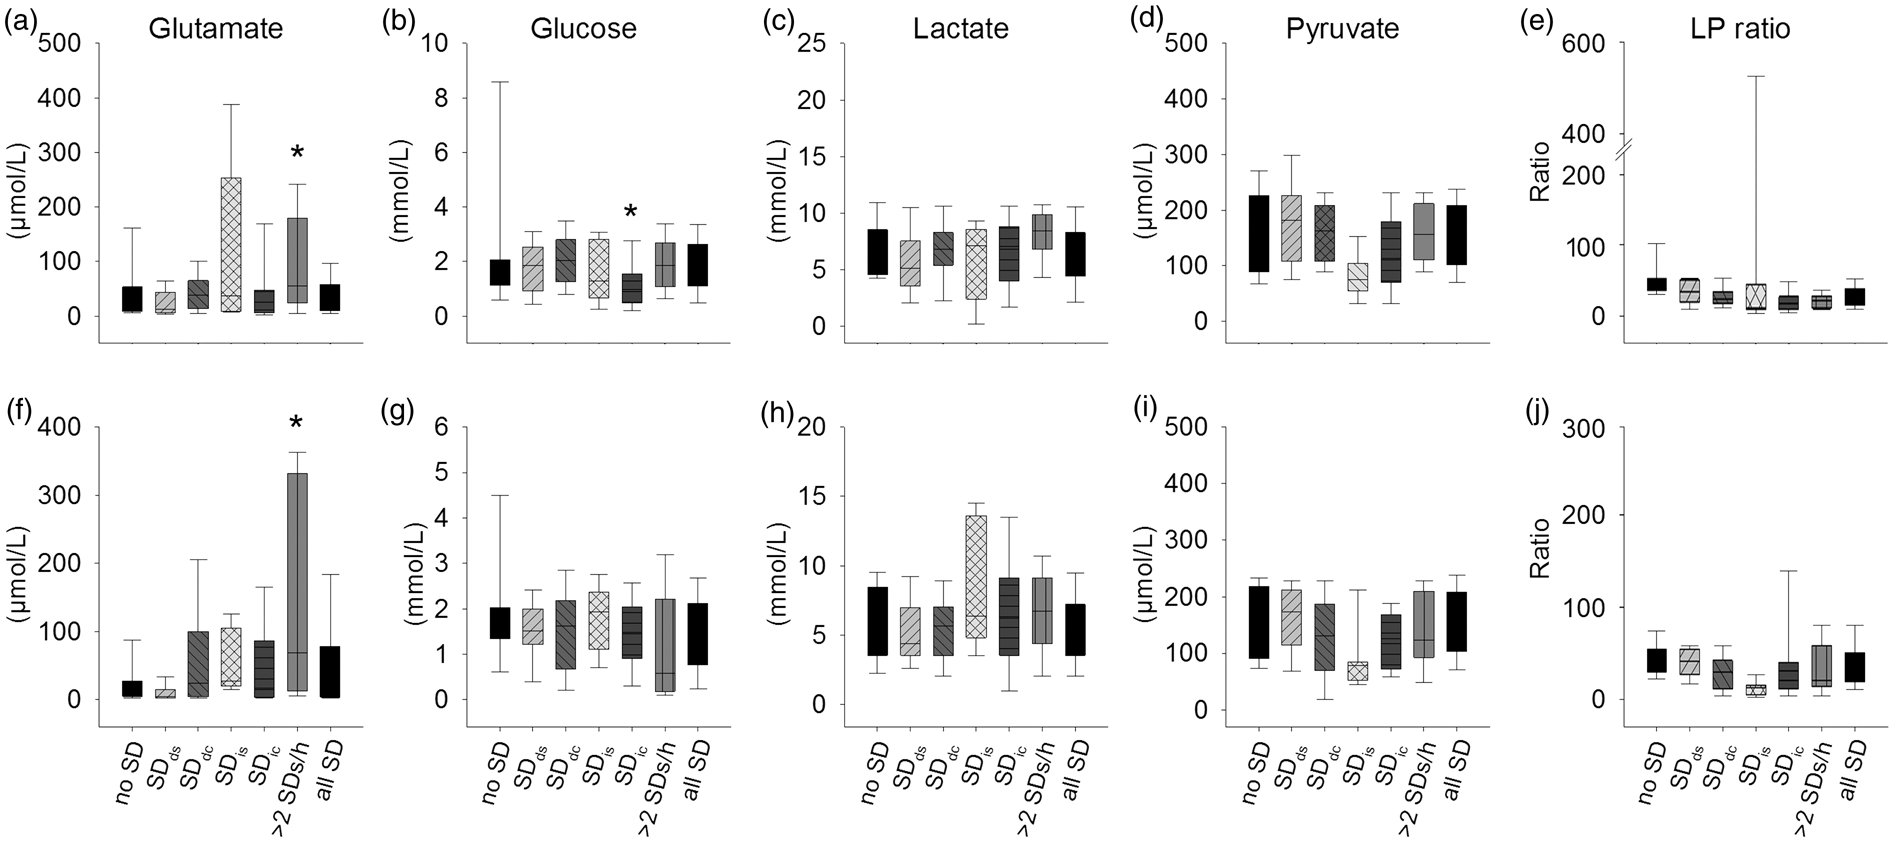
Discussion
Since its first introduction in 1992, 46 cerebral microdialysis has become an increasingly applied tool to investigate extracellular brain metabolites in neurocritical care patients. Meanwhile, increases in L/P ratio and glutamate are recognized indicators for poor outcome after brain injury.27,47 In the present study, we used intraoperative LSI to identify the infarct rim after MHS in order to allow precise implantation of two microdialysis probes in still viable peri-infarct tissue with a distance of 5 and 15 mm to the infarct border. In a previous study of the same patient population, we found that this tissue appears to be severely metabolically compromised. 1 Glucose and pyruvate levels were significantly lower when patients with infarct progression were compared to those without. Glutamate and L/P ratio were significantly elevated in patients with infarct progression early after surgery (12–36 h) at the 15-mm microdialysis probe location. Lactate was elevated but without difference between patients with and without infarct progression. To assess the relationship between the microdialysis parameters and SDs in the present study, ECoG was measured with a six-contact subdural electrode strip overlying the two microdialysis probes.
Overall a high number of SDs and significantly altered microdialysis values were observed in the peri-infarct tissue of patients with MHS when compared to other brain injuries.41,42 A significantly higher number of clustered SDs, both SDd and SDi, and significantly higher levels of microdialysate glutamate were recorded during the early postoperative period while glucose, lactate, pyruvate and L/P ratio 5 and 15 mm from the infarct displayed no significant alteration over time. Compared to normal brain tissue, glucose and pyruvate levels were in the normal range but lactate levels and L/P ratio were elevated. 47 This argues for a generally compensated energy status within the studied peri-infarct tissue with enhanced glycolysis relative to oxidative metabolism. The mild differences detected in our study when compared to patients with other brain injuries might be explained by the fact that TBI for example describes a very heterogeneous pathology with different degrees of affected brain tissue beneath the monitoring probes. In contrast, sampled tissue regions in our study were always close to a large area of necrosis. With such severe pathology characterized by high sustained levels of glutamate and a high rate of SDs, we may be observing a ‘ceiling effect’. In other words, we may be investigating a pathological phenomenon only at one end of the spectrum, which may limit an identification of additional significant correlations due to lack of heterogeneity.
The temporal pattern with elevated microdialysate glutamate levels and higher numbers of SDs within the first 36 h is similar to findings in patients with TBI 41 or animals after experimentally induced ischemia.48,49 It is nonetheless unlikely that glutamate release by SDs during the monitoring period was the source of the standard-sampling microdialysis-measured glutamate increase in our study because practically all our patients showed the same uniform time course of microdialysate glutamate concentrations with the highest concentration initially and a gradual, uniform decrease thereafter. Together with the previous finding that the absolute level of glutamate at 15 mm from the infarct was higher in patients with infarct progression, this uniform time course suggests that the absolute level of glutamate is a biomarker for the condition of the peri-infarct tissue at the time of probe implantation but only little additional information seems to be contained in the course of the standard-sampling microdialysis-measured glutamate values thereafter.
The absolute level of glutamate could be a biomarker for the condition of the peri-infarct tissue at the time of probe implantation for several reasons: (i) Implantation of the microdialysis probe inevitably induces a small necrosis at the site of probe implantation. 50 A higher absolute level of glutamate after probe implantation could indicate a larger probe-induced necrosis as a consequence of a higher vulnerability of the peri-infarct tissue. Higher tissue vulnerability might in turn be associated with higher risk for infarct progression. (ii) Another potential source of the initial glutamate peak is certainly the infarct core. (iii) A third potential source is the circulation if the paracellular pathway of the blood–brain barrier (BBB) is disturbed in the tissue where the probe is implanted. As a caveat of the latter it may be added, however, that the paracellular pathway for small molecules such as glutamate shows a much higher resilience to noxious stimuli including ischemia than the transcellular pathway for macromolecules such as albumin.51,52 In other words, opening of the paracellular pathway for glutamate seems to assume severe damage of the tissue already. Regardless of the source of glutamate, another important factor is the local glutamate uptake ability of the tissue surrounding the probe. In healthy tissue, glutamate is rapidly taken up by glutamate transporters. 53 Glutamate uptake depends on the transcellular sodium gradient and the sodium gradient depends on ATP-dependent sodium pumps. Thus, a higher absolute level of glutamate following probe implantation could indicate a more severe disturbance of energy-dependent glutamate clearance in peri-infarct tissue as a local marker for disturbed metabolism and higher risk for infarct progression.
The uniform time course of glutamate suggested on the other hand that standard-sampling microdialysis may not catch any of the highly dynamic changes of the extracellular glutamate concentration, which occur as an integral component of the SD process based on a large number of animal studies. 4 Accordingly, we did not find any significant changes of glutamate before and after SDds. In the grouped analysis, only a mild elevation of glutamate was observed when at least two SDs occurred within the 1-h period of sampling. Considering the similarities of all fundamental aspects of SDs already demonstrated,15,32,39,54 the negative results are probably not caused by fundamental biological differences between SDs in animals and humans. Rather, they are may be related to technical problems of the standard-sampling microdialysis, in particular its low time resolution. The sampling time of the standard-sampling microdialysis in our Institution is 1 h compared to a sampling time of an experimental microdialysis setup of 1 min 23 and that of an amperometric glutamate electrode of merely a few seconds.22,55 Furthermore, in contrast to glutamate-sensitive microelectrodes, microdialysis probes were considered a poor tool to study SD-induced glutamate increases in the tissue even in experimental studies because the microdialysis probes were found to inhibit SDs in the tissue immediately surrounding the microdialysis probe.23,56 In conclusion, ECoG is superior to standard-sampling microdialysis for the investigation of the highly dynamic pathophysiological changes in peri-infarct tissue following MHS but the initial glutamate peak seems to be valuable for estimating the risk of infarct progression. Whether or not SDs can be used to evaluate the risk of infarct progression after MHS remains to be shown in future studies. Such studies will not be trivial because different information is contained in the different frequency bands of the ECoG. As recently reviewed in detail, 38 full-band recordings, which were not performed in the present study, might contain information on the local energy status and local risk of injury at the recording site similar to microdialysis technology, while pattern changes in higher frequencies could permit remote detection of new ischemic zones. 57 However, this prognostic value might be hampered depending on the initial tissue damage before implantation of the ECoG strip; the more tissue is damaged, the more difficult it might be to detect further progression. This could be a particular problem in the setting of MHS where a large volume of tissue is already destroyed when the monitoring begins.
Footnotes
Funding
The author(s) disclosed receipt of the following financial support for the research, authorship, and/or publication of this article: J. Woitzik received research support from the Deutsche Forschungsgemeinschaft (DFG-WO 1704/1-1; DFG-WO1704/1-2). A. Pinczolits is funded by the Deutsche Forschungsgemeinschaft (DFG-WO 1704/1-1). JP. Dreier received research support from the Deutsche Forschungsgemeinschaft (DFG DR 323/5-1), Bundesministerium für Bildung und Forschung (Center for Stroke Research Berlin, 01 EO 0801), and Era-Net Neuron 01EW1212.
Acknowledgements
The authors thank our study nurses C. Altendorf and N. Gase (Center for Stroke Research Berlin, Charité-Universitätsmedizin Berlin) for research assistance and M. Scheel and G. Bohner (Department of Radiology, Charité-Universitätsmedizin Berlin) and J. Fiebach (Center for Stroke Research Berlin, Charité-Universitätsmedizin Berlin) for help with imaging processing.
Declaration of conflicting interests
The author(s) declared the following potential conflicts of interest with respect to the research, authorship, and/or publication of this article: J. Woitzik and N. Hecht worked as a consultant for Integra. P. Vajkoczy has worked as a consultant and served on the scientific advisory board for Aesculap.
Authors’ contributions
JW, CD, RG, JPD, and PV conceived, designed and supervised the trial. AP, AZ, NH, NNFD, SM, MKLW, CMK, CD, JPD and JW obtained and analyzed the data. AP wrote the first draft of the manuscript. JAH discussed the data and revised the manuscript. All authors were involved in interpretation of the data and critical revision of the manuscript and approved the final report.