
Abstract
Proton (1H) nuclear magnetic resonance (NMR) diffusion spectroscopy was used to assess apparent diffusion coefficients (ADCs) in rat brain slices. Aglycemic hypoxia caused reductions in the ADC of N-acetylaspartate (NAA) (0.15 to 0.09 × 10⁻³ mm2/s) and “slow” diffusion coefficient (D2) of tissue water (0.51 to 0.37 × 10⁻³ mm2/s), together with a 32 ± 11% increase in tissue water volume, attributable to tissue swelling. The ADC and D2 reductions were diminished, however, by removing external Ca2+, and under 10 mmol/L Mg2+, normoxic diffusion coefficients persisted until 40 minutes of hypoxia. The data suggest that the shift of water into the intracellular space alone cannot satisfactorily explain the reduced cerebral diffusion upon energy failure and that external Mg2+ and Ca2+ play crucial modulatory roles.
Keywords
The apparent diffusion coefficient (ADC) of tissue water declines within a few minutes of vascular occlusion and energy failure, leading to greatly enhanced detection of afflicted tissue by diffusion-weighted magnetic resonance imaging (Moseley et al., 1990). The method has consequently become particularly effective at identifying acute stroke victims (Baird and Warach, 1998). Paradoxically, the mechanisms affecting in vivo ADC are numerous, and their individual contributions to the overall diffusion change have proven to be difficult to quantify. The key hypothesis involves a shift of ions and water from the extracellular space into an inherently more restricted intracellular space in energetically compromised tissue, substantiated by the rapid perturbations known to occur in cerebral ion and water homeostasis (Hossmann, 1994) and the reduced extracellular volume fraction (Hansen, 1985).
Proton (1H) nuclear magnetic resonance (NMR) diffusion spectroscopy has been recently used to study the effects of ischemia on the ADCs of cerebral metabolites such as choline-containing compounds, creatine and phosphocreatine, and N-acetylaspartate (NAA) in ischemic stroke models in vivo (Wick et al., 1995; van der Toorn et al., 1996). The results show that the intracellular metabolites experience ADC reductions akin to water. The nature of this reduction has not been experimentally explained, however. In this study, we have examined the ADCs of an intracellular neuronal metabolite, NAA, and cytoplasmic proteins, as they probe an intracellular microenvironment, together with determining the ADC and apparent fractional distribution of water in the cortical brain slice preparation. We have also evaluated the dependency of these effects on external Ca2+ and Mg2+ to gain more insight into the underlying mechanisms of cerebral ADC reduction.
MATERIALS AND METHODS
Animal experiments were approved by the Ethical Committee of the National Laboratory Animal Center, University of Kuopio. Transverse cortical brain slices (thickness 0.35 mm) from adult male Wistar rats (200 to 250 g) were prepared using a McIlwain tissue chopper and superfused in a 15-mm NMR tube in Krebs-Henseleit buffer (KHB) containing 124 mmol/L NaCl, 5 mmol/L KCl, 1.2 mmol/L MgSO4, 1.2 mmol/L CaCl2, 26 mmol/L NaHCO3, 1.2 mmol/L KH2PO4, and 10 mmol/L D-glucose (324.8 mOsmol/L) equilibrated with O2/CO2 (95%/5%) at 37°C. During periods of aglycemic hypoxia, the slices were superfused in KHB with glucose omitted in otherwise normal KHB, in KHB with calcium omitted (0 mmol/L Ca2+), or in KHB containing 10 mmol/L Mg2+(Brooks and Kauppinen, 1993). Hypoxias lasting 10, 20, or 40 minutes were introduced by bubbling the medium with N2 (95%)/CO2 (5%). Slices were exposed to KHB containing 15 mmol/L KCl (high K+) for 20 minutes to assess ADC and volume changes. These conditions are known to depolarize cells without compromising their energy state (Lukkarinen et al., 1997). Slices were also superfused in KHB containing 248 mmol/L NaCl (572.8 mOsmol/L).
Proton (1H) NMR spectra were recorded using a Varian 16-mm NMR probe without the original aluminum cover (Varian Associates, Palo Alto, CA, U.S.A.) to reduce eddy currents imposed by the presence of metal in a 400-MHz vertical magnet interfaced to an SMIS microimaging and spectroscopy console (Surrey Medical Imaging Systems, Surrey, U.K.). Gradient system (Magnex Scientific, Abdingdon, U.K.; maximal amplitude 30 G/cm) performance was assessed by diffusion measurements on phantoms containing a 0.9% (wt/vol) NaCl solution of NAA (20 mmol/L) at 22°C, as described earlier (Hakumäki et al., 1998). Diffusion-weighted metabolite spectra were acquired using a binomial spin echo sequence, with excitation set at 2.0 ppm, and a pair of diffusion gradients along the Z-axis using four serial b values between 0 and 6,600 s/mm2 [gradient duration (δ) = 5.5 ms, gradient spacing (Δ) = 60 ms, dummy scans = 2, repetition time = 2.5 s, echo time = 120 ms]. Water spectra were obtained also in spectroscopy mode, with maximal excitation set on water, and with 16 serial b values between 0 and 4,600 s/mm2 (δ = 6.5 ms, Δ = 30 ms, dummy scans = 2, repetition time = 1.5 s, echo time = 60 ms). Choice of spectroscopy instead of imaging mode is substantiated by several factors such as improved temporal resolution without compromising signal-to-noise ratio (Busza et al., 1992; Davis et al., 1994) and the possibility of obtaining high b values (Niendorf et al., 1996).
Macromolecular diffusion was quantified using a stimulated echo sequence (1
RESULTS
The ADCs of NAA and water in 0.9% (wt/vol) NaCl solution at 22°C gave values of 0.52 ± 0.03 and 2.1 ± 0.02 × 10⁻³ mm2/s (n = 3), respectively. Biexponential decay was observed for water ADC in the brain slice preparation (Fig. 1A) analogously to that reported for in vitro cell studies containing a large extracellular fraction in the NMR cuvette (van Zijl et al., 1994). The data were best fitted according to a superposition of two exponential decays (R2 > 0.98):
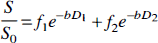
where S and S0 are the resonance signal intensities with and without diffusion weighting, 1 and 2 denote the water population fractions (f) and diffusion coefficients (D), and b denotes the diffusion-weighting factor.
In normoxic brain slices, D1 and D2 were 3.40 ± 0.20 and 0.51 ± 0.05 × 10⁻³ mm2/s, for the fast f1 and slow f2 decay fractions, respectively, with the f2 component accounting for 17 ± 3% of the signal. The actual physical volume fraction of tissue amounted to 17 ± 2% of NMR tube volume (n = 8). The diffusion-weighted NAA spectra (Fig. 1B) decayed monoexponentially (R2 > 0.95), similarly to the macromolecular methyl resonance at 0.9 ppm (not shown).
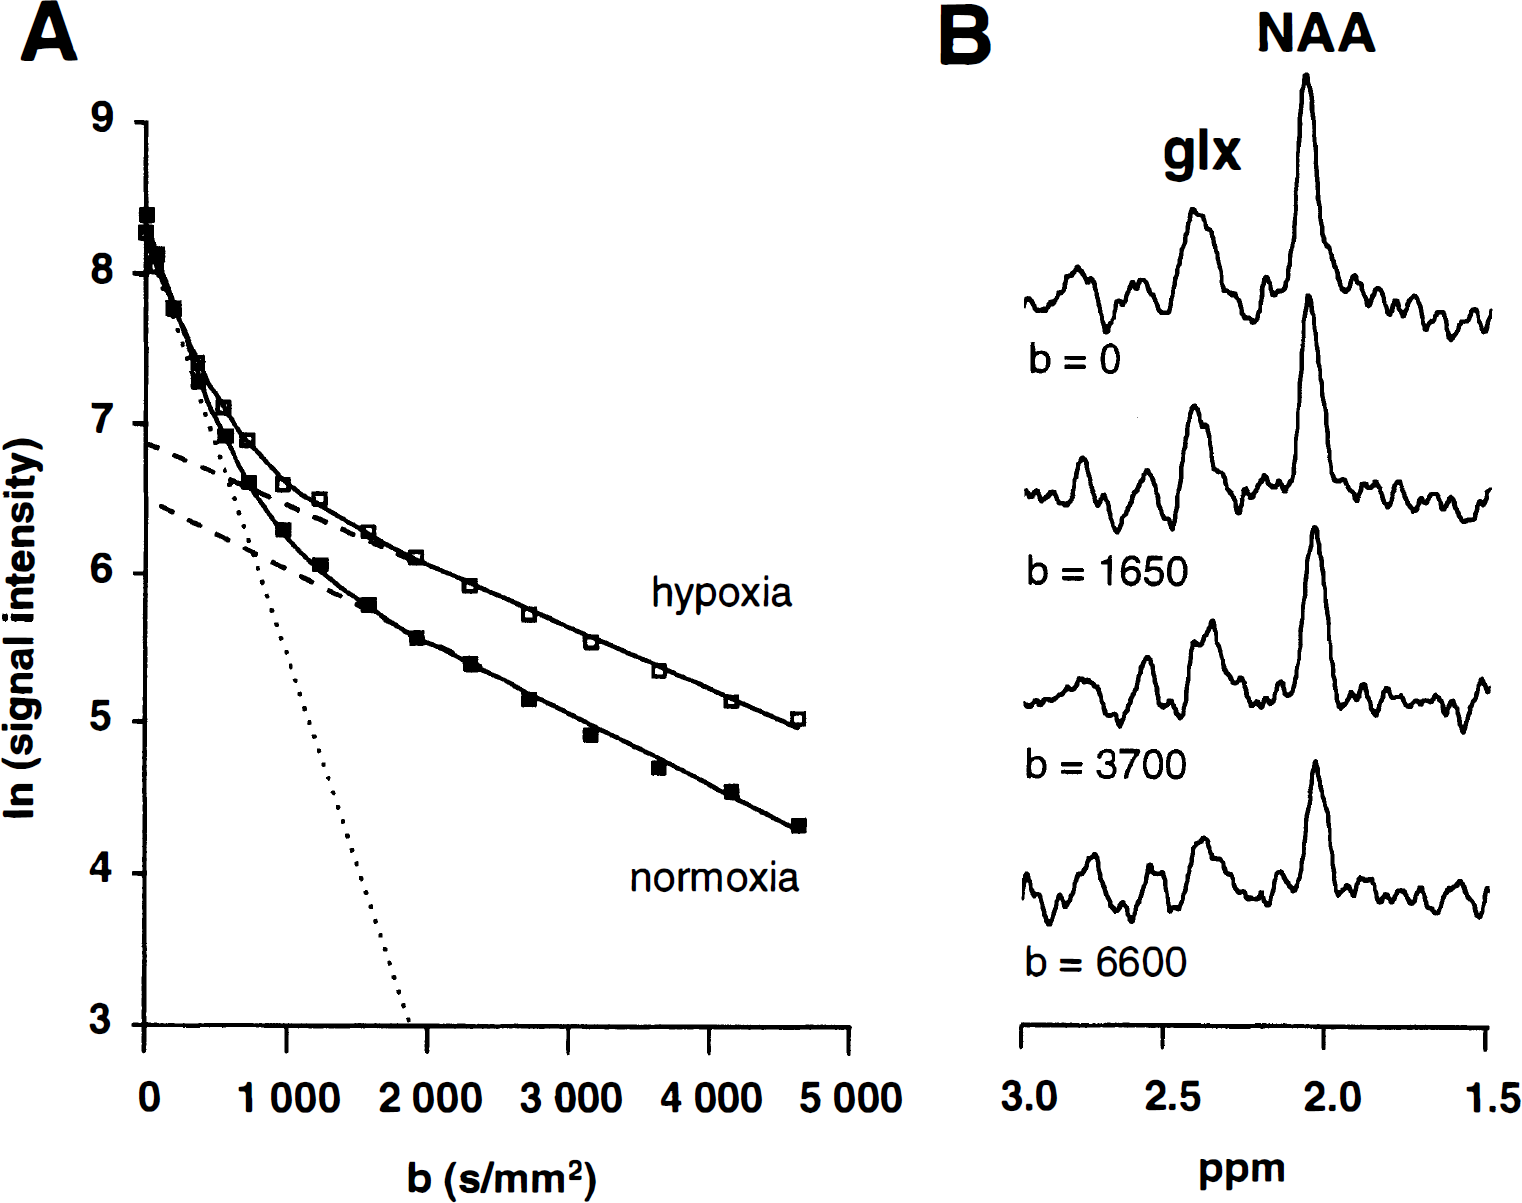
Elevated K+ leads to membrane depolarization and cell swelling mimicking of cerebral energy failure. However, when superfused with 15 mmol/L KCl for 20 minutes under these conditions, the phosphocreatine/ATP ratios are only slightly reduced (Lukkarinen et al., 1997) compared with the collapse observed in aglycemic hypoxia (Brooks and Kauppinen, 1993). Exposure to elevated KCl led to a 44% increase in f2, accompanied by D2 at 0.50 ± 0.03 × 10⁻³ mm2/s, and the ADC of NAA remained at 0.16 ± 0.02 × 10⁻³ mm2/s (Fig. 2A).
Proton nuclear magnetic resonance diffusion spectroscopy data from cortical slice preparation during depolarization with high (15 mmol/L) KCl and subsequent recovery
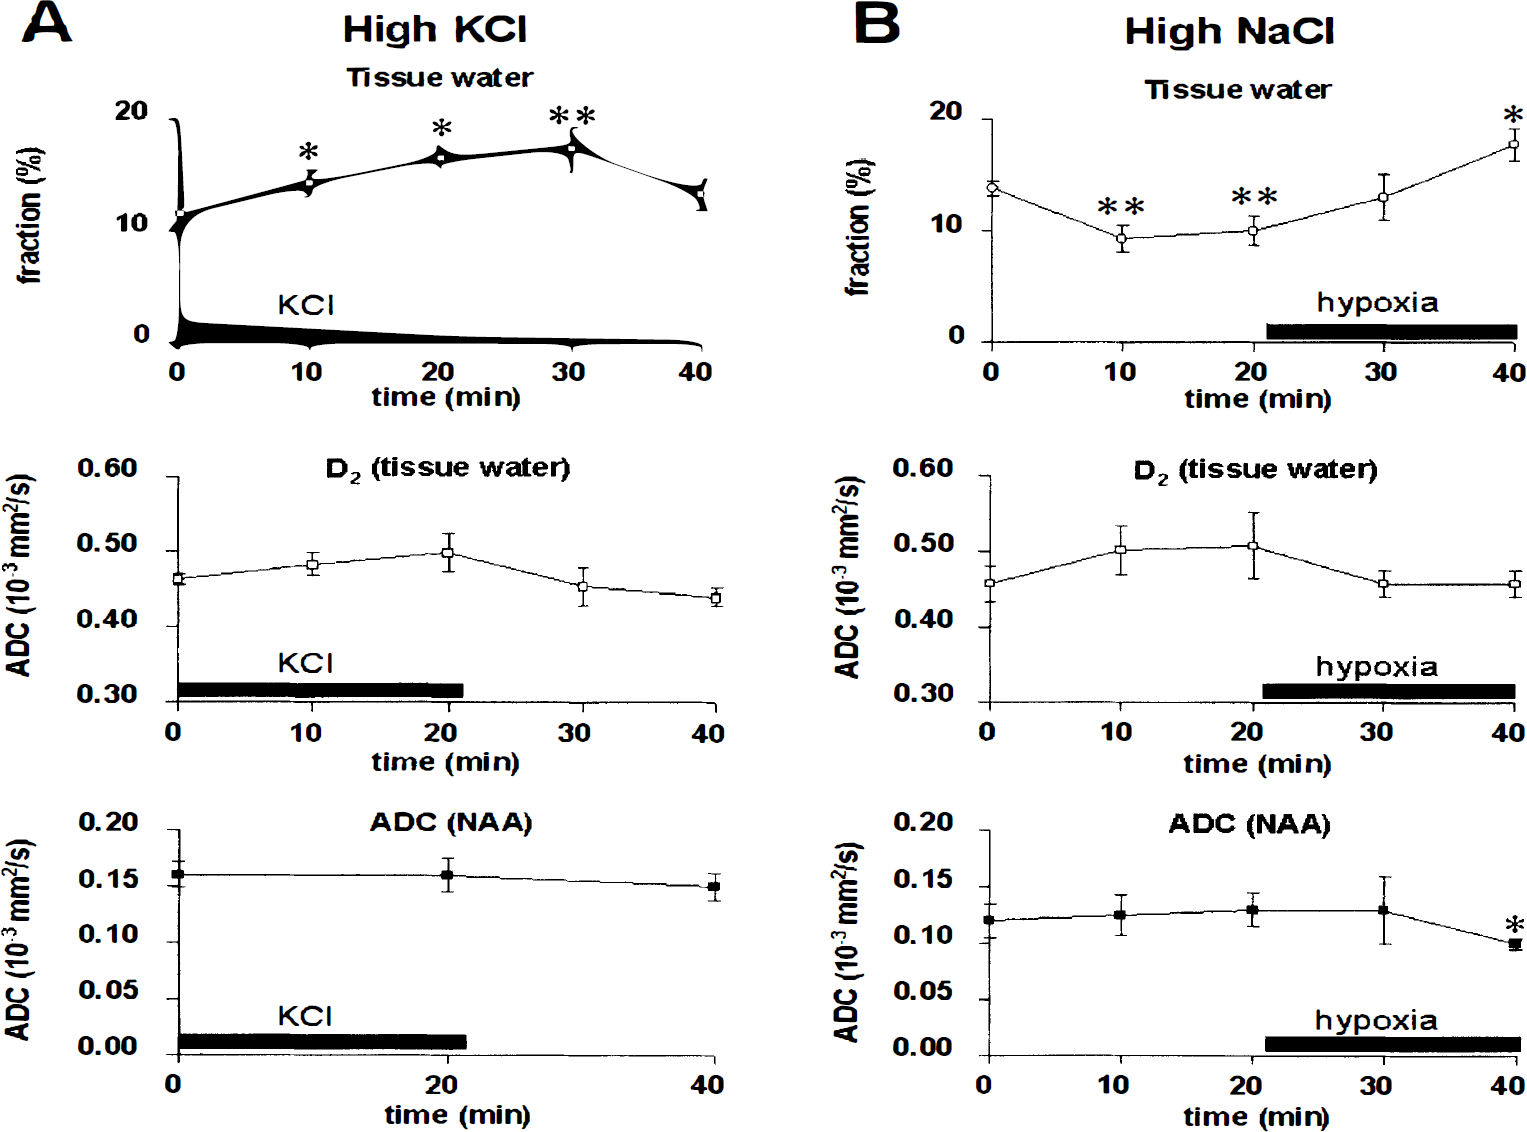
Aglycemic hypoxia in the presence of physiological KHB (Fig. 3A) led to a significant (29%) increase in f2 by 20 minutes. This was concurrent with a reduction in D2 to 0.43 ± 0.04 × 10⁻³ mm2/s, but the D1 did not change. By 40 minutes of hypoxia, f2 was elevated to 25 ± 2% and D2 reduced to 0.37 ± 0.04 × 10⁻³ mm2/s. N-Acetylaspartate is expressed exclusively in adult neurons, with a predominantly cytoplasmic location (Moffett et al., 1991), thus probing the intracellular milieu. The average ADC for NAA in normoxia was 0.15 ± 0.01 × 10⁻³ mm2/s, being significantly lower by 20 and 40 minutes of hypoxia (0.10 ± 0.02 and 0.09 ± 0.03 × 10⁻³ mm2/s, respectively), consistent with reduced diffusivity during energy failure in the cytoplasm. The ADC of the mobile protein resonance at 0.9 ppm (Kauppinen et al., 1992) was also reduced from 0.03 ± 0.01 × 10⁻³ mm2/s in normoxia to 0.02 ± 0.01 × 10⁻³ mm2/s after 40 minutes of hypoxia (P = 0.07, n = 5, Student's paired t test).
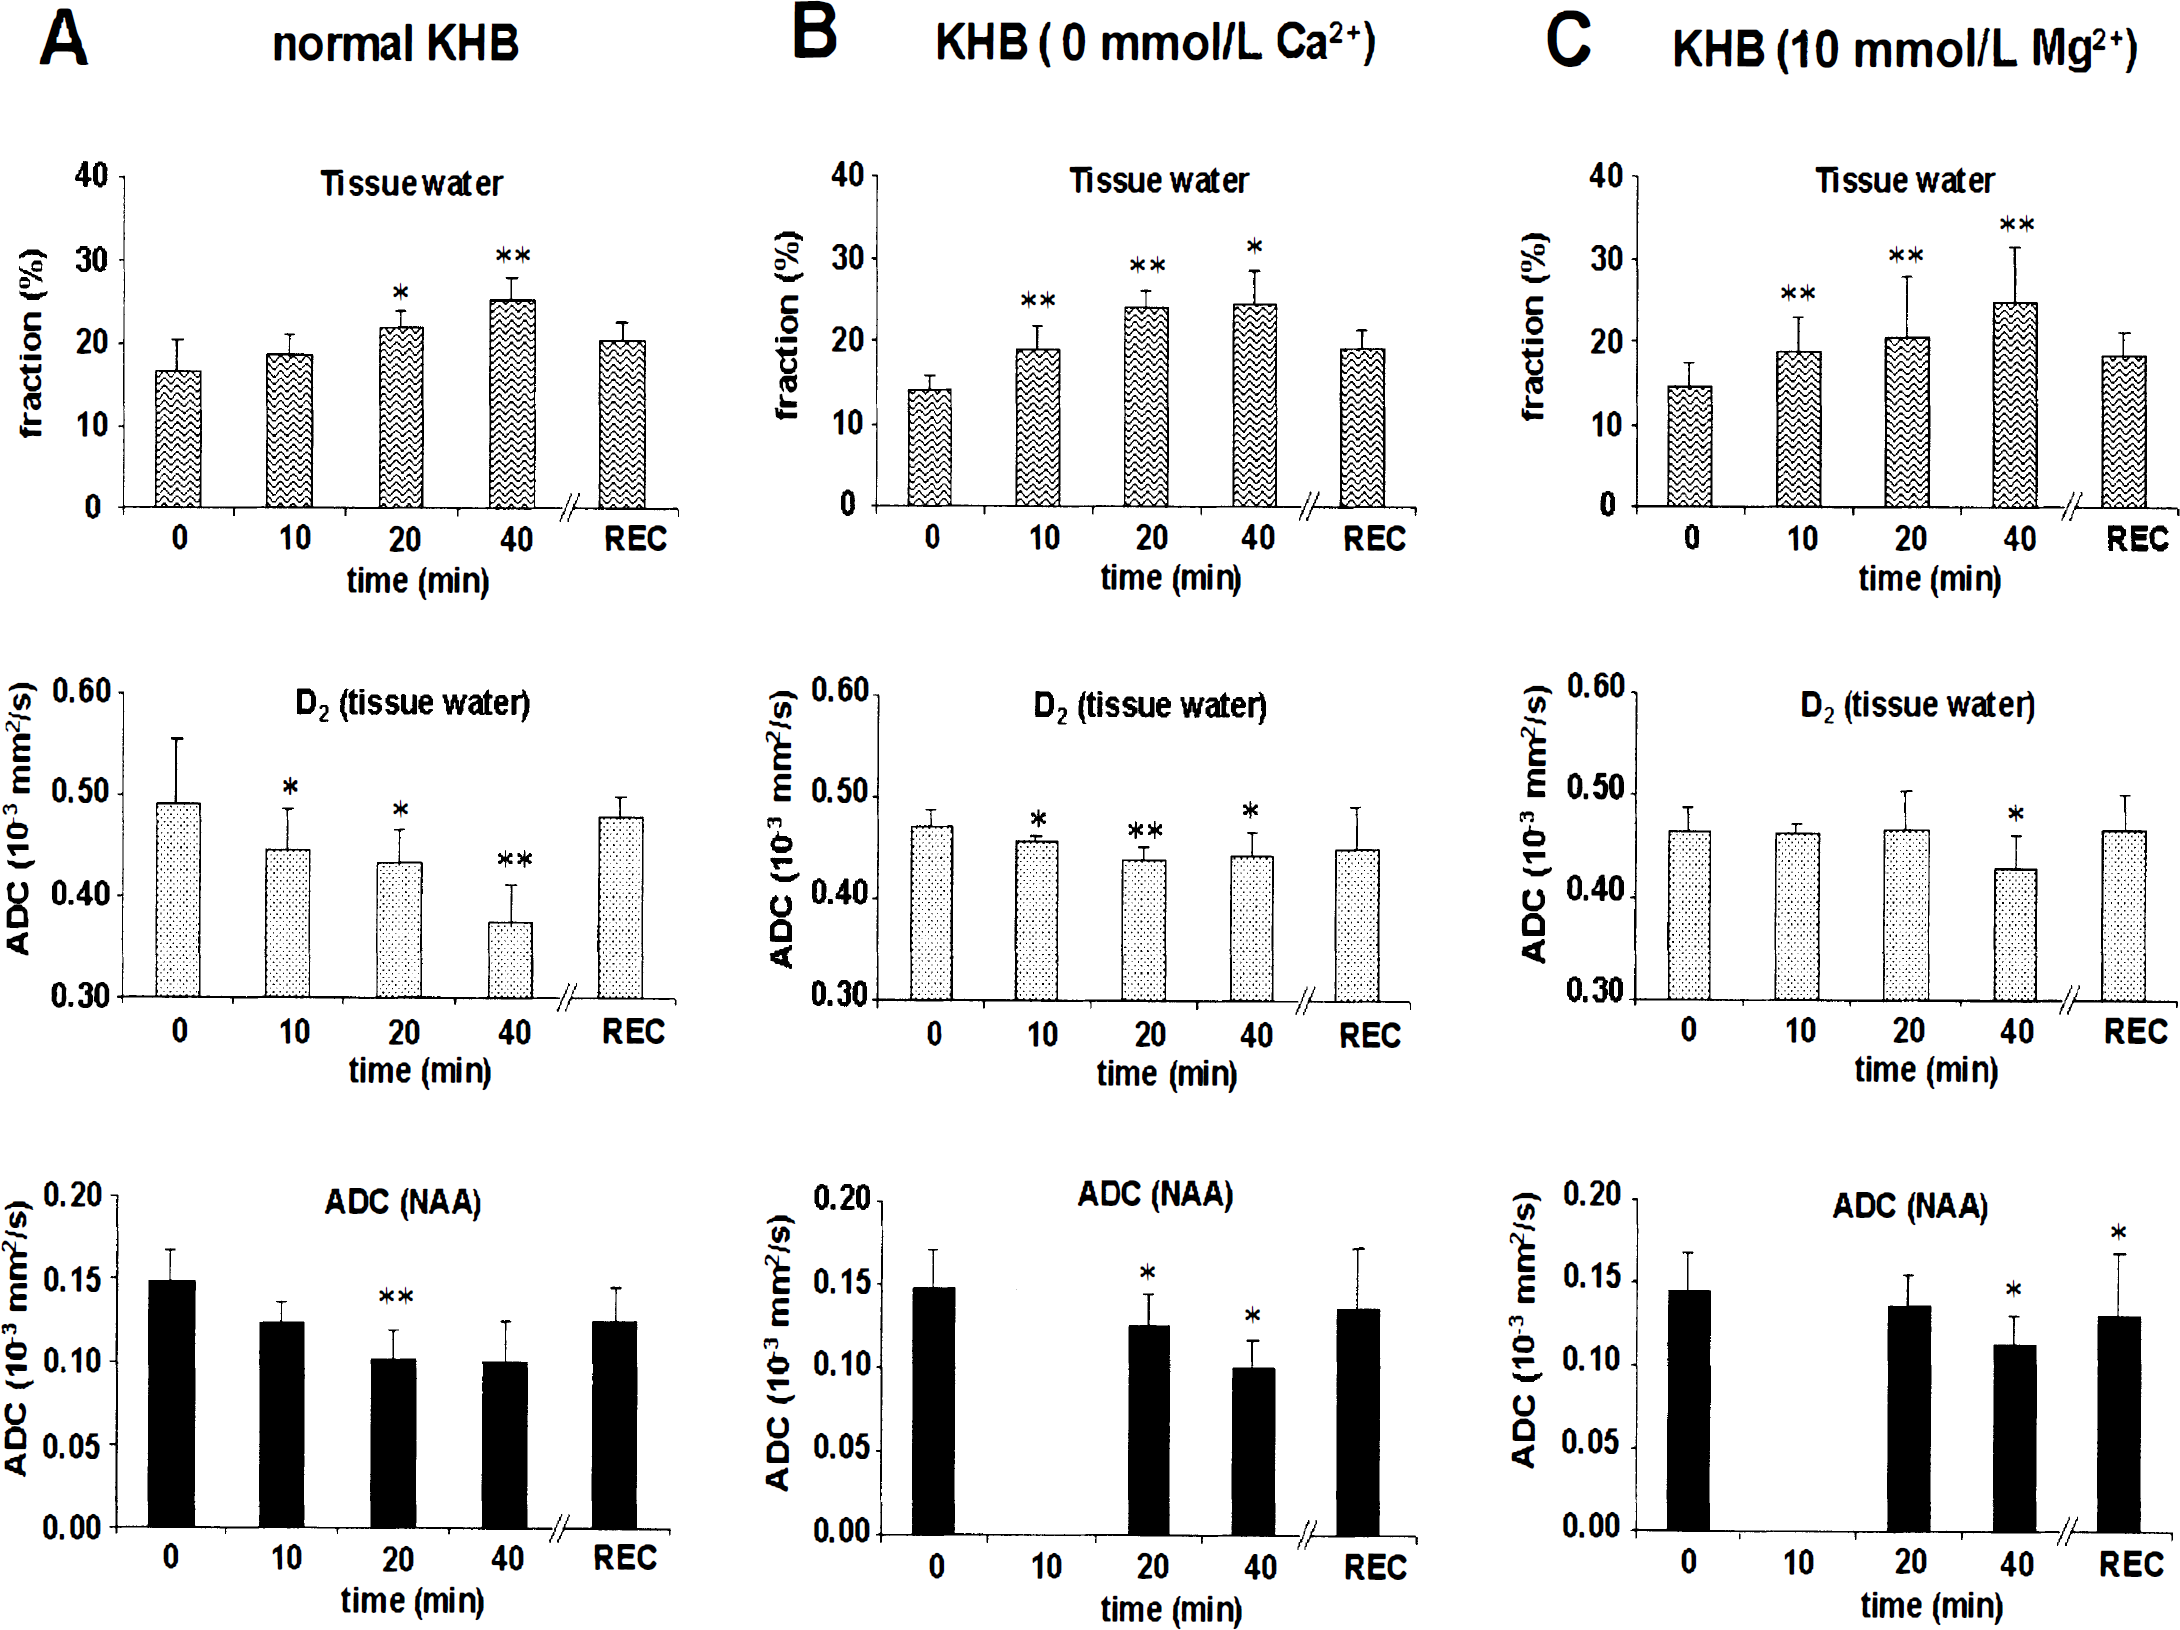
Proton nuclear magnetic resonance diffusion spectroscopy data from cortical slice preparation during aglycemic hypoxia in plain Krebs-Henseleit buffer
Aglycemic hypoxia leads to complete energy failure with similar kinetics in KHB with 0 Ca2+ or 10 mmol/L Mg2+, yet the metabolic recovery of cerebral tissue after reoxygenation is greatly improved relative to plain KHB (Brooks and Kauppinen, 1993). When Ca2+ was omitted from the buffer during hypoxia, a similar increase in f2 was observed, but reductions in diffusion coefficients of both water and NAA were attenuated (Fig. 3B). However, when hypoxic slices were superfused with plain KHB containing 10 mmol/L external Mg2+, the ADC of NAA and water D2 remained at control levels until 40 minutes of hypoxia, despite the large increase in f2, as observed in hypoxia in plain KHB (Fig. 3C). There were no differences in ADCs after recovery from 20 minutes of aglycemic hypoxia, except for NAA after hypoxia induced in 10 mmol/L Mg2+ KHB.
As an increase in f2 was detected in hypoxic tissue independent of external Ca2+ and Mg2+ status, we tested the effects of high NaCl, known to induce cell shrinkage in an ex vivo brain preparation due to an osmotic effect (Krizaj et al., 1996). In normoxia, KHB supplemented with additional 124 mmol/L NaCl resulted in a severely reduced f2, with no significant effect on D2 of water and ADC of NAA. Hypoxia under the same conditions caused a large increase in f2, with subsequent reductions in the diffusivity of water and NAA (Fig. 2B).
The apparent intracellular tortuosity values (λapp) were calculated for normoxic and hypoxic cortical brain tissue with the approach of van der Toorn and co-workers (1996) using ADC data for NAA in vivo and in vitro. For macromolecules, a reference in vitro value of D ∼0.12 × 10⁻³ mm2/s, as observed for polypeptides such as bovine pancreatic trypsin inhibitor or ubiquitin, was used (Iiyina et al., 1997). Interestingly, the λapp values using the water fraction f2 were very similar. In hypoxia with external Ca2+ omitted, similar reductions were observed (Table 1).
Apparent intracellular tortuosity values (λapp) from cortical slice preparate diffusion data
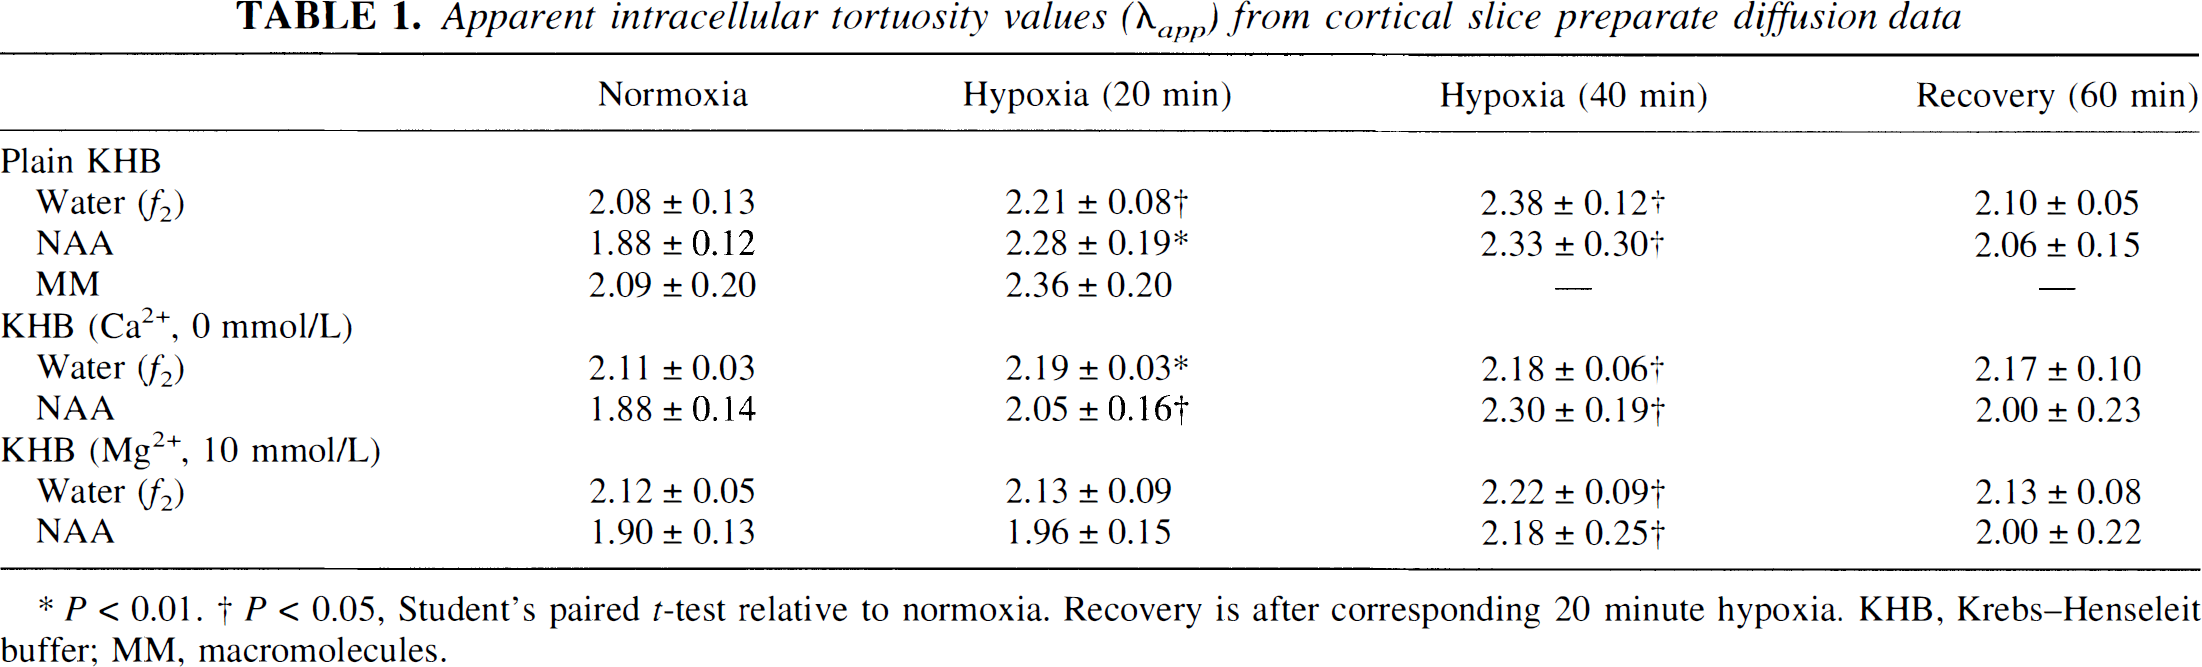
P < 0.01.
P < 0.05, Student's paired t-test relative to normoxia. Recovery is after corresponding 20 minute hypoxia. KHB, Krebs–Henseleit buffer; MM, macromolecules.
DISCUSSION
The present data show that the ADC of NAA responds to external cation manipulations during energy failure. The ADC reduction can be attenuated by omitting external Ca2+ and, more extensively, delayed by the presence of 10 mmol/L external Mg2+. The latter effect is particularly interesting because it demonstrates that diffusion changes can be dissociated from volume changes. The fact that high external NaCl cannot prevent intracellular ADC change, unlike high Mg2+, strongly argues for a contributing cytoplasmic process behind the altered diffusivity upon hypoxic energy failure. Mg2+ is a natural, nonspecific Ca2+ blocker, affecting several cation channels (Iseri and French, 1984; Mayer et al., 1984), and its intracellular concentration follows the extracellular one (Garcia-Martin et al., 1995). Energy failure per se, however, does not cause an increase in the intracellular concentration of Mg2+(Heinonen and Åkerman, 1987).
The reduction in water diffusion upon ischemic energy failure has been interpreted as a shift of more freely diffusing extracellular water into the more restricted, possibly more viscous intracellular space after loss of membrane potential, reducing the extracellular-to-intracellular volume ratio (Hansen, 1985) and resulting in increased extracellular restriction (Szafer et al., 1995). This theory has faced a challenge from recent ischemia studies demonstrating concomitant reductions also in the ADCs of intracellular metabolites (Wick et al., 1995; van der Toorn et al., 1996; Duong et al., 1998; Dijkuizen et al., 1999) and ions (Neil et al., 1996)in vivo. In fact, a recent NMR study using phosphorus metabolites as compartment-specific probes demonstrated similar reductions in the ADCs of both intra- and extracellular spaces during energy failure (Duong et al., 1998). This observation together with our data imply that the dominant restriction to overall diffusion must take place intracellularly. The metabolite data also imply that choline-containing compounds, creatine plus phosphocreatine, NAA, and inositol (Wick et al., 1995) are nearly uniformly affected.
There are several factors in the experimental design that need to be discussed when interpreting the present water diffusion coefficients. We use b values up to 4,600 s/mm2 in quantifying water diffusion coefficients, whereas the majority of diffusion magnetic resonance imaging studies are carried out with b values up to 1,500 s/mm2. The NMR data acquisition conditions inevitably weight the data for given water populations within the biological sample (van Zijl et al., 1994; Niendorf et al., 1996). In the brain slice preparation, it is necessary to use high b values to suppress the signal from the buffer, and the fast water component attains zero signal intensity at b of ∼2,000 s/mm2 (Fig. 1). It should be kept in mind that in vivo, ∼80% of brain water is intracellular, and thus intracellular water is likely to play a dominant role in diffusion images under commonly used magnetic resonance imaging acquisition conditions with typical b values in the order of 1,500 s/mm2. The assignment of the two water fractions in the brain slice preparation to physical equivalents is not difficult, but data interpretation at the level of specific subcellular compartments may not be as straightforward as for NAA, however. We assign f1 to the buffer because its ADC matches that of free water at 37°C and the NMR signal from f1 is completely suppressed with similar b values as the extracellular water in an in vitro cell preparation (van Zijl et al., 1994). The f2 and D2 represent “tissue water” and, indeed, a D2 of 0.51 × 10⁻³ mm2/s determined in normoxic slices is in a good agreement with the average water ADC determined in an immobilized hippocampal brain slice using magnetic resonance imaging at similar b values (Buckley et al., 1999). The f2 gains contributions from various water tissue compartments, and furthermore, the exchange between and within different tissue compartments at Δ = 30 ms is likely to bias assignment of f2(Pfeuffer et al., 1998). Interestingly, diffusion data of NAA and water f2 are in apparent agreement under all conditions, which appears to argue for a minor contribution for the expected exchange weighting both between extra- and intracellular space and also intracellularly to the values of f2 and D2. We therefore use f2 as an apparent indicator of tissue water, bearing in mind the uncertainty associated with exchange processes between intra- and extracellular spaces within tissue (Pfeuffer et al., 1998). It should be pointed out that the present diffusion data should not be affected by expected T1 and T2 relaxation changes, as dummy scans were used to achieve magnetic equilibrium acquisition and the data were fitted into exact equations.
An important technical issue is that the diffusion measurements were carried out with slices in a stand-still situation, which will inevitably lead to anoxia over time. However, the dissolved oxygen in KHB bubbled with O2/CO2 is sufficient to maintain tissue energetics for several minutes after flow is halted, whereas the residual oxygen in a hypoxic preparation is exhausted in 2 minutes (Kauppinen and Williams, 1990). The ADC of NAA determined in our preparation is essentially identical to that from previous in vivo reports (Wick et al., 1995; van der Toorn et al., 1996), showing that the normoxic cortical slices are under energetically physiological conditions for the duration of the measurement. Furthermore, the proportional ADC reductions of NAA and water upon induction of aglycemic hypoxia agree with in vivo ischemia studies (Davis et al., 1994; Wick et al., 1995; van der Toorn et al., 1996).
Brain slices are a well-documented model for cortical brain in metabolic studies by NMR spectroscopy, maintaining similar phosphocreatine/ATP ratio as brain in vivo and low lactate concentration (Bachelard and Badar-Goffer, 1993; Kauppinen and Williams, 1990). Brain slices actively metabolize [13C]glucose (Lukkarinen et al., 1997), similar to the brain in vivo(Fitzpatrick et al., 1990). Accepting the drawback of nonphysiological extracellular-to-intracellular water volume ratio as discussed above and the possibility that cell swelling might be greater ex vivo than in vivo, the brain slice preparation offers a wider attainable range of experimental conditions than the brain in vivo. The ADC data of NAA from the slice preparation both under controlled and compromised energetic conditions are consistent with those obtained in in vivo conditions (Wick et al., 1995; van der Toorn et al., 1996; Dijkhuizen et al., 1999), thus validating the use of the brain slice preparation in studying the mechanistic aspects of molecular diffusion.
The present data show that the early diffusion drop in brain cortex in vitro upon hypoxia is expressed only if (1) ATP is exhausted, (2) external Ca2+ is present, and (3) external Mg2+ is present at a physiological level. Membrane depolarization without energy failure and acute cell swelling in the absence of ATP with high external Mg2+ apparently are not sufficiently strong perturbations of tissue homeostasis to influence ADC within the first 20 minutes of hypoxia, when intracellular sodium concentrations are uninfluenced (Brooks et al., 1993). The observation with 15 mmol/L KCl is in line with a previous hippocampal brain slice study showing no diffusion change in the two cerebral diffusion coefficients upon ouabain poisoning but an increase in the fraction of slowly diffusing water, possibly reflecting cell swelling (Buckley et al., 1999). The cation dependency of ADC changes in energy failure suggests biochemically driven mechanisms behind this phenomenon. These can be brought forth by increased intracellular tortuosity and viscosity due to structural reorganization such as disassembly of cytoplasmic proteins or of the cytoskeleton (Pettigrew et al., 1996) or reduced microcirculation (Duong et al., 1998). Interestingly, ADC reductions of similar magnitude are observed in cortical spreading depression induced by applying concentrated KCl topically in vivo(Gardner-Medwin et al., 1994). Although our model with 15 mmol/L external KCl mimics the situation, it must be stressed that spreading depression induces a severe 40 to 45% maximal reduction in cortical ATP and a 75% reduction in phosphocreatine (Gault et al., 1994), which might facilitate an adverse, albeit temporary, structural aberration within the cell interior.
Footnotes
Abbreviations used
Acknowledgements
The authors thank Dr. Kai Kaila for comments on the manuscript.