
Abstract
Neocortical metabolism was studied during moderate hypoxic hypoxia, reoxygenation, and postmortem periods in anesthetized normocapnic rats using 1H nuclear magnetic resonance (NMR) spectroscopic imaging. Rats were prepared with unilateral common carotid occlusion to determine the ipsilateral metabolic effects of inadequate cerebral blood flow (CBF) response to hypoxia. No difference in brain metabolism between the two hemispheres was found during the control period. Hypoxic hypoxia (Pao2 = 54.1 ± 5.8 mm Hg) resulted in a significant rise in neocortical lactate peak in both hemispheres, with an additional marked rise in the clamped side compared to the unclamped side (53 ± 27 vs. 22 ± 13% of postmortem value, p < 0.001). These lactate changes were not reversible within 30 min of reoxygenation in the clamped hemisphere. No changes in neocortical lactate peak were observed while elevating arterial lactate via intravenous lactate infusion without hypoxia. In addition, hypoxic hypoxia resulted in an apparent decrease in neocortical water and N-acetyl aspartate (NAA) signals, which were related to a shortening in T2 relaxation times. It is concluded that neocortical lactate is an early metabolic indicator during moderate hypoxic hypoxia in normocapnic conditions.
Impairment of brain energy metabolism during severe hypoxic hypoxia and ischemia has been extensively studied (for review, see Siesjö, 1978). Moderate hypoxic hypoxia (Pao2 60–40 mm Hg) was accompanied by an increase in cerebral blood flow (CBF) (Borgström et al., 1975; Shockley and LaManna, 1988) while no changes in high-energy phosphate compounds nor in intracellular pH (pHi) occurred in the brain (Nioka et al., 1990). This suggests that circulatory compensation per se was adequate to maintain brain energy metabolism during such moderate hypoxic hypoxia. However, early accumulation of lactate content has been reported at this level of hypoxic hypoxia using biochemical assays (Gurdjian et al., 1944; Siesjö and Nilsson, 1971) as well as 1H nuclear magnetic resonance (NMR) spectroscopy (Allen et al., 1992) on the whole brain. Others did not find brain lactate changes until Pao2 was reduced to <40 mm Hg (Kogure et al., 1977). Because postmortem glucose is metabolized within a few seconds, results from brain lactate measurements using biochemical assay depend on optimal freezing conditions (Veech et al., 1973). In addition, some data were obtained during hypocapnia (Gurdjian et al., 1944; Allen et al., 1992), which gradually increases the brain lactate level (Petroff et al., 1985).
The aim of the present study was to reevaluate changes in brain lactate during moderate and reversible hypoxic hypoxia in normocapnic animals using localized 1H NMR spectroscopy within the neocortex. The significance of brain lactate accumulation during hypoxic hypoxia is not clear since it could reflect inadequate CBF response to hypoxia, passive flux of lactate from blood to tissue, or increased lactate production under aerobic conditions. In order to delineate the effects of a reduced CBF response to hypoxia, hypoxic hypoxia was combined with occlusion of unilateral common carotid artery. Such a carotid occlusion produces an asymmetrical CBF response to hypercapnia (De Ley et al., 1985) and to hypoxia (Salford and Siesjö, 1974). Using 1H NMR spectroscopic imaging during control, hypoxic hypoxia, reoxygenation, and postmortem periods, intensities of lactate, N-acetyl aspartate (NAA) and water peaks were determined both in the clamped side and the opposite undamped side of the neocortex. Since cerebral blood deoxygenation per se could affect the 1H NMR signal (Prielmeier et al., 1994), T1 and T2 relaxation times of water were measured during this hypoxic protocol. In addition, we investigated the effects of elevated arterial lactate levels on neocortical metabolism without hypoxic hypoxia by means of an intravenous lactate infusion.
MATERIALS AND METHODS
Animal preparation
Fed Sprague–Dawley female rats (220–260 g each) were studied. A radiofrequency (RF) surface coil was chronically implanted in the skull, as previously described (Décorps et al., 1984). Anesthesia was induced with 4.0% halothane and then maintained with 1–1.5% halothane during surgery. For local anesthesia at all surgical sites, 1% lidocaine was injected subcutaneously. After tracheostomy, rats were mechanically ventilated with 0.5% halothane and 70% nitrous oxide-30% oxygen (vol/vol) using a rodent ventilator (Edco/NEMI, Model 804, Medway, MA, U.S.A.). Ventilation was adjusted to maintain Paco2 at 30–35 mm Hg. The fractional inspired (Fi) oxygen (FiO2) was continuously monitored (MiniOX I analyzer, Catalyst Research Corporation, Owings Mills, MD, U.S.A.). Normal saline containing pancuronium bromide (0.04 mg/ml) and dopamine (0.06 mg/ml) were infused intraperitoneally at a rate of 1–2 ml/h throughout the study. Dopamine was required to limit the systemic effects of both the hypoxic stimulus and the upright position, the NMR studies being performed in a vertical magnet. All groups of animals received equal amounts of dopamine. After ligation of the left common carotid artery, a 0.7-mm indwelling catheter was inserted into the artery to monitor mean arterial blood pressure (MABP) via a graphic recorder (8000S, Gould Electronic, Ballainvilliers, France). In addition, blood gases (Pao2, Paco2), and arterial pH (Radiometer BSM-3 electrodes and analyzer, Copenhagen, Denmark), arterial hemoglobin concentration (hemoglobinphotometer, HemoCue AB, Helsingborg, Sweden), and arterial plasma lactate and glucose concentrations were analyzed from <0.3 ml arterial blood samples. Rectal temperature was maintained at 37.5 ± 0.5°C by a heating pad placed on the abdomen.
1H NMR experiments
In vivo NMR was performed with a Bruker CXP console (Bruker Spectrospin, Wissembourg, France) equipped with a 4.7 T, 98-mm diameter vertical core magnet. 1H-NMR experiments, including imaging, spectroscopy, and spectroscopic imaging, were carried out with a 10-mm diameter surface coil turned to 1H (200 MHz). Magnetic field homogeneity was adjusted in order to obtain a water linewidth of <0.15 ppm. Anatomical description of the neocortex was then obtained by acquiring proton images using a standard spin-echo two-dimensional (2D) Fourier transform (FT) technique [repetition time (TR) = 1,500 ms, echo time (TE) = 34 ms, slice thickness = 1 mm, field of view = 20 mm, 256 × 256]. The slice was orthogonal to the axis, Y, of the surface coil (Fig. 1).
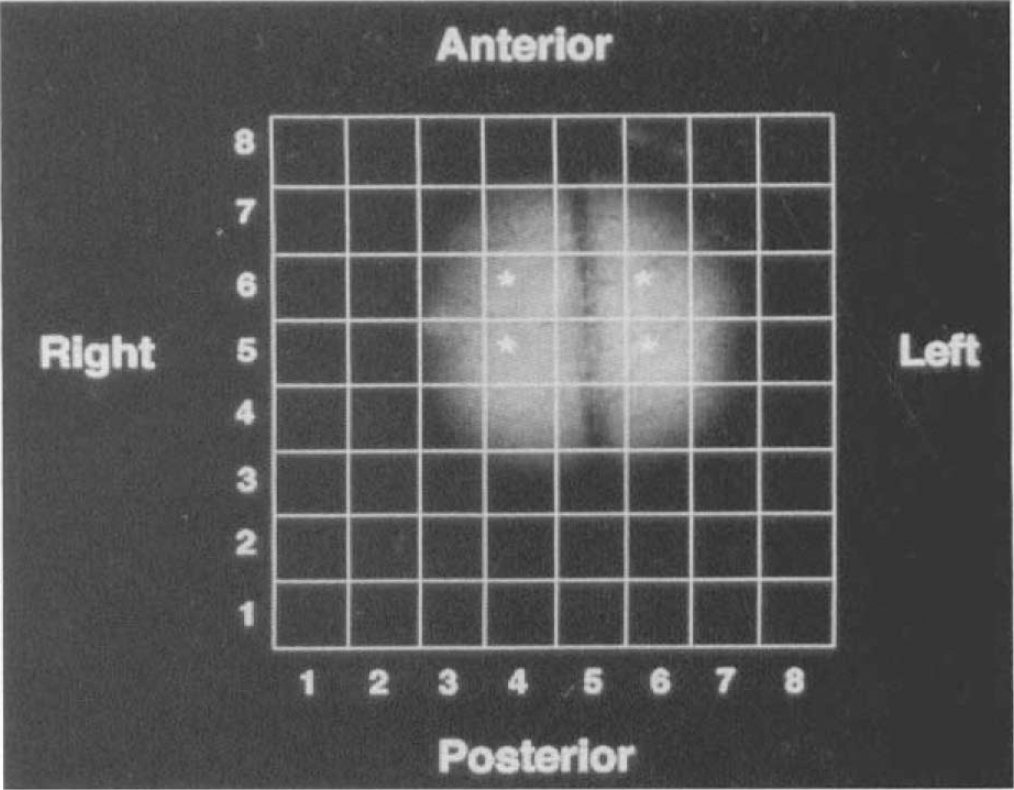
1H NMR image of neocortical rat brain [TR = 1,500 ms, TE = 34 ms, slice thickness = 1 mm, field of view = 20 mm, 256 × 256] acquired in the X, Z plane. The grid corresponding to the 8 × 8 data array of 1H spectroscopic image was used to select two voxels (stars) within each hemisphere (see Fig. 2).
Water-suppressed spectroscopic images were then acquired in the same plane as that of the NMR image, i.e., X, Z plane, using a spin-echo sequence (Bourgeois et al., 1991). Slice selection was achieved by using the depth pulse properties of the sequence. With a 10-mm surface coil, the slice thickness was 3 mm under the bregma and included the medial and dorsolateral neocortex. With TR = 2,000 ms and TE = 272 ms, the method yielded an 8 × 8 × 1,024 point data array within 8 min. In addition, 1H-NMR spectra without 2D phase encoding gradients (i.e., 1H nonlocalized spectra) were acquired within 15 s before and after each spectroscopic image using the same parameters. These two 1H-NMR methods were used to obtain spatial information (1H spectroscopic images) as well as a follow-up of rapid changes in brain metabolites (1H nonlocalized spectra). Spectroscopic imaging of water was also performed using a spin-echo sequence with nonfrequency selective excitation and refocusing pulses. Using TR = 1,500 ms and TE = 136 ms, a 8 × 8 × 1,024 point data array was acquired within 2 min.
Spectral analysis was performed using a Bruker Aspect 1000 workstation. Gaussian weighting was applied in the time domain (10 Hz line broadening). The time domain was zero-filled to 2,048 points for water spectroscopic imaging. With a digital resolution of 2.5 mm and a slice thickness of 3 mm, the nominal volume of each voxel was <20 μl. Metabolic data were provided from the spectra within two voxels inside each hemisphere. The choice of these voxels was derived from the anatomical information provided by NMR imaging (Fig. 1). Quantification was achieved by determining the intensities of the resonances of interest: lactate (1.3 ppm), NAA (2.01 ppm), water (4.7 ppm). Due to the shape of the point spread function, the signal at 1.3 ppm may also contain small contributions from extracranial lipids. It was assumed that signals from extracranial lipids remained essentially constant during the experiment, and, thus, observed changes in this signal intensity were attributed to changes in the neocortical lactate peak.
Nonlocalized measurements of T1 and T2-relaxation times of brain water were performed using a saturation-recovery method for T, and a spin-echo method for T2. T1 was determined from 12 recovery time (TRec) values ranging between 5 ms and 20 s. A spin-echo sequence with a refocusing pulse phase cycled according to the Exorcycle scheme (Bodenhausen et al., 1977) and a variable echo time was used for the T2 measurement. Nine TE values ranging from 20 to 180 ms were sampled. The area of the water peak was determined for each TRec and TE value. A two-parameter monoexponential model using a least-squares fitting method was applied to experimental data. In addition, NMR visible brain water content was determined from a single pulse at TRec 20 s.
Experimental protocol
Three successive experiments were conducted. The effects of hypoxic hypoxia on the area of the neocortical lactate peak in both hemispheres (left clamped and right undamped) were evaluated in Group 1 (n = 10 rats). Each animal was studied during control, hypoxia, reoxygenation, and postmortem periods. The basic cycle of NMR measurements lasted ˜10 min, consisting of a nonlocalized 1H spectrum (15 s) followed by two spectroscopic images, with and without water suppression (10 min), and by another nonlocalized 1H spectrum. This basic cycle was started at 0 time (T0) at 30% FiO2 (control period, T0), after a period of >30 min of equilibration. This was accompanied by a determination of MABP, blood gases, arterial pH, and arterial lactate and glucose concentrations. If the initial arterial pH was <7.25, the animal was excluded from the study. Hypoxic hypoxia was then induced by lowering inspired O2 to 9% using air as a substitute for oxygen while maintaining constant FiN2O. Halothane administration was discontinued during the hypoxic period to prevent hypoxia-aggravated halothane toxicity of the myocardium. The cycle of NMR measurements was started after a 10-min exposure to hypoxia (hypoxic period, T30). After 20 min of hypoxia, 30% FiO2 was restored. All measurements were started after a 20-min period of equilibrium (reoxygenation, T60). Finally, 5% halothane in pure N2O was administered to the animal. The cycle of NMR measurements was then started 10 min after cardiac arrest, i.e., 15 min following initiation of the deoxygenation period, the animal still being mechanically ventilated (postmortem period, T85). Hemoglobin content was determined in five animals in control and reoxygenation periods.
The effect of elevated arterial lactate concentration without hypoxic hypoxia on neocortical lactate metabolism in both hemispheres was studied in Group 2 (n = 6 rats). 1H-NMR measurements and blood analysis were started at T0 (before infusion, T0). Molar sodium lactate solution (1 mmol) was then infused for 5 min via a femoral vein catheter. During and after infusion, nonlocalized 1H spectra were acquired every 2 min. 1H spectroscopic imaging was started 10 min after the end of the infusion (postinfusion, T30). 1H-NMR experiments were repeated during the postmortem period (T60). Arterial lactate concentrations were determined at the end of infusion and at T30. Due to a technical problem, no Paco2 values were available for this group.
Finally, the effects of hypoxic hypoxia on NMR visible water and on T1 and T2-relaxation times of water in intact neocortex were evaluated in Group 3 (n = 4 rats). These animals were studied using the protocol previously described for Group 1. Neither carotid ligation nor blood sample measurement was performed in this group.
Statistical analysis
Data were expressed as mean ± SD. NMR parameters were expressed as percent of changes from the reference value obtained either during the control period (T0) (for NAA and water peaks) or during the postmortem period (for the lactate peak). 1H NMR values from spectroscopic images were normalized with respect to the corresponding reference voxel values in the right undamped hemisphere. Analysis for statistical significance was then performed using a three-way analysis of variance (ANOVA) for repeated measurements (StatView SE program). Factors analyzed were voxel (V1 and V2), hemisphere (right and left), and time period. When a significant interaction was detected between time periods and one of the two other factors, interfactor analysis (voxel, hemisphere), using a modified t-test (using residual variance) and intrafactor analysis (period), using a one-way ANOVA for repeated measurements, were performed. Each value was compared to that obtained at the control period (T0) using Scheffe's F-test with a significance level of 0.05. When no significant interaction was detected between the periods and one or two other factors, pooled data were subjected to a one-way ANOVA for repeated measurements. One-way ANOVA for repeated measurements with Scheffe's F-test was also performed for 1H NMR values from nonlocalized spectra, MABP, and blood samples data.
RESULTS
Biological data during hypoxic hypoxia (Group 1)
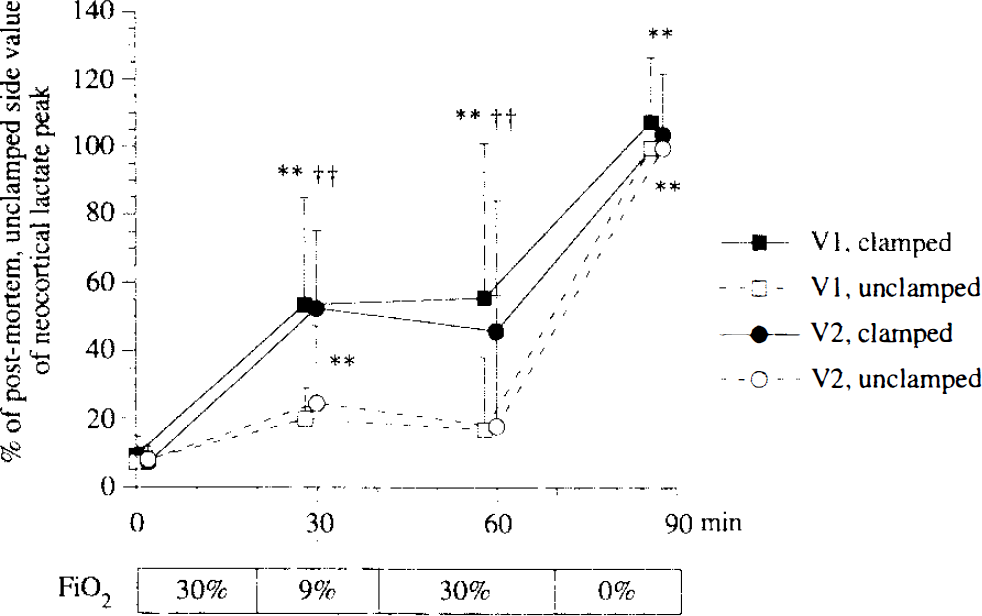
Hypoxic hypoxia at 9% FiO2 resulted in moderate hypoxemia, without any changes in Paco2 as expected in mechanically ventilated animals (Table 1). This was associated with arterial acidosis and elevated arterial lactate concentration. Despite administration of dopamine, MABP significantly decreased during hypoxic hypoxia (Table 1). No significant change in arterial hemoglobin concentration was found between T0 and T60 (13.8 ± 0.8 vs. 13.5 ± 1.0 mg/dl).
Effects of hypoxic hypoxia on arterial blood gases, arterial pH (pHa), arterial lactate and glucose concentrations and MABP in Group 1 (n = 10) animals
Values are expressed as mean±SD.
p < 0.01 compared with control (T0) value.
p < 0.05 compared with control (T0) value.
Effect of hypoxic hypoxia on neocortical lactate peak (Group 1)
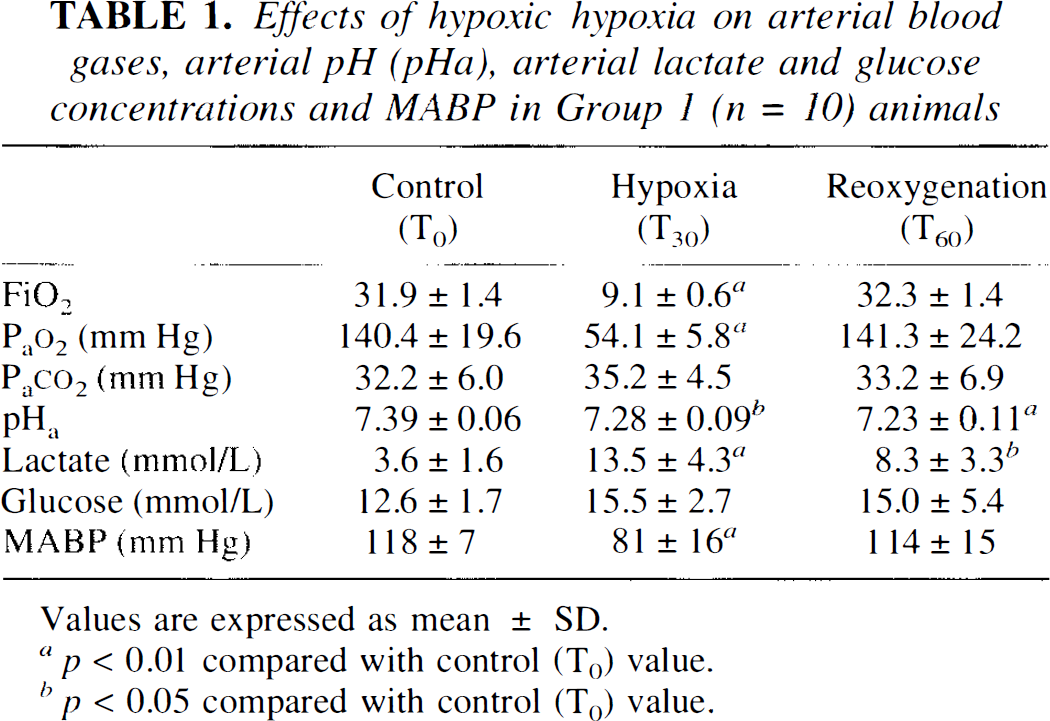
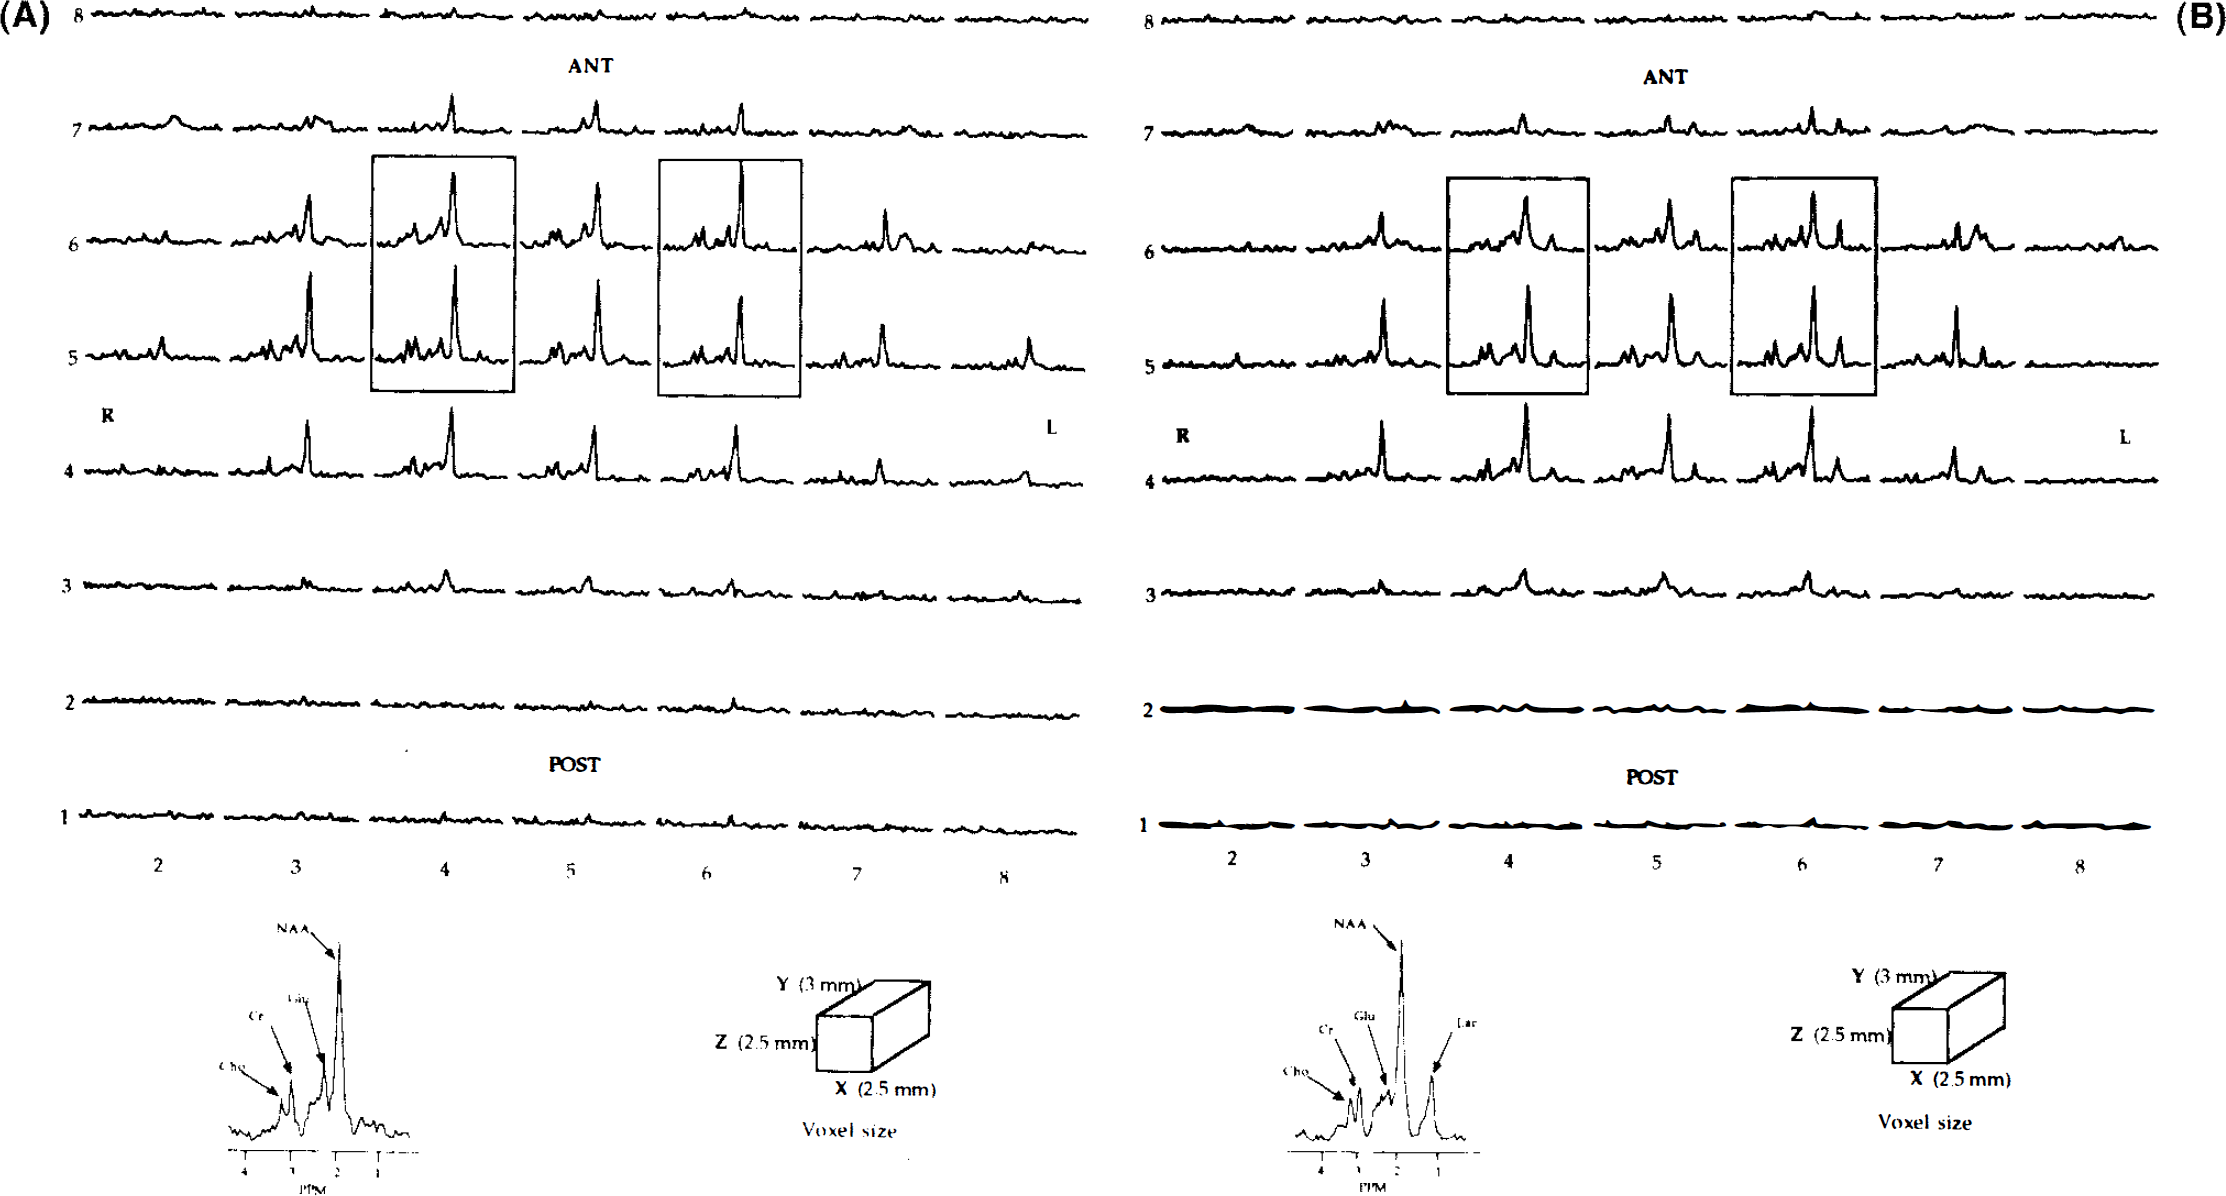
Hypoxic hypoxia resulted in a significant rise in the lactate peak throughout the whole neocortex (42 ± 17% of postmortem value) compared to that in the control period (11 ± 4% of postmortem value, p < 0.001) using 1H nonlocalized spectra. These lactate changes decreased to 26 ± 19% of postmortem values at the end of reoxygenation period. Spatial information between the two hemispheres was given by 1H-spectroscopic images of the brain neocortex of the same rat during the control period (Fig. 2A) and hypoxic hypoxia (Fig. 2B), respectively. Spectra of voxels within each hemisphere did not exhibit any difference as regards the lactate peak between the clamped and undamped sides in the control period (Fig. 2A). In contrast, an elevated lactate peak was observed during hypoxia in both hemispheres, with an additional marked rise in the voxels corresponding to the clamped left side (Fig. 2B). Mean neocortical lactate changes during the successive periods are shown in Fig. 3. The time course of changes in lactate peaks was similar between the two voxels within each hemisphere. A significant interaction between hemispheres and periods was, however, observed (F-test = 10.1, p < 0.001). This was due to significantly higher lactate changes in the clamped hemisphere than in the undamped side during the hypoxic period (T30) (53 ± 27 versus 22 ± 13% of postmortem values, respectively; p < 0.001) and during reoxygenation (T60) (51 ± 41 vs. 18 ± 20% of postmortem values, respectively; p < 0.001). These lactate changes were not reversible during the reoxygenation period in the clamped left side. No difference in the area of the neocortical lactate peak in the clamped hemisphere (106 ± 18%) was found during the postmortem period compared to the reference value in the undamped side (100%).
1H NMR spectroscopic image of neocortical rat brain (TR = 2,000 ms, TE = 272 ms, 8 × 8 × 1,024 point data array) obtained during control period (
Effect of intravenous lactate infusion on neocortical lactate peak (Group 2)
At the end of the lactate infusion, arterial lactate concentration was markedly increased (28.4 ± 12.7 mmol/L) and high arterial lactate levels were still found at T30 (6.8 ± 1.0 mmol/L). At the end of the postmortem period, lactate concentration from intracardiac blood samples was 24.6 ± 4.1 mmol/L. Lactate infusion resulted also in an increase in arterial pH (7.41 ± 0.10) in these mechanically ventilated rats. There was no significant change in the area of the neocortical lactate peak during and after infusion using repeated 1H nonlocalized spectra (Fig. 4). No significant difference was found between the two hemispheres at T30 using 1H spectroscopic imaging (data not shown).
Time course of the changes in neocortical lactate peak area (mean ± SD) in two voxels (V1, V2) within the clamped (filled) and the undamped (open) hemispheres during control, hypoxic, reoxygenation, and postmortem periods in 10 rats (Group 1) (** p < 0.01 vs. control period; †† p < 0.01 versus undamped side). Plots correspond to the start of data acquisition (10 min).
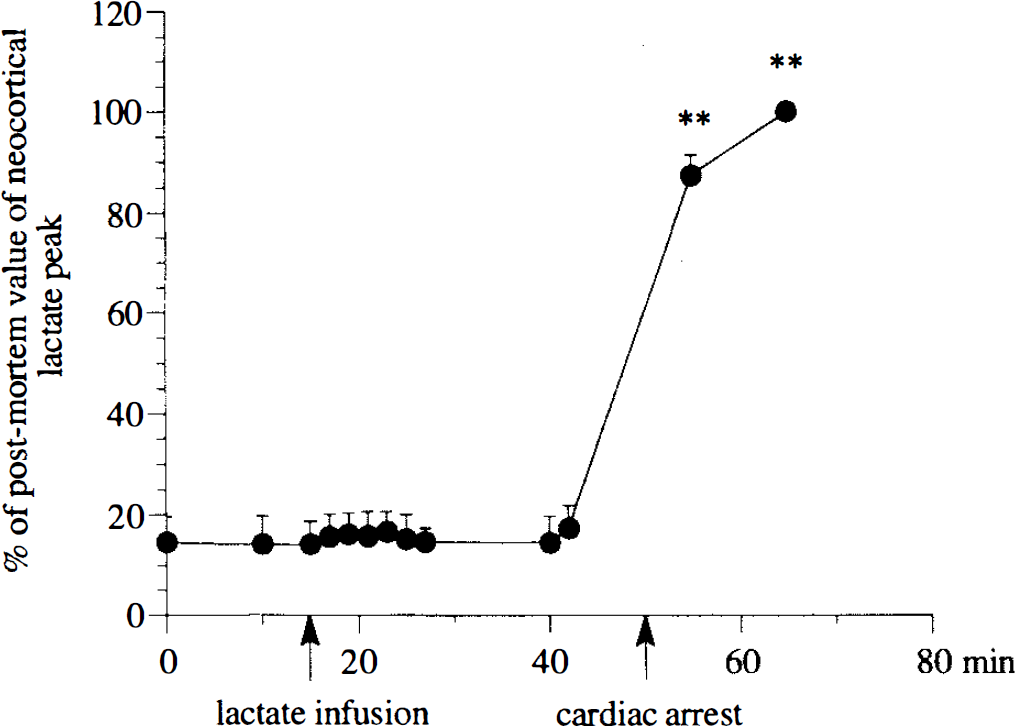
Time course of changes in neocortical lactate peak area (mean ± SD) before, during, and after intravenous lactate infusion in six rats (Group 2). Data were obtained using repeated 1H nonlocalized spectra (** p < 0.01 vs. control period).
Effect of hypoxic hypoxia on NAA and water peaks
Areas of NAA and brain NMR visible water peaks in the neocortex were significantly decreased during hypoxic and postmortem periods, without any difference between the hemispheres (Group 1) (Figs. 5 and 6). Measurements of relaxation times of the brain water in Group 3 showed that these changes in water peak were related to changes in T2, while T1 and NMR visible brain water content remained constant throughout the protocol (Table 2).
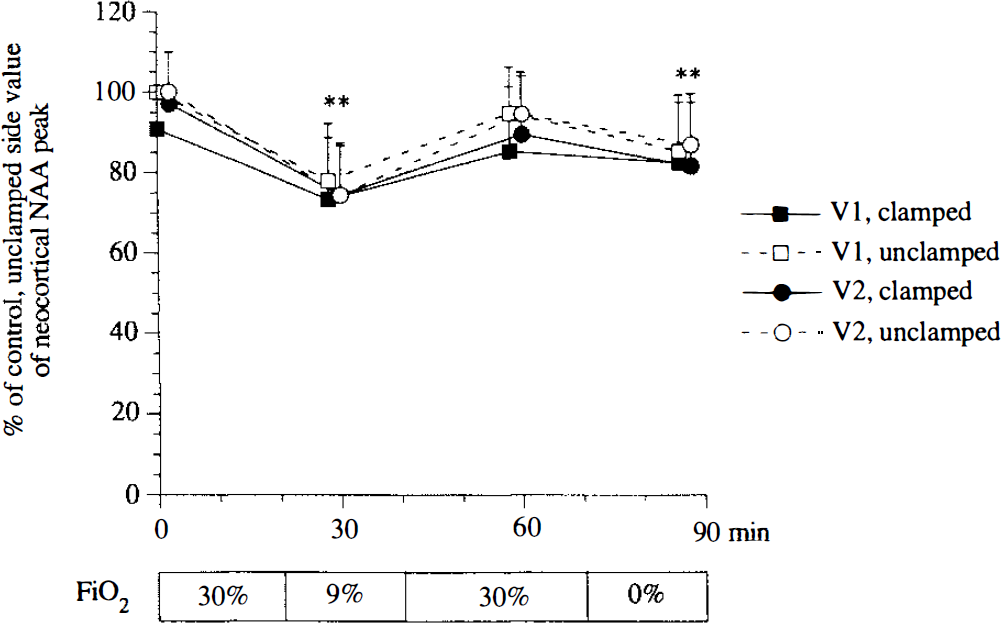
Time course of the neocortical changes in NAA peak area (mean ± SD) in two voxels (V1, V2) within the clamped (filled) and undamped (open) hemispheres during control, hypoxic, reoxygenation, and postmortem periods in 10 rats (Group 1) (**p < 0.01 vs. control period). Plots correspond to the start of data acquisition (10 min).
Effects of hypoxic hypoxia on changes in NMR visible brain water content and on T1- and T2- relaxation times of brain water in group 3 (n = 4) animals
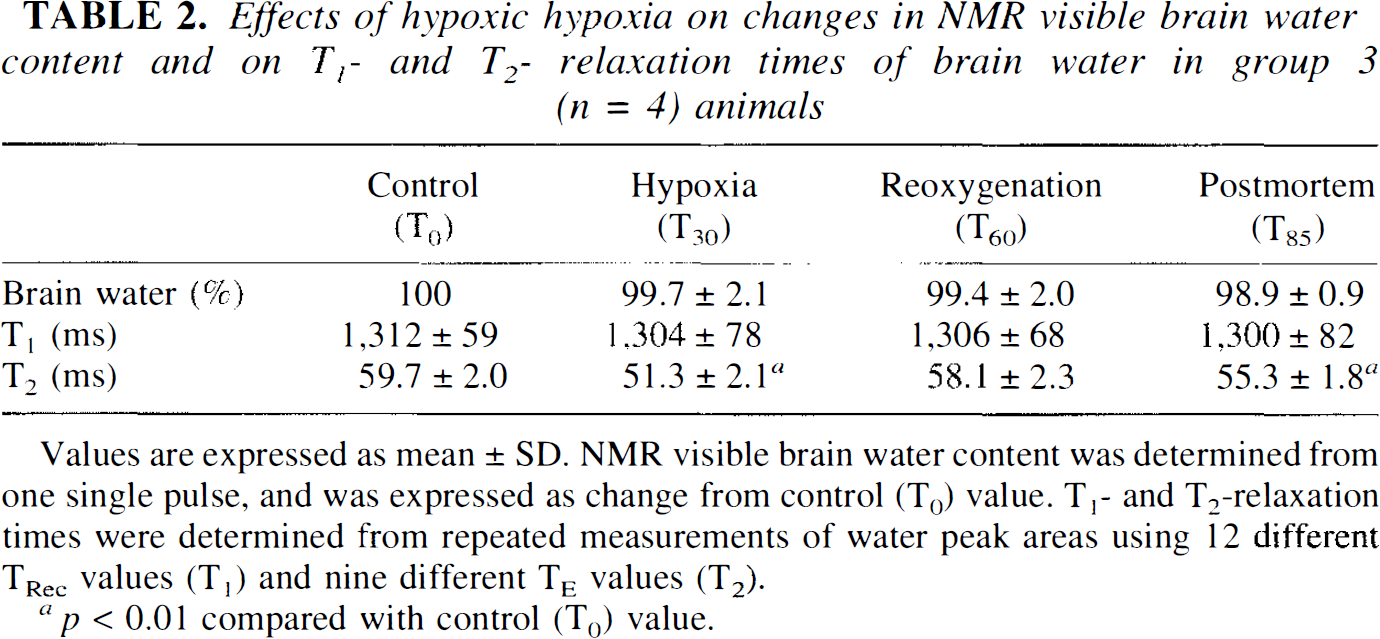
Values are expressed as mean±SD. NMR visible brain water content was determined from one single pulse, and was expressed as change from control (T0) value. T1- and T2-relaxation times were determined from repeated measurements of water peak areas using 12 different TRec values (T1) and nine different TE values (T2).
p < 0.01 compared with control (T0) value.
DISCUSSION
Changes in intracerebral lactate were followed using 1H-NMR spectroscopic imaging. Suitability of this method of monitoring in vivo brain metabolic changes with satisfactory spatial and spectral resolution has been previously demonstrated (Bourgeois et al., 1991). This allowed us to successfully monitor the neocortical metabolism inside each hemisphere for the same animal during reversible hypoxic hypoxia. Observed changes in intracerebral NAA, and lactate and water peak areas can be attributed either to an actual difference in concentration or to a difference in T1- or T2-relaxation times of these metabolites. The decrease in the area of the NMR visible water peak during hypoxia and postmortem periods is clearly related to a marked decrease in its relaxation time, T2, as demonstrated in Group 3. The shortening of T2 during these two periods is generally ascribed to a magnetic susceptibility change of the microvascular blood vessels as a result of the increase in paramagnetic deoxygenated blood (Ogawa et al., 1990; Prielmeier et al., 1994). Water diffusion through the susceptibility gradients (T2* effect) induces an apparent decrease in T2. Although no T2 measurements of NAA were performed, changes in NAA peaks parallel to those in brain water suggest a T2 decrease in NAA peaks during hypoxic and postmortem periods. This probably accounts for the hypoxia-induced decrease in NAA peak area as noted in another NMR study (Rosenberg et al., 1991). The fact that no difference in brain water and NAA peak areas was observed between the two hemispheres also suggests that the hypoxia-induced T2 shortening was similar in both sides. In this way, the difference in the lactate peak area between the two sides is due, rather, to a change in tissue lactate concentration than to a difference in the T2 of lactate.
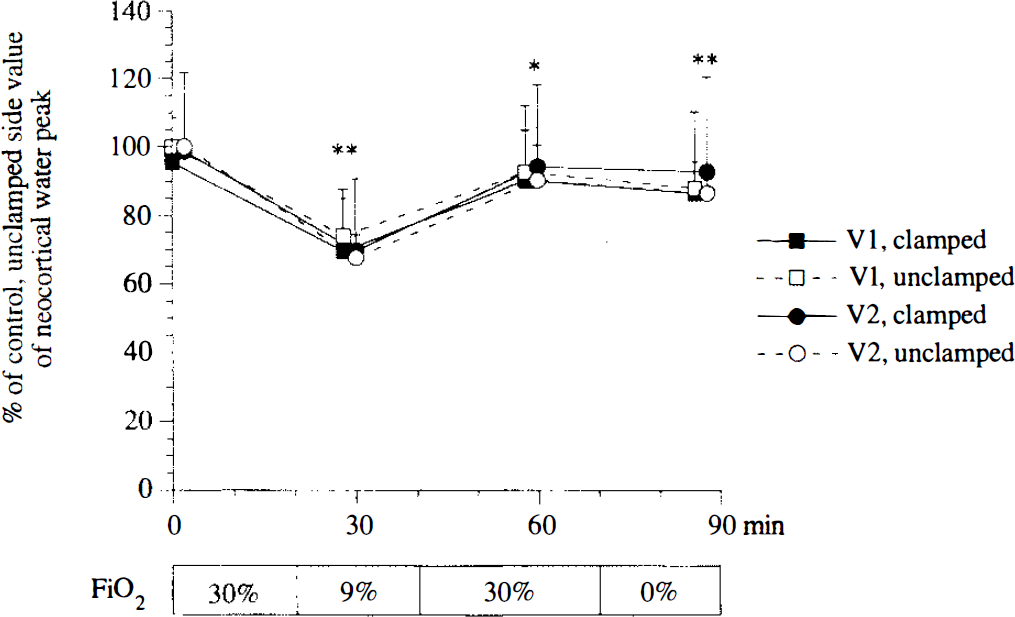
Time course of the neocortical changes in water peak area (mean ± SD) in two voxels (V1, V2) within the clamped (filled) and undamped (open) hemispheres during control, hypoxic, reoxygenation, and postmortem periods in 10 rats (Group 1) (**p < 0.01 and *p < 0.05 vs. control period). Plots correspond to the start of data acquisition (10 min).
Quantification of the lactate changes was based on the ratio of experimental values to those in the undamped postmortem brain. Hypoxic hypoxia resulted in a significant rise in the lactate peak throughout the whole neocortex which was significantly more marked on the clamped side. In contrast, no difference in lactate peaks between the clamped and undamped sides was seen postmortem. Assuming that brain glucose levels in the clamped side would be lower than in the opposite undamped side during the hypoxic period, as reported by Gardiner et al. (1982), this might be expected to result in different brain lactate levels during the postmortem period. However, we observed that accumulation of lactate following initiation of the deoxygenated period reached an equilibrium 10 min after death, resulting in the lack of difference in lactate levels at this point. It is possible that the expected greater lactate level on the clamped side was not observed owing to the postmortem tissue diffusion of this metabolite. Further, the difference in relative lactate changes between clamped and undamped hemispheres seen in the hypoxic period reflected an asymmetrical metabolic response to hypoxic hypoxia.
The present results show that neocortical lactate can be increased during moderate hypoxic hypoxia in the undamped hemisphere. Since it was accompanied by a marked increase in arterial lactate concentration, this lactate accumulation could reflect a passive flux of lactate from blood to tissue, especially at low arterial pH (Oldendorf et al., 1979). However, a massive increase in the concentration of arterial lactate via intravenous lactate infusion did not result in visible NMR changes in neocortical lactate peak, indicating that the elevated arterial lactate concentrations during hypoxic hypoxia did not significantly contribute to the neocortical lactate changes in the two hemispheres. Similar results have been recently reported using microdialysis systems (Harada et al., 1992). These data may be explained by the low permeability to lactate through the blood–brain barrier (Pardridge, 1983). Therefore, early lactate changes in the neocortex originate from the tissue itself.
Brain lactate accumulation is frequently viewed as an indicator of the severity of hypoxic tissue damage (Norberg and Siesjö, 1975; Guylai et al., 1987). Since hypoxic hypoxia results in an early CBF response, this neocortical lactate accumulation could be due to an inadequate CBF response to hypoxemia. In order to delineate the effects of a restricted CBF response to hypoxia, we used the modified Levine preparation (Levine, 1960). The distribution territory of such a carotid clamping is mainly confined to the middle cerebral artery (Salford and Siesjö, 1974). During control conditions, unilateral common carotid artery occlusion results in a reduction of CBF of nearly 20% in the ipsilateral hemisphere (Hoffman et al., 1983), without effect on brain metabolism (Salford et al., 1973; Gardiner et al., 1982). Conversely, the CBF response to hypoxemia and to hypercapnia is markedly asymmetrical since the blood flow on the side of the occlusion is only 50% of that on the nonligated side in mechanically ventilated rats (Salford and Siesjö, 1974; Hoffman et al., 1983; De Ley et al., 1985). In these conditions of restricted CBF response to hypoxemia, the marked and nonreversible lactate accumulation in the clamped hemisphere clearly reflects the strong circulatory dependence of brain metabolism during hypoxic hypoxia, as previously reported in similar preparations during more severe hypoxic hypoxia (Salford et al., 1973; Gardiner et al., 1982).
The question remains, however, whether the CBF response to hypoxemia in the undamped hemisphere was adequate to maintain cerebral oxygen delivery or not. Occlusion of the common carotid artery does not affect CBF responses to hypoxia and hypercapnia in the undamped hemisphere compared to those in intact brain in rats (Hoffman et al., 1983; De Ley et al., 1985). An increase in CBF to 40–60% of control values had been reported in normocapnic ventilated rats at Pao2 50–55 mm Hg (Borgström et al., 1975; Shockley and LaManna, 1988). Similar CBF increase in cortical regions has been reported in awake rats exposed to 10% O2 (LaManna et al., 1992; Bereczki et al., 1993). In our experiments, the decrease in the arterial oxygen content could be to nearly 40% of control values according to a P50 of 40 mm Hg in rat (Schmidt-Nielsen and Larimer, 1958). This indicates that the decrease in arterial oxygen content could be matched by a reciprocal CBF increase to maintain constant cerebral oxygen delivery. No microvascular damage was found in the undamped neocortical rat brain following severe hypoxic hypoxia (Levy et al., 1975).
Two additional factors could, however, affect either the CBF response or brain lactate concentrations during hypoxic hypoxia in the undamped hemisphere: elevated blood glucose levels and arterial hypotension. Throughout our procedure, blood glucose concentrations appeared to be somewhat higher than those reported in other studies. This was probably due to the stress of the upright position of the rats in our experiments. Nevertheless, it has been demonstrated that elevated blood glucose levels have no effect on CBF or brain lactate concentrations in intact brain during hypoxic hypoxia (Gardiner et al., 1982; Harada et al., 1992). Hypotension could be an additional factor in producing intracerebral lactate changes depending on the level of cerebral autoregulation during hypoxia. When MABP was at 40 mm Hg because of hypoxic-induced myocardial depression, a decrease in CBF resulted (Durieux et al., 1992). Conversely, cortical blood flow nearly doubled at Pao2 50 mm Hg when MABP was at 72 mm Hg in anesthetized normocapnic rats (Shockley and LaManna, 1988). In addition, no significant increase in cortical lactate concentration was observed at MABP 55 mm Hg in 18% O2 ventilated rats (Sylvia et al., 1985). Although we cannot exclude a change in cerebral autoregulation during hypoxic hypoxia, these findings suggest that neither moderate arterial hypotension nor elevated blood glucose levels have a major effect on the metabolic changes observed in the undamped hemisphere during the hypoxic period.
There is no evidence of changes in cerebral metabolic rate of oxygen during moderate hypoxic hypoxia (Nioka et al., 1990). Nevertheless, the observed lactate accumulation could have been explained by an increase in brain metabolic energy demand resulting from removal of halothane during the hypoxic period (20 min) to limit the effects of halothane-toxicity on the myocardium. As reported by Lockhart et al. (1991), cerebral elimination of halothane is slow, since >25% of the initial brain concentration of halothane is still present after a 20-min removal period. In addition, we have not observed any changes in the EcoG signal, in favor of awakening following removal of halothane during a similar protocol (unpublished data).
While the massive increase in postmortem neocortical lactate seen in this study is consistent with a drop of pHi values to 6.2–6.4 during this period (Corbett and Laptook, 1990), no significant change in brain content of phosphorus compounds or pHi was found during moderate hypoxic hypoxia (Siesjö and Nilsson, 1971; Sylvia et al., 1985). We have also found similar results on whole intact brain, a somewhat different preparation from the present Levine's preparation (unpublished data). It has been demonstrated that multiple control systems keep brain metabolism in a steady state during moderate hypoxic hypoxia involving an early increase in CBF followed by biochemical compensation, i.e., increases in intracellular ADP, inorganic phosphate, and NADH, and decrease in phosphocreatine (PCr) levels when hypoxic hypoxia was more pronounced (Nioka et al., 1990). However, no lactate measurements were made in that graded hypoxic study. Our results suggest that lactate could be an early metabolic indicator during moderate hypoxic hypoxia, reflecting either an activation of aerobic glycolysis or a decrease in cellular utilization of brain lactate as an energy substrate. This latter would be of consideration regarding the evidence obtained from studies of the central role of lactate in the metabolic coupling between glial cells and neurons (Tsacopoulos and Magistretti, 1996).
This study demonstrates that endogenous lactate can be accumulated in the neocortex during moderate hypoxic hypoxia in normocapnic rats. In the absence of evidence of a reduced CBF response to hypoxic hypoxia or of impairment in brain oxidative phosphorylation, this finding suggests that intracerebral lactate accumulation is indicative of early metabolic changes during hypoxic hypoxia.
Footnotes
Abbreviations used
Acknowledgment:
This work was supported by the Région Rhônes-Alpes. The authors are grateful to Xavier Leverve and Dan Veale for helpful comments on the study.