
Abstract
Overexpression of Cu,Zn superoxide dismutase (SOD1) reduces ischemic injury in some stroke models but exacerbates injury in a neonatal stroke model and in other settings. The current study used a SOD1 transgenic (SOD1-Tg) murine cortical culture system, derived from the same mouse strain previously used for the stroke models, to identify conditions that determine whether SOD1 overexpression in neurons is protective or detrimental. The nitric oxide (NO) donors S-nitroso-N-acetylpenicillamine, spermine-NONOate, and diethylamine-NONOate produced less death in SOD1-Tg neurons than in wild-type neurons (p < 0.01). Also, NO produced markedly less 3-nitrotyosine in SOD1-Tg cells. In contrast, the superoxide generator menadione produced significantly greater death and nearly twice as much 2′7′-dichlorofluorescein fluorescence in SOD1-Tg neurons than in wild-type neurons, suggesting increased peroxide formation in the SOD1-Tg cells. No significant difference was observed in the vulnerability of the two cell types to H2O2, the product of the SOD reaction. Over-expression of SOD1 also had no effect on neuronal vulnerability to glutamate, N-methyl-D-aspartate, or kainate. These observations suggest that SOD1 overexpression can reduce neuronal death under conditions where peroxynitrite formation is a significant factor, but may exacerbate neuronal death under conditions of rapid intracellular superoxide formation or impaired H2O2 disposal.
Superoxide radical (O2−•) has been identified as an important mediator of oxidative injury during ischemia-reperfusion (Chan, 1996; Koroshetz and Moskowitz, 1996). Superoxide formation is accelerated by N-methyl-D-aspartate (NMDA) receptor stimulation (Lafon-Cazal et al., 1993; Dugan et al., 1995) and during mitochondrial dysfunction (Richter, 1992). Increased superoxide formation also may result from increased activity of several cytosolic enzymes during ischemia-reperfusion (Traystman et al., 1991). Intracellular superoxide levels normally are kept low by the action of cytosolic copper, zinc superoxide dismutase (SOD1) and mitochondrial manganese superoxide dismutase, which catalyze the formation of H2O2 from O2−•(Halliwell and Gutteridge, 1989).
Superoxide and its metabolites can produce cell injury in several ways. By itself, O2−• can initiate lipid peroxidation (Halliwell and Gutteridge, 1989) and directly damage enzymes such as aconitase, which contain iron-sulfur clusters (Liochev and Fridovich, 1994). The product of the SOD reaction, H2O2, can oxidize protein sulfhydryl groups (Halliwell and Gutteridge, 1989). Also, H2O2 can react with superoxide and transition metals to produce the highly reactive hydroxyl radical (•OH), which is capable of reacting with DNA, RNA, proteins, and other cell constituents (Halliwell, 1992). In the presence of nitric oxide (NO), O2−• and NO rapidly and spontaneously combine to form peroxynitrite (ONOO−), which, like •OH, can react indiscriminately with cell constituents (Beckman and Koppenol, 1996; Squadrito and Pryor, 1995). The depletion of NO by this route also may have deleterious effects, since NO also functions as a vasodilator (Palmer et al., 1987) and as a terminator of lipid peroxidation (Hogg and Kalyanaraman, 1999).
Several lines of evidence suggest that the net effect of increased SOD activity on neuronal survival may vary under differing conditions because of the complex interactions among SOD, NO, and O2−•. Miles et al. (1996) showed that decreasing either NO or O2−• can cause an increase in net peroxynitrite production under some conditions, such that increasing SOD activity could potentially increase the flux of this toxic metabolite. In addition, SOD1 can catalyze peroxynitrite-mediated tyrosine nitration (Beckman et al., 1992) and can act as a peroxidase to produce hydroxyl radical (Cabelli et al., 1986; Yim et al., 1998). Overexpression of SOD1 has been reported to increase basal production of hydroxyl radical in both brain and muscle (Peled-Kamar et al., 1997), to produce a muscular dystrophy in mice (Peled-Kamar et al., 1997; Rando et al., 1998), to potentiate superoxide toxicity in cultured endothelium (Imaizumi et al., 1996), and to have other deleterious effects in several cell line preparations (Scott et al., 1987; Elroy-Stein et al., 1988; Norris and Hornsby, 1990; de Haan et al., 1996).
Overexpression of SOD1 has produced differing effects in different cerebral ischemia models. For example, SOD1 overexpression was found to reduce injury after transient middle cerebral artery occlusion (Yang et al., 1994) and in a rat model of global forebrain ischemia-reperfusion (Chan et al., 1998), but it was found to have negligible effects in a permanent ischemia model (Chan et al., 1993) and to exacerbate brain damage in a model of perinatal focal hypoxia/ischemia-reperfusion (Ditelberg, 1996). Ischemia causes neuronal death by several interdependent mechanisms, which vary in relative importance under different ischemic conditions (Chan, 1996; Kristian and Siesjo, 1998; Lee et al., 1999); therefore, it is possible that the net effect of SOD1 overexpression in a given ischemic setting may be determined by the specific conditions produced. The current study uses a cell culture system in which specific aspects of ischemia can be independently examined to identify conditions that determine whether SOD1 overexpression in neurons is protective or detrimental. Murine cortical cultures were prepared from the same mouse strain previously shown to exhibit increased resistance to cerebral ischemia-reperfusion (Yang et al., 1994) and decreased resistance to neonatal ischemia (Ditelberg, 1996). Neurons obtained from heterozygous transgenic mice over-expressing human SOD1 (SOD1-Tg neurons) were directly compared with neurons derived from litter mate wild-type mice (wt neurons) to minimize the potential influence of strain differences (Gerlai, 1996; Banbury Conference, 1997).
MATERIALS AND METHODS
Reagents were purchased from Sigma (St. Louis, MO, U.S.A.) except where noted otherwise.
Neuron-astrocyte co-cultures
Heterozygous SOD-1 Tg mice of the SOD-1 TgHS/SF-218-3 strain carrying human SOD1 were derived from the founder stock described previously (Epstein et al., 1987) and bred on a CD-1 mouse background. Neurons were prepared from fetal (embryonic day 15) mice produced by the cross of a heterozygous SOD1-Tg/wt male with a homozygous wt/wt female. This cross-produces pregnant dams with a mixture (roughly 50:50) of heterozygous SOD1-Tg/wt and homozygous wt/wt fetuses.
Co-cultures were prepared by seeding neurons onto a preexisting wt astrocyte monolayer. The astrocyte cultures were prepared from cortices harvested from 1-day-old CD-1 mice (Simonsen, Gilroy, CA, U.S.A.). After removal of meninges, the cells were dissociated by incubation in papain/DNAase, followed by trituration. The dissociated cells were washed, suspended in Eagle's minimum essential medium (MEM) with 10% fetal bovine serum (Hyclone, Ogden, UT. U.S.A.) and 2 mmol/L glutamine, and plated in Falcon 24-well tissue culture plates at an approximate density of 5 × 10⁴ cells/cm2. In some plates, round glass coverslips were placed in the wells, and astrocytes were plated onto the coverslips. The cultures were maintained in a humidified, 5% CO2, 37°C incubator and received a medium exchange every 6 days. The astrocyte cultures were used as a plating surface for neurons when they were 14 to 20 days old and formed a confluent layer.
Neurons were prepared from fetal mouse forebrain cortices by the same method used for the astrocyte preparations. The neurons from each fetal brain were cultured in a separate plate. The cells were plated at an approximate density of 1 × 10⁵ cells/cm2, and the resulting co-cultures were maintained in 7.5% O2/5% CO2 atmosphere. Proliferation of other cell types was inhibited by the addition of 10 μmol/L cytosine arabinoside 2 days after plating. This medium was replaced after 24 hours with glial-conditioned medium (GCM) prepared by placing MEM with 2 mmol/L glutamine and 5% fetal bovine serum into a flask of confluent cortical astrocytes for 72 hours, and supplemented with 100 nmol/L sodium selenate and 200 nmol/L α-tocopherol (Leist et al., 1996). The co-culture medium subsequently was refreshed with fresh GCM every 6 days and on the evening before use of the cells. At day 5 in vitro, immunostaining for human SOD1 expression was performed on sample co-culture wells to identify the plates containing SOD1-Tg neurons. Experiments were conducted when the neurons were 16 to 21 days in vitro.
Astrocyte-poor neuron cultures
Preparation of astrocyte-poor neuron cultures was the same as for neuron-astrocyte co-cultures except that the cells were plated onto wells coated with poly-D-lysine rather than onto astrocytes (Swanson and Choi, 1993). After 2 days in vitro, 26 μmol/L cytosine arabinoside was added to each well to prevent proliferation of astrocytes or other cell types. This media was replaced completely with 10% GCM (400 μL per well) after 48 hours, and the cultures were refreshed with 10% GCM every subsequent 5 days. These cultures were used to determine SOD activity after 9 days in vitro. Immunostaining showed less than 0.5% of the cells expressed the astrocyte marker glial fibrillary acidic protein.
SOD1 activity
Astrocyte-poor neuron cultures were washed with phosphate-buffered saline solution (10 mmol/L KH2PO4, 27 mmol/L KCl, and 137 mmol/L NaCl, pH 7.4), harvested with a rubber policeman, centrifuged at 200 g for 10 minutes, and stored at −20°C until use. The SOD1 activity was assessed by the method of Crapo et al. (1978) with some modifications. In brief, the cell pellets were suspended in SOD buffer (50 mmol/L KH2PO4, 0.1 mmol/L ethylenediamine tetraacetic acid, pH 7.4), lysed by sonication, and centrifuged at 20,800 g for 15 minutes at 5°C. Total SOD activity was measured in the presence of 20 μmol/L ferrycytochrome C, 20 μmol/L xanthine, 10 μmol/L KCN, and enough xanthine oxidase in 300 μL final volume of SOD buffer to achieve an absorbance change of 0.02 units/minutes at 550 nm in a control without SOD. Mitochondrial manganese superoxide dismutase activity was assessed using the same reaction media in the presence of 5 mmol/L KCN. The SOD1 activity was calculated by subtraction of the mitochondrial manganese superoxide dismutase activity from the total SOD activity. One unit of SOD was defined as the quantity of enzyme necessary to inhibit by 50% the rate of ferrycytochrome C reduction.
Immunostaining
Cultures were fixed with 4% paraformaldehyde for 20 minutes. Monoclonal mouse anti-human SOD1 antibody (Sigma) diluted 1:1000 or mouse anti-glial fibrillary acidic protein antibody (ICN, Costa Mesa, CA, U.S.A.) diluted 1:5000 was incubated with the cultures for 18 hours at 4°C. Excess antibody was removed, and cultures were incubated with biotinylated horse anti-mouse IgG (Vector Laboratories, Burlingame, CA, U.S.A.) diluted 1:200 for 1 hour at room temperature. After removal of excess antibody, membranes were treated with the ABC streptavidin detection system (Vector Laboratories) for 1 hour, and the resulting horseradish peroxidase signal was detected using 3,3′-diaminobenzidene.
Experimental procedures
Experimental treatments were performed using balanced salt solution (BSS) buffered with CO2/HCO3−. The BSS contained 0.1% bovine serum albumin (BSA) and (in mmol/L) KCl, 3.1; NaCl, 134; CaCl2, 1.2; MgSO4, 1.2; KH2PO4, 0.25; NaHCO3, 15.7, and glucose, 2. The pH was adjusted to 7.2 while the solutions were equilibrated with 5% CO2. Osmolarity was verified at 290 to 300 mOsm with a Wescor vapor pressure osmometer (Logan, UT, U.S.A.), and small adjustments were made with NaCl or deionized H2O when necessary.
Drug stocks were prepared in BSS immediately before use. Drug stocks of the NO donors were maintained on ice for the 5-minute interval before their use. All studies were initiated by replacement of the culture medium by phenol red-free BSS in three partial (85%) exchanges. After addition of drugs, the cultures were incubated in a 37°C, 5% CO2 incubator for 1 hour except where noted. For xanthine oxidase/hypoxanthine treatment, cells were exposed to 100 μmol/L hypoxanthine plus 0 to 50 mU/mL xanthine oxidase. Studies were terminated by three partial exchanges with Eagle's MEM containing 0.1% BSA, and the cultures in this medium were returned to the CO2 incubator.
Neuronal death
Neurons were clearly distinguished from the underlying astrocyte layer by their phase-bright, process-bearing morphologic features, as confirmed by NeuN immunostaining (Ying et al., 1999). Neuronal death was determined 20 to 24 hours after oxidant exposures by propidium iodide staining. A total of 0.42 mg/mL of propidium iodide was added to each well, and both the propidium iodide-stained neurons (dead neurons) and live neurons in five randomly picked optical fields were counted under a Nikon fluorescence microscope (Nikon, Tokyo, Japan). At least 500 neurons were counted in each well. The results from each well were expressed as percent neuronal death. Lactate dehydrogenase activity in the incubation medium also was used to quantify cell death in a subset of the studies (Koh and Choi, 1987). In brief, 200 μL medium was mixed with 100 μL 500 mmol/L potassium phosphate buffer (pH 7.5) containing 1.5 mmol/L NADH and 7.5 mmol/L sodium pyruvate. The A340 nm change was monitored over 90 seconds.
3-Nitrotyrosine determination
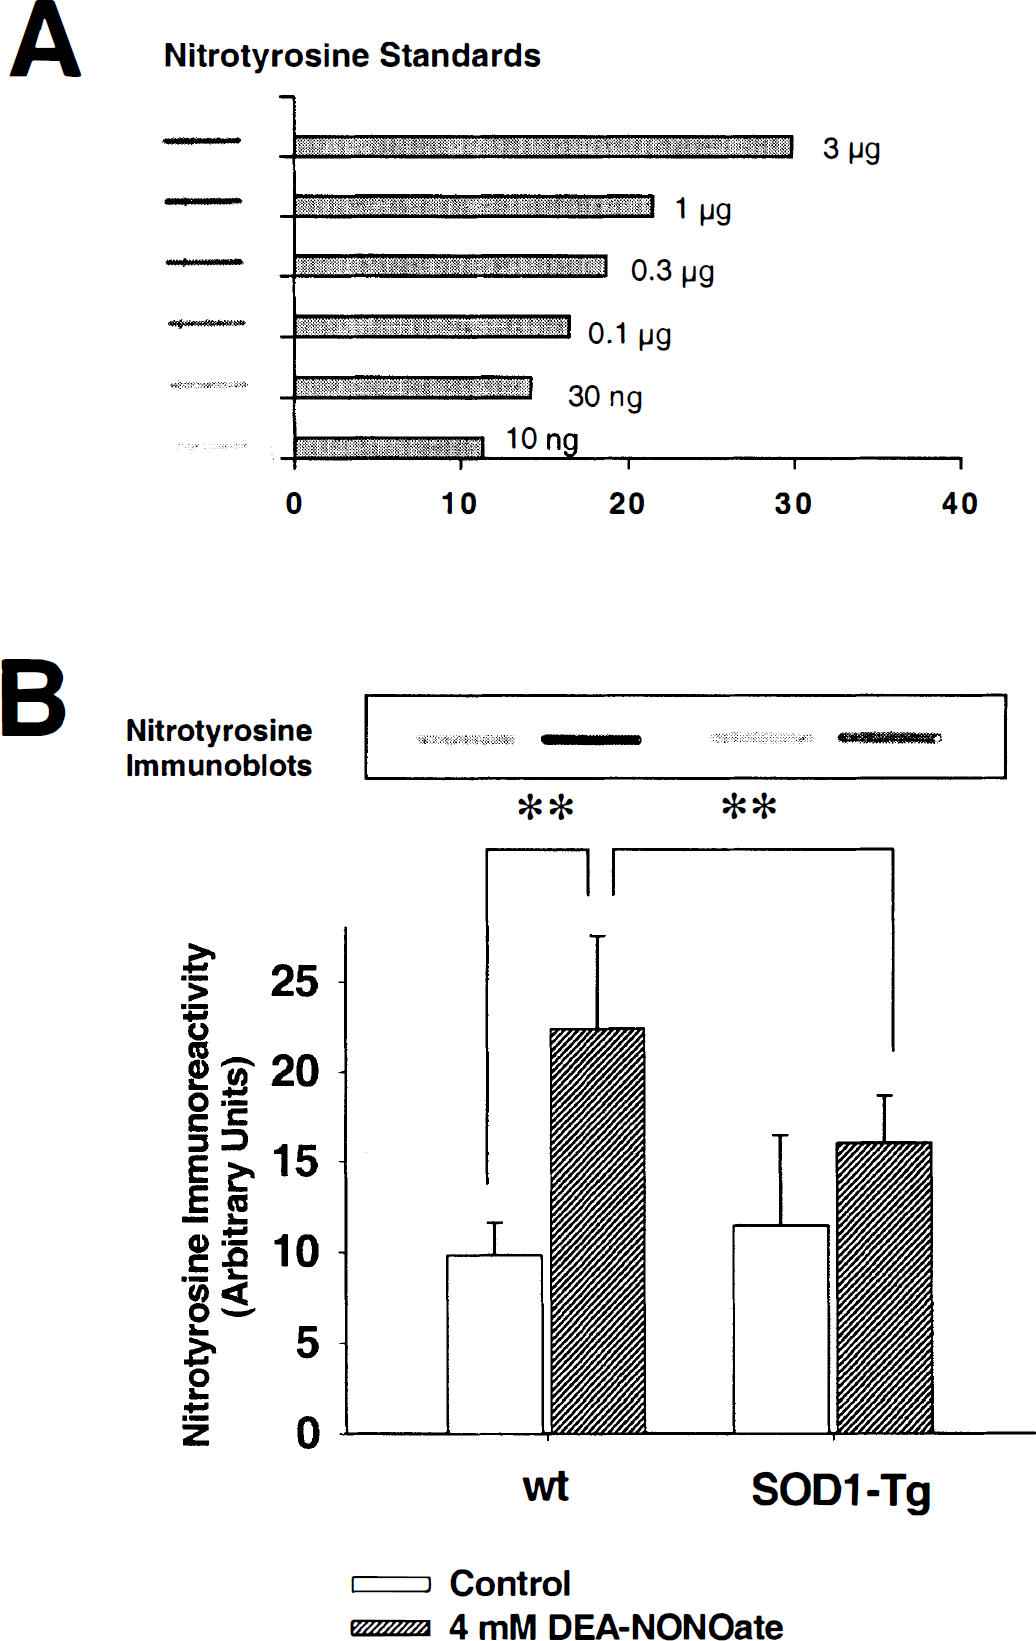
Cultures were incubated with diethylamine-NONOate (DEA-NO; Alexis, San Diego, CA, U.S.A.) in BSS or with BSS alone for 1 hour at 37°C. After two washes with BSS, the cells were lysed in 0.3 N NaOH for 20 minutes. Lysates were neutralized with HCl, and protein concentrations were measured. Equal amounts of protein (5.6 μg) were added to each slot, and samples were vacuum-fixed to polyvinyidene fluoride membranes (Boehringer Mannheim, Indianapolis, IN, U.S.A.). The membranes were immediately placed in blocking solution (5% skim milk/1% BSA in 0.1 mol/L phosphate buffer) for 1 hour at room temperature and transferred to a solution containing a polyclonal rabbit anti-nitrotyrosine antibody (Upstate Biotechnology, Lake Placid, NY, U.S.A.) diluted 1:600 in blocking solution for 12 hours at 4°C. The membranes were washed three times for 5 minutes each in 0.1 mol/L phosphate buffer containing 0.1% Tween 20 (PB-T) and placed for 1 hour in blocking solution containing a biotinylated anti-rabbit IgG antibody (Vector Laboratories) diluted 1:800. After three further washes in PB-T, membranes were treated with the ABC streptavidin detection system (Vector Laboratories) for 1 hour. The resulting horseradish peroxidase signal was detected using 3,3′-diaminobenzidene. The blots were digitized, and densitometry was performed using the National Institutes of Health Image Program. 3-Nitrotyrosine standards were prepared using a commercially prepared 3-nitrotyrosine protein adducts (Upstate Biotechnology).
Fluorescence measurements of reactive oxygen species
Cortical cultures, plated on glass cover slips and incubated in BSS, were loaded with 20 μmol/L 2′,7′-dichlorodihydrofluorescein (Molecular Probes, Eugene, OR, U.S.A.) in BSS for 30 minutes at 37°C (final volume 400 μL). Vehicle or 100 μmol/L menadione then was added, and the cultures were incubated for additional 30 minutes. Coverslips were placed in a chamber on an inverted Olympus microscope (Scientific Instruments, Sunnyvale, CA, U.S.A.) with ×40 objectives for fluorescence imaging. Thirty minutes after the addition of menadione, DCF fluorescence was recorded using 495-nm light excitation and 529-nm emission. Fourteen to 18 individual neuronal perikarya were imaged per coverslip.
Because DCF fluorescence decreases under acidic conditions (Reynolds and Hastings, 1995), the intracellular pH was monitored by a fluorescent dye technique (Rink et al., 1982; Swanson et al., 1997) in separate studies. Cultures on glass coverslips were treated with menadione or vehicle, as for the DCF studies, and loaded for 15 minutes with 10 μmol/L of the cell permeant acetoxymethyl ester of 2′,7′-bis-(2-carboxyethyl)-5-(and-6)-carboxyfluorescein (BCECF) (Molecular Probes). The coverslips were placed in a temperature-controlled perfusion chamber attached to a Nikon inverted microscope equipped with a microfluorometer (Photon Technology International, South Brunswick, NJ, U.S.A.). Cells were excited alternately at wavelengths of 505 nm (pH dependent) and 439 nm (pH independent), with emission recorded at 535 nm. Results were calculated as a ratio of fluorescence produced by the two excitation wavelengths after correction for autofluorescence, which in all cases was less than 5% of the BCECF signal. Calibrations were performed using the nigericin method (Thomas et al., 1979) and were reproducible in the range of pH 7.8 to 5.8.
Protein determinations
Protein concentrations of lysate aliquots were determined by the bicinchonic acid method (Smith et al., 1985) using BSA standards. Bicinchonic acid was purchased from Pierce (Rockford, IL, U.S.A.).
Statistical analyses
All data are presented as means ± SD. Statistical analyses were performed by Student's t-test or analysis of variance followed by the Student-Newman-Keuls post hoc test.
RESULTS
Cultures containing SOD1-Tg neurons were identified by immunostaining (Figs. 1A and 1B). These cultures consist of neurons on an astrocyte layer and are representative of the cultures used for experiments. However, the presence of astrocytes in these cultures prevents a direct assessment of neuronal SOD1 activity. Therefore, astrocyte-poor neuron cultures (less than 0.5% astrocytes) were used for this assessment. As shown in Fig. 1C, the SOD1 activity of SOD1-Tg neurons was approximately 3.5-fold greater than that of wt neurons.
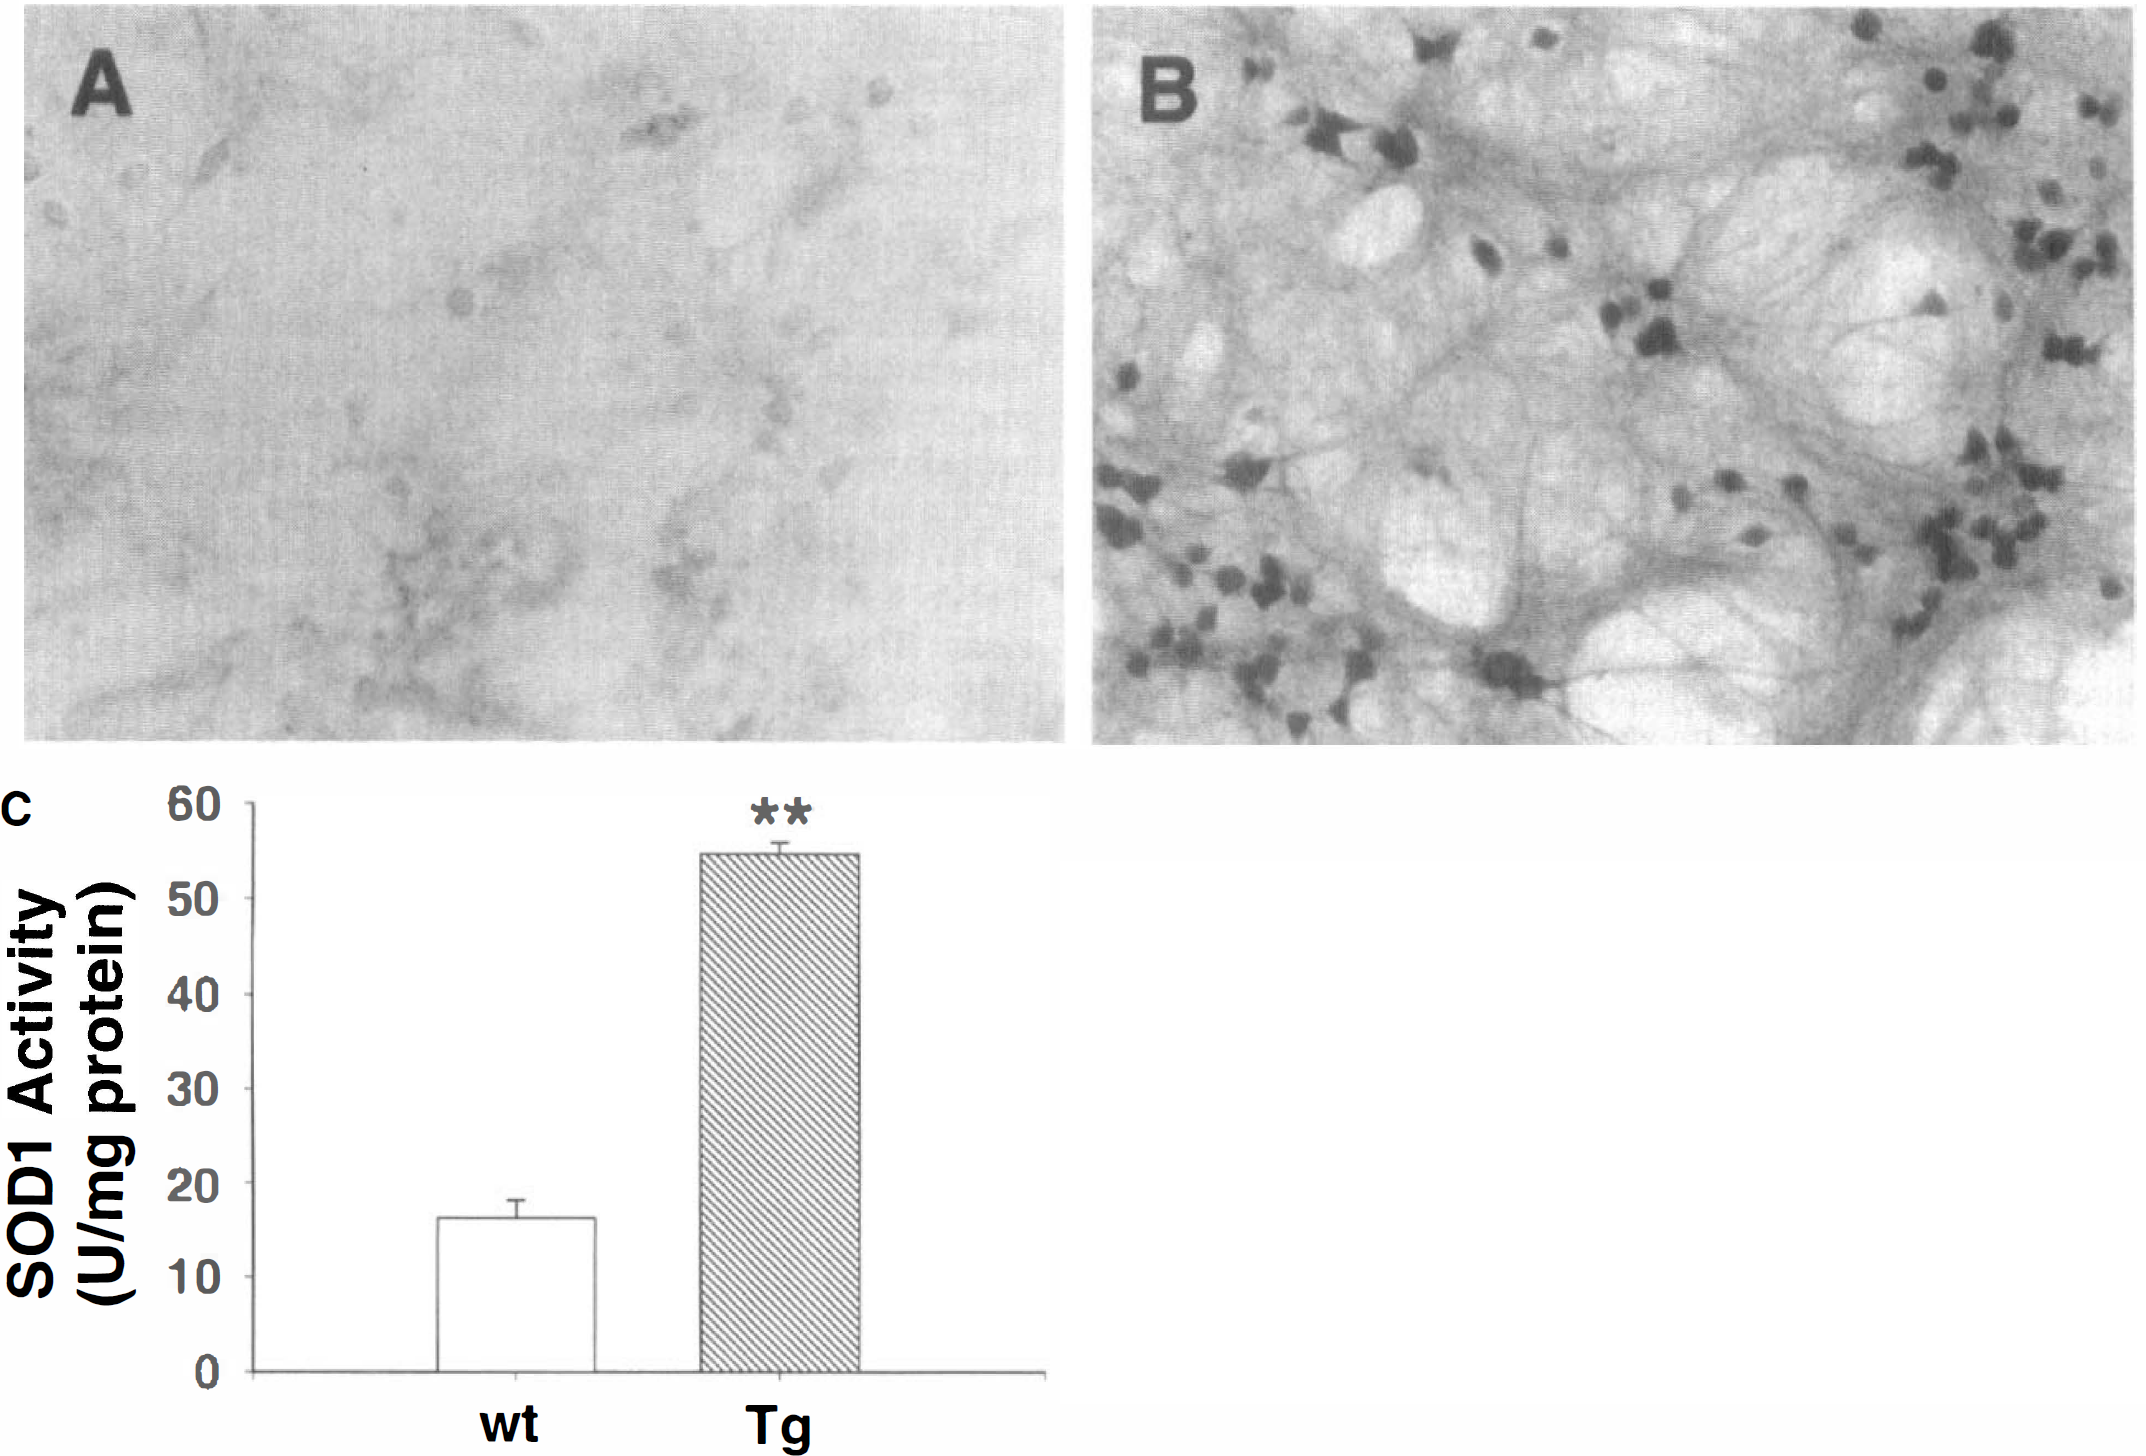
Photomicrographs of cortical neuron/astrocyte cocultures under phase contrast showing identification of wild-type (wt) neurons
Three different NO donors, S-nitroso-N-acetyl-penicillamine, spermine-NONOate, and DEA-NO (Alexis), were used to determine if SOD1 overexpression can attenuate NO neurotoxicity. These compounds all release NO by hydrolysis but have differing hydrolysis by-products and differing half-lives (Kowaluk and Fung, 1990; Keefer et al., 1996). Each of these NO donors produced significantly less death of SOD1-Tg neurons than of wt neurons (Fig. 2). To confirm that the neuronal death was induced by NO production, hydrolyzed NO donors were prepared by preincubating 5 mmol/L of each compound in BSS at 37°C for 24 hours. This produces near-complete release of the NO moiety from the donors, and the released NO is oxidized to NO2− and NO3 (Kowaluk and Fung, 1990; Keefer et al., 1996). Treatment of the cultures with the hydrolyzed NO donors did not induce neuronal death (data not shown).
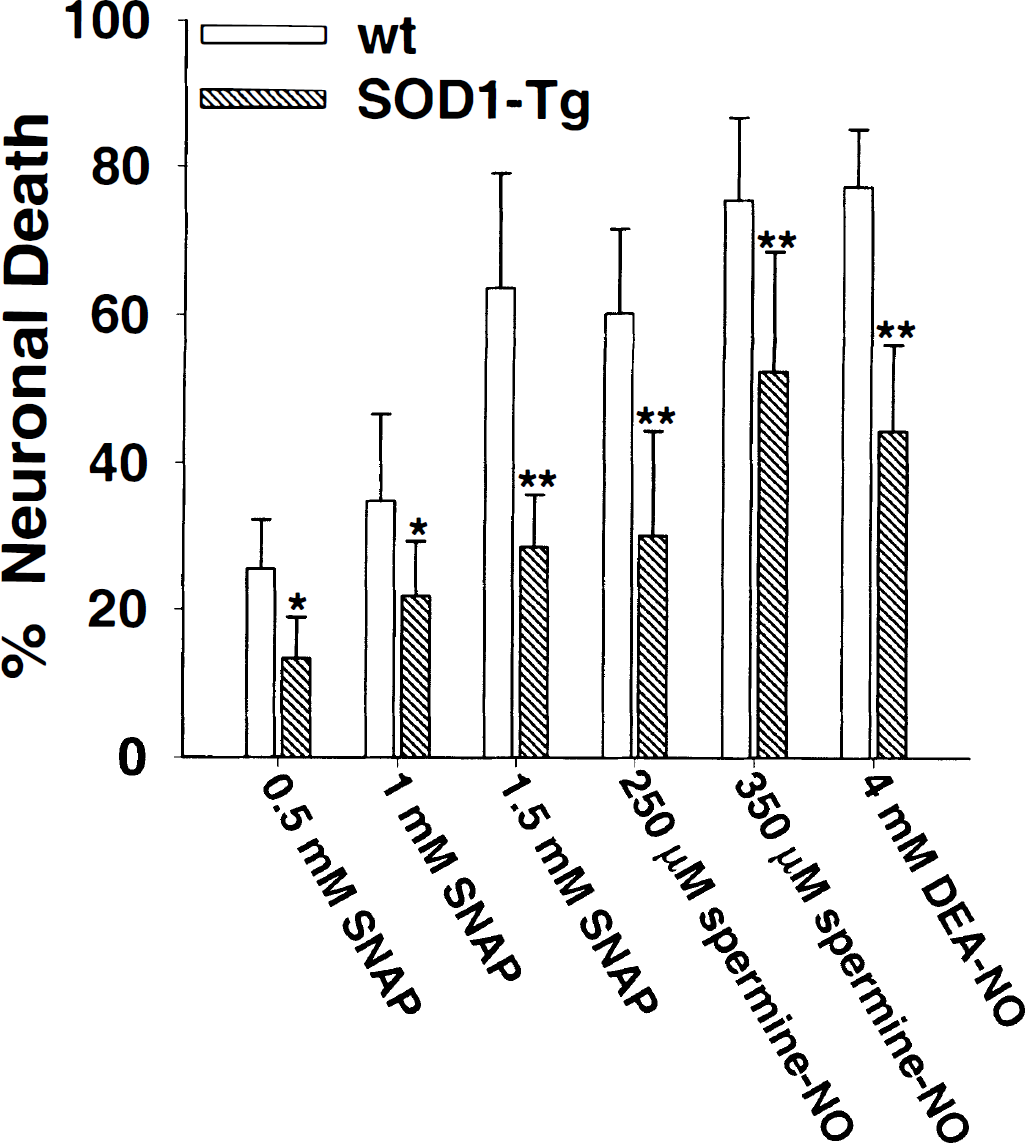
The SOD1 overexpression attenuated neuronal death induced by the nitric oxide (NO) donors S-nitroso-N-acetylpenicillamine (SNAP) (6-hour incubations), spermine-NONOate (spermine-NO) (6-hour incubations), and diethylamine-NONOate (DEA-NO) (1-hour incubations). The t1/2 for SNAP, spermine-NO, and DEA-NO in Krebs buffer at 37°C is 3.2 to 6.4 hours (Kowaluk and Fung, 1990), 10 to 90 minutes, and 2 to 4 minutes (Keefer et al., 1996), respectively. Neuronal death of sham-wash controls was less than 10% in both wt and SOD1-Tg cultures. Data points are mean ± SD, *P < 0.05; **P < 0.01; n = 6 to 8.
3-Nitrotyrosine is a marker of protein modifications produced by peroxynitrite and possibly other reactive nitrogen species (Ischiropoulos and Al-Mehdi, 1995; Halliwell, 1997; Eiserich et al., 1998). To determine if SOD1 overexpression attenuated NO-elicited neuronal death by decreasing peroxynitrite formation, 3-nitrotyrosine levels in the cultures were measured immediately after exposure to 4 mmol/L DEA-NO. Slot-blot immunostaining of the DEA-NO-treated SOD1-Tg and wt cocultures showed a significantly lower level of 3-nitroty-rosine in SOD1-Tg cultures than in wt cultures (Fig. 3B). The 3-nitrotyrosine standards showed a roughly logarithmic relationship between blot density and 3-nitrotyrosine concentration (Fig. 3A), such that the difference in immunoblot densities from DEA-NO-exposed wt and SOD1-Tg cells (Fig. 3B) translates to a several-fold greater difference in actual 3-nitrotyrosine content.
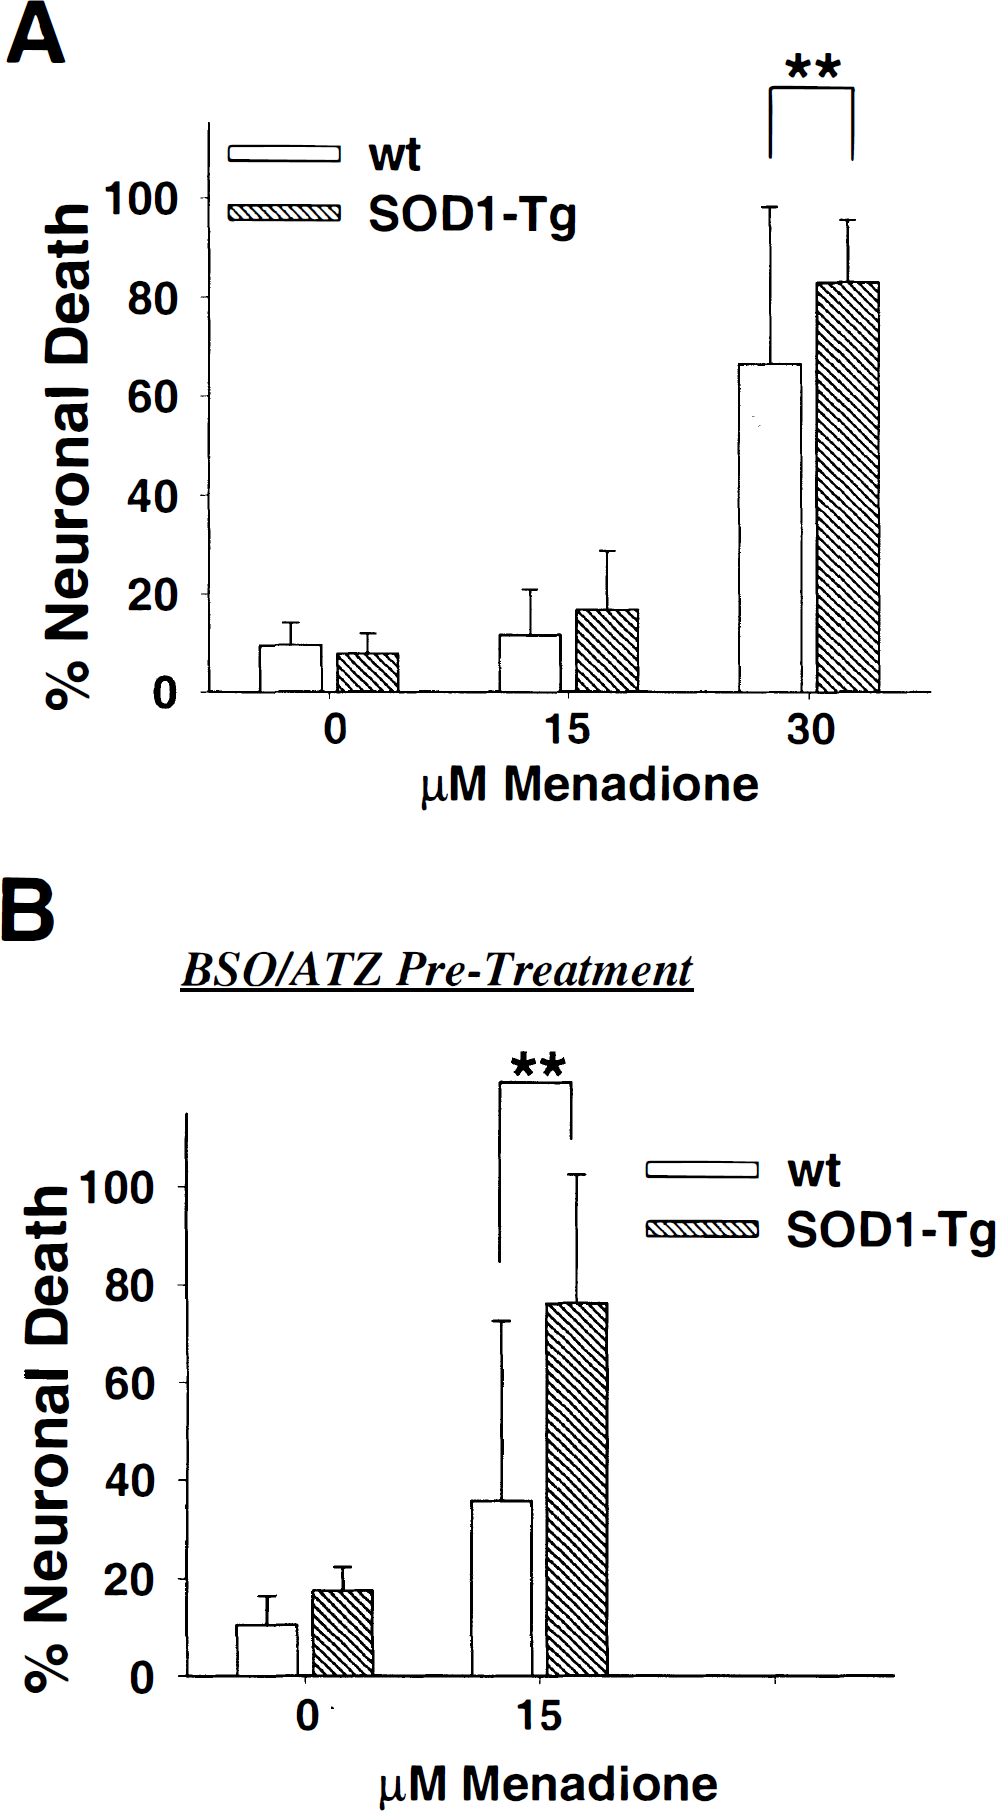
Menadione passes readily across cell membranes and reacts with intracellular electron donors and oxygen to generate superoxide (Cadenas and Sies, 1985). This superoxide generator was found to produce more death of SOD1-Tg neurons than wt neurons (P < 0.01; Fig. 4A). Similar results were obtained when cultures were exposed to paraquat, which also generates superoxide intracellularly by a redox cycling mechanism (Halliwell and Gutteridge, 1989). One mechanism by which these compounds could produce greater toxicity in the SOD1-Tg neurons is by accelerated H2O2 production. This was tested indirectly by inhibiting H2O2 catabolism of the cultures by pretreatment of the cells for 24 hours with L-S,R-buthionine sulfoximine, an irreversible inhibitor of glutathione synthesis (Griffith and Meister, 1979; Bailey, 1998), and 3-amino-1,2,4-triazole, an irreversible inhibitor of catalase (Margoliash et al., 1960). The pretreatment did not increase neuronal death under control conditions but potentiated the neuronal death produced by menadione (Fig. 4B). In addition, multiple regression analysis showed that the effect of the pretreatment on menadione-treated SOD1-Tg neurons was much greater than on the wt neurons, suggesting that menadione induced greater H2O2 production in the SOD1-Tg neurons.
To more directly determine if menadione produced a greater H2O2 production in the SOD1-Tg neurons, DCF fluorescence in menadione-treated neurons was assessed. Fluorescing DCF is generated from the oxidation of 2′,7′-dichlorodihydrofluorescein by H2O2, hydroxyl radical, and other oxidants (but not by superoxide) (LeBel et al., 1992; Vanden Hoek et al., 1997). As shown in Fig. 5A, menadione induced approximately twice as much DCF fluorescence in SOD1-Tg neurons as in wt neurons. Because DCF fluorescence also can be influenced by pH (Reynolds and Hastings, 1995), menadione effects on intracellular pH was assessed in separate studies with the pH-sensitive dye BCECF (Rink et al., 1982; Swanson et al., 1997). Menadione had no significant effect on intracellular pH in either the wt or the SOD1-Tg cells (data not shown).
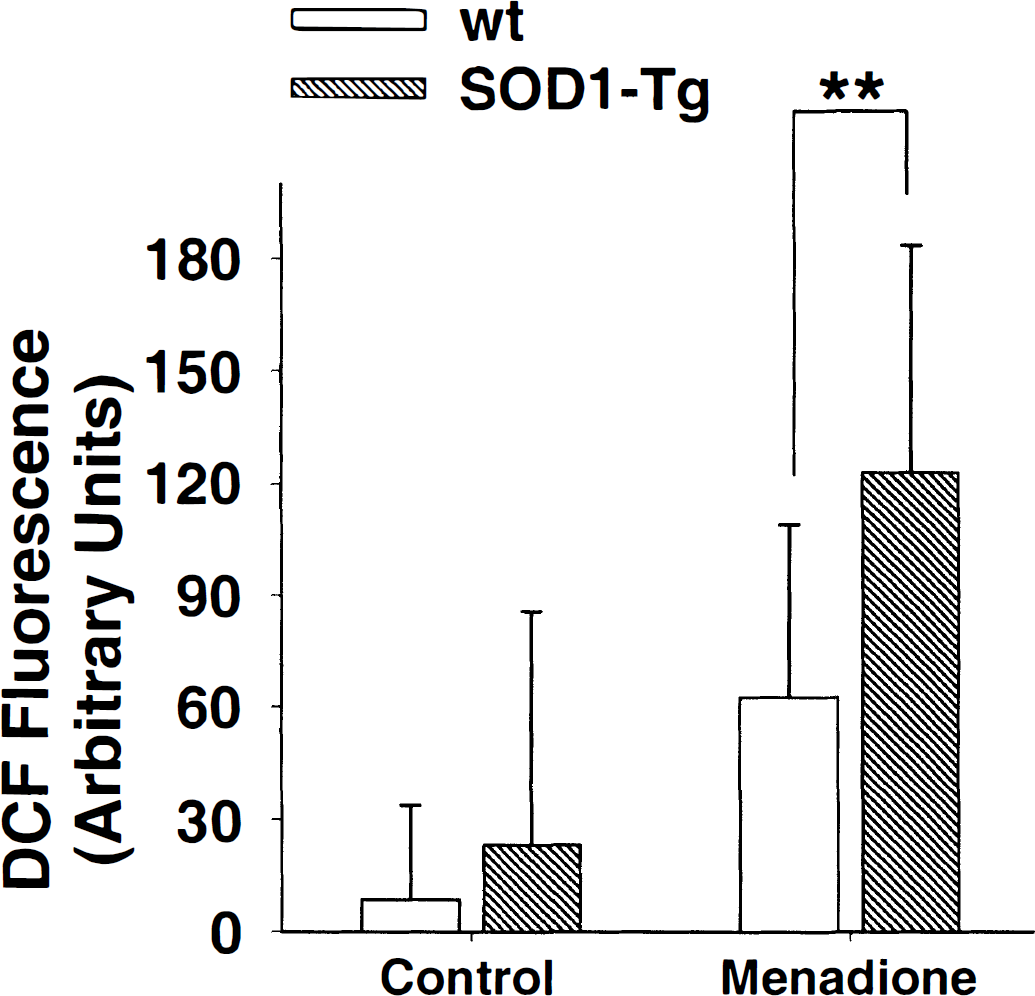
Menadione, 100 μmol/L for 30 minutes, produced a stronger DCF fluorescence signal in SOD1-Tg neurons than in wt neurons. Data points are mean ± SD, **P < 0.01; n > 60.
An alternative mechanism by which SOD1 overexpression could increase neuronal vulnerability to menadione is by increasing the sensitivity to H2O2, which is produced during menadione exposure. This could result from increased hydroxyl radical production from H2O2 by the peroxidase activity of SOD1 (Cabelli et al., 1986; Yim et al., 1990), or possibly from other secondary changes in the transgenic neurons induced by SOD1 overexpression. These possibilities were investigated by comparing the sensitivity of the SOD1-Tg and wt neurons to H2O2 exposure. As shown in Fig. 6, no differences in sensitivity to H2O2 were observed.
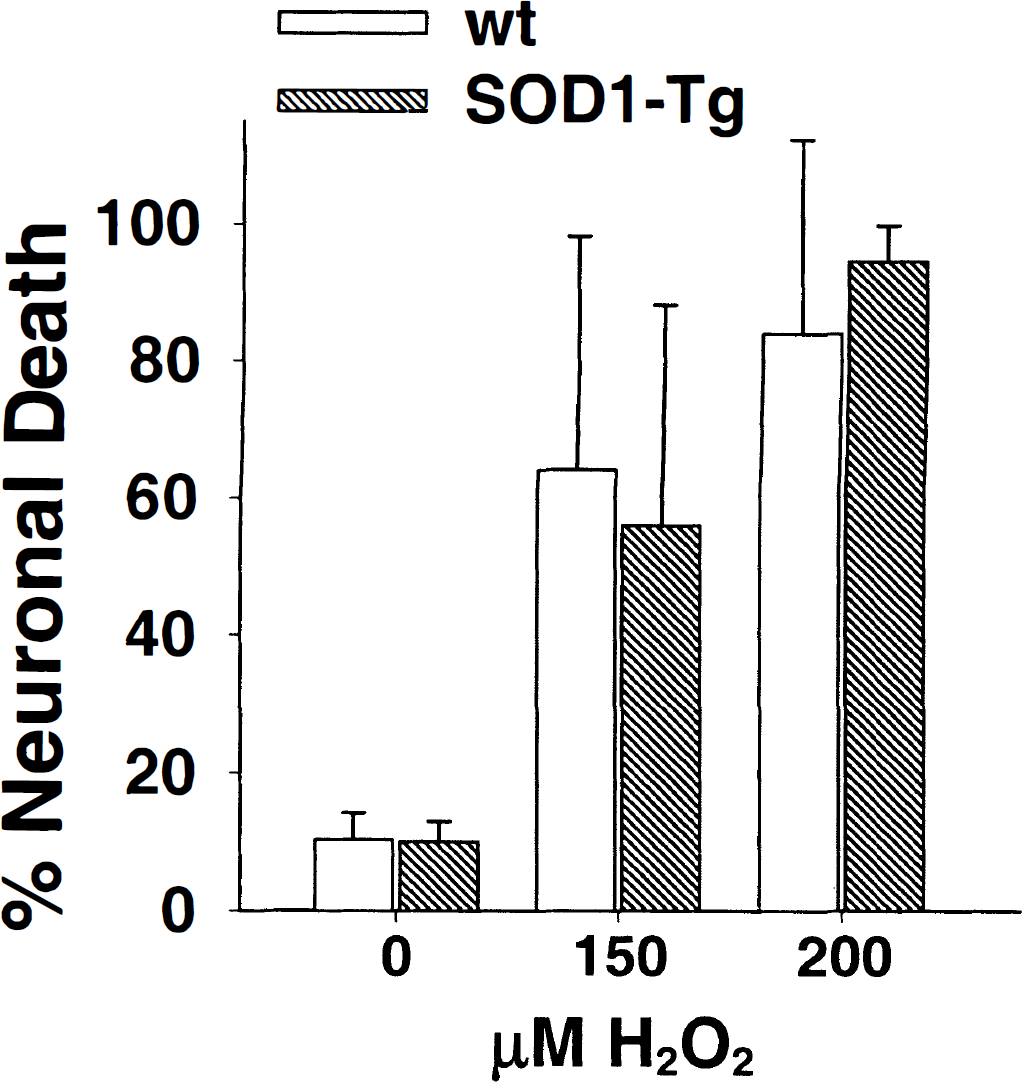
The SOD1 overexpression did not significantly affect neuronal vulnerability to H2O2. Data points are mean ± SD. n > 13.
A xanthine oxidase/hypoxanthine system (Michikawa et al., 1994) also was used to assess the effects of extracellularly generated superoxide on the SOD1-Tg and wt neurons (data not shown). Increasing xanthine oxidase elevated neuronal death, as previously reported (Michikawa et al., 1994). However, the presence of catalase (500 U/mL) completely prevented the neuronal death, suggesting that the neuronal injury elicited by extracellular sources of superoxide is mediated by H2O2 rather than by superoxide per se.
Stimulation of glutamate receptors, particularly the NMDA-type glutamate receptors, induces intracellular superoxide generation (Lafon-Cazal et al., 1993; Dugan et al., 1995) and NO production (Dawson et al., 1991). The effects of SOD1 overexpression on neuronal death elicited by glutamate, NMDA, and kainate are shown in Fig. 7. The SOD1-Tg and wt neurons exhibited nearly identical sensitivities to each of these agents.
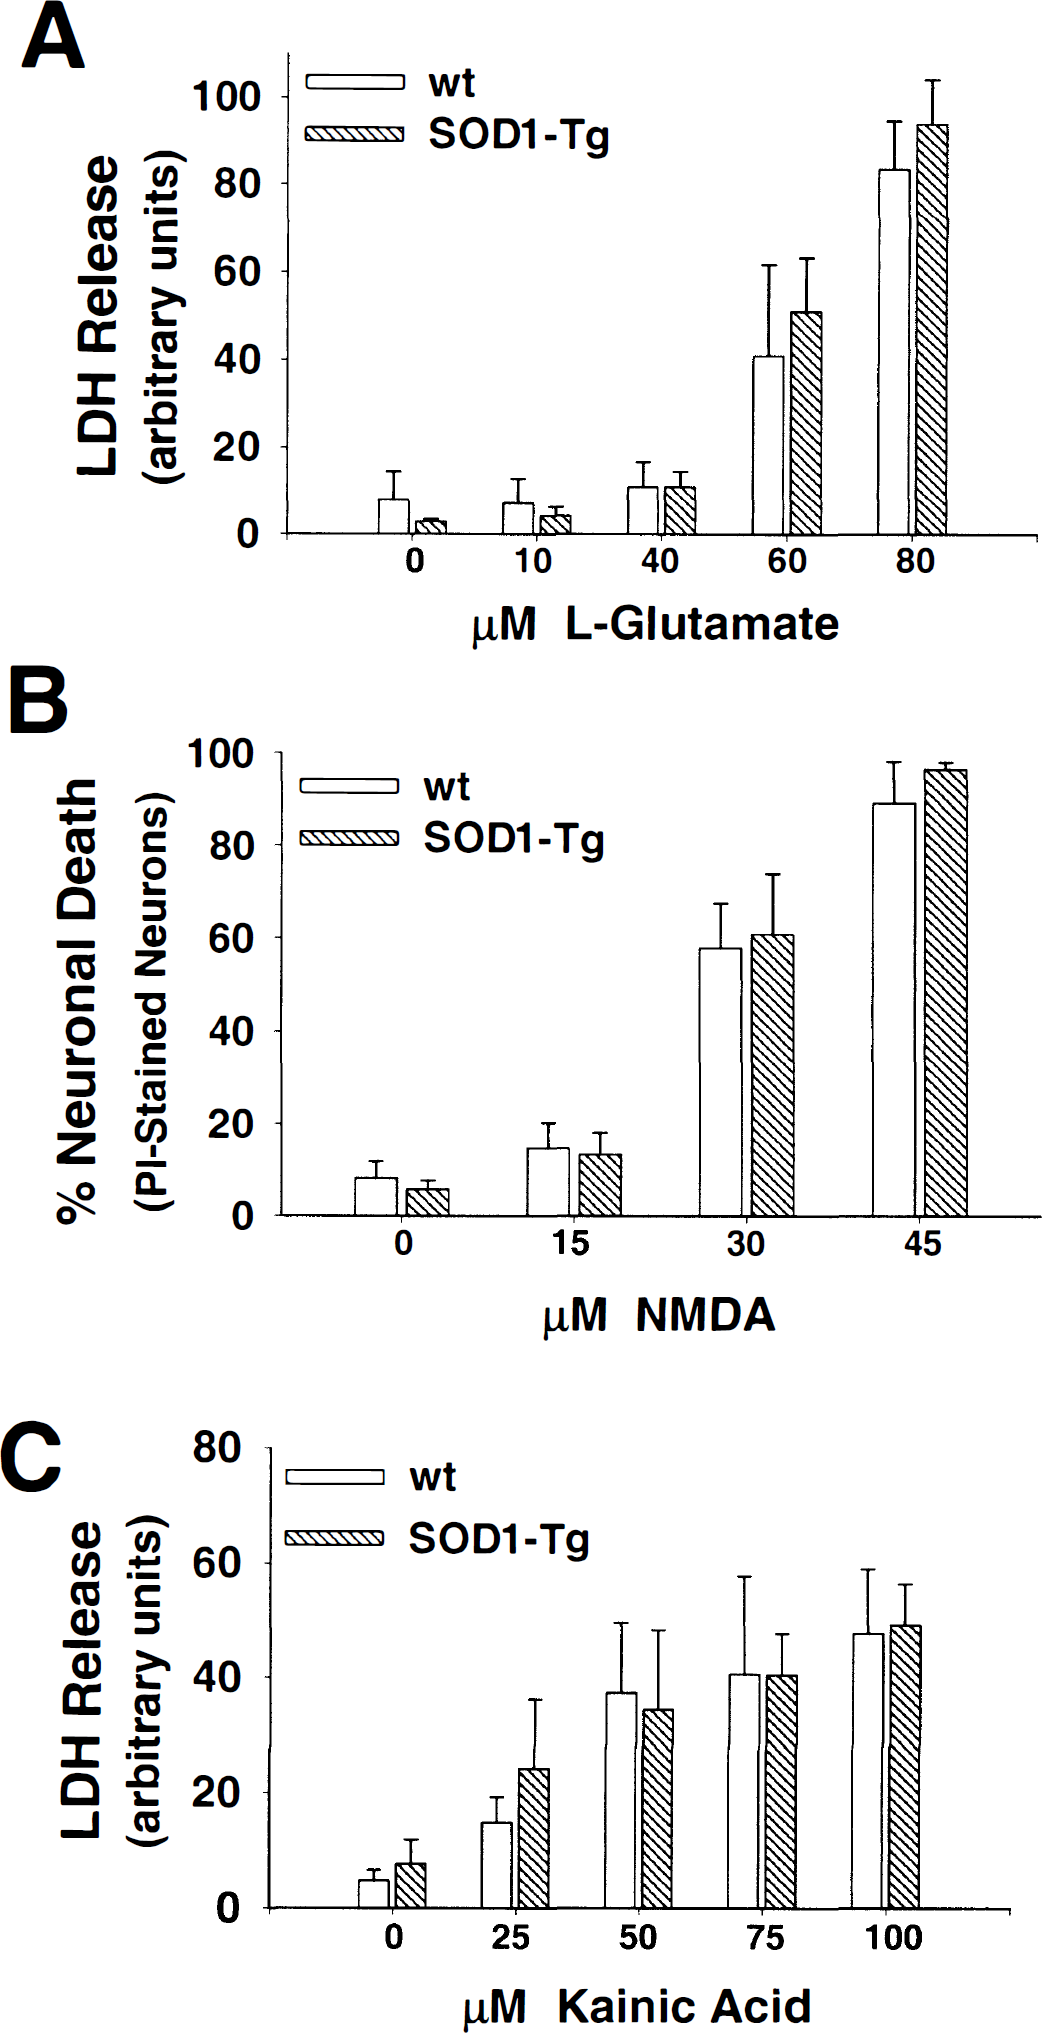
The SOD1 overexpression did not affect neuronal death elicited by L-glutamate (30-minute incubation, determined by lactate dehydrogenase assay)
DISCUSSION
The reaction between NO and O2−• to form peroxynitrite is widely accepted as an important pathogenic mechanism in many disease states (Beckman and Koppenol, 1996; Halliwell, 1997). The rate of peroxynitrite production in biologic systems is influenced by NO and O2−• concentrations, as well as by the presence of other reactants and transition metals (Miles et al., 1996). Studies in cell-free systems indicate that changes in superoxide concentrations could either increase or decrease peroxynitrite formation, depending on these other factors (Miles et al., 1996). A central finding of the current study is that NO-induced death is significantly attenuated in neurons that overexpress SOD1, as indicated by the reduced susceptibility of Tg cells to the toxicity elicited by the three structurally different NO donors (Fig. 2).
These findings provide support for previous in vivo studies that suggest decreased NO toxicity as a mechanism for the protective effects of SOD1 overexpression in murine ischemia models (Kinouchi et al., 1998). A role for peroxynitrite in this process is supported by the additional finding here that 3-nitrotyrosine content is markedly reduced in the Tg-SOD1 cells (Fig. 3). 3-Nitrotyrosine is produced by peroxynitrite oxidation of protein tyrosine residues and thus is an indirect marker of cellular peroxynitrite levels (Ischiropoulos and AlMehdi, 1995). 3-Nitrotyrosine also may be produced independently of peroxynitrite under conditions of acidosis or inflammation (Eiserich et al., 1998; Halliwell, 1997). These alternative mechanisms may complicate the interpretation of 3-nitrotyrosine formation in ischemia in vivo, where both acidosis and inflammation can be prominent features, but these mechanism are unlikely to be significant in the current cell culture studies.
A second observation of this study is that the SOD1-Tg neurons were more vulnerable than wt neurons to toxicity from the superoxide-generating compounds, menadione and paraquat. Two observations suggest that the most likely mechanism of this effect is accelerated production of H2O2 in the Tg neurons. First, DCF fluorescence was higher in the Tg cells than the wt cells under basal conditions, and this difference was magnified during menadione exposure (Fig. 5). Second, the toxicity of menadione in both wt and Tg neurons was increased during inhibition of H2O2 disposal pathways, and this increase was much greater in the Tg neurons than in wt neurons (Fig. 4B). Importantly, there was no difference in the vulnerability of Tg and wt cells to H2O2 itself. This indicates that the differences in the two cell types is not attributable to differences in downstream factors such as differing iron content or differing catalase or glutathione peroxidase activities. The nearly identical sensitivities to H2O2 also suggest that the difference is not caused by H2O2 reactions with SOD itself (Cabelli et al., 1986; Yim et al., 1998), but it remains possible that production of H2O2 by SOD could undergo site-specific reactions that do not mimic cell exposure to exogenous H2O2 well.
Theoretical considerations suggest that increased SOD activity should not result in increased H2O2 production, primarily because reactions of superoxide with iron-sulfur groups and other groups produce a greater yield of H2O2 per O2−• than does the SOD reaction (Liochev and Fridovich, 1994). However, several studies in addition to the current results indicate that increased H2O2 production can occur with SOD overexpression. Escherichia coli, which overexpress SOD, produce more H2O2 than wt cells and are more sensitive to hyperoxia or paraquat (Scott et al., 1987). The SOD1 transfectants of mouse epidermal cells are hypersensitive to oxidative stress and show increased DCF fluorescence, and these are reversed by concomitant transfections with glutathione peroxidase (de Haan et al., 1996). Similar findings are seen in fibroblasts cultured from individuals with Down's syndrome, which also have an increased ratio of SOD1-glutathione peroxidase enzyme activities (de Haan et al., 1996). A study of ischemia in neonatal mice, which have low glutathione peroxidase activity, also suggests greater H2O2 production in SOD1-Tg than in wt mice (Fullerton et al., 1998).
In contrast with these reports, Teixeira et al. (1998) observed a lower level of DCF fluorescence in Hamster cell lines transfected with SOD1. A possible difference between these cells and the cortical neurons of the current study is the relative ratios of SOD1 to catalase and glutathione peroxidase, since these ratios may be critically important in determining the net effect of SOD1 overexpression (Amstad et al., 1994; de Haan et al., 1996). In addition, the current study was performed with several measures taken to replicate physiologic conditions as closely as possible. These included (1) supplementing the culture medium with selenium and α-tocopherol to physiologic levels (Leist et al., 1996); (2) excluding phenol red and buffers (except CO2/HCO−3) from the medium during experiments to prevent free radical scavenging and nonphysiologic side reactions; (3) performing all studies at 37°C; and (4) maintaining the cultures in a 7% O2 atmosphere to produce a medium oxygen tension near that of normal extracellular fluids in vivo(Guyton, 1976). (A standard 21% oxygen atmosphere produces a hyperoxic medium and may induce compensatory changes in cultured cells.) In addition, all studies were performed using direct comparisons of neurons from SOD-Tg mice to neurons from their litter mate wt mice to minimize the influence of strain differences, which can complicate studies using transgenic animals (Gerlai, 1996; Banbury Conference, 1997).
In addition to NO and oxidative stress, excitotoxicity is a mechanism that contributes to ischemic neuronal death (Lee et al., 1999). Overexpression of SOD1 was found to have no affect on neuronal vulnerability to glutamate or to the glutamate receptor subtype specific agonists, NMDA and kainate (Fig. 6). These results generally are consistent with previous in vitro and in vivo studies with this mouse strain. Chan et al. (1990) observed reduced injury in SOD1-Tg neurons at 4 hours but not 24 hours after glutamate exposure. Similarly, Kondo et al. (1997) found negligible effects of SOD1 overexpression on kainate toxicity in vivo. Because glutamate and NMDA produce neuronal injury in part by superoxide production (Dugan et al., 1995; Lafon-Cazal et al., 1993), SOD1 overexpression might be expected to attenuate this injury. It is possible that any salutary effect of SOD1 overexpression is negated by subsequent deleterious effects of H2O2, as observed here with menadione-induced superoxide production. Alternatively, the fact that glutamate-induce superoxide production appears to be localized to the mitochondria (Dugan et al., 1995) may render the mitochondrial SOD the primary line of defense (Gonzalez-Zulueta et al., 1998). Because neuronal NO production is stimulated by NMDA receptor activation (Dawson et al., 1993), SOD1 overexpression could, in principle, attenuate glutamate and NMDA toxicity by reducing peroxynitrite formation, as shown here with exogenous NO donors. However, the contribution of the NO pathway to NMDA toxicity varies widely among different culture preparations (Dawson et al., 1993; Hewett et al., 1994), and NO production in this culture model is negligible after NMDA stimulation (Chen and Swanson, unpublished results). Notice that Bar-Peled et al. (1996) used a model of kainate exposure in immature cortical neurons (7 to 9 days in vitro in serum-free medium) to model neuronal apoptosis and found increased apoptosis in Tg-SOD1 neurons. This finding suggests that SOD1 overexpression might exacerbate apoptotic death after cerebral ischemia, an area not examined in the current study.
One use of the cell culture system is that it facilitates the identification of direct cause-effect relationships leading to cell death. On the other hand, the simplified system does not replicate many aspects of ischemia, such as inflammation and vascular factors, which may be influenced by SOD1 overexpression. The two primary conclusions from this study are that SOD1 overexpression can reduce NO toxicity in neurons by reducing peroxynitrite formation, and that SOD1 overexpression also can exacerbate neuronal injury by accelerating the production of H2O2 and other reactive oxygen species. These findings are significant to cerebral ischemia because they suggest that efforts to treat ischemia with exogenous SOD preparations may be greatly enhanced by the coadministration of glutathione peroxidase or catalase. In addition, these findings suggest that SOD augmentation may be of limited use under conditions where endogenous H2O2-disposing capacity is low, such as in immature brain (Aspberg and Tottmar, 1992) or acidosis (Ying et al., 1999).
Footnotes
Abbreviations used
Acknowledgements
The authors thank Jill Guenza, Vannita Simma, and Jane Kim for technical assistance.