
Abstract
The ability of transverse nuclear magnetic resonance relaxation time, T2, to reveal acutely reduced CBF was assessed using magnetic resonance imaging (MRI). Graded reduction of CBF was produced in rats using a modification of Pulsinelli's four-vessel occlusion model. The CBF in cerebral cortex was quantified using the hydrogen clearance method, and both T2 and the trace of the diffusion tensor (Dav = 1/3TraceD) in the adjacent cortical tissue were determined as a function of reduced CBF at 4.7 T. A previously published theory, interrelating cerebral hemodynamic parameters, hemoglobin, and oxygen metabolism with T2, was used to estimate the effects of reduced CBF on cerebral T2. The MRI data show that T2 reduces in a U-shape manner as a function of CBF, reaching a level that is 2.5 to 2.8 milliseconds (5% to 6%) below the control value at CBF, between 15% and 60% of normal. This reduction could be estimated by the theory using the literature values of cerebral blood volume, oxygen extraction ratio, and precapillary oxygen extraction during compromised CBF. Dav dropped with two apparent flow thresholds, so that a small 11% to 17% reduction occurred between CBF values of 16% to 45% of normal, followed by a precipitous collapse by more than 20% at CBF below 15% of normal. The current data show that T2 can be used as an indicator of acute hypoperfusion because of its ability to indicate blood oxygenation level-dependent phenomena on reduced CBF.
Brain function is ultimately dependent on uninterrupted CBF, and a severe drop in CBF below the level of autoregulation inevitably leads to cerebral dysfunction and finally to irreversible ischemic damage. Studies using single photon emission computed tomography or positron emission tomography (PET) show that adaptive responses in regional cerebral hemodynamics and oxygen extraction take place on reduction of cerebral perfusion pressure (CPP) (Grubb et al., 1975; Wise et al., 1983; Powers, 1991). These include an increase in cerebral blood volume (CBV), which results from vasodilation associated with a drop in vascular resistance, and increased oxygen extraction ratio (OER). These adaptations are necessary to secure substrate supply for oxidative metabolism. Thus, increased OER can be considered as an index of viable brain tissue during acutely compromised CBF and indeed, experimental evidence from focal ischemia studies suggest that tissue with high OER and low CBF may exhibit with better prognosis than that with low extraction and flow (Young et al., 1996). Consequently, a noninvasive imaging approach revealing the severity of mismatch between oxygen consumption and delivery would be of great value for the evaluation of tissue status in hypoperfused areas.
Single photon emission computed tomography and PET methods provide regional CBF in quantitative terms, and PET can be used to detect regional CMRO2 and OER; these methods have been extensively used both in experimental and clinical stroke studies (Frackowiak, 1985; Sette et al., 1989; Heiss and Podreka, 1993). Magnetic resonance imaging (MRI) offers several means to image perfusion including tracking with D2O, 19F-labeled probes, Gd-chelates, as well as using magnetic labeling of arterial spins. All of these methods have been successfully applied to reveal reduced perfusion either in qualitative or quantitative terms (for a review, see Hossmann and Hoehn-Berlage, 1995). Recently, T2* and T2 MRI were used to reveal the consequences of reduced perfusion in the cat and rat brain (de Crespigny et al., 1992; Roussel et al., 1995; Gröhn et al., 1998). Both of these NMR relaxation times are sensitive to the blood oxygenation level-dependent (BOLD) phenomenon (Ogawa et al., 1990; Thulborn et al., 1982), capable of probing the balance between oxygen consumption and delivery (Davis et al., 1998; Oja et al., 1999). The quantitative interrelationships between physiologic and MRI variables for single spin-echo (SE)-BOLD MRI have been previously described and validated in animal models (van Zijl et al., 1998). Until now, the theory has been successfully applied to derive quantitative data for CBV in hypoxic hypoxia (van Zijl et al., 1998) and in hypercarbia or hypocarbia (Ulatowski et al., 1999) in cats, as well as for OER during visual activation in humans (Oja et al., 1999). Furthermore, we have demonstrated that T2 reductions from BOLD at 9.4 T can be detected in hypoperfusion and during the first minutes of middle cerebral artery occlusion in rats (Gröhn et al, 1998). In the current study, we assess the applicability of the quantitative SE-BOLD theory under conditions of compromised CBF in rat brain at 4.7 T. Experimental T2 data are quantitatively compared with calculated ones using the aforementioned theory. We also simulated T2 changes at 1.5 T to evaluate the relevance of the approach to clinical MRI.
METHODS
Animal preparation
Graded decrease in CBF was induced for male Wistar rats (n = 26) using a modification of the four-vessel global forebrain ischemia model (Pulsinelli et al., 1982). Briefly, both arteria vertebrales were electrocoagulated under halothane anesthesia (1.5% halothane in 70/30 N2O/O2). On the following day, rats were reanesthetized with urethane (1.2 to 1.5 g/kg intraperitoneally), which provided stable anesthesia in a single injection, causing minimal depression of the cardiovascular and respiratory system (Buelke-Sam et al., 1978; Flecknell, 1996) and maintaining close-to-normal cerebral autoregulation (Sandor et al., 1986). Both femoral arteries were cannulated for blood pressure measurements (Datex, Helsinki, Finland) and blood gas analysis (ABL-5, Radiometer, Inc., Copenhagen, Denmark). Both common carotid arteries (CCAs) were exposed and surrounded with silicon-coated snares joined to a controllable screw systems, which were similar, as previously described in detail (Allen et al., 1993). These occluding devices made it possible to produce graded, reversible occlusions of the CCAs from outside of the magnet. Core temperatures of the animals were monitored and maintained close to 37°C with an external heating blanket both during surgery and MRI.
Determination of CBF
Cerebral blood flow was quantified using the hydrogen clearance method (Crockard et al., 1980). Briefly, the skull was exposed and two Teflon-coated 0.1-mm platinum/iridium electrodes with 1-mm exposed tips were inserted 1.5 mm into cerebral cortex through burr holes made 2 mm caudal to bregma and 3 mm lateral from midline to both sides of the brain. Ag/AgCl reference electrodes were inserted subcutaneously in the flank. A mixture of H2/N2/O2 10/65/25 was used for loading, after which the inspired gas was switched to N2/O2 75/25, and a hydrogen clearance curve was recorded for 2 minutes. An initial slope procedure was used in quantitative analysis of CBF (Olesen et al., 1971).
MRI methods
The MRI data were acquired in a horizontal 4.7 T magnet (Magnex Scientific, Ltd., Abdington, UK) equipped with actively shielded field gradients (Magnex) interfaced to a s.m.i.s. console (Surrey Medical Imaging, Ltd., Guildford, UK) using a single-loop receiver/transmitter surface coil (diameter 30 mm). A horizontal imaging slice, thickness of 1.5 mm, field of view of 40 mm, matrix size of 128 × 64, zero-filled to 128 × 128 before Fourier transformation, was set according to axial T1-weighted multislice SE pilot images so that the center of the slice was 2 mm from the ends of the electrodes. The data for T2 maps were collected using a SE-sequence with a repetition time (TR) of 1500 milliseconds, four echo times (TE) of 20, 50, 80, and 110 milliseconds, and an adiabatic BIR-4 refocusing pulse (Garwood and Ke, 1991). A Hahn SE-sequence was selected instead of a multiecho approach to maximize sensitivity of the sequence to SE-BOLD (van Zijl et al., 1998; Gröhn et al., 1998).
Images of the trace of the diffusion tensor (Dav = 1/3 TraceD) were acquired using the same SE-sequence (TR of 1500 milliseconds, TE of 75 milliseconds) with four bipolar diffusion gradients in each direction (Mori and van Zijl, 1995). Diffusion weighting strengths of 40, 956, and 1376 s/mm2 were used to calculate the absolute diffusion image.
Experimental protocol
Two baseline CBF values and two sets of control images were measured, after which CCAs were partially occluded to produce a controlled CBF decrease. After 1 minute of stabilization, T2 between 2 and 7 minutes, Dav between 7 and 12 minutes, and CBF both between 1 and 5 and 9 and 13 minutes of CCA occlusions were measured, and CCAs were released. This protocol was repeated one to five times for one animal with more severe flow reductions until either the CBF threshold for a diffusion drop by more than 15% was reached or CBF did not normalize after release of the CCAs. The occlusions with greater than a 10% difference between repeated CBF measurements during a single insult were discarded. Data from each hemisphere were used independently, resulting in 152 CBF values measured during occlusions from 26 animals studied. T2 and Dav maps were computed, and regions of interest from parietal cortex were analyzed.
Statistical analysis
Statistical analyses were performed with analysis of variance with post hoc multiple comparisons using Tukey's HSD test to determine significant differences between individual group means as well as to determine homogeneous subsets for significance level p < 0.05. To compare simulated model with the experimental results, multiple comparisons were performed using simulated T2 values as contrast coefficients. All values are indicated as mean ± SD.
THEORY AND SIMULATIONS
A quantitative theory taking into account the interrelationships between the SE-BOLD changes and physiologic parameters (van Zijl et al., 1998; Ulatowski et al., 1999) was applied to conditions of reduced CBF from vascular occlusion. In the following, equations and quantitative assumptions different from the earlier studies are summarized. Notice that the validity of the assumptions is evaluated in case of moderate hypoperfusion, (i.e., CBF above 20 mL·100 g−1·min−1, thus being comparable with flow regions studied by others (Busza et al., 1992; Kohno et al., 1995). The parameters for calculations are for rat at 4.7 T and for human at 1.5 T to simulate either our experimental data or the clinically relevant situation, respectively.
The basic physical phenomenon behind the theory is the sensitivity of SE T2 relaxation to BOLD (Thulborn et al, 1982; Bryant et al., 1990; van Zijl et al., 1998). Although T2* is more commonly used to reveal in vivo BOLD effect because of its sensitivity to both intravascular and extravascular susceptibility effects, quantification of the T2* effect is more complex because of its sensitivity to magnetic field inhomogeneity and local susceptibility differences (e.g., at tissue interfaces) (Ogawa et al., 1993). It has been demonstrated that the SE-BOLD effects arise mainly from the intravascular compartment and can be reconciled by protons exchanging rapidly between plasma and erythrocytes, which have different susceptibilities depending on the fraction of deoxygenated hemoglobin (xdeoxy) inside erythrocytes, thus creating a quantitative relationship between blood oxygenation and T2-relaxation (Bryant et al., 1990; van Zijl et al, 1998).
The value of xdeoxy in blood depends on arterial oxygen saturation fraction, Ya, and OER and can expressed in individual microvessels as:

in which
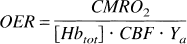
in which mi is the fraction of the maximum amount of oxygen that can be extracted on average for the particular vessel and it amounts to 0, 0.5, and 1 for arterioles (a), capillaries (c), and venules (v), respectively. CMRO2 is the cerebral metabolic rate of oxygen consumption and [Hbtot] is hemoglobin concentration. Under physiologic conditions, diffusive transport of gases between tissue and blood is thought to proceed only in the capillaries, and in the previous reports, we have used morphometric arteriole-capillary-venule volume ratio of 0.21:0.33:0.46 (capillary fraction equals to microvessels of diameter less than 10 μm). This classic concept has been challenged, since significant precapillary oxygen loss evidently takes place in the arterioles, with a diameter ranging from 20 to 50 μm (Popel and Gross, 1979; Ivanov et al., 1982; Intaglietta et al., 1996; Torres Filho et al., 1996). To take these data into consideration, we have modified the vascular fractions to an arteriole-capillary-venule volume ratio of 0.05:0.49:0.46, whereby the capillary fraction includes smaller arterioles and capillaries in which gas exchange takes place (Sharan et al., 1989). These vascular fractions are based on the deoxygenation process in microvessels and should not be confused with the morphometric fractions. Under physiologic conditions, a linear extraction of oxygen is assumed (Torres Filho et al, 1996) yielding mc = 0.5. However, the deoxygenation process may be different in severe hypoperfusion. Decreased pH and increased CO2 in the hypoperfused area result in an elevated P50 of hemoglobin, enhancing release of oxygen in precapillary arterioles with high PO2 (Sharan et al., 1989; Intaglietta et al., 1996). The reduced CBF may further favor precapillary oxygen loss because the prolonged residence time in microvascular network allows more time for gas diffusion (Popel and Gross, 1979). Therefore, we also have simulated the influence of precapillary oxygen loss on T2 by varying mc.
If water exchange between erythrocytes and plasma is considered to be the major mechanism in T2 relaxation and fast exchange conditions prevail, the relaxation rate (R2 = 1/T2) in blood can be written as (Allerhand and Gutowsky, 1964; van Zijl et al., 1998):
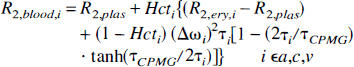
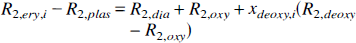

R2,plasma, R2,deoxy, R2,oxy, and R2,dia denote the relaxation rates for plasma, deoxygenated and oxygenated hemoglobin, and the remaining diamagnetic sites, respectively, and they were recently deduced for 1.5 and 4.7 T (van Zijl et al., 1998): R2,plas = 2.0 1/s, R2,dia + R2,oxy = 7.5 1/s, R2,deoxy − R2,oxy = 14 1/s for 1.5 T, and R2,plas = 4.6 1/s, R2,dia + R2,oxy = 9.3 1/s, R2,deoxy − R2,oxy = 42 1/s for 4.7 T. Susceptibility difference between plasma and erythrocytes (Δω) is calculated using coefficients as follows (van Zijl et al., 1998): ωdeoxy = −0.2708 ppm, ωoxy = −0.0538 ppm, and ωdia = 0.0304 ppm. The time τCPMG equals TE in our experiments, thus explaining the greater sensitivity of a single SE to BOLD than a multiecho approach (Gröhn et al., 1998; van Zijl et al., 1998). We used TE times of 20, 50, 80, and 110 milliseconds and 50, 80, 110, and 140 milliseconds in T2 calculations at 4.7 T and 1.5 T, respectively. Notice that R2 values and signal intensities have to be calculated for each echo-time independently and that apparent R2 for selected parameters can be fitted from these signal intensities (Eq. 6). The lifetime τi = (1 − Hcti)τcry of exchange between erythrocytes and plasma is calculated using the lifetime inside the erythrocyte τery = 12 milliseconds for humans and τery = 7.7 milliseconds for rat. The latter value is calculated from membrane permeability of 7.1 * 103 cm/s for humans and 11.0 * 103 cm/s for rat (Benga and Borza, 1995), assuming similar erythrocyte area-to-volume ratios.
Hematocrit (Hct) influences exchange-based T2 relaxation of blood by both affecting τi and determining the sizes of the exchange compartments (Eq. 3). In cerebral microvessels, Hct is known to be 85% of the one in large vessels. This relation appears not to hold during locally reduced CBF (Yamauchi et al., 1998), and a 50% decrease in cerebral Hct was detected in the rabbit carotid occlusion model when CBF had reduced by 52% (McHedlishvili et al., 1997). A key mechanism for Hct reduction is believed to be irregular distribution of the erythrocytes according to flow velocity in arterial bifurcations, so that gradual separation of erythrocytes and plasma in the arterial branching sequence leads to local decrease of Hct in the hypoperfused region (McHedlishvili and Varazashvili, 1981; McHedlishvili et al., 1997). In the current global animal model, the arteries are occluded at the levels of CCAs, thus lacking the arterial branching sequence proposed for Hct reduction (see McHedlishvili and Varazashvili, 1981). Therefore, we have used values calculated with constant microvascular cerebral Hct = 0.85 × 0.47 for rat (Baker et al., 1979). However, the values calculated with decreased Hct from the baseline value 0.85 × 0.41 for human data were used, since they are relevant to clinical situation of acute arterial occlusion (Yamauchi et al., 1998). Decrease in Hct causes increase in OER (Eq. 2) because [Hbtot] is directly related to Hct (Ulatowski et al., 1996), and, thus, the combined effect of these two parameters has to be taken into account to estimate the influence of decreased Hct in SE-BOLD.
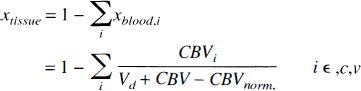
Quantitative interrelationships for R2 described earlier are inherent to blood and also hold during reduced CBF. To treat R2 in a MRI voxel, it is necessary to account for the contribution of tissue R2. The SE-BOLD theory assumes slow exchange between microvascular bed and tissue (van Zijl et al., 1998), which also is expected to prevail in acute hypoperfusion, and, thus, signal attenuation in a SE experiment can be expressed as follows:
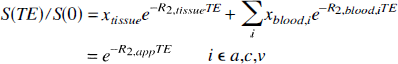
in which the tissue fraction (xtissue) and blood fractions (xblood, i) are related through Eq. 7.
The R2 of the tissue remains unaltered in the early phase of hypoperfusion, as supported by experimental data from ischemia studies (Kato et al., 1986; Knight et al., 1994; Schwab et al., 1997). We use values of R2,tissue 19.8 1/s for rat at 4.7 T fitted from our measurements assuming OER is 0.36 under normal physiologic state and 12.6 1/s for human gray matter in 1.5 T (Whittall et al., 1997). For urethane-anesthetized Wistar rat cortex CBV under normal physiologic state, CBVnorm is 4.77 ± 0.13% (Sandor et al., 1986), and wet-dry weight ratio of the Wistar rat cortex varies between 80% and 84% (Schwab et al., 1997). Therefore, the corresponding values for human gray matter, CBV 47 μL/g (Leenders et al., 1990) and water content of (Vd) 820 μL/g (Brooks et al., 1980), can be used in calculations of blood and tissue fractions both for the rat and humans.
When CPP drops below 60 mm Hg, the normal physiologic interrelationship between CBV and CBF given by the equation, CBV/CBVnorm = (CBF/CBFnorm)0.5(van Zijl et al., 1998), does not hold. The drop in CPP is compensated by decreased microvascular resistance, leading to vasodilation. It is experimentally shown that CBV reaches its maximal value, CBVmax when CPP is reduced to 20 mm Hg (Ferrari et al., 1992; Grubb et al., 1975). The reported data concerning CBV below the CPP levels where CBVmax has been attained appear to be contradictory. Some studies indicate a linear drop of CBV as a function of reduced CPP (Powers et al., 1984; Sette et al., 1989), whereas others show CBVmax at nonzero CPP (Schumann et al., 1988). One potential mechanism reducing CBV even below normal under these conditions might be drop of arterial input pressure below the critical closing pressure in cerebrovascular circulation (Burton, 1951). We assume in our calculations, that CBVmax is reached by CPP of 20 mm Hg, followed by a decline toward normal CBV with lower CPP values. For simplicity, an equal relative volume increase in each microvessel type is assumed to take place, thus maintaining the volume fraction ratio indicated earlier. The OER has been shown to increase on decreasing CPP below 60 mm Hg. A close to linear increase in OER with decreasing CPP below 60 mm Hg has been reported, reaching the level of 0.8 at CPP 20 mm Hg (Sette et al., 1989; Ferrari et al., 1992). Further increase in OER is expected to be impossible because of inhibition of CMRO2 on a more severe drop in perfusion pressure. To compare simulated results with the experimental ones, we use a linear inter-relationship between CBF and CPP values below 60 mm Hg (Sette et al., 1989; Powers, 1991; Ferrari et al., 1992).
RESULTS
Simulation of the effects of various physiologic parameters
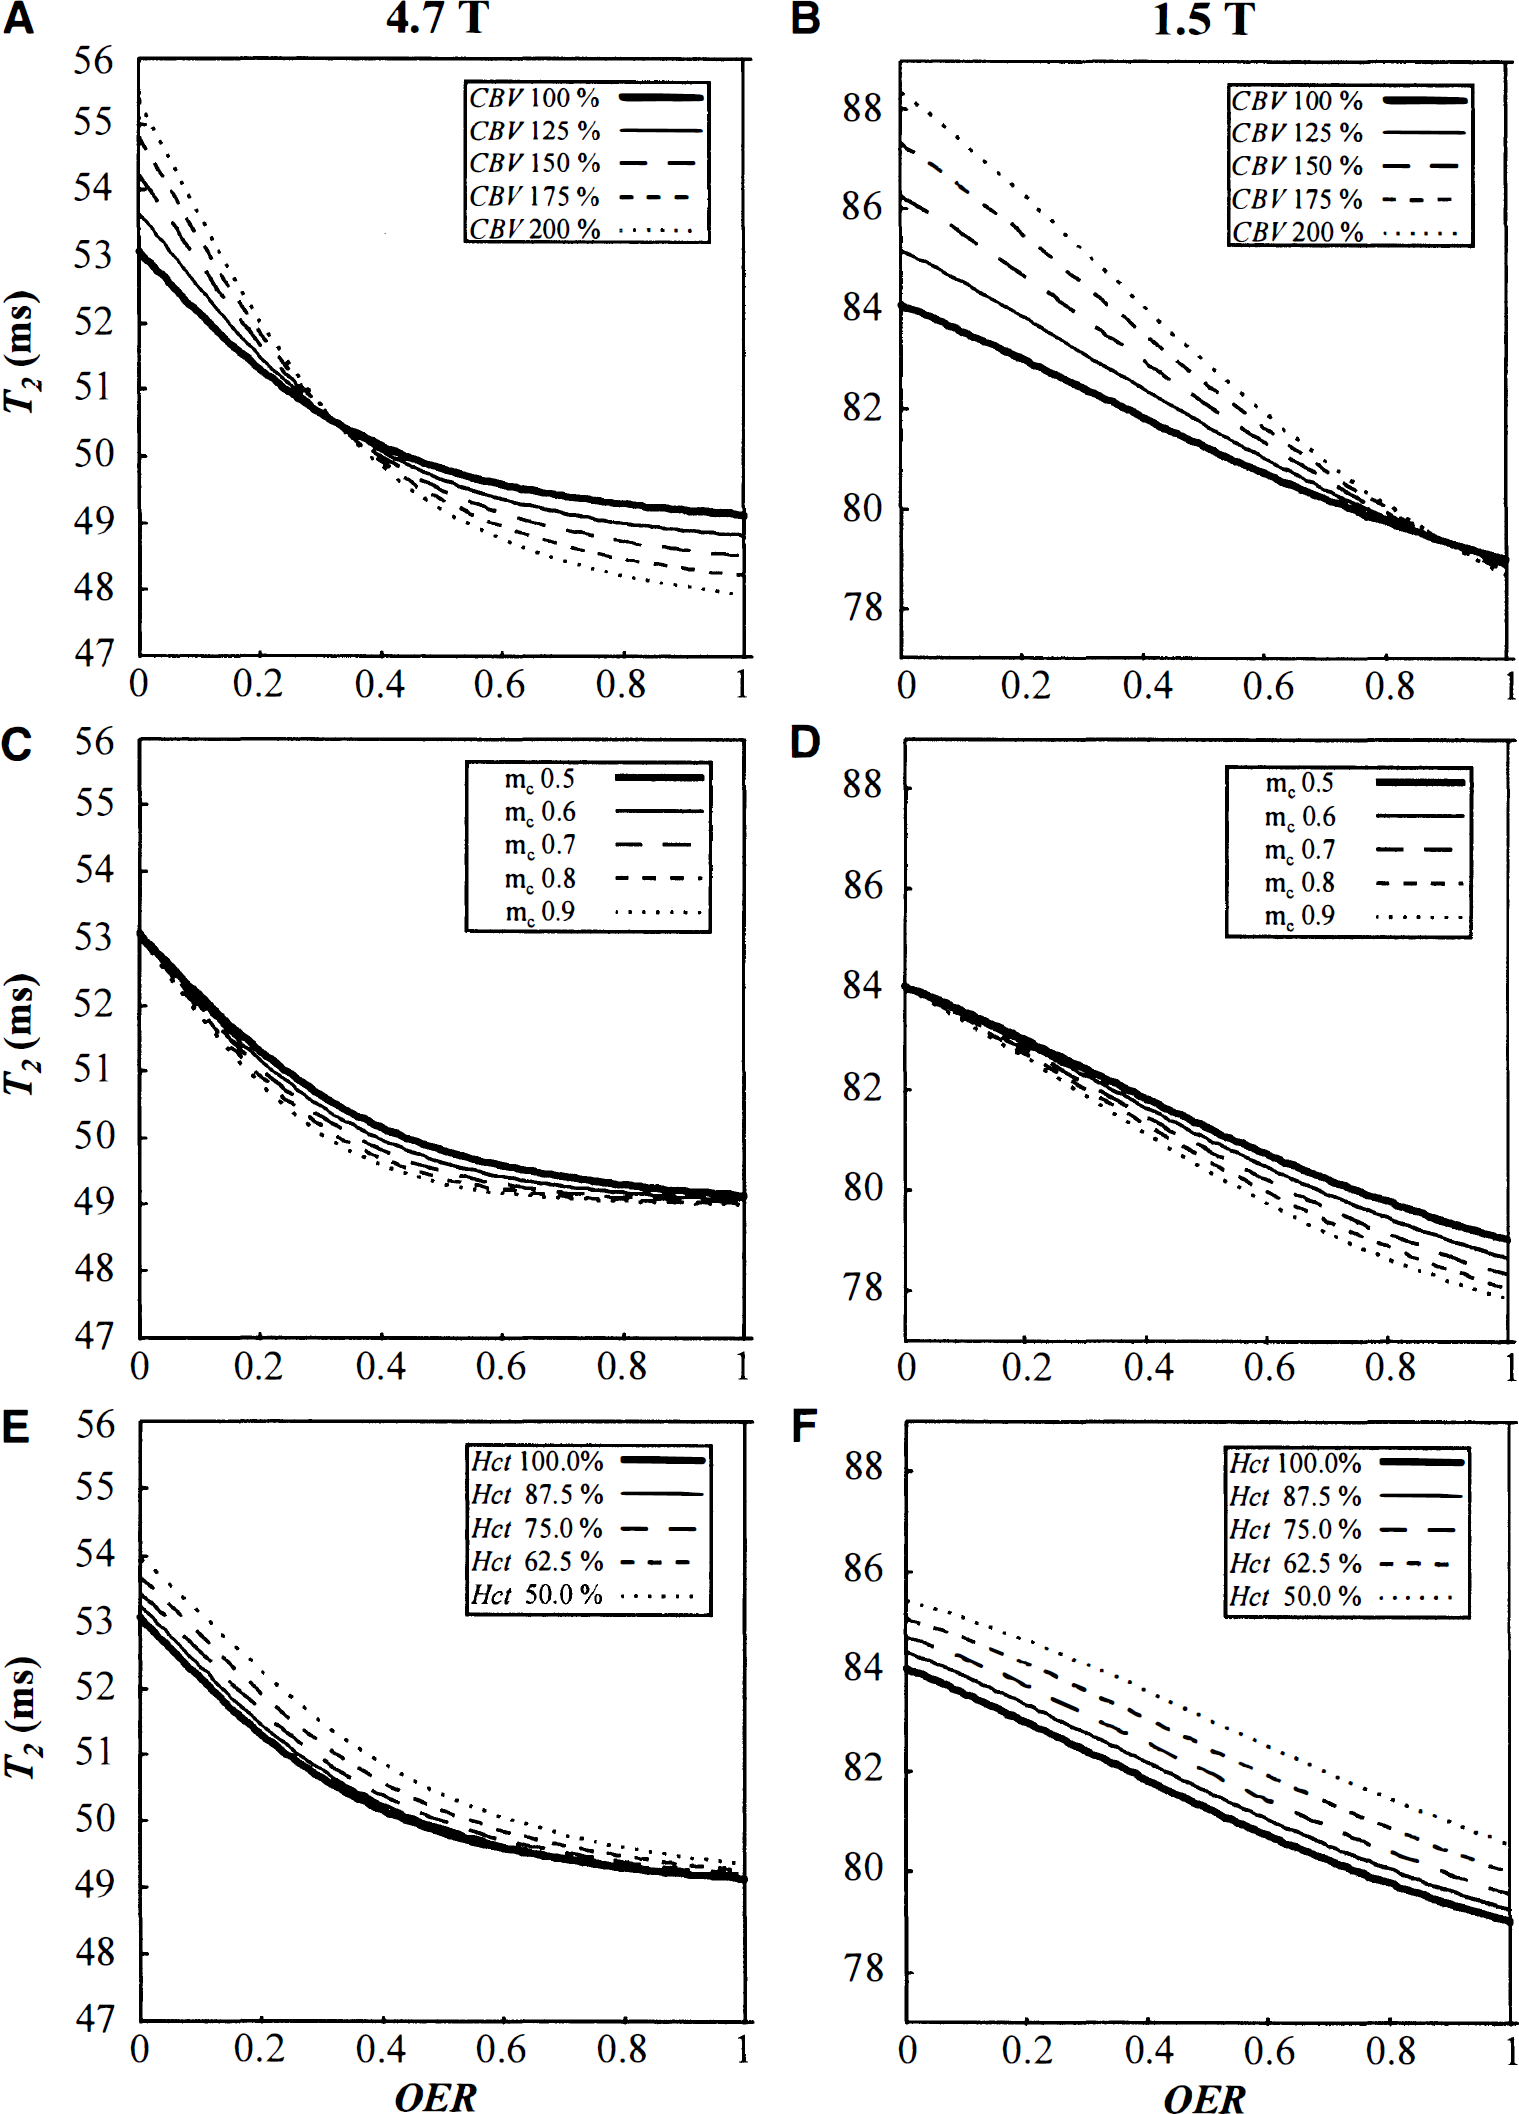
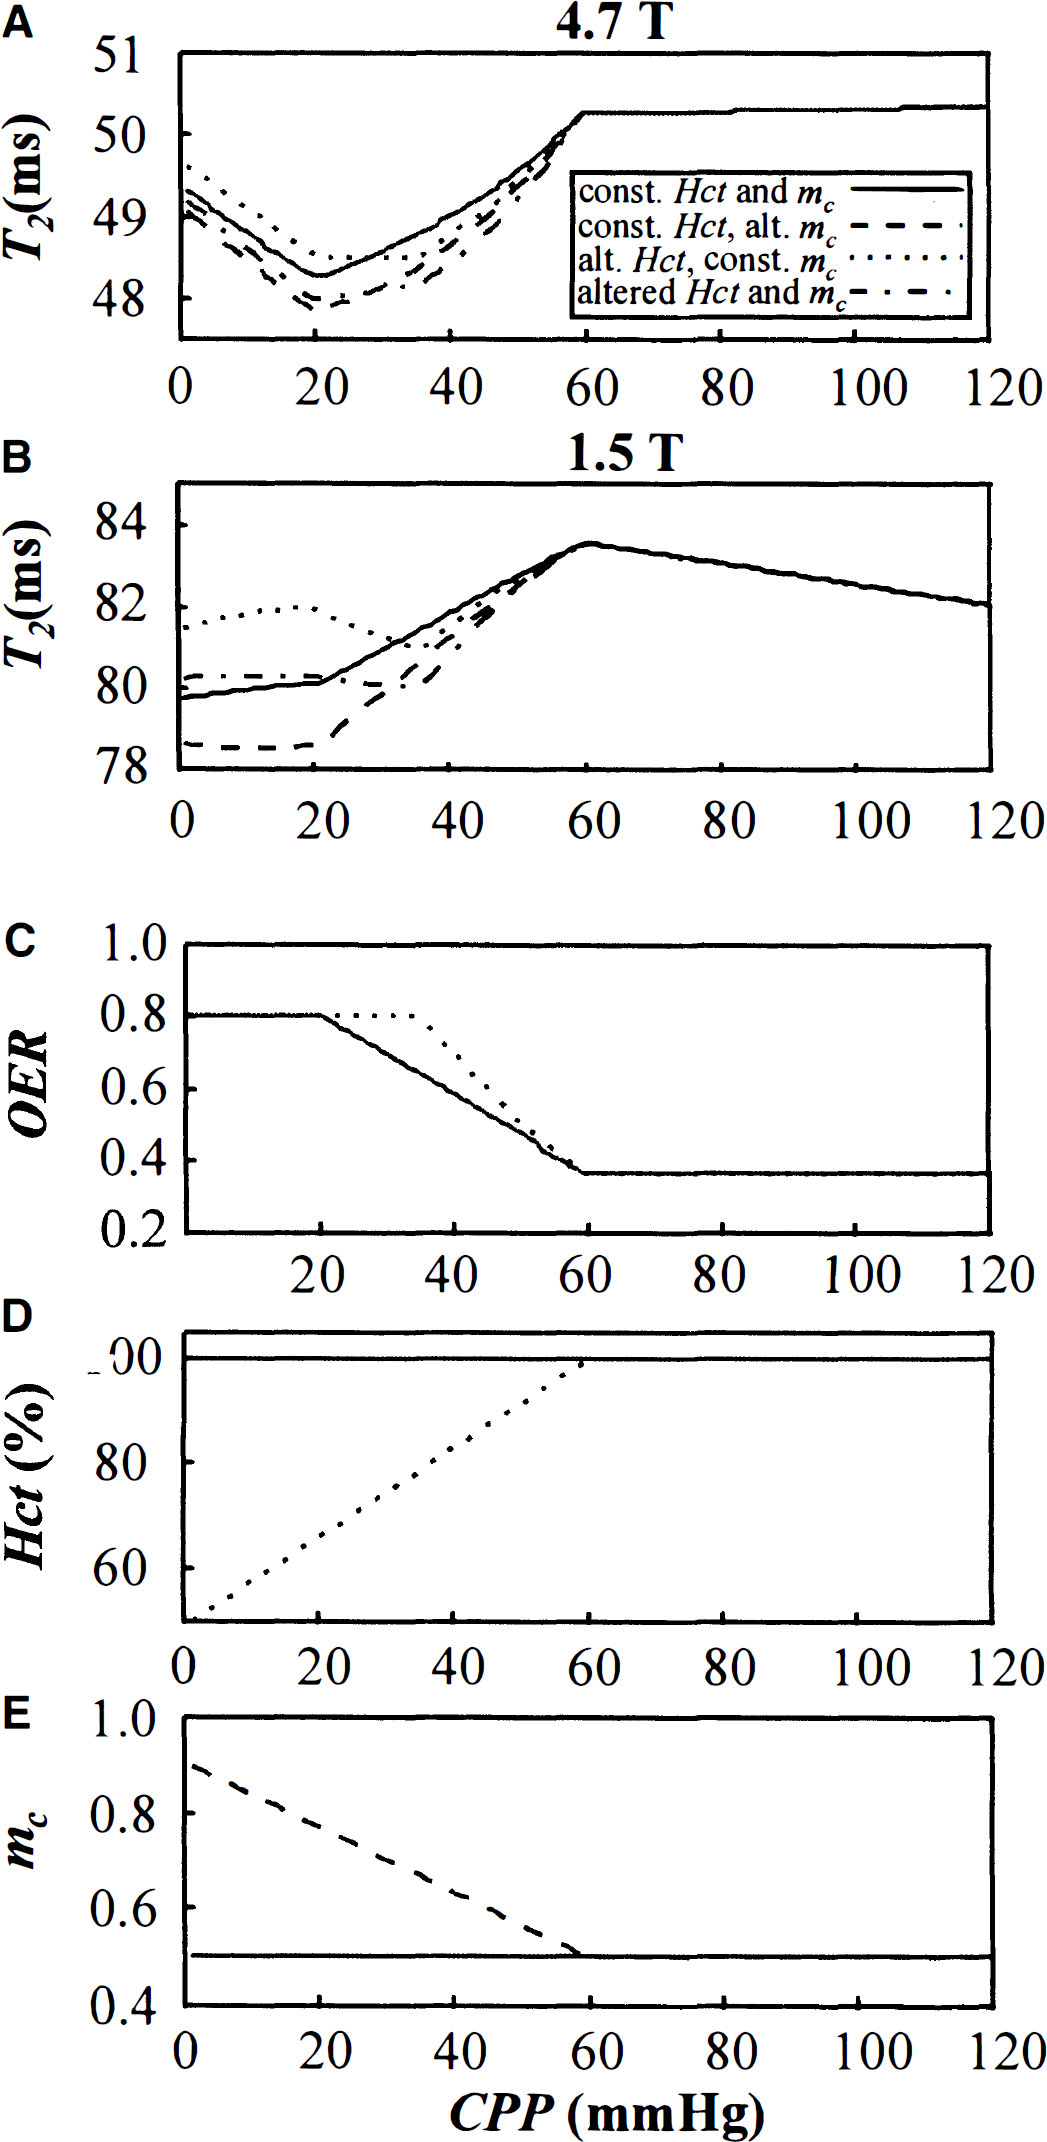
Using the normal physiologic parameters defined in Methods, T2 changes were computed from the SE-BOLD theory at 4.7 T and 1.5 T as a function of OER and by varying the CBV values between 100% and 200% of normal (Figs. 1A and 1B). Similarly, the effects of varying nonlinear extraction of oxygen in gas exchanging microvasculature (Figs. 1C and 1D) and Hct (Figs. 1E and 1F) were estimated. The key factors affecting T2 are OER and CBV at both field strengths during hypoperfusion. Notice that the influence of CBV on T2 differs greatly at the two field strengths because of the field-dependent T2 relaxation of blood and tissue. At 4.7 T, tissue and average blood T2, weighted for fractional sizes of given vascular type, are equal at normal OER and, therefore, apparent T2 is unaffected by CBV change. However, increased OER on reduced CPP decreases blood T2 below that of tissue, and a simultaneous increase in CBV results in an even steeper drop in apparent T2. At 1.5 T, blood T2 approaches T2,tissue when OER increases to 0.8, and, therefore, high CBV has only a small influence on T2 during hypoperfusion.
Simulated T2 relaxation time as a function of oxygen extraction ratio (OER). Values are calculated using the theory described in Methods for 4.7 T
We also simulated the plausible influence of precapillary oxygen losses during compromised CBF by varying the coefficient mc in Eq. 1 (Figs. 1C and 1D). Because no quantitative information about the magnitude of this factor during hypoperfusion is available, we computed T2 values corresponding to mc range of 0.5 to 0.9. At 4.7 T, such an increase in mc leads to a maximum decrease of 0.5 milliseconds in T2 when OER is elevated up to 0.5. Further increases in OER would not influence T2. At 1.5 T, the effect of mc is synergistic with increasing OER, attaining a maximal effect of 1.2 milliseconds at OER close to unity. Although the effect of increased precapillary oxygen losses on T2 is relatively small at both fields, its influence is doubled by increased CBV associated with hypoperfusion.
The effect of locally decreased Hct was estimated by varying it between 50% and 100% from normal (Figs. 1E and 1F). At 4.7 T, T2 increases by less than 0.5 milliseconds on elevated OER (OER more than 0.36) when Hct reduces in this range. At 1.5 T, a decrease in Hct results in an increase in T2 by 1.5 to 1.8 milliseconds over the entire OER range.
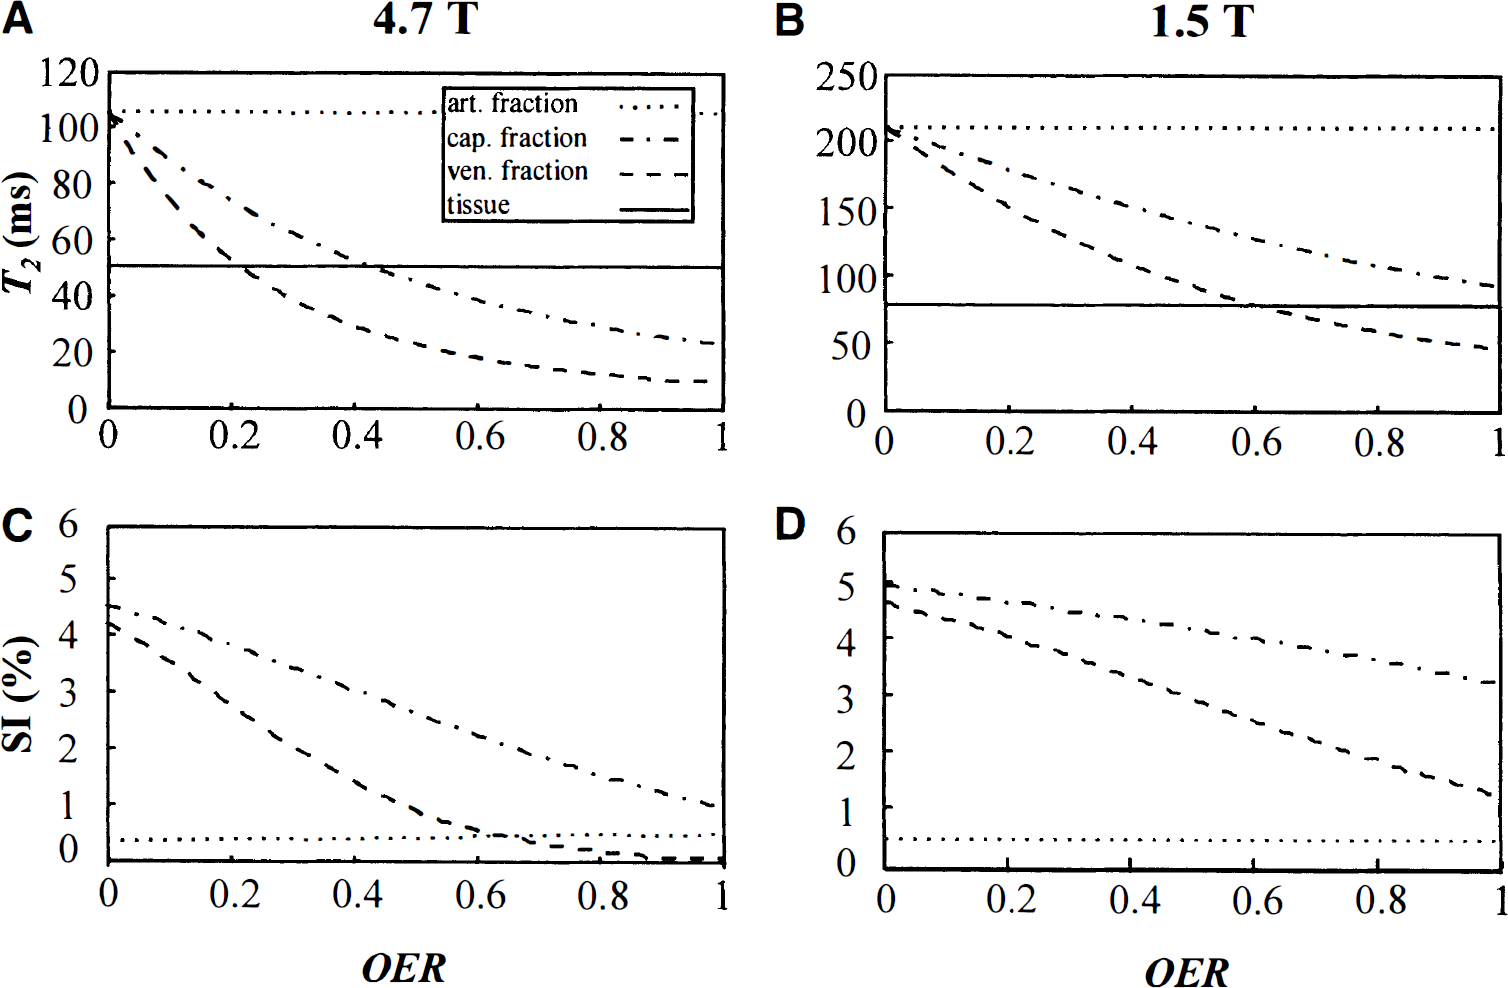
The shapes of the T2 versus OER curves clearly differ between 1.5 T and 4.7 T (Fig. 1). At 1.5 T, T2 decreases almost linearly with increasing OER, whereas at 4.7 T an elevation of OER above 0.7 leads only to a minor T2 decrease. To reconcile this, we calculated T2 and relative SE signal intensity in arterial, capillary, and venous blood fractions (Fig. 2). It is evident that at OER above 0.55 venous T2 becomes less than 20 milliseconds at 4.7 T, which is the shortest TE in our experimental design. Consequently, the SE signal intensity arising from the venous compartment drops below 1% of the total signal intensity. This decreases the contribution of venous blood to the total relaxation time, thus moderating the apparent T2 decrease. At 1.5 T, T2 is 46 milliseconds for completely deoxygenated blood (Fig. 2B), and thus venous blood will be detectable at all OER values, leading close to linear T2 dependence on OER (Fig. 1).
Simulated T2 relaxation time
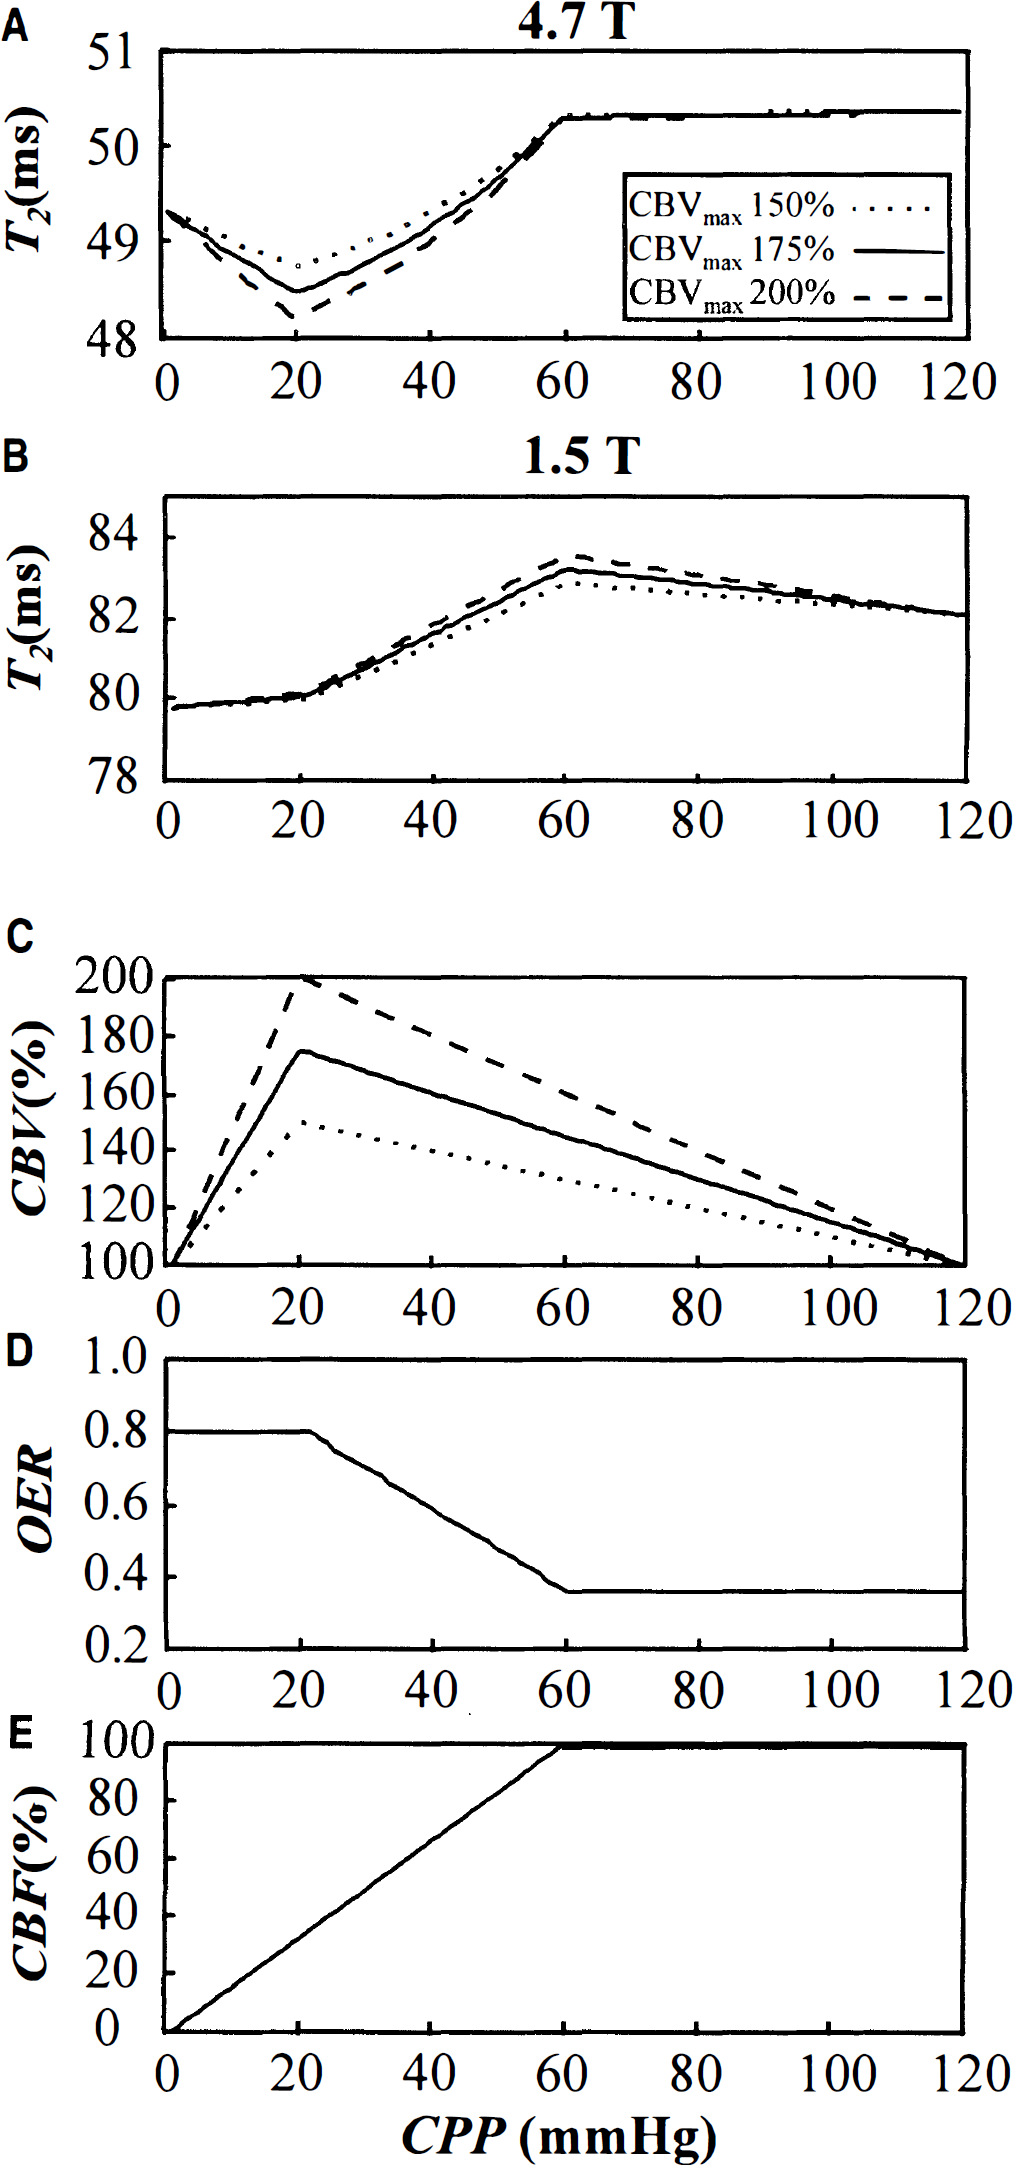
To estimate the combined effect of the aforementioned parameters in hypoperfused tissue, we computed T2 using a schematic dependence of OER, CBV, and CBF on CPP based on literature (see Theory and Simulations). At 4.7 T, T2 did not change with decreasing CPP until OER started to increase (Fig. 3). A maximal T2 drop of 1.8 to 2.5 milliseconds, using a CBV increase of 50% to 100%, was computed at CPP of 20 mm Hg, which equals the highest CBV and a CBF of 32% of normal. Further decline in CBF, associated with a decrease in CBV at more severe CPP reductions, returned T2 toward the baseline value. At 1.5 T, T2 was slightly elevated as a response to increased CBV in the autoregulation range of CPP. Increased OER caused a maximal T2 decrease by 3 milliseconds, and this level was maintained despite CBV changes on a severe CPP drop. In hypoperfusion, T2 was relatively insensitive to the degree of CBV change at 1.5 T, thus making estimation of OER from T2, in this respect, more accessible at 1.5 T than at 4.7 T.
Simulated T2 relaxation time as a function of reduced cerebral perfusion pressure (CPP). The T2 is calculated for 4.7 T
The effects of altered Hct and precapillary oxygen loss were evaluated by assuming a linear change of these parameters as a function of CPP between 0 and 60 mm Hg, as indicated in Fig. 4. At 4.7 T, influence of these parameters is less than 0.5 milliseconds, whereas at 1.5 T they appear to have more pronounced effects on relaxation, thus complicating attempts to quantify OER from cerebral T2 in hypoperfusion.
Simulated T2 relaxation time as a function of reduced cerebral perfusion pressure (CPP). The T2 is calculated for 4.7 T
Experimental hypoperfusion
The blood gases, pH, mean arterial blood pressure, and the core temperature remained within normal physiologic range during the experiments (Table 1).
Physiologic parameters before and during occlusions
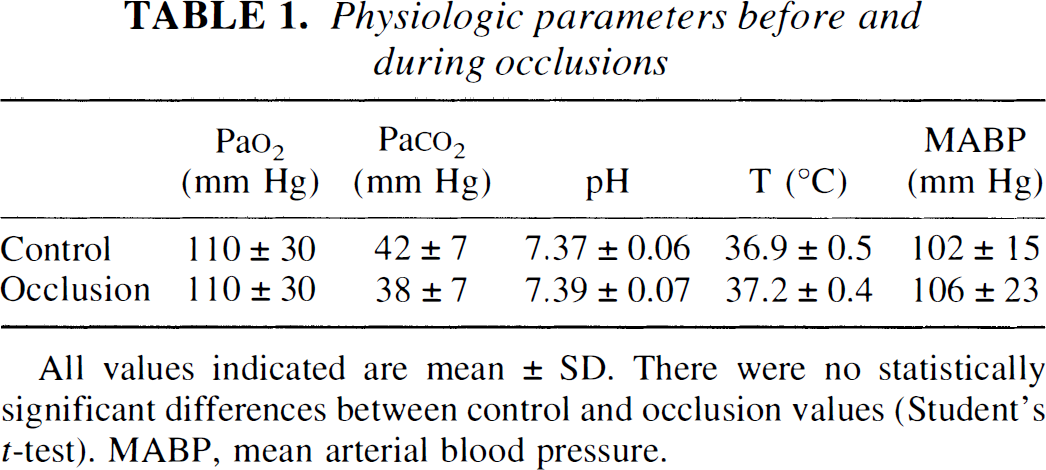
All values indicated are mean ± SD. There were no statistically significant differences between control and occlusion values (Student's t-test). MABP, mean arterial blood pressure.
We analyzed both Dav and T2 from the cerebral cortex adjacent to the H2-electrodes. A statistically significant 11% to 17% decrease in Dav from a control value of 0.69 ± 0.03 × 10⁻³ mm2/s was detected when CBF was 16% to 45% of the preocclusion level of 71 ± 30 mL·100 g−1·min−1. This was followed by a steep 26 ± 7% drop of Dav when CBF was reduced to 15% or below the control level (Fig. 5B). Post hoc analysis differentiated three homogeneous subsets of Dav figures corresponding to the CBF ranges of less than 15%, 16% to 65%, and 46% to 100% of the control level. Unlike Dav, T2 already was significantly decreased from control figure of 50.5 ± 1.5 milliseconds, when CBF was reduced to 60% to 75% of control (Fig. 5A). The maximal reduction of T2 by 2.5 to 2.8 milliseconds was determined at CBF values 15% to 60% of normal. Further reduction of CBF was followed by attenuation of T2 response, however. ΔT2 as a function of CBF, calculated for 4.7 T using CBVmax of 200%, constant Hct, and elevated mc as described earlier (Fig. 4E), is overlaid with the experimental ΔT2 data (Fig. 5A). Experimental data were not significantly different from simulated ΔT2 curve (p > 0.10), indicating good agreement with the model.
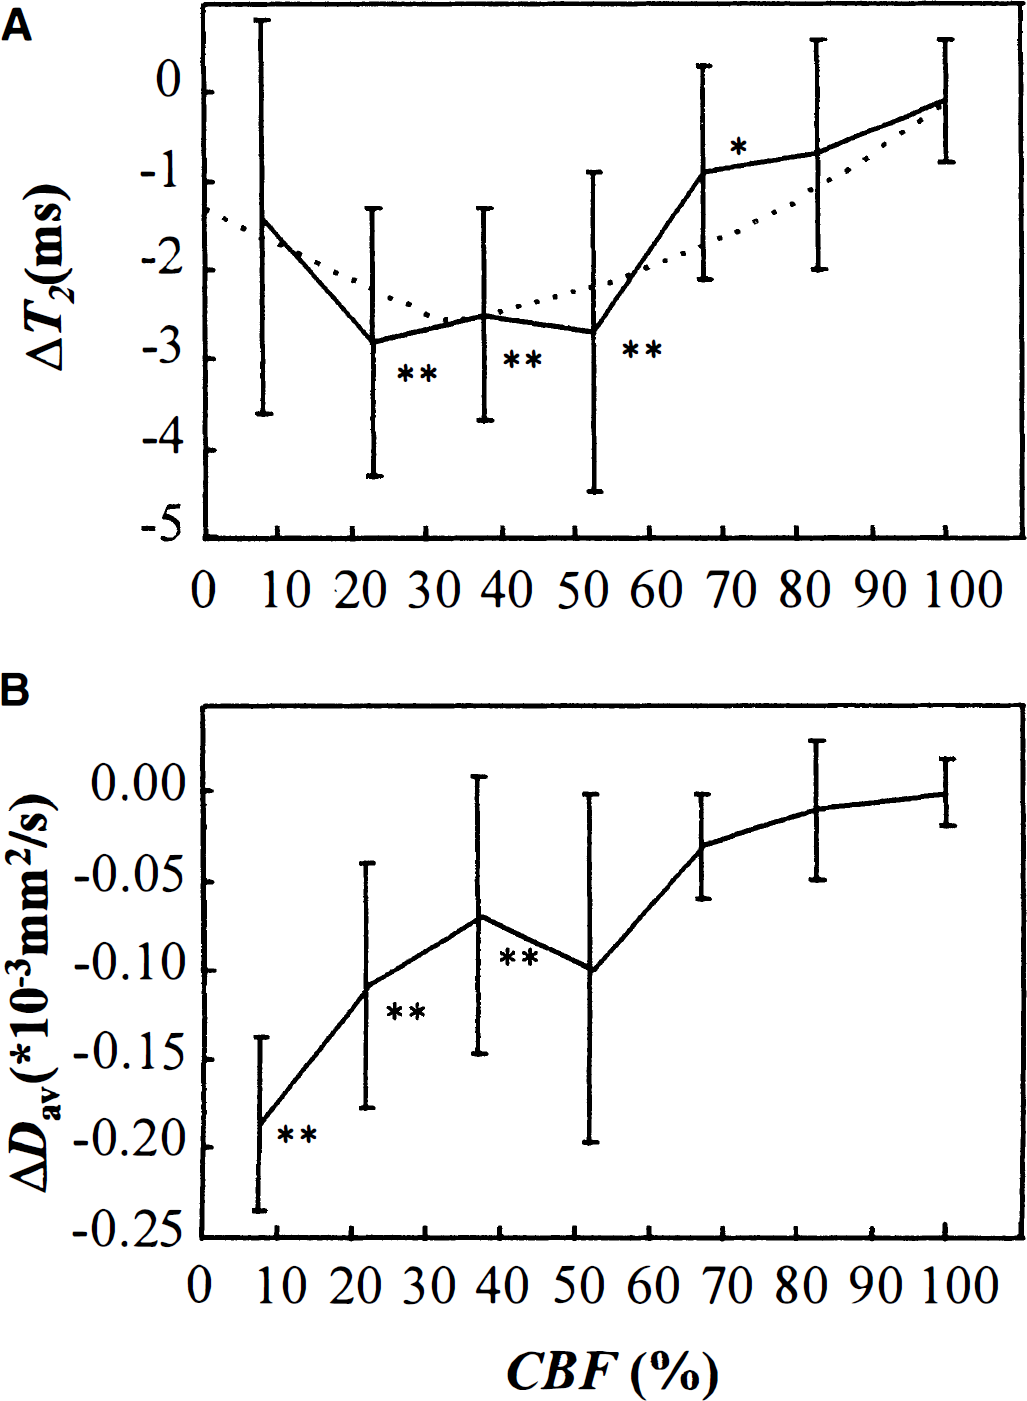
Experimentally determined ΔT2
DISCUSSION
The current data show that mismatch between oxygen consumption and delivery associated with misery perfusion can be imaged by means of single-echo T2 MRI, and the exchange-based SE-BOLD theory can be applied to explain the effects of reduced T2 in quantitative terms by adopting literature data for some of the key physiologic parameters. The experimental T2 data at 4.7 T as a function of CBF show a U-shaped curve with a minimum between 15% and 60% of normal CBF, where T2 was reduced by approximately 2.5 to 2.8 milliseconds relative to the baseline physiologic conditions, which is of the same order of magnitude as earlier measured in rat cortical hypoperfusion model at 4.7 T (Gröhn et al., 1999). The shape of the T2 curve matches relatively well with the calculated T2 graph, taking into account the reported changes in CBV, OER, and mc.
The current experimental MRI approach was designed to contain diffusion as a “reference,” since reports have been published interrelating CBF and diffusion coefficient using independent methods for their measurements. These studies unambiguously show that severe reduction of diffusion takes place at a level of CBF of approximately 20 mL·100 g−1·min−1 (Busza et al., 1992; Kohno et al., 1995). Even if caution must be exercised in comparing data of orientation-dependent diffusion constants with Dav results (Miyabe et al., 1996), we found a consistent CBF threshold for severe collapse of diffusion. Interestingly, we determined a small drop in Dav below CBF 45% of control, which is of the same order of magnitude as reported for diffusion reduction in periphery of ischemic core (Kohno et al., 1995). Statistical analysis revealed three distinct homogeneous subsets of diffusion values on graded hypoperfusion, suggesting that diffusion may drop in two phases along reduced CBF. A quantitative match between data by Kohno et al. (1995) and our CBF thresholds for diffusion changes support the accuracy of the CBF measurements.
The simulated T2 graph using the equations in SE-BOLD theory is solely determined by the physiologic variables chosen. The experimental U-shaped curve of T2/CBF dependency can be reconciled by reported changes of both CMRO2 or CBV. Previous experimental data from rat show that CMRO2 is inhibited below CBF of 35 mL·100 g−1·min−1 (Ferrari et al., 1992). Powers (1991) deduced, using results from human PET studies, that brain oxygen uptake begins to decline below CBF of 30 mL·100 g−1·min−1. The shortest T2 values that we determine occur at CBF range that is close to 30 mL·100 g−1·min−1, and reversal of T2 change could reflect inhibition of CMRO2 at severely compromised substrate delivery. However, the behavior of CBV, as shown in Results, contributes to T2 at much the same CBF range as the inhibition of CMRO2, thus making it impossible to distinguish between the quantitative role of these two factors. Nevertheless, the observed BOLD effect appears at the flow and metabolic conditions where tissue exhibits viability.
Whereas many of the parameters mentioned earlier, such as T2,tissue, can be assumed to be unaltered after a few minutes of moderate hypoperfusion, this is not true after blood-brain barrier breakdown, which is known to occur several hours after ischemia (van Bruggen et al., 1994). Increased permeability of the cerebral vessels may enhance the exchange between microvessels and tissue, collapsing the validity of Eq. 6 and leading to a situation of fast or intermediate exchange. Notice that after 1 to 2 hours of ischemia, Vd and R2,tissue dramatically change, thus making the relative small reduction in R2,blood to go undetected unless other contributing parameters are determined independently. Edema has been shown to develop earliest after 30 minutes of CBF dropping below the threshold of the ischemic energy failure and only after extended periods on graded ischemia in baboons (Bell et al., 1985). Thus, we are confident that Eq. 6 holds for the conditions under which our measurements were performed.
The theory treats SE-BOLD as an intravascular phenomenon, and because no alterations in vascular permeability or erythrocyte viability occur in graded hypoperfusion experiments, SE-BOLD is expected to remain an intravascular phenomenon in the experimental data set. The constants for susceptibilities and relaxation parameters were determined from experimental data of other groups. Theory assumes the exchange of water between erythrocyte and plasma as the main mechanism of transferring relaxation effects by deoxyhemoglobin. However, other mechanisms, such as diffusion through field gradients, may operate at high fields (Thulborn et al., 1982; Ogawa et al., 1993).
Implications to imaging of misery perfusion in clinical settings
The current data show that the absolute T2 and diffusion images data exhibit distinct CBF thresholds, thus indicating different pathophysiologic events of early reduction of blood flow. Because oxygen metabolism is a mandatory requirement for generation of deoxyhemoglobin, a drop in T2 is regarded as an index of misery perfusion and tissue “viability” whereas a diffusion drop is associated with ischemic energy failure. Such information is expected to be of great clinical impact and would give complementary information to that of perfusion-diffusion mismatch (Sorensen et al., 1996; Baird, et al., 1998). Our simulations suggest that reduction of T2 also is detectable at 1.5 T during acute reduction of CBF. Misery perfusion has been found up to 2 to 4 days after the onset of stroke (Wise et al., 1983; Sette et al., 1989; Derdeyn et al., 1998), and it fulfills many of the signs associated with definitions of penumbral tissue (Astrup et al., 1981; Hossmann, 1994; Ginsberg and Pulsinelli, 1994). These areas can be salvaged with reperfusion within 6 hours (Young et al., 1996) but often progress into infarction without treatment (Wise et al., 1983; Pappata et al., 1993; Furlan et al., 1996). One of the greatest challenges in imaging of cerebral compromised perfusion and ischemia is to identify tissue at risk of infarction so that the possible intervention can be proceeded. In principle, this can be achieved by detecting compromised hemodynamic status of the tissue and by revealing the metabolic activity in the tissue which more directly indicates the viability of the tissue.
Studies using PET suggest that CBF and CBV alone are not sufficient to predict tissue viability, since they indirectly probe tissue status and lack temporal dimension of misery perfusion (Heiss and Podreka, 1993). These studies conclude that tissue outcome can be different at similar perfusion status (Heiss et al., 1992; Heiss and Podreka, 1993; Hossmann, 1994; Furlan et al., 1996). Studies on acute ischemic stroke (Frackowiak, 1985), carotid stenosis (Grubb et al., 1998), and on experimental acute middle cerebral artery occlusion (Young et al., 1996; Heiss et al., 1997) indicate that elevated OER may be an indicator of tissue outcome. It has been shown in a cat model that CMRO2 proceeds at control level despite reduction of CBF by more than 60% because of maximized OER (Heiss et al., 1997). In this study, it also was shown that the prognosis of middle cerebral artery occlusion largely followed the behavior of OER during the first hour of the insult. In cats with persistently elevated OER, the death toll was much lower than in those with unaffected or reduced OER, and smaller infarcts were detected in the animals with increased OER and low flow than in those with normal or low OER under compromised CBF (Heiss et al., 1997). An infarction is associated with a fall in CMRO2 and a subsequent decline in OER indicates poor prognosis (Wise et al., 1983). The current study raises the possibility of using single SE-MRI to image viable oxygen-using tissue and of using T2 and diffusion data to assess tissue status and viability in the previously suggested manner (Gröhn et al., 1998). We emphasize that absolute single SE-T2 images are to be used to this end, since the changes are only 5% of the baseline T2 and would go undetected in T2-weighted images. Furthermore, our observations are eligible for acute CBF reduction only, since time-dependent phenomena may change the pattern of cerebral adaptations (Hossmann, 1994).
Footnotes
Abbreviations used
Acknowledgements
The authors thank Dr. Kari Mauranen for advice in statistical analysis, and Mrs. Kati Holopainen and Ms. Niina Kuhmonen for expert technical assistance.