
Abstract
It is thought that gray and white matter (GM and WM) have different perfusion and diffusion thresholds for cerebral infarction in humans. We sought to determine these thresholds with voxel-by-voxel, tissue-specific analysis of coregistered acute and follow-up magnetic resonance (MR) perfusion- and diffusion-weighted imaging. Quantitative cerebral blood flow (CBF), cerebral blood volume (CBV), mean transit time (MTT), and apparent diffusion coefficient (ADC) maps were analyzed from nine acute stroke patients (imaging acquired within 6 h of onset). The average values of each measure were calculated for GM and WM in normally perfused tissue, the region of recovered tissue and in the final infarct. Perfusion and diffusion thresholds for infarction were determined on a patient-by-patient basis in GM and WM separately by selecting thresholds with equal sensitivities and specificities. Gray matter has higher thresholds for infarction than WM (P<0.009) for CBF (20.0 mL/100 g min in GM and 12.3 mL/100 g min in WM), CBV (2.4 mL/100 g in GM and 1.7 mL/100 g in WM), and ADC (786 × 10−6 mm2/s in GM and 708 × 10−6 mm2/s in WM). The MTT threshold for infarction in GM is lower (P = 0.014) than for WM (6.8 secs in GM and 7.1 secs in WM). A single common threshold applied to both tissues overestimates tissue at risk in WM and underestimates tissue at risk in GM. This study suggests that tissue-specific analysis of perfusion and diffusion imaging is required to accurately predict tissue at risk of infarction in acute ischemic stroke.
Keywords
Introduction
One goal of imaging the brain during the acute phase of ischemic stroke is to determine tissue at risk of infarction. It is thought that potentially salvageable tissue (the ischemic penumbra) (Astrup et al, 1981; Warach, 2003) may be identified with magnetic resonance (MR) perfusion- and diffusion-weighted imaging (PWI and DWI) (Barber et al, 1998; Warach, 2003). Many studies have sought to determine MR-imaging-derived perfusion and diffusion markers that can be used to distinguish among the core infarct, penumbra, and benign oligemia (Butcher et al, 2003; Grandin et al, 2002; Oppenheim et al, 2001; Schaefer et al, 2003). Others have attempted to combine PWI- and DWI-derived measures to produce predictive models of stroke outcome (Rose et al, 2001; Wu et al, 2001).
One limitation common to all of these studies is the failure to account for possible differences in perfusion and diffusion thresholds between gray and white matter (GM and WM). Differences in perfusion between healthy GM and WM are well documented. Compared with WM, GM has higher cerebral blood flow (CBF), higher cerebral blood volume (CBV), and shorter mean transit time (MTT) (Helenius et al, 2003). Therefore, it is suspected that the two different tissues may be susceptible to infarction at different levels of reduced perfusion. Indeed, both animal and human studies indicate that GM is more vulnerable to ischemia than WM (Falcao et al, 2004; Jones et al, 1981; Marcoux et al, 1982). In addition, GM has a higher apparent diffusion coefficient (ADC) in humans in both normal (Helenius et al, 2002) and ischemic (Mukherjee et al, 2000) tissue. The aim of the present study is to determine if GM and WM of acute stroke patients have different perfusion and diffusion thresholds for infarction. We also assess the effect of applying a single common threshold to predict tissue outcome in GM and WM separately.
Patients and methods
Patients
Patients presenting with stroke between December 2002 and August 2003 were prospectively examined for inclusion in this study based on the following selection criteria: (1) MR imaging within 6 h of symptom onset; (2) acute lesion visible on DWI and a perfusion deficit visible on the MTT map; (3) follow-up imaging acquired 30 days after onset; (4) all imaging of good quality with minimal motion artifact; and (5) follow-up lesion volume of at least 1 mL in both GM and WM within the perfusion deficit (to provide enough voxels to make calculations at a sufficient level of precision for the subsequent analysis). The local institutional ethics review board approved this study and informed consent was obtained from all patients.
Magnetic Resonance Imaging
Both acute (within 6 h of onset) and follow-up MR imaging (30 days) were performed at 3 T (Signa, General Electric Medical Systems, Waukesha, WI, USA). Acute imaging included DWI (isotropic b = 0 and 1,000 secs/mm2, TR = 7,000 ms, TE = 96.5 ms), PWI (TR = 2,250, 1,750 or 1,850 ms; TE = 40, 45 or 45 ms, respectively; flip angle = 45°; 26, 51 or 42 repetitions, respectively), and inversion recovery spin-echo EPI (IRSEPI, TR= 12,000 ms, TE = 17.4 ms, TI = 400 ms) to provide GM/WM contrast. Apparent diffusion coefficient maps were calculated from the DWI with General Electric's FuncTool. Different PWI sequences were used because of optimization during the course of the study and correspond to the acquisition of 19, 10, and 12 slices, respectively. All images were acquired with a 320-mm field of view with 5.0 mm slice thickness and 2.0 mm gap. The images were reconstructed to dimensions of 256 × 256 voxels. The superior 12 slices (10 for one patient) of each contrast, all with the same orientation and from the same location within each patient, were analyzed in this study.
Follow-up imaging included DWI (same as baseline) and a fluid attenuated inversion recovery (FLAIR) sequence (TR = 9002 ms, TE = 161 ms, TI = 2,250 ms, NEX = 0.5) acquired with a 240-mm field of view and otherwise same dimensions as the other contrasts. Follow-up MR angiography was also acquired to assess recanalization.
Image Processing
All images were coregistered to the acute PWI. The DWI, ADC, and IRSEPI images were coregistered using a rigid-body transformation (Hartkens et al, 2002; Jenkinson and Smith, 2001). Follow-up FLAIR images were coregistered with a combination of an affine transformation and a nonrigid deformation (Hartkens et al, 2002) to match the geometrically distorted EPI images. We created quantitative CBF, CBV, and MTT maps from the PWI using computer-assisted selection of the arterial input function (AIF) (Lu et al, 2003) and singular value decomposition to deconvolve the AIF from the tissue concentration curves (Ostergaard et al, 1996).
We applied anisotropic diffusion filtering (Black et al, 1998) to the baseline IRSEPI image and subsequently segmented this into GM, WM, and cerebrospinal fluid (CSF) using a k-means algorithm (Cardenas et al, 2001). The resulting segmented tissues were then stored as masks that could be overlaid on the other coregistered MR data sets to allow tissue-specific analysis. Next, we used a computer-assisted, multispectral classification and segmentation algorithm to segment the acute and follow-up lesions from the coregistered DWI, ADC, and FLAIR images (Mitchell et al, 1994). This algorithm has been utilized for a variety of segmentation tasks over the last decade and has been validated for segmentation of multiple sclerosis and ischemic stroke lesions in MR data sets (Mitchell et al, 2002).
A brain mask was manually outlined for each patient to exclude regions distorted by susceptibility artifact. Finally, an MTT mask was manually outlined on the MTT maps and included the largest extent of visible MTT abnormality. Manual outlining avoided problems associated with thresholding (differences between patients, high MTT in WM, noise, etc.). Superposition of all masks defined three regions for further study: (1) final infarct—voxels inside the MTT mask that were also within the follow-up lesion mask; (2) recovered tissue—voxels inside the MTT mask but outside the follow-up lesion mask; and (3) normal brain—voxels inside the brain mask, but outside the MTT mask and acute and follow-up lesion masks. The coregistered and segmented IRSEPI image was then used to exclude all CSF voxels from analysis and to further subdivide the three regions into GM and WM. Thus, a total of six regions-of-interest (ROIs) were studied (GM and WM in final infarct, recovered tissue, and normal brain).
Analysis of Perfusion and Diffusion Values
For each patient, the median CBF, CBV, MTT, and ADC values were calculated in each of the six ROIs. The mean and standard deviations of these median values were then calculated across all patients. A threshold analysis was then performed for GM and WM separately on all voxels within each patient's MTT mask (including recovered tissue and final infarct). Four distinct series of thresholds were adjusted and applied iteratively to each of the four MR-derived parameters (CBF, CBV, MTT, and ADC). At each iteration, voxels with values on one side of the threshold (below for CBF, CBV, and ADC; above for MTT) were labeled as ‘infarct voxels’, while those voxels with values on the other side of the threshold were labeled as ‘noninfarct voxels’. Comparison with the coregistered and segmented follow-up lesion mask (the ‘truth’) allowed voxel-based calculation of the sensitivity and specificity of each threshold value for each MR-derived parameter (Metz, 1978). A representative threshold for each MR-derived parameter was then selected for each patient where sensitivity equaled specificity. This point, referred to as the equal sensitivity and specificity threshold (ESST), was selected because it weighs false-positive and false-negative errors equally and is not affected by the prevalence of infarct voxels within the MTT mask.
The threshold analysis described above was repeated for all voxels within each patient's MTT mask with no distinction between GM and WM. For each patient, the common ESST values from the combined analyses of each MR-derived parameter were applied separately to GM and WM. The resulting sensitivities and specificities obtained from applying the common ESSTs to each tissue were then assessed on a patient-by-patient basis.
Statistical Analysis
As an exploratory analysis, the median values of each measure from the recovered tissue and final infarct regions were tested for differences between GM and WM using a two-way repeated measures analysis of variance. Two-way analysis of variance is robust to deviations from normality and equality of variance, particularly if the sample sizes in the groups are similar. The two factors were: (1) tissue type (GM or WM); and (2) ROI (recovered tissue or final infarct). The primary analysis of this study tested for differences in ESST values between GM and WM for each measure using paired t-tests. Nonparametric tests were also performed and similar results were obtained. A P-value less than 0.05 was considered significant in all cases.
Results
Nine patients (five men, four women) met the inclusion criteria for this study out of a total of 111 patients with stroke or transient ischemic attack that were imaged within the study period. Of the 111 patients, 46 exhibited a lesion on acute DWI and PWI scans. Of these, 20 were scanned within 6 h of onset, 17 of which had follow-up imaging. Inversion recovery spin-echo EPI was not acquired from six of these remaining patients (initially inclusion of this research imaging was at the discretion of the neuroradiologist and technician performing the scans). One patient was excluded because of poor image quality and another was excluded because the follow-up lesion volume was less than 1 mL in both GM and WM within the perfusion deficit.
The median age of the patients was 66 years (interquartile range: 55 to 76 years). The median National Institutes of Health Stroke Scale score on initial presentation was 6 (interquartile range 2 to 7) and the median score at 30-day follow-up was 0 (interquartile range 0 to 2). Five of the patients received tissue plasminogen activator (tPA) and five recanalized by 30-day follow-up (three of which received tPA). Occluded vessels included the main stem (two patients) and branches (six patients) of the middle cerebral artery and the internal carotid artery (three patients). The median time to the initial MR scan was 4 h and 48 mins (interquartile range 164 to 352 mins). The average perfusion and diffusion values in normal tissue, recovered tissue and final infarct are presented for GM and WM separately in Table 1. One patient included in the study had a severely stenosed internal carotid artery and exhibited abnormally high CBV and MTT values in all regions. Across all patients, the recovered tissue consisted of a median volume of 41 mL (interquartile range 27 to 63 mL) of GM and 24 mL (interquartile range 15 to 38 mL) of WM. The final infarct had a median of 3.0 mL (interquartile range 1.6 to 5.0 mL) of GM and 3.0 mL (interquartile range 1.9 to 5.6 mL) of WM.
Average perfusion and diffusion values in GM and WM
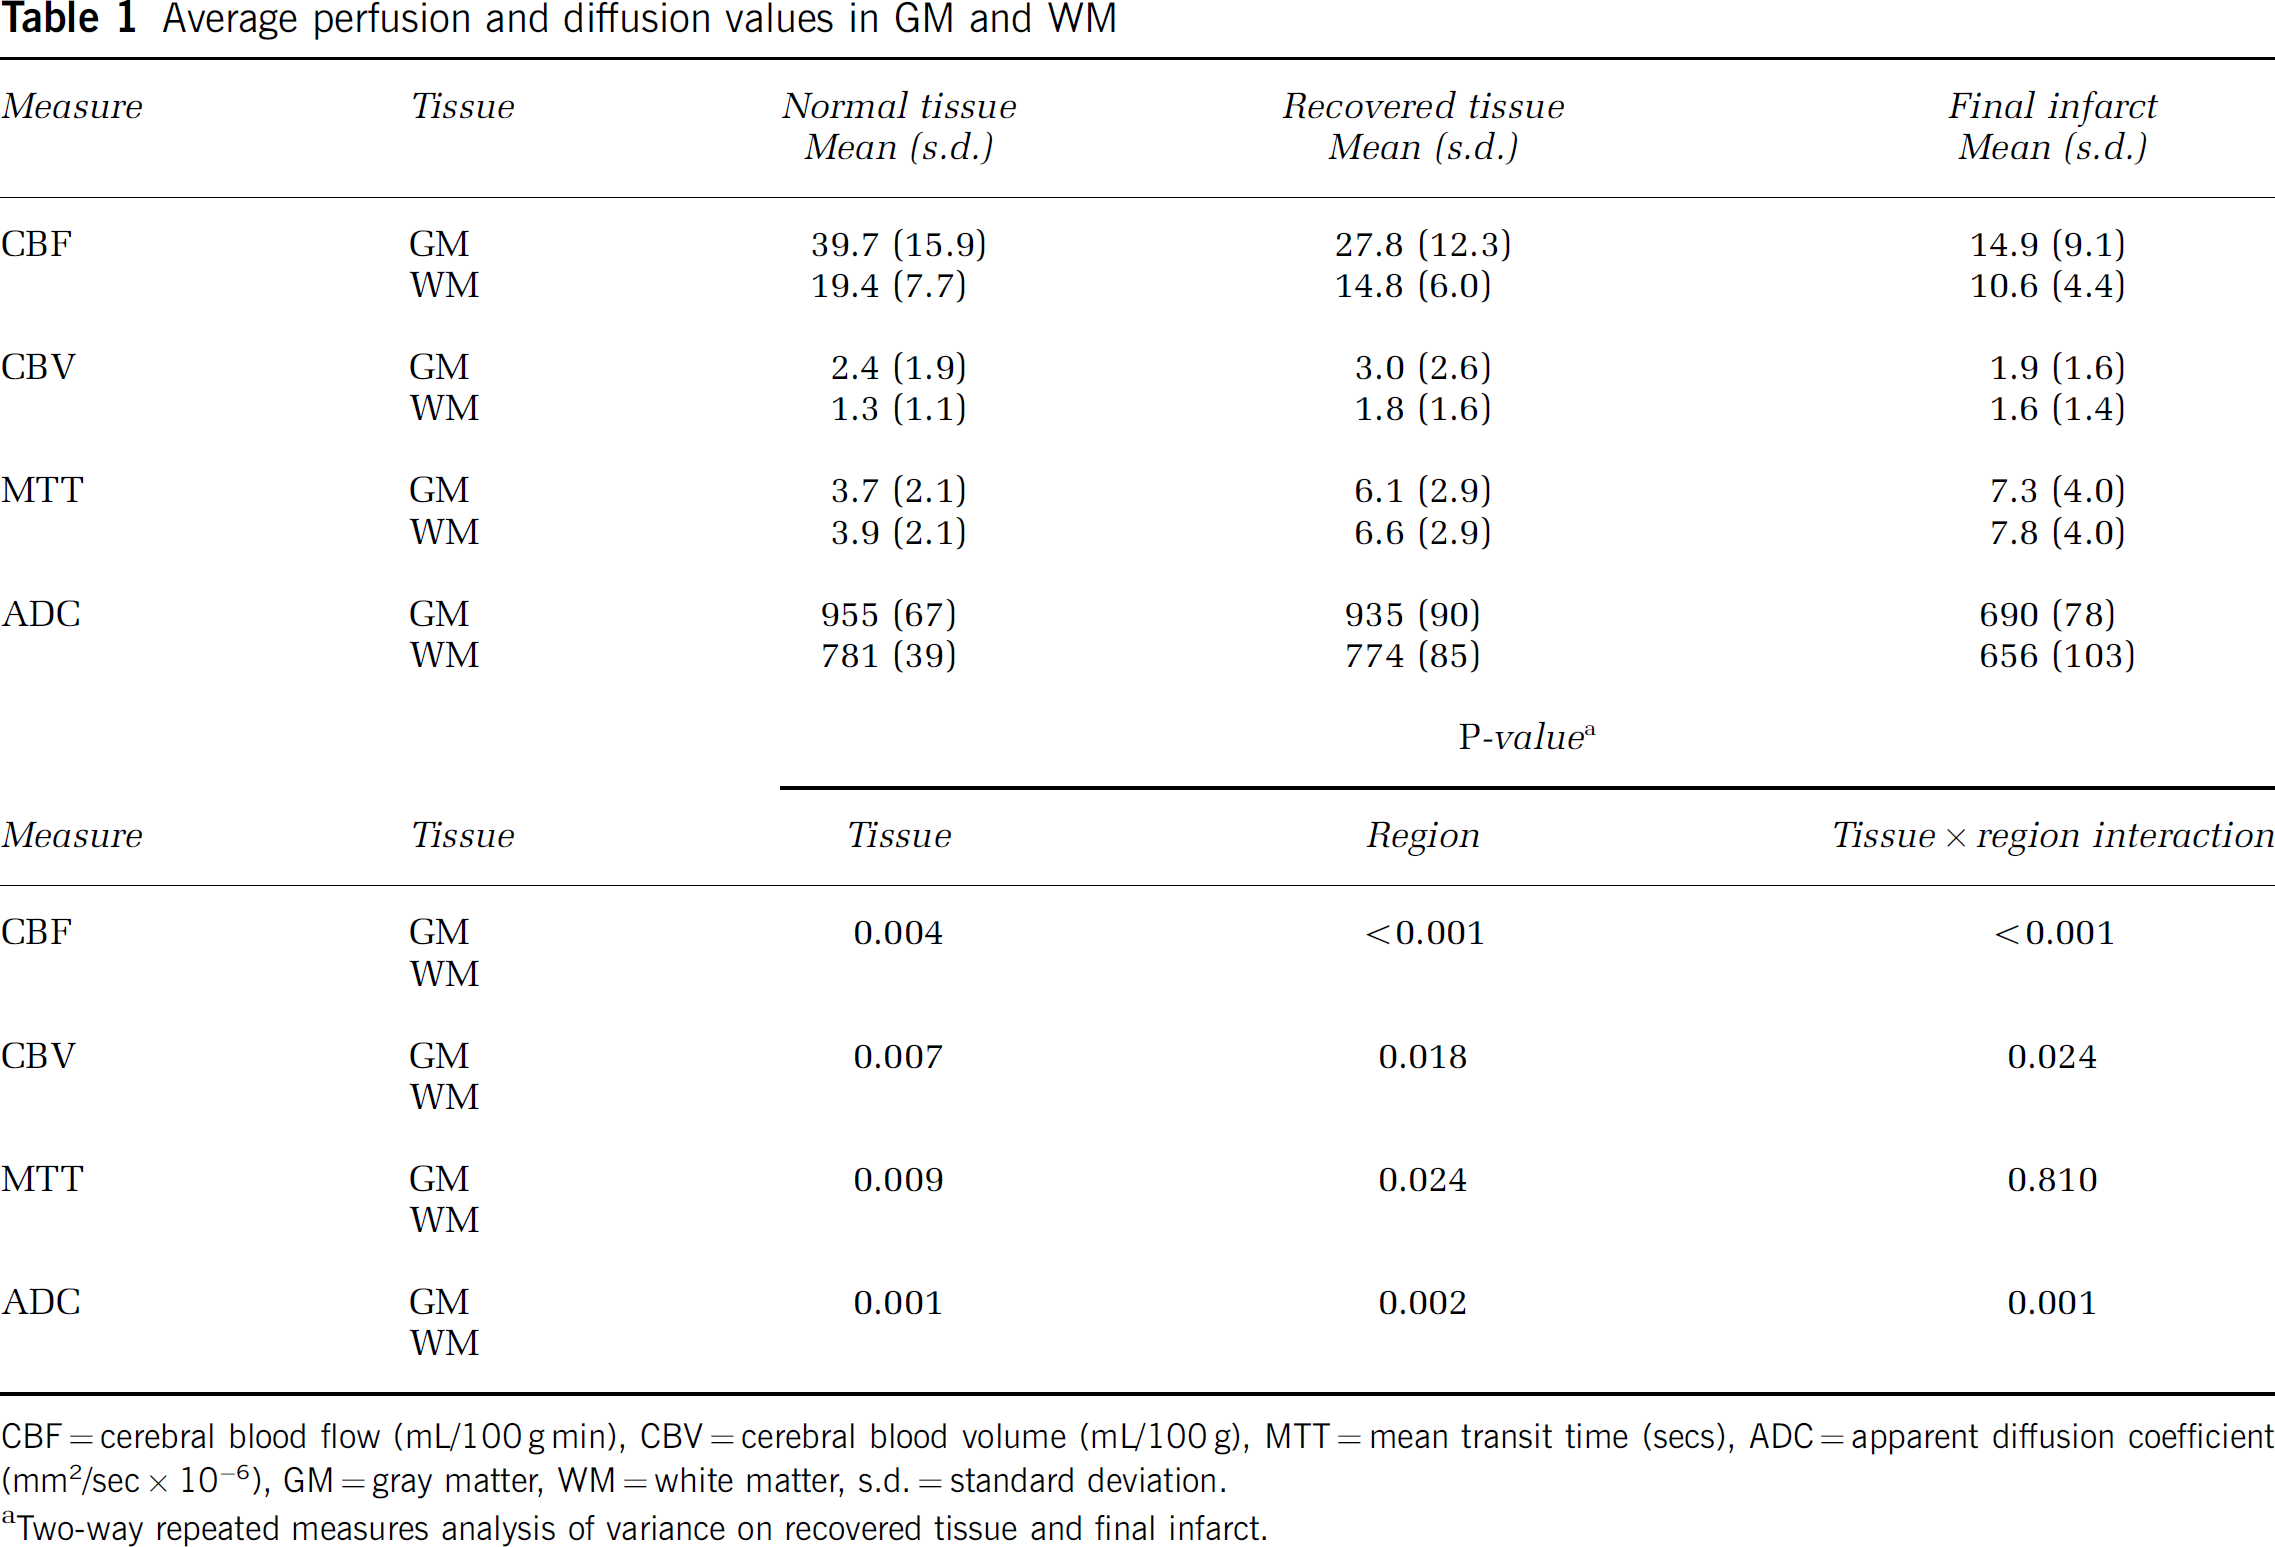
CBF = cerebral blood flow (mL/100 g min), CBV = cerebral blood volume (mL/100 g), MTT = mean transit time (secs), ADC = apparent diffusion coefficient (mm2/sec × 10−6), GM = gray matter, WM = white matter, s.d. = standard deviation.
Two-way repeated measures analysis of variance on recovered tissue and final infarct.
Mean GM and WM values were significantly different for all measures, as were mean values between recovered and infarct regions. Tests of interaction were also statistically significant indicating that the difference between tissues was region-dependent. Significant interactions were found for all measures except MTT.
The mean ESST values for each MR measure in GM and WM are presented in Table 2. Every mean ESST value was between the average values of the final infarct and the recovered tissue regions (Table 1) for each measure. Differences in mean ESST values between GM and WM were significant for all measures. The mean accuracy (equal to sensitivity and specificity), positive predictive value, and negative predictive value of each mean ESST value are also given in Table 2.
Mean GM and WM threshold values for each perfusion and diffusion measure
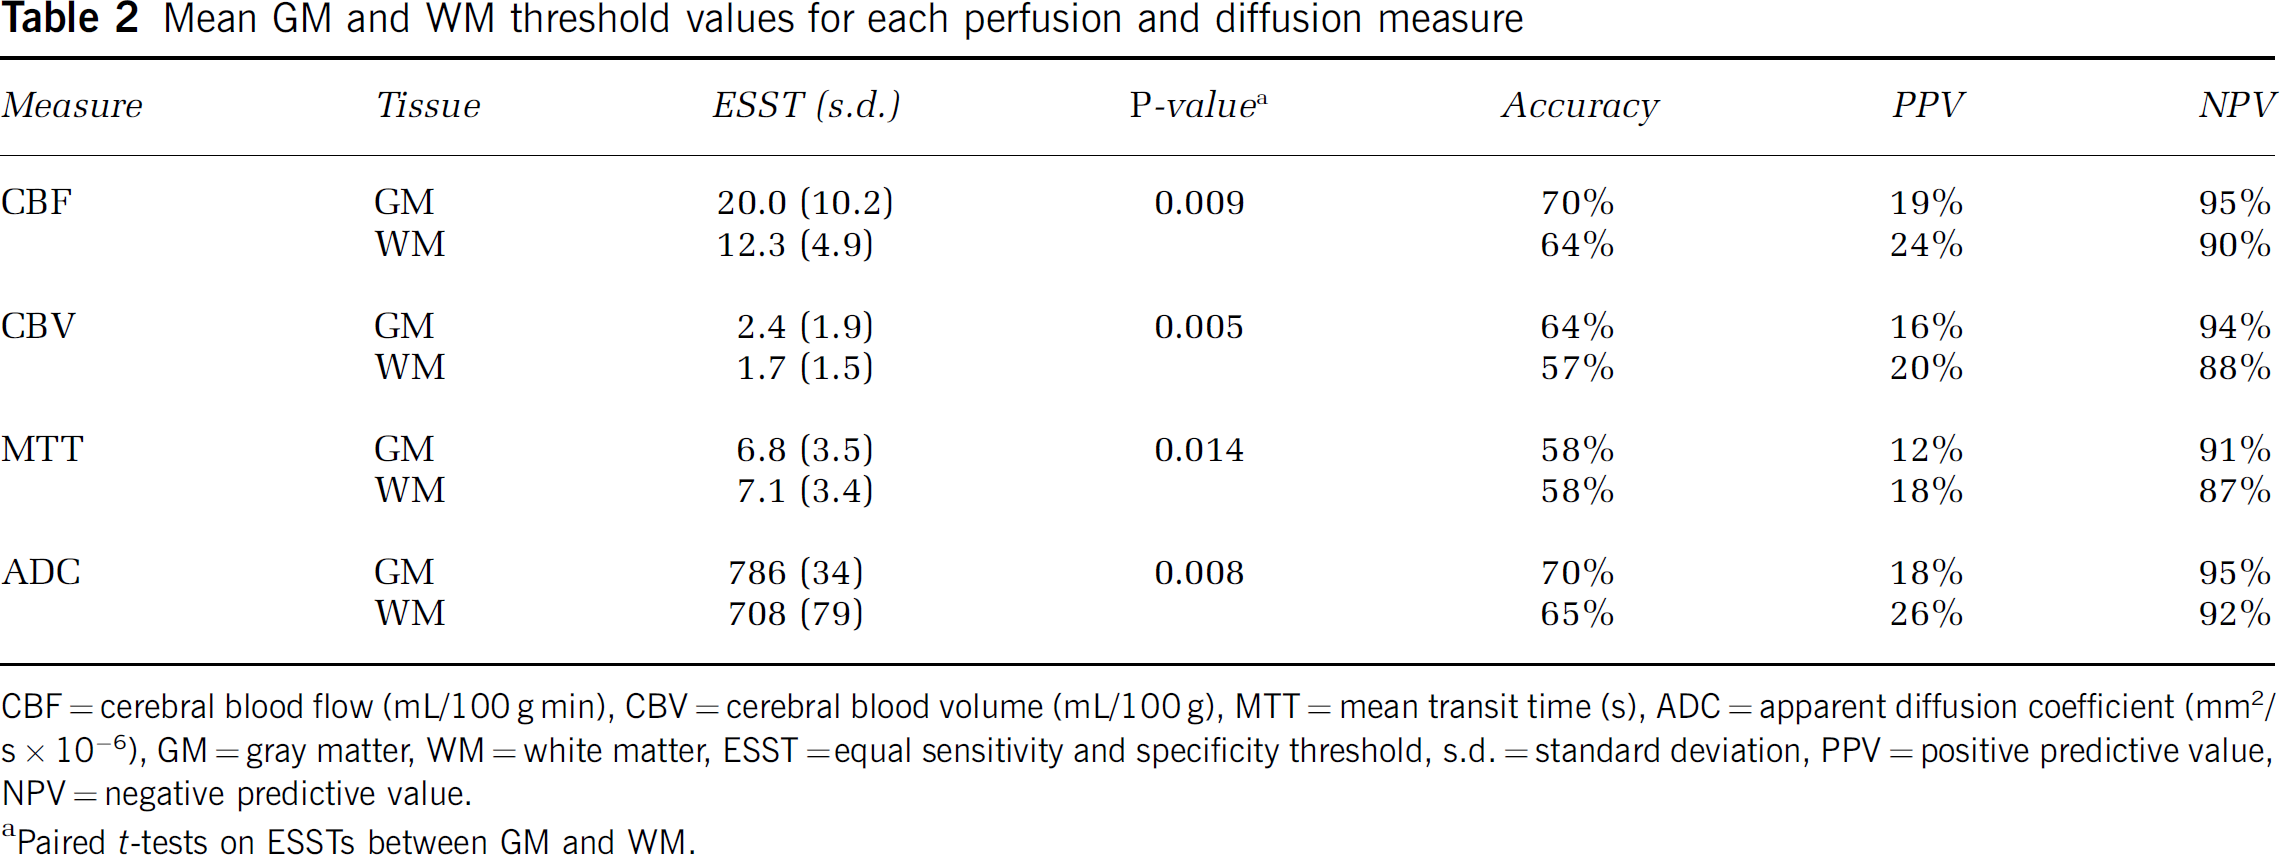
CBF = cerebral blood flow (mL/100 g min), CBV = cerebral blood volume (mL/100 g), MTT = mean transit time (s), ADC = apparent diffusion coefficient (mm2/s × 10−6), GM = gray matter, WM = white matter, ESST =equal sensitivity and specificity threshold, s.d. = standard deviation, PPV = positive predictive value, NPV = negative predictive value.
Paired t-tests on ESSTs between GM and WM.
Figure 1 shows the effect of using a common CBF threshold to predict infarction in GM and WM separately. The average curves in Figure 1A were obtained by performing the threshold analysis on all voxels within the MTT mask of each patient for GM and WM combined. Figure 1B shows the resulting curves for GM and WM separately. The combined ESST value (Figure 1A) overestimates tissue at risk in WM (low specificity) and underestimates the tissue at risk in GM (low sensitivity), compared with separate ESST values for these tissues. Figure 2 compares voxels predicted to infarct using common and separate GM and WM ESST values of CBF. Table 3 presents the mean common ESST values from the combined analysis and the corresponding mean sensitivities and specificities (equal). Also shown are the mean sensitivities and specificities that result from applying each patient's common ESST value to GM and WM separately. In each case, GM at risk is underestimated (low sensitivity) by the common ESST compared with WM, which is overestimated (low specificity).
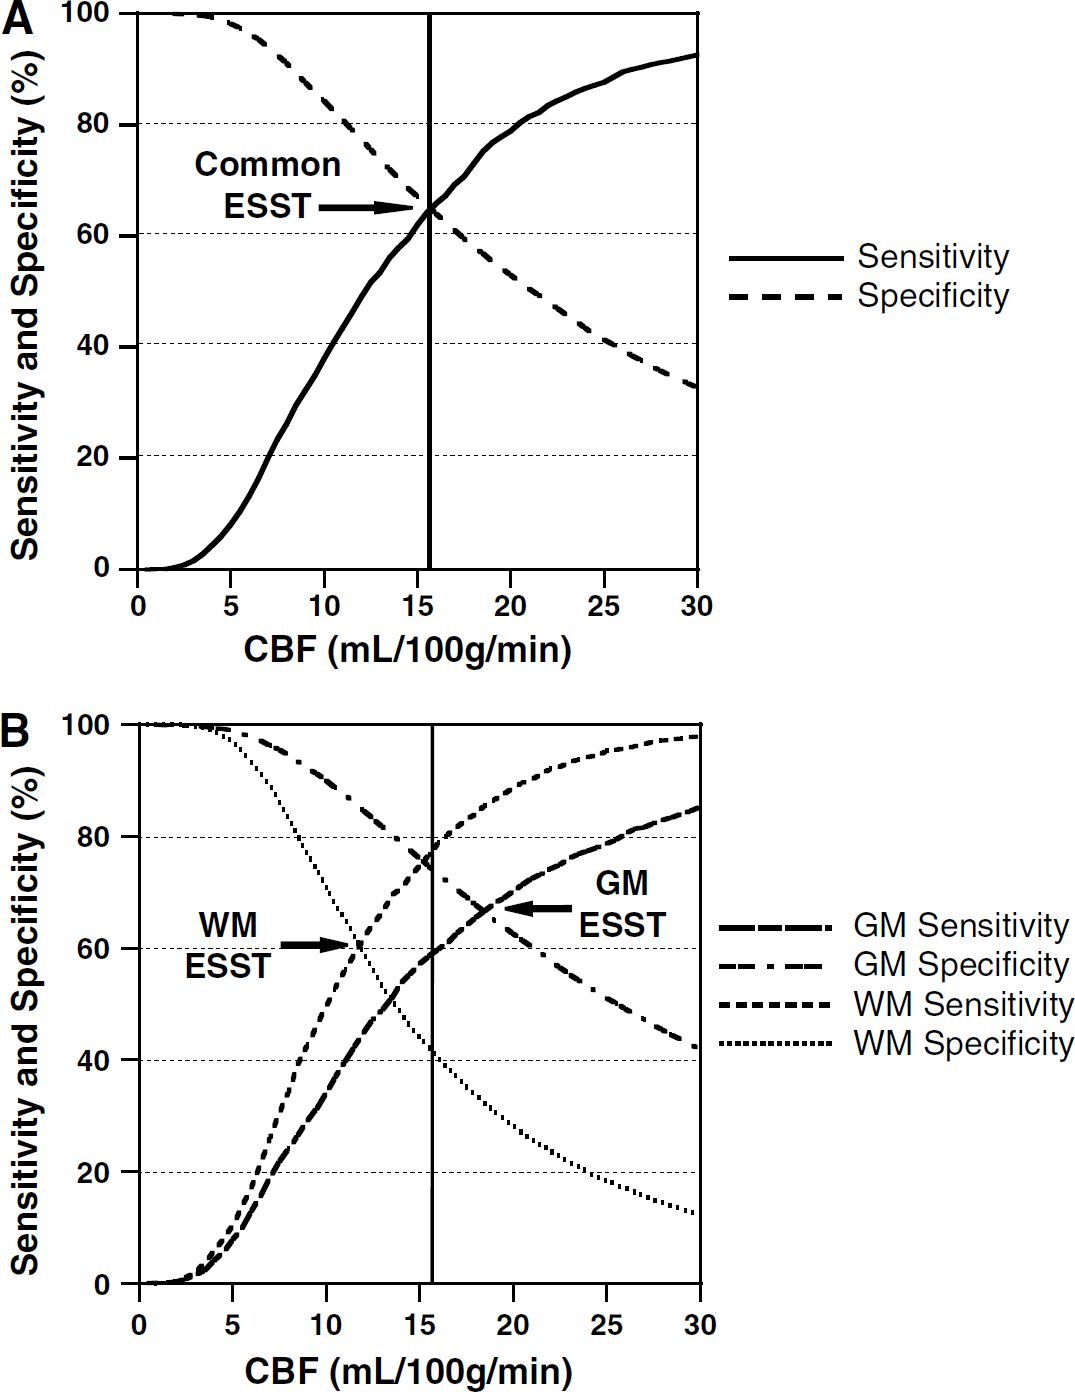
Effect of common CBF threshold from combined analysis (
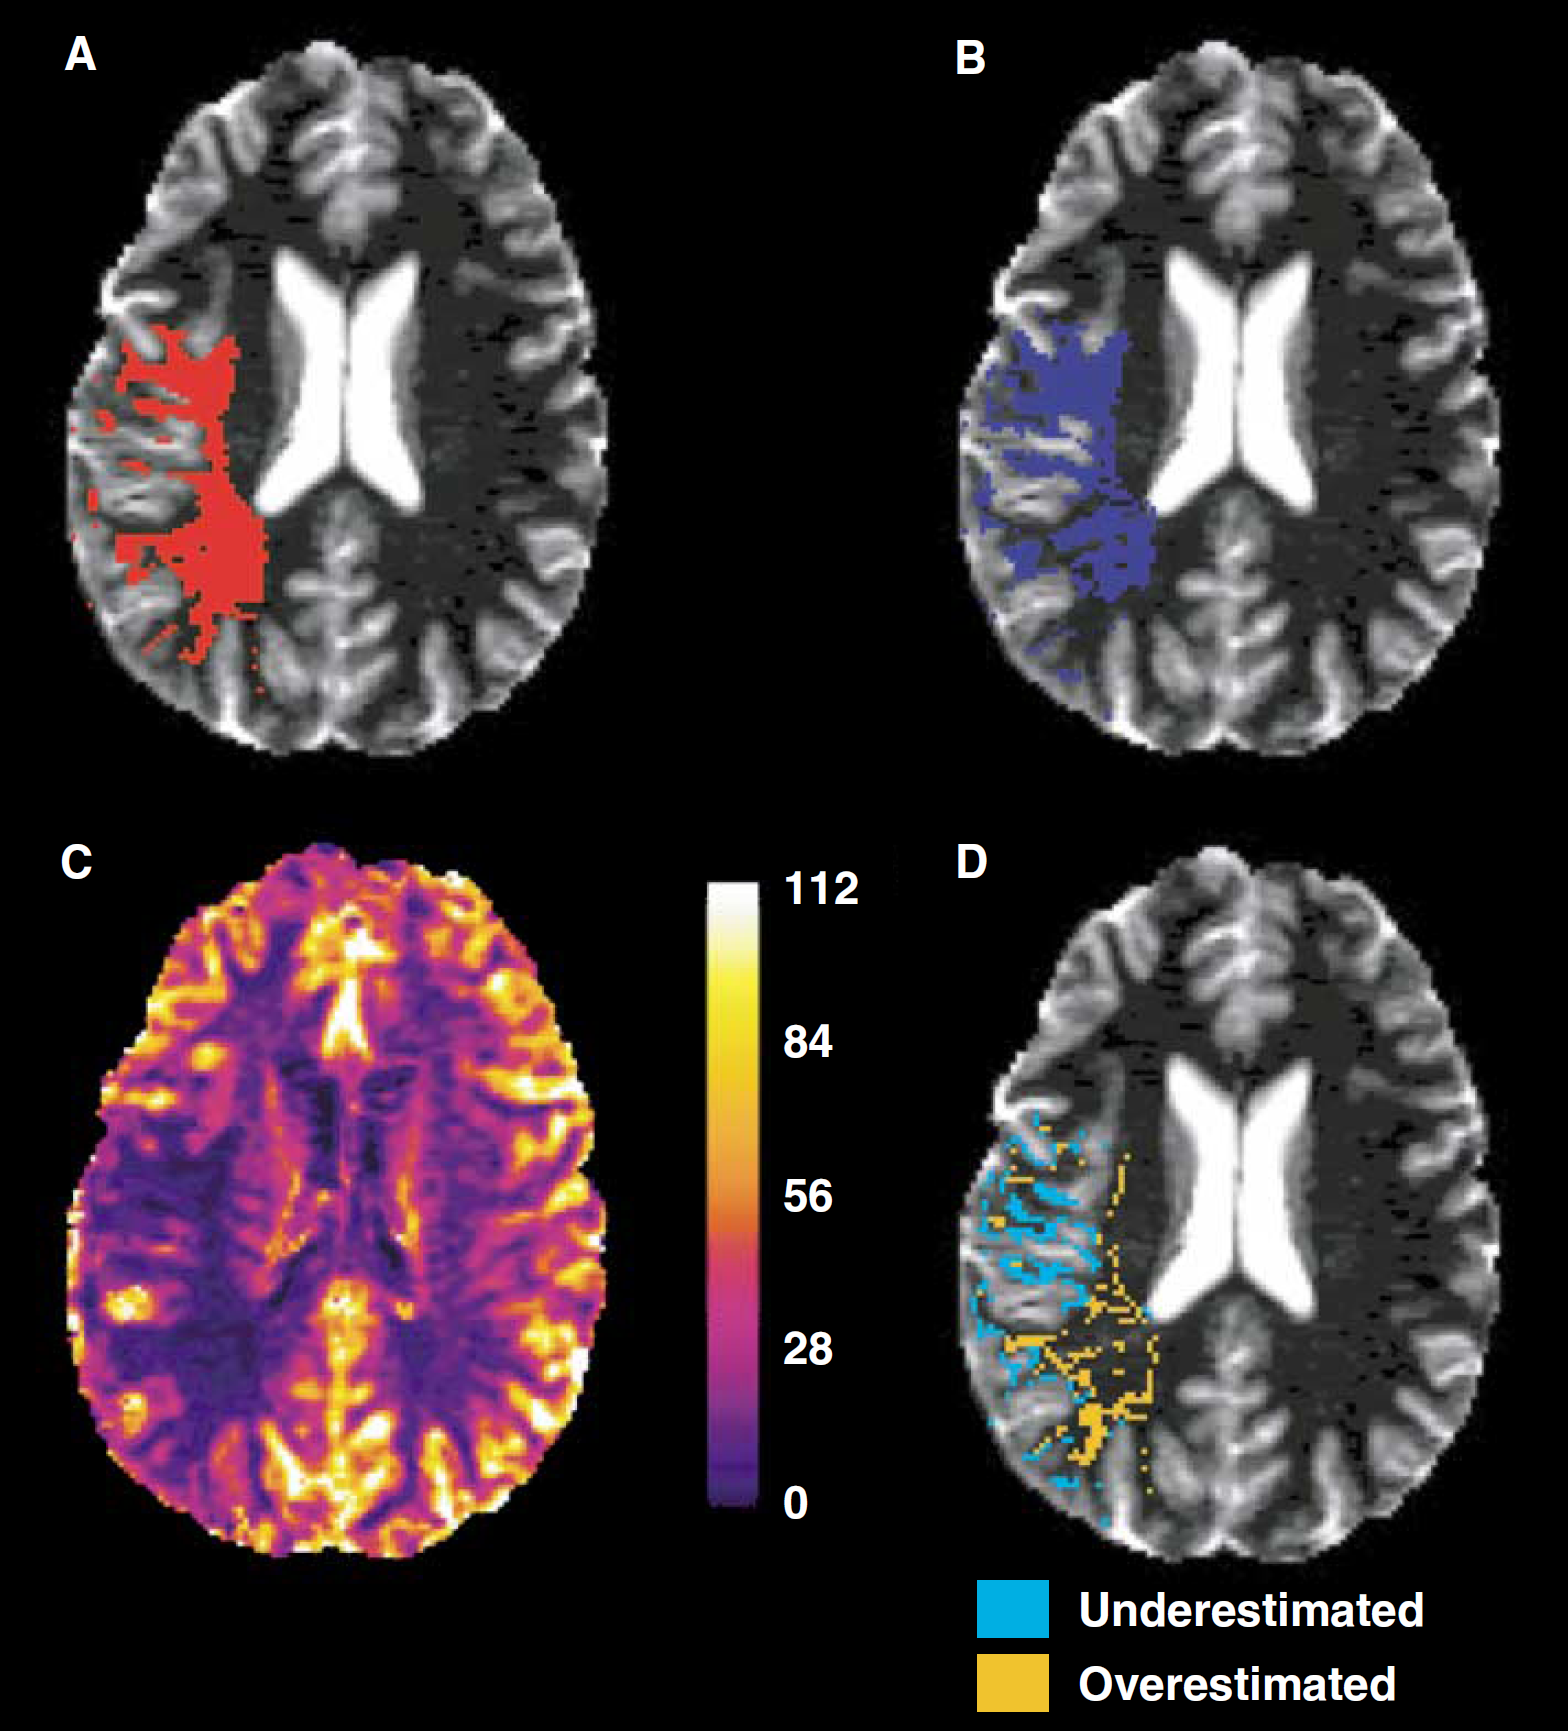
Example of applying common, red in (
Effect of common thresholds from combined analyses on sensitivities and specificities in GM and WM
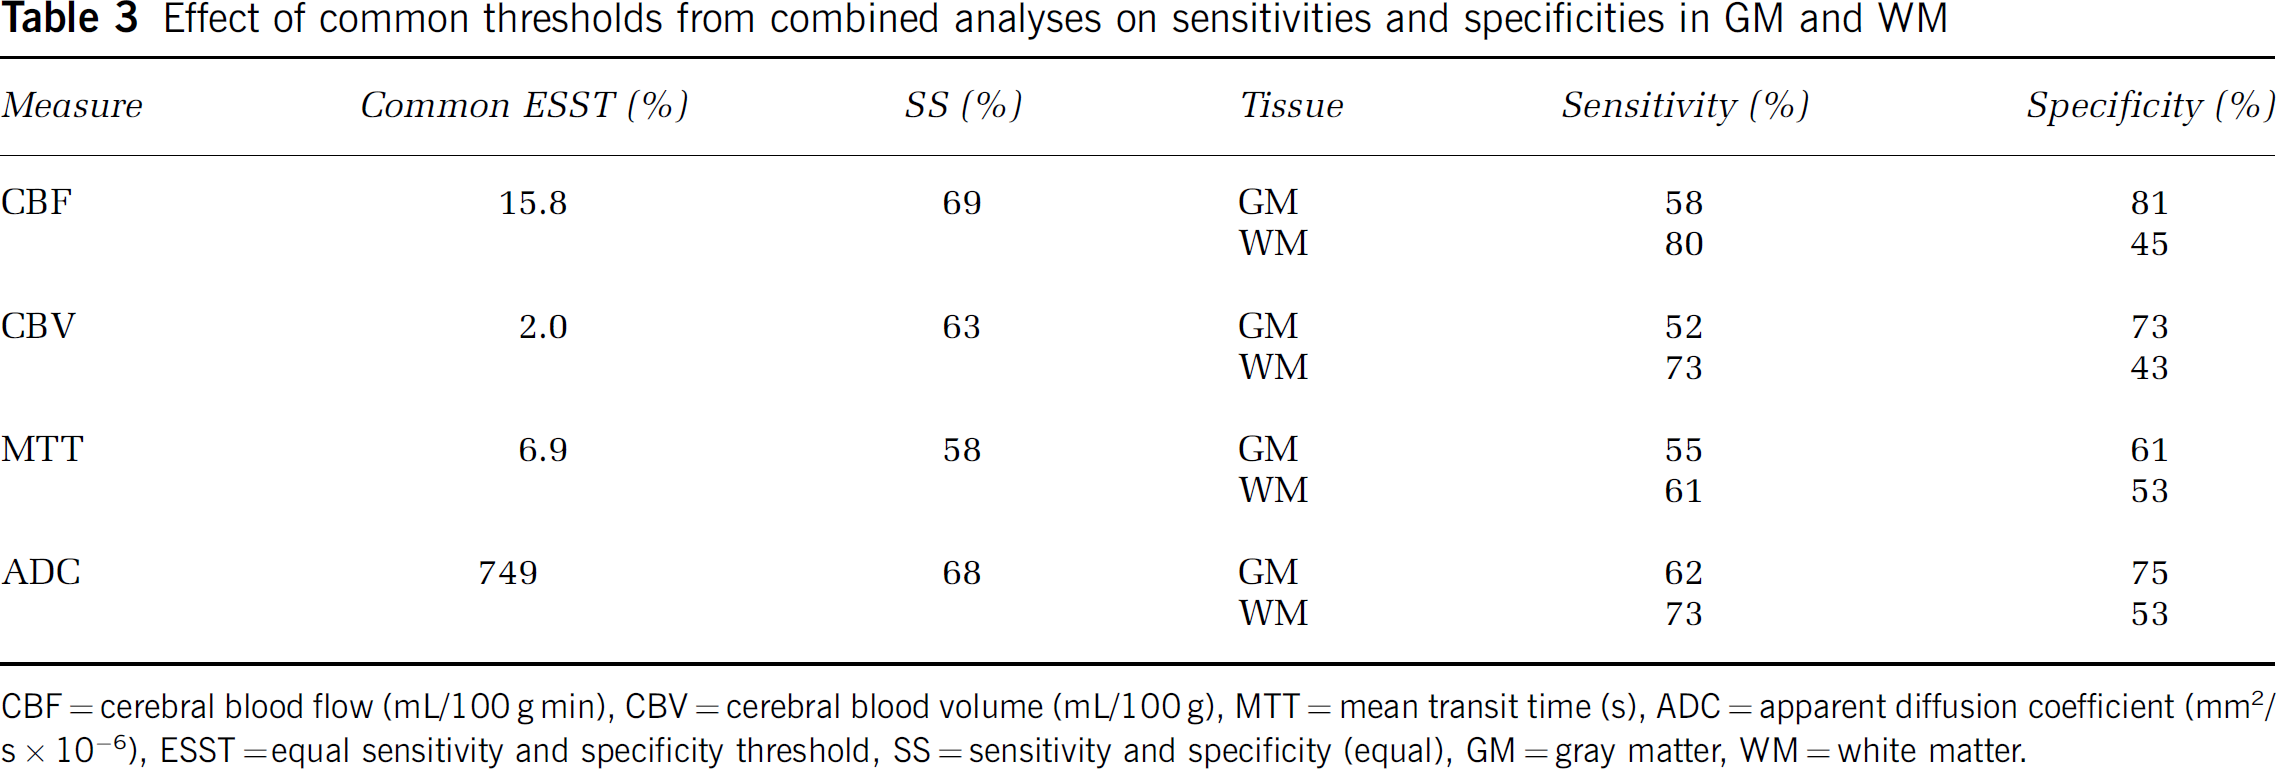
CBF = cerebral blood flow (mL/100 g min), CBV = cerebral blood volume (mL/100 g), MTT = mean transit time (s), ADC = apparent diffusion coefficient (mm2/s × 10−6), ESST =equal sensitivity and specificity threshold, SS = sensitivity and specificity (equal), GM = gray matter, WM = white matter.
Discussion
This study shows that GM and WM in humans have significantly different perfusion and diffusion thresholds for infarction in acute ischemic stroke. Gray matter is at risk of infarction at higher CBF, CBV, and ADC values than WM, and at a shorter MTT. Gray matter, therefore, is more vulnerable to ischemia. This has been anticipated because animal experiments reported similar findings in the early 1980s (Jones et al, 1981; Marcoux et al, 1982). Recently, a study based on positron emission tomography has confirmed that WM is more resistant to ischemia than GM in subacute stroke patients (Falcao et al, 2004). These results have important implications in the challenging task of stroke outcome prediction and penumbra identification.
A common observation in acute ischemic stroke studies is that perfusion and diffusion values in infarct and recovered tissue overlap. For example, there are regions of tissue with low CBF that do not proceed to infarction while some regions with higher CBF do (Butcher et al, 2003; Furlan et al, 1996; Schaefer et al, 2003). This can partially be explained by differences in infarction thresholds for GM and WM. In this study GM that proceeded to infarction had average CBF (14.9 mL/100 g min) and CBV (1.9 mL/100 g) similar to WM that recovered (14.8 mL/100 g min and 1.8 mL/100 g, respectively). Analyzing the GM and WM tissues separately may reduce the overlap of perfusion and diffusion values observed in reversibly and irreversibly damaged ischemic tissue.
The perfusion ESST values reported here, although quantitative, do not necessarily represent absolute thresholds. Known discrepancies exist between MR-derived and the more reproducible (Carroll et al, 2002) and absolute PET-derived perfusion measurements. Variability of the perfusion measurements may have been caused by the different PWI sequence parameters and, more importantly, partial volume effects of AIF selection and deconvolution. However, a critical threshold of 12 mL/100 g min is regarded as being optimal for distinguishing salvageable tissue from infarct tissue within 3 h of stroke onset, and likely increases with time (Baron, 2001). This threshold corresponds well to our common ESST value of 15.8 mL/100 g min, derived from a mixture of GM and WM, within 6 h of stroke onset.
There has been much discussion in the literature about the meaning of increased CBV (Butcher et al, 2003; Rose et al, 2001; Schaefer et al, 2003). Our results suggest that in GM, increased CBV acutely corresponds to recovered tissue at day-30, and decreased CBV acutely corresponds to infarct at day-30. In WM the meaning is less clear with CBV in both the recovered tissue and final infarct regions having increased CBV compared with normal WM.
This study included a small number of patients, which reflects the difficulties of recruiting, consenting and imaging sick stroke patients to research studies. However, the patients included in this study are probably representative of those patients for which MR imaging may ultimately be used to guide treatment decisions. We included both reperfused and nonreperfused patients in our analysis because reperfusion was assessed only at 30-day follow-up imaging and we did not have the acute or subacute reperfusion status to allow for comparison between these groups. Of the 5 patients who reperfused, 3 exhibited marked clinical improvement (reduction of NIHSS score of 4 or more points) at 24 h. Although this roughly correlates with early reperfusion, 2 of the 4 patients who did not reperfuse also had marked clinical improvement at 24 h. We made the assumption that differences between GM and WM infarction thresholds would exist regardless of time to reperfusion. Besides reperfusion status, the possibility that further vessel occlusion and infarction occurred cannot be ruled out and must also be considered as a limitation of this study, although no patients had marked clinical deterioration at 24 h or by follow-up imaging.
Ultimately, there are two ischemic thresholds of interest in acute ischemic stroke. The threshold that distinguishes the penumbra from benign oligemia may be used to determine tissue at risk of infarction if reperfusion is not achieved. The threshold that distinguishes the core infarct from the penumbra may be used to determine tissue that may be salvaged if reperfusion is achieved. The penumbral tissue between these upper and lower thresholds is the target of thrombolysis therapy (Kidwell et al, 2003). These thresholds must be determined in two subsets of patients, those who do not reperfuse and those who experience early reperfusion. Lacking such ideal patient data, we could not determine these two thresholds. The tissue-specific thresholds reported in this study, therefore, are between the two thresholds described above. Future studies should determine the upper and lower thresholds of the penumbra and assess differences in these thresholds between GM and WM. The lower threshold between the core infarct and the penumbra increases with time from onset and the rate of increase may be tissue-specific because WM is more resistant to ischemia than GM (Falcao et al, 2004; Marcoux et al, 1982).
Noise and partial-volume effects in the IRSEPI images along with errors in registration and segmentation may cause errors in GM and WM identification. The IRSEPI sequence added approximately 60 secs to our imaging protocol. Additional scan time could reduce noise and/or partial-volume effects in these images. More sophisticated nonlinear registration algorithms could be used to align the acute scans. Also, the k-means algorithm performs a ‘hard’ classification assigning each voxel to only one tissue. More sophisticated ‘fuzzy’ classification algorithms could be used to estimate the proportion of GM and WM in each voxel, reducing the impact of partial-volume effects.
Finally, this study has showed different perfusion and diffusion infarction thresholds for GM and WM in acute ischemic stroke. Tissue-specific analysis appears to improve the prediction of tissue at risk in both GM and WM. This kind of analysis should contribute significantly in extending notions of penumbra identification beyond the simple perfusion—diffusion mismatch model (Kidwell et al, 2003). Ultimately, it may aid construction of more sophisticated models that combine many MR-derived parameters to improve the accuracy and reliability of tissue outcome prediction.
Footnotes
Acknowledgements
The authors acknowledge the help of the staff of the VISION study, the Calgary Stroke Program, the Seaman Family MR Research Centre, and the patients who participated in this project. The IRSEPI sequence was designed by M Louis Lauzon, PhD (Seaman Family MR Research Centre). The algorithm used to perform the perfusion calculations was contributed by Hong Lu, MSc (Seaman Family MR Research Centre). The k-means algorithm was contributed by José V Manjón, MSc (Department of Bioengineering, Electronics and Telemedicine, Universidad Politécnica de Valencia, Valencia, Spain). Brian O'Brien and Desirae Stepien provided technical support for this project and Dr Chul-Ho Sohn assessed follow-up recanalization (all from the Seaman Family MR Research Centre). This study was funded by the Canadian Institutes of Health Research (CIHR) and the Heart and Stroke Foundation (HSF) of Alberta, the Northwest Territories, and Nunavut.