
Abstract
Nonischemic brain capillaries show a continuous and heterogeneous plasma perfusion. In the current study, plasma perfusion was investigated in rats during 2 to 168 hours of permanent middle cerebral artery occlusion. Perfused capillaries were detected in brain cryosections by fluorescein isothyocanate (FITC) dextran after 10 minutes of circulation time. Heterogeneity of capillary perfusion was identified by Evans blue (EB), which circulated for 3 seconds. In this setting, the heterogeneity of intracapillary EB concentrations reflects heterogeneities in capillary flow velocities. The CBF was quantified by simultaneous iodo[14C]antipyrine autoradiography. When moving from normal flow to low-flow areas in the ischemic hemisphere, three states of capillary filling could be distinguished: state 1—fast perfusion, filling by FITC dextran and EB (CBF 0.33 mL • g–1 • min–1); state 2—delayed perfusion, only FITC dextran filling (CBF 0.104 mL • g–1 • min–1); state 3—minimal perfusion, no dye filling (CBF 0.056 mL • g–1 • min−1). In tissue of state 1 at the borderline to ischemic tissue, a higher heterogeneity of intracapillary EB concentration (85.7%) was found than in the contralateral nonischemic hemisphere (76.4%) (P < 0.05), indicating a compromised microcirculation. The adjacent ischemic areas were filled by FITC dextran (state 2) 2 to 4 hours after middle cerebral artery occlusion, indicating a maintained, although slow, perfusion at this time. Later, minimal perfused areas (state 3) progressively replaced the delayed perfused areas (state 2). This study shows, for the first time, the evolution of microvascular disturbances in relation to CBF. In the low-flow areas, an early residual plasma perfusion is later followed by a lack of perfusion or minimal perfusion. In areas of higher, although reduced flow at the border between normal and ischemic tissue, an extreme capillary perfusion heterogeneity indicates permanent microcirculatory abnormalities.
Different experimental approaches have shown that under physiologic conditions, all brain capillaries are perfused continuously with plasma (Göbel et al., 1990; Williams et al., 1993). Capillary recruitment (Weiss, 1988) does not contribute to changes of CBF on the microcirculatory level (Göbel et al., 1989). The basis for the adjustment of CBF on the microvascular level appears to be a heterogeneous distribution of capillary transit times of red cells (Villringer et al., 1994) and plasma (Abounader et al., 1995) in the brain. Capillaries are perfused more homogeneously during increases (Abounader et al., 1995; Vogel and Kuschinsky, 1996) as well as during moderate decreases of CBF (Vogel et al., 1996). Under ischemic conditions, swelling of astrocytes and capillary endothelial cells (Garcia et al., 1993, 1994) or a destruction of the microvascular basal lamina (Hamann et al., 1995) occurs during the first hours of ischemia, resulting in capillaries with narrowed or totally occluded lumen. This may result in a decrease of capillary perfusion velocities and later in nonperfused capillaries. However, after short ischemic events such as transient focal ischemia (Li et al., 1998) or incomplete forebrain ischemia (Theilen et al., 1993), only minor capillary perfusion deficits could be found. Whereas perfusion deficits are known to develop in capillaries hours after middle cerebral artery occlusion (MCAO) (Garcia et al., 1994; Zhang et al., 1999), it is not known which values of CBF correspond to different states of capillary filling and which perfusion pattern (homogeneous versus heterogeneous) can be found in the capillaries.
To investigate these questions, two intracapillary perfusion markers were injected at different time points after MCAO in rats. One dye (fluorescein isothyocanate [FITC] dextran) was allowed to circulate for 10 minutes to stain all patent capillaries, including slowly perfused capillaries. Areas not filled 10 minutes after injection of FITC dextran were regarded as lacking or minimal capillary perfusion. The second dye (Evans blue) was used to detect heterogeneities of capillary plasma transit times. To this end, Evans blue was injected intravenously as a bolus while the time course of the arterial dye concentration was recorded continuously as change of blood conductivity induced by the solvent fluid. During the steep increase of the arterial dye concentration (about 3 seconds after intravenous bolus injection), the rats were decapitated. Under these conditions, divergent plasma flow velocities in different capillaries yield divergent intravascular dye concentrations. Therefore, the heterogeneity of the intracapillary dye concentrations represents plasma flow heterogeneity (Abounader et al., 1995). The perfusion patterns obtained by the two dyes in each ischemic brain area were related to the blood flow in the corresponding area by quantitative autoradiography of iodo[14C]antipyrine.
MATERIALS AND METHODS
Surgery
The experiments were performed in 24 adult male Sprague-Dawley rats in accordance with institutional guidelines. The animals were anesthetized by a gas mixture containing 1 % to 1.5% halothane, 70% N2O, with the remainder O2. Body temperature was maintained at 37° to 37.6°C using a temperature-controlled heating pad. Blood flow to the right middle cerebral artery was blocked by an intraluminal nylon thread (diameter 0.15 mm), which was covered with silicone rubber (Provil, Bayer, Leverkusen, Germany) at the end over a length of 10 mm according to the method of Nagasawa and Kogure (1989). The animals selected for survival periods of 24, 48, 96, or 168 hours were allowed to recover from anesthesia with free access to food and water. Before the intraluminal suture was introduced, the rats selected for 2, 4, 6, or 8 hours of MCAO were equipped with catheters inside both femoral veins for the infusion of iodo[14C]antipyrine (Biotrend, Cologne, Germany) and for the bolus injection of FITC dextran (molecular weight 25000 Da; Sigma, Deisenhofen, Germany) and Evans blue (Sigma). In addition, the right femoral artery was cannulated for measuring the blood acid-base status and the arterial input function of iodo[14C]antipyrine. The left femoral artery was cannulated to place an electrode made from a Teflon-coated platinum wire (World Precision Instruments, Berlin, Germany) inside of the thoracic aorta to enable the measurement of blood conductivity after placing a reference electrode inside the rectum (Vogel, 1997). This approach was necessary to safeguard the correct time of decapitation for the measurement of the heterogeneity of plasma transit times at the end of the iodo[14C]antipyrine infusion. The animals that survived for 24 to 168 hours were reanesthetized at the day of the final experiment with a gas mixture containing 1% to 1.5% halothane, 70% N2O, with the remainder O2 and equipped with catheters as described earlier.
General procedure
After surgery, the inhalation anesthesia was withdrawn, and the chloralose (0.05 g/kg)-urethane (0.5 g/kg) mixture was administered intravenously. After a predefined survival (2 to 168 hours) period, 0.4 mL of 5% FITC dextran dissolved in distilled water were injected intravenously. Nine minutes later, 125 μCi per kg body weight iodo[14C]antipyrine (Biotrend, Cologne, Germany) were infused for 1 minute for the measurement of local CBF by the autoradiographic method of Sakurada et al. (1978). Parallel to this, 12 to 16 timed arterial blood samples were taken for the determination of the time course of the arterial iodo[14C]antipyrine concentration. About 20 seconds after the start of the iodo[14C]antipyrine infusion, 0.25 mL of a 5% glucose solution were injected as a bolus. The injection of the 5% glucose solution results in a conductivity dilution curve, which is similar to commonly known indicator dilution curves (Vogel, 1997). The peak deviation of this calibration bolus was stored in the memory of the decapitator unit (homemade).
Seven to five seconds before the end of the infusion period of iodo[14C]antipyrine, 0.3 mL of a solution comprising 2% Evans blue dissolved in 5% glucose were injected as a bolus. Decapitation of the animals with a guillotine driven by compressed air was triggered by the decapitator unit when the deviation of the blood conductivity reached about 40% of the peak deviation of the calibration bolus (Fig. 1). This ensures that decapitation takes place during the phase of increasing arterial Evans blue concentration. Because any aqueous Evans blue solution has a higher conductivity than a 5% glucose solution, identical volumes of the calibration bolus and the Evans blue bolus would result in a lower peak of the Evans blue bolus. Therefore, the surplus of the volume of the Evans blue bolus is necessary to obtain the same peak deviation of blood conductivity compared with the calibration bolus. This volume difference had been determined in preliminary experiments.

(A) Experimental setup for simultaneous measurement of CBF and heterogeneity of capillary transit times. The rat is placed under a guillotine, which is activated by compressed air when the outlet between the pneumatic piston and the pressure source is opened by the decapitator unit.
After decapitation, the brains were removed as quickly as possible and frozen in 2-methylbutane chilled to −60°C. The brains then were embedded in M-1 embedding matrix (Lip-shaw, Detroit, MI, U.S.A.) and cut into 20- or 5-μm coronal sections at −20°C in a cryomicrotome. After drying the 20-μm cryosections on a heating plate at +60°C, one set of the 20-μm sections was exposed with [14C] standards to a Kodak MinRl x-ray film (Kodak, Rochester, NY, U.S.A.) for 21 days. From the optical densities of the autoradiograms, the local CBF was calculated using an image analyzing system (MCID, Imaging Research, Inc., St. Catherines, Ontario, Canada). In the ischemic tissue of the second set of 20-μm sections, three states of capillary filling could be distinguished: state 1—fast perfusion, filling by FITC dextran and Evans blue; state 2—delayed perfusion, filling only by FITC dextran; and state 3—no or minimal perfusion, no filling with dye. The size of these different areas was quantified by marking the borderline using an incident light fluorescent microscope (Zeiss, Oberkochen, Germany) equipped with a computer-controlled stage (Physik Instrumente, Waldbronn, Germany). The contour of these areas was used to measure the CBF in these areas from autoradiograms of adjacent cryosections. Heterogeneity of plasma transit times was determined 2, 4, 8, and 168 hours after onset of MCAO. To this end, Evans blue concentrations were determined in 200 Evans blue-filled capillaries of the 5-μm cryosections as described previously (Abounader et al., 1995). These capillaries were selected along the boundary between tissue containing Evans blue as well as FITC dextran and tissue containing FITC dextran only. Again, the CBF was determined in this area. In addition, the heterogeneity of plasma transit times was measured in 200 Evans blue-filled capillaries of the contralateral side, and the average CBF also was determined (FITC does not interfere with the measurement of the intracapillary Evans blue concentration).
Data analysis
For evaluation of the development of the capillary perfusion deficits in the ischemic tissue, the ratio of the areas that contained no dye (state 3) and those that contained no Evans blue (states 2 and 3) was plotted against the duration of MCAO. This relationship was tested for significance using nonlinear regression analysis.
The CBF values obtained for the three states of capillary filling (1, fast filling; 2, delayed filling; 3, no filling with dye [see the last paragraph]) were compared. The heterogeneity of intracapillary Evans blue concentrations along the boundary between states 1 and 2 was compared with that measured on the contralateral side at each time point after MCAO. In addition, the heterogeneity of plasma transit times in the ischemic and the nonischemic hemisphere was tested with respect to a potential dependency on the duration of MCAO. For all comparisons, a two-tailed, multiple Student's t test with Bonferroni correction was used.
The level of statistical significance was set at P < 0.05.
RESULTS
All physiologic variables measured at different time points after MCAO were within the physiologic ranges, and no major differences could be found between the groups (pooled data obtained from all animals at different periods of MCAO: pH 7.342 ± 0.03, PCO2 46.8 ± 3.9 mm Hg, PO2 83.4 ± 8.2 mm Hg, BE −1.1 ± 1.9 mmol/L, hematocrit 0.47 ± 0.03, mean ± standard error of the mean).
In the ischemic brains, three states of capillary filling could be distinguished: (1) fast perfusion, (2) delayed perfusion, and (3) no or minimal perfusion. These three states are depicted schematically in Fig. 2a. Computerized reconstructions show corresponding brain sections obtained from a rat subjected to 2 hours of MCAO and from another rat subjected to 168 hours of MCAO. To quantify the extent of capillary perfusion deficit, the ratio between areas that contained no dye (state 3) and those containing FITC dextran but no Evans blue (state 2 plus state 3) was calculated for each time point after MCAO. Figure 2B shows the time course of this ratio. After short time periods of ischemia, most capillaries of the areas supplied by the occluded middle cerebral artery contained at least FITC dextran (state 2). Only small unfilled areas (state 3) could be detected 2 to 4 hours after MCAO. This indicates a maintenance of capillary perfusion in the tissue supplied by the middle cerebral artery during the first hours after its occlusion. However, the long circulation time of FITC dextran (circulation time 10 minutes) compared with that of Evans blue (circulation time about 3 seconds) indicates a reduced perfusion velocity in these areas. With increasing duration of MCAO, the percentage of the areas containing no dye (state 3) increased at the cost of areas containing only FITC (state 2). The data shown in Fig. 2B could be fitted best to a logarithmic correlation line. The fact that this correlation approaches unity many days after MCAO indicates that late after MCAO, either state 1 or state 3 can be found, whereas few capillaries remain on state 2. When absolute values of brain areas or volumes were assigned to different states of perfusion, different rats had to be taken at each time after MCAO. The scatter of these areas, however, was too large to yield definite changes of ischemic areas or volumes with the duration of MCAO.
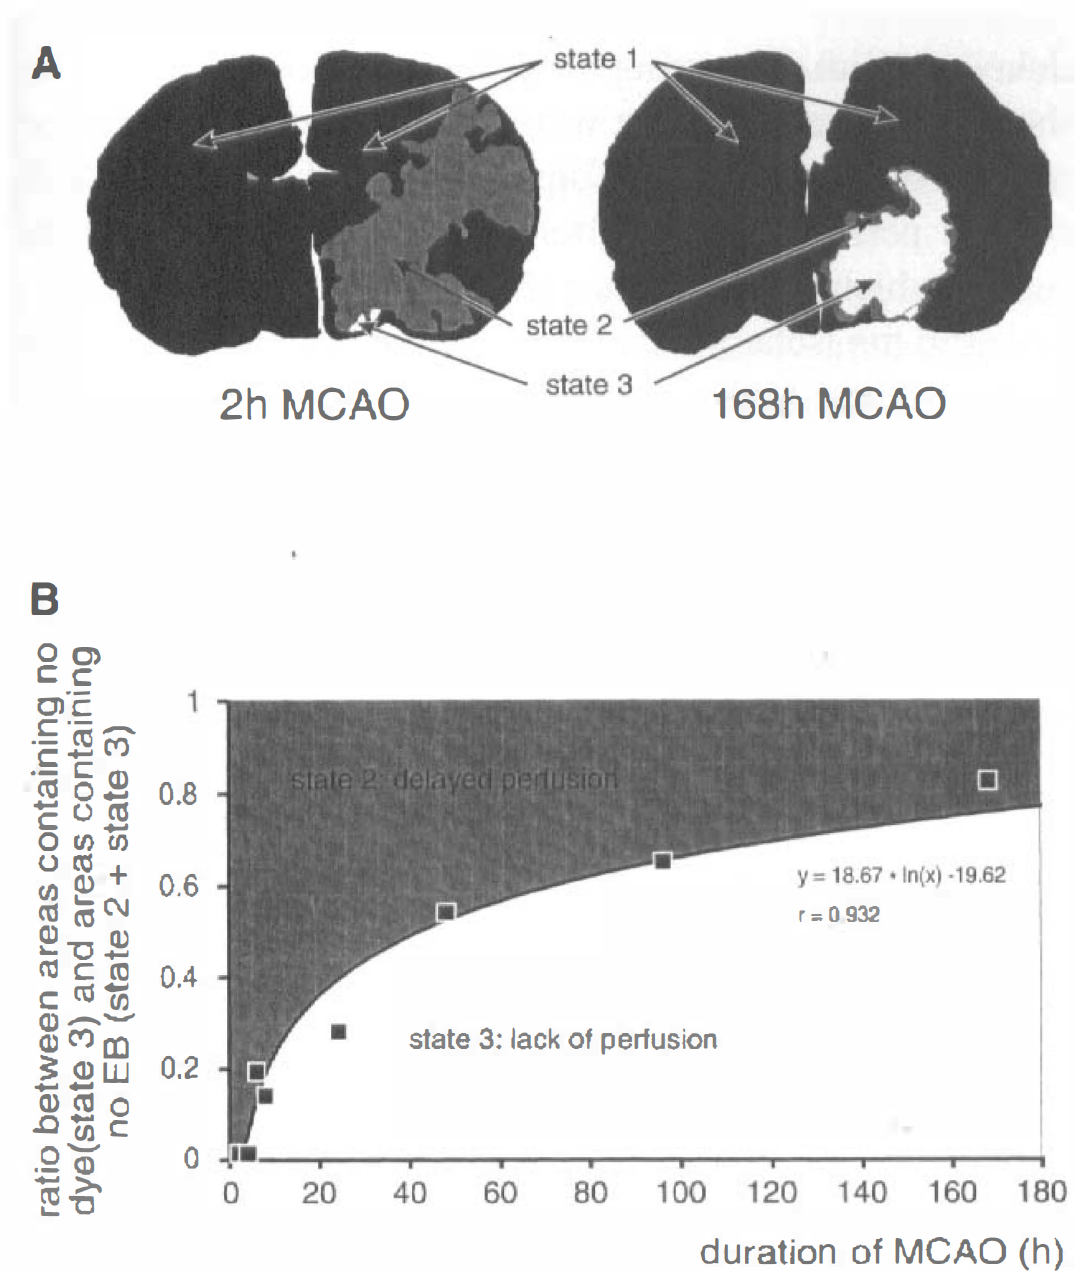
(A) Computerized reconstruction of corresponding brain sections obtained 2 and 168 hours after MCAO from two rats. Areas containing fluorescein isothyocanate (FITC) dextran (circulation time 10 minutes) and Evans blue (circulation time 3 seconds) are black (state 1), areas containing only FITC dextran are gray (state 2), and areas containing no dye are white (state 3).
By the simultaneous infusion of two dyes as capillary perfusion markers and iodo[14C]antipyrine as blood flow marker, it was possible to assign CBF values to the different states of microvascular perfusion. This made it possible to correlate a certain perfusion state of the microcirculation with local CBF measurements. The results are shown in Fig. 3. State 1 includes all tissue of the ischemic hemisphere and of the contralateral hemisphere that was filled by Evans blue and FITC dextran (Fig. 2A). In Fig. 3, CBF of state 1 is shown separately for the ischemic hemisphere, where it was measured in a rim of about 1 mm thickness at the boundary to tissue that lacked Evans blue and for the contralateral nonischemic hemisphere. Although the proportion of the three microvascular states of perfusion changed with the duration of MCAO (Fig. 2B), the CBF in each of these states remained constant. Therefore, the data were pooled for the respective state. The average CBF of the total contralateral (i.e., nonischemic) hemisphere (state 1) was 0.679 mL • g • min. On the ischemic side, CBF at the boundary to the tissue lacking Evans blue (state 1) was 51% lower (0.33 mL • g–1 • min–1) than that of the contralateral hemisphere (P < 0.01). The values of CBF determined in areas that contained either only FITC dextran or lacked any dye were significantly (P < 0.01) lower than the CBF values measured in the contralateral hemisphere or in the rim containing Evans blue at the boundary to tissue lacking Evans blue. Values of CBF measured in areas containing only FITC dextran (0.108 mL • g–1 • min–1, state 2) were not significantly different from those measured in areas containing no dye (0.056 mL • g–1 • min–1, state 3). We tested the heterogeneity of perfusion in the areas of reduced perfusion that were rapidly filled by Evans blue and compared this heterogeneity with that determined in the contralateral nonischemic hemisphere. Changes of the heterogeneity of the microvascular perfusion in relation to CBF provide information about microvascular flow disturbances, as could be shown in previous studies during severe hypocapnia (Ishitsuka et al., 1982; Vogel et al., 1996). Therefore, the heterogeneity of plasma transit times was determined 2, 4, 8, and 168 hours after onset of MCAO in a rim about 1 mm wide containing Evans blue (state 1), which was at the boundary to tissue that lacked Evans blue. The results are shown in Fig. 4. For comparison, the values obtained from the contralateral nonischemic hemisphere (state 1) also are shown. As already described for CBF, the measured heterogeneity of capillary plasma transit times did not change with the duration of MCAO. Therefore, the values of heterogeneity measured at different times after MCAO were pooled for the ipsilateral ischemic and for the contralateral nonischemic hemisphere. The results show a significantly higher heterogeneity of plasma perfusion in the ischemic than in the nonischemic hemisphere.
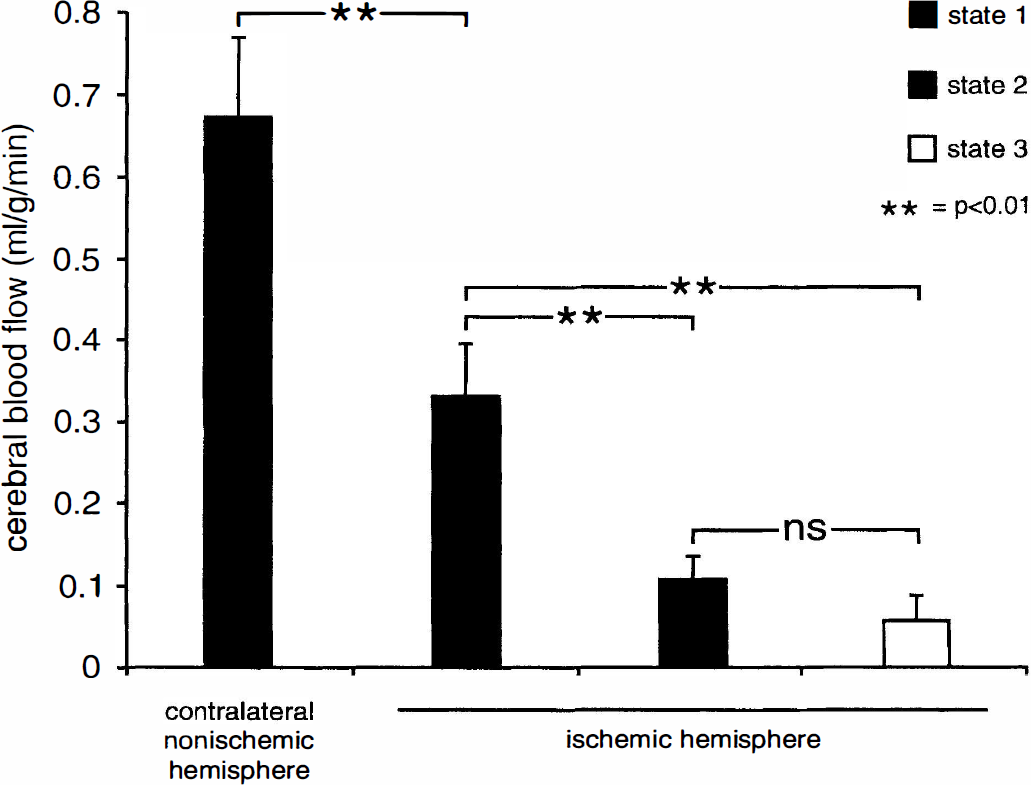
The CBF values measured in brain areas, which were defined primarily by their state of perfusion. First, the microcirculatory state (state 1, 2, or 3) was defined in different brain sections using fluorescent microscopic technique. Then, these brain areas were outlined in autoradiograms of adjacent brain sections. For each state of perfusion, the corresponding values of CBF were measured. Because the CBF in each of these states remained constant at all time periods after MCAO, the data were pooled for the respective state. First column: CBF values that corresponded to state 1 (black) were measured in the contralateral nonischemic hemisphere. Second column: CBF values determined in a rim about 1 mm wide containing Evans blue (state 1) at the border to tissue that lacked Evans blue but contained FITC dextran (border to state 2). CBF in this rim was 48% lower than that of the nonischemic hemisphere. CBF during state 2 (gray) was 85% and that during state 3, 90% lower than that measured in the nonischemic hemisphere. The values obtained during states 2 and 3 did not differ significantly (ns). These findings indicate that CBF in the ischemic hemisphere, which is filled with Evans blue and FITC dextran (state 1), at the borderline to tissue that lacked Evans blue is severely compromised despite early capillary filling by Evans blue. Tissue at states 2 and 3 shows ischemic CBF values as low as 15% and 10% of the contralateral nonischemic hemisphere, respectively (mean ± SD).
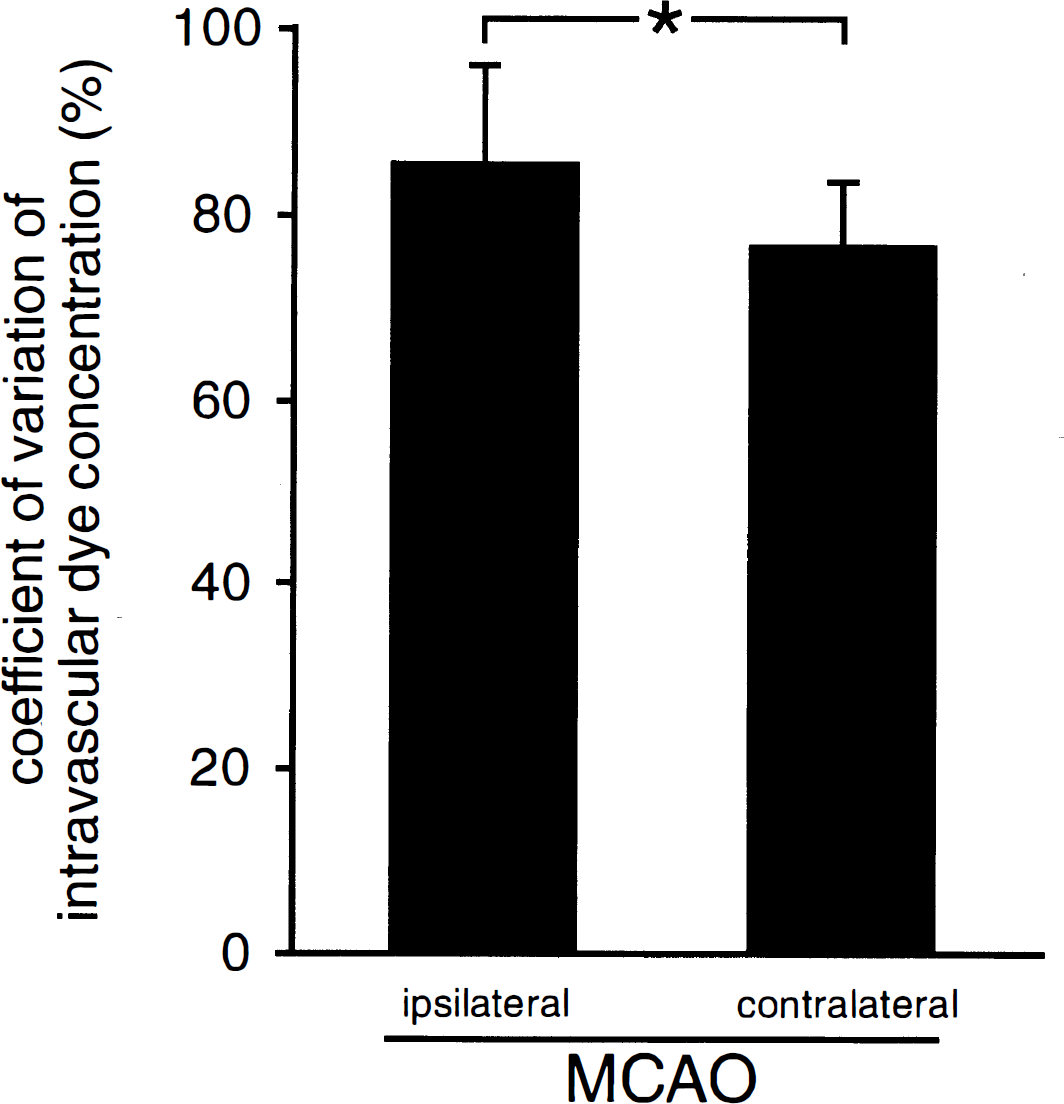
Comparison of the coefficient of variation of intracapillary Evans blue concentrations in tissue filled with FITC dextran and Evans blue (state 1) at the borderline to tissue that lacked Evans blue and in the contralateral nonischemic hemisphere. Because the heterogeneity of the intracapillary dye concentration did not depend on the duration of MCAO, the data of all different time points after MCAO were pooled. In the tissue at the border to the ischemic core, the heterogeneity of capillary perfusion was significantly higher than in the contralateral nonischemic hemisphere, indicating microciculatory disturbances in this borderline tissue (mean ± SD). * P < 0.05.
DISCUSSION
The current study shows the evolution of the microcirculatory disturbances during the first week after MCAO. Two to 4 hours after MCAO, most brain capillaries supplied by the occluded middle cerebral artery were perfused, although capillary filling was markedly delayed. With increasing duration of MCAO, capillaries that had a delayed filling were progressively replaced by nonperfused capillaries. These results indicate a residual plasma perfusion early after MCAO in ischemic brain tissue, which later is diminished. In the border zone adjacent to the ischemic tissue, the heterogeneity of plasma perfusion was higher than in the contralateral side at all time points after MCAO, indicating persistent microcirculatory disturbances despite fast capillary filling.
Under normal conditions, all brain capillaries show a continuous and heterogeneous plasma perfusion. An intravascular marker can be detected in all brain capillaries about 3 seconds after its bolus injection into the femoral vein of rats (Theilen et al., 1993). A delayed filling by an intravascular marker has been found during incomplete forebrain ischemia in a previous study (Theilen et al., 1993), indicating a considerable decrease of the capillary perfusion velocity. These findings are confirmed for MCAO by the current results that show, during the first hours after MCAO, large perfusion deficits for Evans blue, which circulated for 3 seconds, and a grossly maintained filling by FITC dextran, which circulated for 10 minutes. Furthermore, the current study shows the evolution of perfusion deficits with increasing duration of MCAO. One week after onset of MCAO, when the final extension of the infarct is defined (Garcia et al., 1993), capillaries either were filled by both FITC dextran and Evans blue or were not filled by either dye. This indicates that 7 days after MCAO, the capillaries either are perfused at a normal velocity or are not perfused at all. These data are in accordance with a previous study in which one perfusion marker was used. Garcia et al. (1994) found a progressive decrease of capillary filling by intravenously administered horseradish peroxidase, which circulated for 20 minutes 1 week after permanent MCAO in rats. The lack of dye filling in the ischemic brain tissue can be explained by the fact that microvascular integrity in the infarct zone is reduced as early as 24 hours after focal ischemia (Hamann et al., 1995, 1996). However, the current study extends these findings in several respects: the use of an intravascular marker with a short circulation time (3 seconds, Evans blue) simultaneously with a long circulating intravascular marker (10 minutes, FITC dextran) allowed us (1) to differentiate between rapid (state 1), delayed (state 2), and lack of capillary filling (state 3); and (2) to test the heterogeneity of the capillary perfusion. In addition, the simultaneous measurement of CBF allowed us to directly correlate the different states of perfusion and plasma flow heterogeneity with local CBF. The existence of persistent microcirculatory disturbances during the whole observation period after MCAO at the borderline-to-normal brain tissue (state 1) is indicated by the increased heterogeneity of Evans blue filling and the markedly reduced CBF within these areas. Comparably high plasma flow heterogeneities have been shown previously when CBF was severely reduced during extreme hypocapnia (at PCO2 of 10 mm Hg) in rats lacking vascular occlusion (Vogel et al., 1996).
The question arises as to why the perfusion of tissue that is filled only by FITC dextran early after MCAO (state 2) is further decreased and finally stops during the following days. On the one hand, this could result from secondary brain damage such as inflammation or blood-brain barrier disruption followed by edema (Hartl et al., 1996; Tomita and Fukuuchi, 1996). On the other hand, the deterioration of perfusion over time could be caused by an inadequate oxygen supply of the tissue. Filling of capillaries by FITC dextran or Evans blue indicates perfusion by plasma only. Because plasma flow and red cell flow are different entities and do not run parallel (Tajima et al., 1992), the existence of plasma perfusion cannot indicate an adequate oxygen supply under pathophysiol-gic conditions. Plasma can squeeze around plugging leukocytes (Yamakawa et al., 1987; Garcia et al., 1994) and find its way through capillary segments, which are narrowed because of endothelial swelling (Garcia et al., 1993; Zhang et al., 1994) or intravascular coagulation (Thomas et al., 1993). Because red cell flow is essential for the oxygen supply, brain tissue that is perfused only by plasma may not survive. Therefore, it is possible that blood flow in areas perfused only by FITC dextran (state 2) was not sufficient to maintain the viability of the tissue, resulting in a complete perfusion deficit 1 week after MCAO.
Tissue affected by stroke is commonly divided into penumbra and core. It is therefore of interest to assign these states of the tissue to the different states of capillary filling found in the current study. Penumbra denotes perifocal areas that are marginally supplied by oxygen and may be recruited in the infarction process unless normal perfusion is reestablished or measures are instituted that prevent the cells from dying (Memezawa et al., 1992). Based on CBF measurements, brain tissue in which CBF values are lowered to 30% to 40% of the normal values has been assigned to represent penumbra in the rat, whereas tissue displaying lower CBF values has been defined as core (Back et al., 1995; Ginsberg, 1997). Using these criteria, penumbra in the current study appears to be best represented by tissue that was filled by Evans blue and FITC dextran (state 1) at the boundary to the tissue that was filled only by FITC dextran. In this tissue, the mean CBF was 0.33 mL • g–1 • min−1. Areas that were filled only by FITC dextran (state 2) or contained no dye (state 3) are best defined as core tissue, since the mean CBF was 0.104 (state 2) and 0.056 mL • g–1 • min−1 (state 3), respectively. These values of CBF are not only related to specific states of microvascular perfusion, but they also can be used for comparing the results of the current study with those of previous studies of other groups in which the state of ischemic tissue has been specified on the basis of CBF values. In these previous studies, direct correlations between CBF, local CMRglc, and histopathologic findings after transient and permanent MCAO have been performed (Tyson et al., 1984; Dietrich et al., 1986; Bolander et al., 1989; Takagi et al., 1993; Zhao et al., 1997). The study of Zhao et al. (1997) indicates that tissue showing a delayed (CBF 0.104 mL • g–1 • min–1, state 2) or minimal (CBF 0.056 mL • g–1 • min–1, state 3) perfusion is extremely likely to develop infarction and can be regarded as ischemic core. On the other hand, brain tissue of state 1 (located at the border to tissue that contained no Evans blue) has potential to survive and might be regarded as penumbra. Penumbral regions may therefore have a fast capillary filling despite a severely compromised microcirculation, which is indicated by an extreme capillary perfusion heterogeneity. Since, during the first hours after MCAO, the ischemic core grows at the cost of the penumbra (Ginsberg, 1997), it appears likely that during the evolution of the infarction, parts of the tissue that initially were filled by both dyes (state 1) changed into tissue that was filled only by FITC dextran (state 2) and finally contained no dye at all (state 3).
Compared with normal, conscious rats, CBF in the contralateral nonischemic hemisphere was about 30% lower and plasma flow heterogeneity about 19% higher (Göbel et al., 1989; Abounader et al., 1995). The most likely explanation for this finding might be anesthesia. Chloralose is known to reduce CBF between 20% and 40% (Lindauer et al., 1993) and local CMR glc up to 50% (Dudley et al., 1982; Ueki et al., 1988). These findings are in line with the current results of a reduced CBF in the contralateral nonischemic hemisphere. Other mechanisms that may contribute to the reduction of CBF in the contralateral hemisphere are an increased intracranial pressure caused by edema in the ischemic hemisphere (Heiss et al., 1994) or diaschisis, which describes functional and metabolic abnormalities of areas remote from the brain lesion that may be transneuronally or humorally mediated (Ginsberg, 1990; Andrews, 1991).
The current study shows a maintenance of plasma perfusion during the first hours after MCAO. Compared with nonischemic conditions, perfusion in most capillaries is considerably slowed down. Later, nonperfused areas progressively replaced the slowly perfused areas. This finding indicates that during the first hours after onset of MCAO, therapeutic agents can reach the ischemic tissue. The extreme heterogeneity of capillary perfusion at a reduced CBF observed at the border between normal and ischemic tissue at all time periods after MCAO shows the existence of permanent microcirculatory abnormalities in this area.
Footnotes
Acknowledgments:
The authors thank W. D. Busse and R. Förderer for the construction of the automatic guillotine.