
Abstract
Genomic screening of hybrids from stroke-prone (SHR-SP) and stroke-resistant spontaneously hypertensive rats (SHR) identified a STR1 locus on the rat chromosome 1, which correlates with the susceptibility to cerebral stroke but not with hypertension. The authors examined whether this genetic abnormality is associated with hemodynamic or metabolic alterations in the brain that can be detected before the manifestation of brain infarction. Starting at 6 weeks of age, SHR-SP were fed with a salt-rich diet to accelerate arterial hypertension. At the age of 12 weeks, animals developed functional symptoms and were age-matched with symptom-negative SHR-SP to differentiate between presymptomatic and postsymptomatic changes. Brains were investigated by multiparametric imaging comprising quantitative double-tracer autoradiography of CBF and cerebral protein synthesis (CPS); bioluminescence imaging of regional ATP, glucose, and lactate content; and umbelliferone fluoroscopic imaging of tissue pH. None of the animals exhibited focal hemodynamic or biochemical abnormalities. In symptom-negative SHR-SP, global CBF was 1.1 ± 0.3 mL. g–1 · min–1, cortical CPS was 10.1 ± 3.1 nmol · g–1 · min–1, and cortical ATP, glucose, lactate, and pH levels were in the normal range. In SHR-SP with functional symptoms, ATP, glucose, and lactate levels also were normal, but tissue pH exhibited periventricular alkalosis, CBF was significantly reduced to 0.7 ± 0.2 mL · g–1 · min–1 (P < 0.001), and cortical CPS was significantly reduced to 6.7 ± 2.1 nmol · g–1 · min–1 (P < 0.001). The decline in brain perfusion of SHR-SP correlated significantly with both the severity of functional deficits and the decline of protein synthesis. Our observations demonstrate that SHR-SP had already developed functional symptoms before the manifestation of overt brain infarcts and that the symptoms are initiated by a decline in global CBF and cortical CPS. Genetic abnormalities in SHR-SP are associated with a diffuse vascular process that results in global decompensation of blood flow well before the onset of focal brain infarction.
Clinical and epidemiologic studies reveal that genetic factors play an important role in the pathogenesis of CNS diseases (Alberts, 1991; Brass and Alberts, 1995; Brass et al., 1992; Kiely et al., 1993). With the advent of new methods for molecular genetic research and statistical evaluation (Hauser et al., 1996; Lander and Botstein, 1986a, b ; Payne and Roses, 1988; Pinto et al., 1998; Risch, 1990; Schork et al., 1993) and with the establishment of a spontaneously hypertensive rat (SHR) strain with a high incidence of stroke (SHR-SP) (Yamori et al., 1975a, b ), it has become possible to analyze the genetic background of cerebrovascular disease under controlled experimental conditions (Coyle et al., 1984; Jeffs et al., 1997; Rubattu et al., 1996).
Rubattu et al. (1996) report that hybrids from SHR-SP and stroke-resistant SHR exhibit a quantitative trait locus STR1 on rat chromosome 1, which correlates with the susceptibility of stroke but not with hypertension. The pathomechanisms of this relation remain to be established, but there are indications of a progressive cerebrovascular angiopathy in SHR-SP (Arribas et al., 1996; Baumbach, 1996; Fredriksson et al., 1988; Ogata et al., 1980; Ogata et al., 1981). These vascular changes have been associated with focal reductions of blood flow (Ogata et al., 1980; Ogata et al., 1981; Yamori and Horie, 1977), which lead to focal disturbances of energy metabolism and eventually infarction (Paschen et al., 1985a; Yamori and Horie, 1977). Other studies, however, indicate that a prominent feature of SHR-SP is a disturbance of vascular reactivity, as confirmed by the shift of the lower limit of CBF autoregulation (Barry et al., 1982; Sadoshima and Heistad, 1983) or reduced Pco2-reactivity of brain perfusion (Yamori and Horie, 1977). We therefore examined the relation between blood flow and metabolism before the onset of brain infarcts in SHR-SP. For regional analysis, we used a multiparametric imaging protocol, which allows the simultaneous measurement of CBF and cerebral protein synthesis (CPS) (Mies et al., 1993); tissue ATP, glucose, and lactate values (Kogure and Alonso, 1987; Paschen, 1985; Paschen et al., 1985b); as well as the visualization of regional differences in tissue pH in the same animal (Csiba et al., 1983). Our observations demonstrate that SHR-SP exhibit global rather than focal flow abnormalities before infarction and that the initial metabolic change is a global inhibition of protein synthesis rather than a focally disturbed energy state.
MATERIALS AND METHODS
Animals and functional deficit score
Male SHR-SP siblings weighing 80 to 100 g were obtained from the Max-Delbrück-Center for Molecular Medicine in Berlin-Buch and housed with a 12-hour light-dark cycle under constant temperature conditions. At the age of 6 weeks, the rats received a salt-rich diet (17.5% protein, 3.7 mg/g Na+, 6.3 mg/g K+, 0.03 mg/g methionine; Lab. Piccioni, Milan, Italy) and 1 % NaCl in the drinking water ad libitum. The progression of disease was monitored by daily evaluations of changes in body weight and of signs of behavioral and neurologic deficits according to the criteria listed in Table 1. Ten SHR-SP exhibiting a functional deficit score of more than 5 points were designated as symptom positive (S+) and matched with 10 symptom-negative (S–) rats of the same age and the same duration of salt diet. The cutoff of 5 points was chosen to differentiate between animals with and without motor deficits. The pairs of animals—except one symptom-positive animal that died spontaneously—then were subjected to multiparametric imaging as described later.
Criteria for the evaluation of the functional deficit score
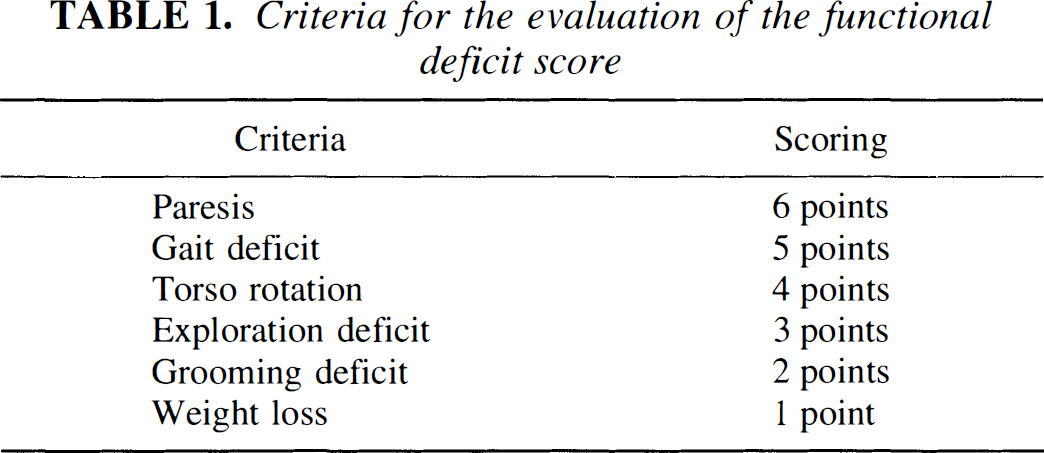
Animals with a functional deficit score ≤ 5 points were classified as symptom negative (S–), and >5 points as symptom-positive (S+). SHR-SP, stroke-prone spontaneously hypotensive rats.
Experimental protocol
General surgery. Animals were anesthetized with 1.5% halothane in 70% N20 and 30% oxygen delivered with a face mask. Rectal temperature was kept between 36.5° and 37.5°C throughout the experiment using a feedback-controlled heating system. Catheters were inserted into both femoral arteries and veins for injection of drugs and tracers, arterial blood sampling, and arterial blood pressure monitoring. Animals were trache-otomized, immobilized with pancuronium bromide (0.5 mg/kg/h intravenously), and mechanically ventilated. After surgery, the halothane concentration was reduced to 0.8%. Arterial blood gas analysis was performed before tracer injection.
Tracer application. One millicurie of [3H]-4,5-leucine dissolved in 1 mL of Ringer solution (specific activity 140 to 170 Ci/mmol) was applied by programmed intravenous infusion to maintain a constant level of plasma specific activity throughout the 45-minute circulation period (Patlak and Pettigrew, 1976). Arterial blood samples were collected at intervals of 10 minutes and centrifuged immediately. Ten microliters of plasma were deproteinized with 10 μL of 10% trichloroacetic acid, centrifuged, and stored in a freezer at −80°C for the later determination of plasma free leucine specific activity, as described later. Forty-five minutes after the beginning of [3H]leucine infusion, 30 μCi of [14C]iodoantipyrine (specific activity 55 mCi/mmol, dissolved in 1 mL of 0.9% saline) was infused intravenously over 60 seconds while taking repeated blood samples on preweighed filter paper. At the end of the [14C]iodoantipyrine infusion, the animals' heads were frozen in liquid nitrogen.
Measurement of arterial [14 C]iodoantipyrine blood radioactivity. Blood samples were weighed immediately after termination of experiments and placed in counting vials. A 5-mL scintillation cocktail was added, and the [14C]radioactivity was measured in a scintillation counter (Wallace 1410, Pharmacia, Freiburg, Germany).
Tissue processing for multiparametric imaging
Double-tracer autoradiography. Brains were removed from the skull in a low-temperature cabinet at −20°C and cut into 20 μm thick serial sections at the same temperature. Quantitative double-tracer autoradiography of [14C] and [3H] was performed according to Mies et al. (1991) with minor modifications (Mies et al., 1993). In brief, [14C]radioactivity was recorded by exposure to Hyperfilm βmax (Amersham Buchler, Braunschweig, Germany) for 14 days with calibrated [14C] and [3H]polymer standards. This film is not blackened by [3H]disintegrations because of its protection layer. Subsequently, [14C]radioactivity and [3H]label that had not been incorporated into brain proteins was removed by wash-incubation for 30 minutes in 0.3 mol/L perchloric acid/1 mmol/L ethylene glycolbis[β-aminoethylether]-N, N, N1, N′-tetraacetic acid (EGTA). Sections were defatted, dried at room temperature, and used for [3H]autoradiography of labeled proteins by exposure to tritium-sensitive film (Hyperfilm 3H, Amersham Buchler, Braunschweig, Germany) with calibrated [3H]polymer standards for 2 weeks.
Bioluminescence imaging of regional ATP, glucose, and lactate. For bioluminescence imaging, alternate 20 μm thick cryostat sections were mounted on coverslips at −20°e. After freeze drying and heat fixation, sections were coated with a layer (60 μm) of frozen reaction mix for substrate-specific bioluminescence of ATP (Kogure and Alonso, 1978), glucose (Paschen et al., 1985b), and lactate (Paschen, 1985). Sections were allowed to thaw at room temperature, and the substrate-dependent light reaction was recorded on photographic film. For calibration of bioluminescence images, cortical samples were collected from the tissue block, and ATP, glucose, and lactate concentration were determined by conventional enzymatic tissue analyses (Lowry and Passonneau, 1972).
Fluoroscopic imaging of tissue pH Regional tissue pH was measured with the umbelliferone technique described by Csiba et al. (1983). Cryostat sections, 20 μm thick, were mounted on umbelliferone-soaked paper at −20°C. After thawing the sections in an ice bath, the pH-dependent fluorescence was photographed at 370 nm and the pH-independent fluorescence at 340 nm using a cutoff filter of 450 nm. Images were calibrated with graded pH standards.
Measurement of leucine-specific activities
Preparation of tissue and plasma samples. Specific activity of free tissue leucine was measured in samples taken from the frontal pole. Tissue probes were homogenized in 10 volumes of 10% trichloracetic acid, equilibrated for 30 minutes at 4°C, and then centrifuged. Pellets were washed with five volumes of 5% trichloracetic acid and centrifuged again. Supernatants were pooled and used for leucine analysis as described later.
HPLC analysis and scintillation counting. Amino acid analysis was performed by HPLC using an automated HPLC system (Kontron D450, Munich, Germany). [3H]radioactivity of the collected leucine fraction was measured in a liquid scintillation counter (L7200 Beckman, Fullerton, CA, U.S.A.) with internal quench correction (Mies et al., 1997).
Data processing for multiparametric imaging
Quantitative autoradiography, bioluminescence, and fluoroscopic imaging. Autoradiograms and bioluminescence and fluorescence images were digitized with their respective standards using a charge-coupled device camera (Sony SSC-M37OCE, Sony Incorporation of America, Cypress, CA, U.S.A.) or a microdensitometer (Scandig3, New Hampshire, England) operated by a Macintosh IIfx computer. Image processing was carried out with ImageMG, a user-revised version of the public domain program NIH-Image (W. Rasband, National Institutes of Health, Bethesda, MD, U.S.A.). For quantification of images, optical densities were correlated with standard values by polynomial regression.
Quantitative measurement of cerebral protein synthesis. For the quantification of [3H]leucine incorporation autoradiograms, the operational equation of Smith et al. (1988) was used with the following modifications (Mies et al., 1997). In the denominator, integrated arterial plasma leucine-specific activity was multiplied by the individual precursor pool dilution factor determined for each animal (i.e., the ratio of tissue leucine to plasma leucine specific activities). This procedure corrects for individual recycling of unlabeled amino acids derived from the breakdown of brain proteins. Global CPS values were calculated by averaging the pixel values of all brain slices, and region of interest values by averaging pixels of various anatomical structures, as defined in a rat brain atlas (Pellegrino et al., 1979).
Quantitative measurement of cerebral blood flow. Cerebral blood flow values were derived from [14C]iodoantipyrine autoradiograms using the algorithm of Sakurada et al. (1978). Global and region of interest values of CBF were calculated in the same way as for CPS.
Statistical analysis
All values are expressed as means ± SD. Group differences were analyzed by one-way analysis of variance and the post hoc Scheffé test. Regression and correlation analyses were used to estimate the interdependency of parameters of interest using StatView (Abacus Concepts, Inc., Berkely, CA, U.S.A.). A P value of < 0.05 was considered to indicate a statistically significant difference between experimental groups.
RESULTS
Evaluation of the deficit score
During the initial 5 weeks of exposure to a stroke-permissive salt diet, SHR-SP did not exhibit behavioral abnormalities or losses of body weight. From 38 to 40 days after the beginning of salt diet, a gradually increasing number of rats developed functional deficits, such as exploration deficits and gait deficits. According to the definition given in the methods section, animals with a neurologic deficit score of more than 5 points were classified as S+ SHR-SP. When these animals were submitted to the experimental protocol 3 to 6 hours later (mean latency after the onset of diet 42,2 ± 3.0 days), the neurologic deficit score was 21.1 ± 6.5 points compared with 1.18 ± 1.8 points in the age-matched S– SHR-SP (P <0.01). Weight loss over the 3 days preceding the onset of neurologic symptoms amounted to 21.1 ± 6.5 g in S+ and 7,5 ± 7.2 g in S– rats. This difference also was highly significant (P <0.001).
Physiologic variables
Mean arterial blood pressure, pH, Pao2, and Paco2 did not differ significantly between S+ and S– rats (Table 2). The only abnormality in S+ animals was a decrease of blood hematocrit, which declined by almost 5% compared with S– rats (P <0,01).
Physiologic parameters
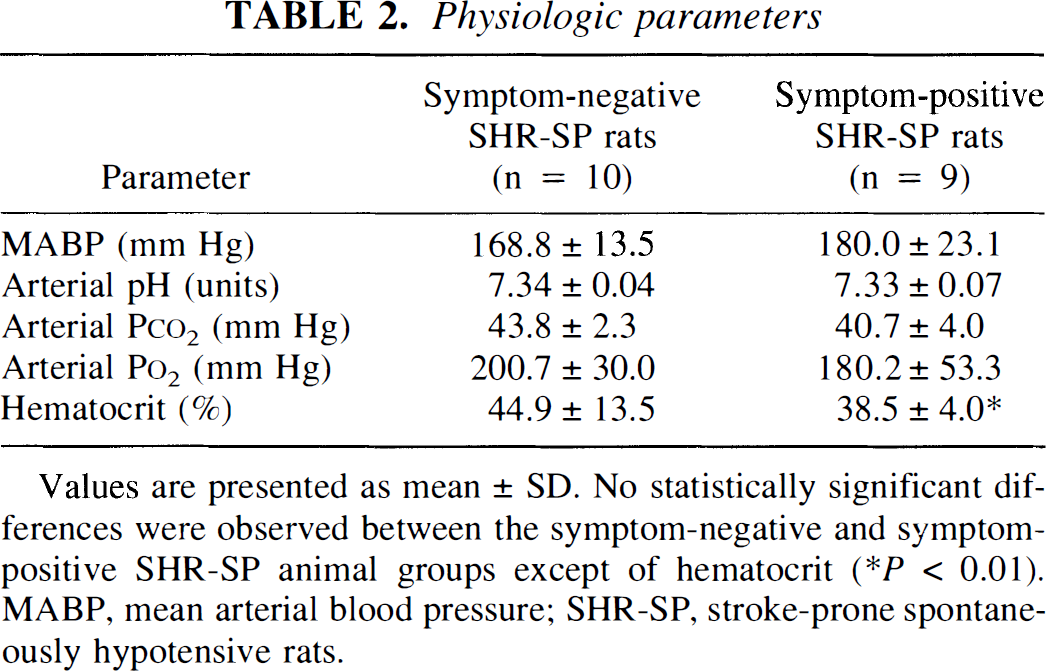
Values are presented as mean ± SD, No statistically significant differences were observed between the symptom-negative and symptom-positive SHR-SP animal groups except of hematocrit
P < 0.01). MABP. mean arterial blood pressure; SHR-SP. stroke-prone spontaneously hypotensive rats.
Histologic evaluation
Although the use of cresyl-violet stained cryostat sections does not allow the evaluation of minor neuropathologic changes, light microscopic examination of section from both S– and S+ SHR-SP clearly revealed no evidence for overt brain infarction. In three of nine S+ SHR-SP, subcortical white matter appeared discretely wider than in other animals but showed no signs of structural damage. This suggests that the functional deficits of S+ SHR-SP were not associated with morphologic lesions.
Hemodynamic and metabolic findings in S– and S+ SHR-SP
Representative multiparametric images of the brains of S– and S+ SHR-SP are shown in Figs. 1 and 2, respectively. Blood flow, protein synthesis, tissue pH, and the regional content of ATP, glucose, and lactate were measured in five coronal planes spread 2 mm apart. In the S– rat (Fig. 1), no focal abnormalities were observed, except a slight elevation of pH in peri ventricular and white matter. In the S+ animal (Fig. 2), in contrast, a marked reduction of blood flow and protein synthesis occurred, mainly in the cerebral cortex (Fig. 2). Compared with S– SHR-SP, ATP, glucose, and lactate content in S+ SHR-SP did not differ significantly, but there was a further increase of periventricular and white matter alkalization (Fig. 2).
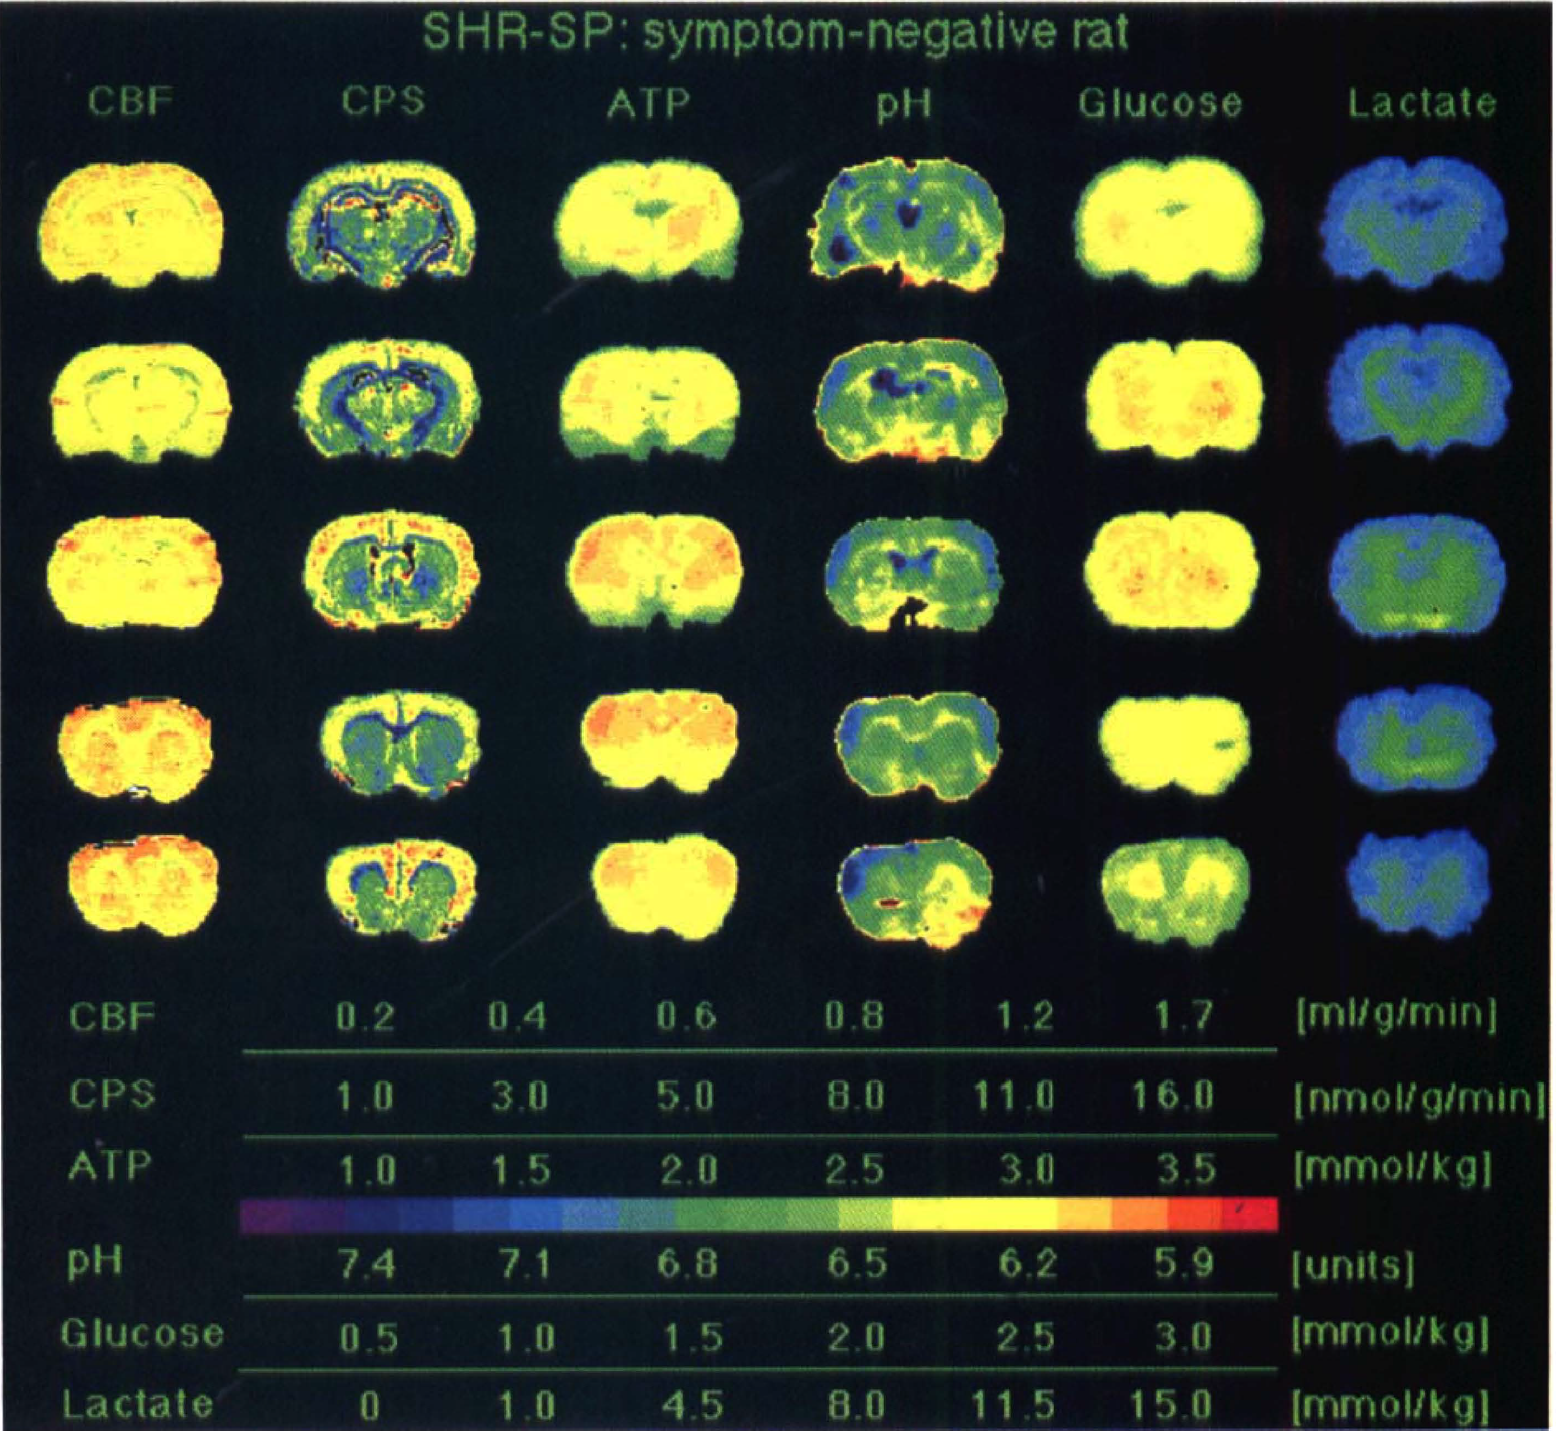
Multiparametric imaging in a stroke-prone spontaneously hypertensive rat (SHR-SP) without functional deficits after being placed on a salt-rich diet. Regional ATP, glucose, and lactate values were measured by substrate-induced bioluminescence, tissue pH with the umbelliferone technique, and CBF and cerebral protein synthesis (CPS) by double-tracer autoradiography. Brain sections were taken from five coronal planes of the same animal. Notice the absence of pathologic changes.
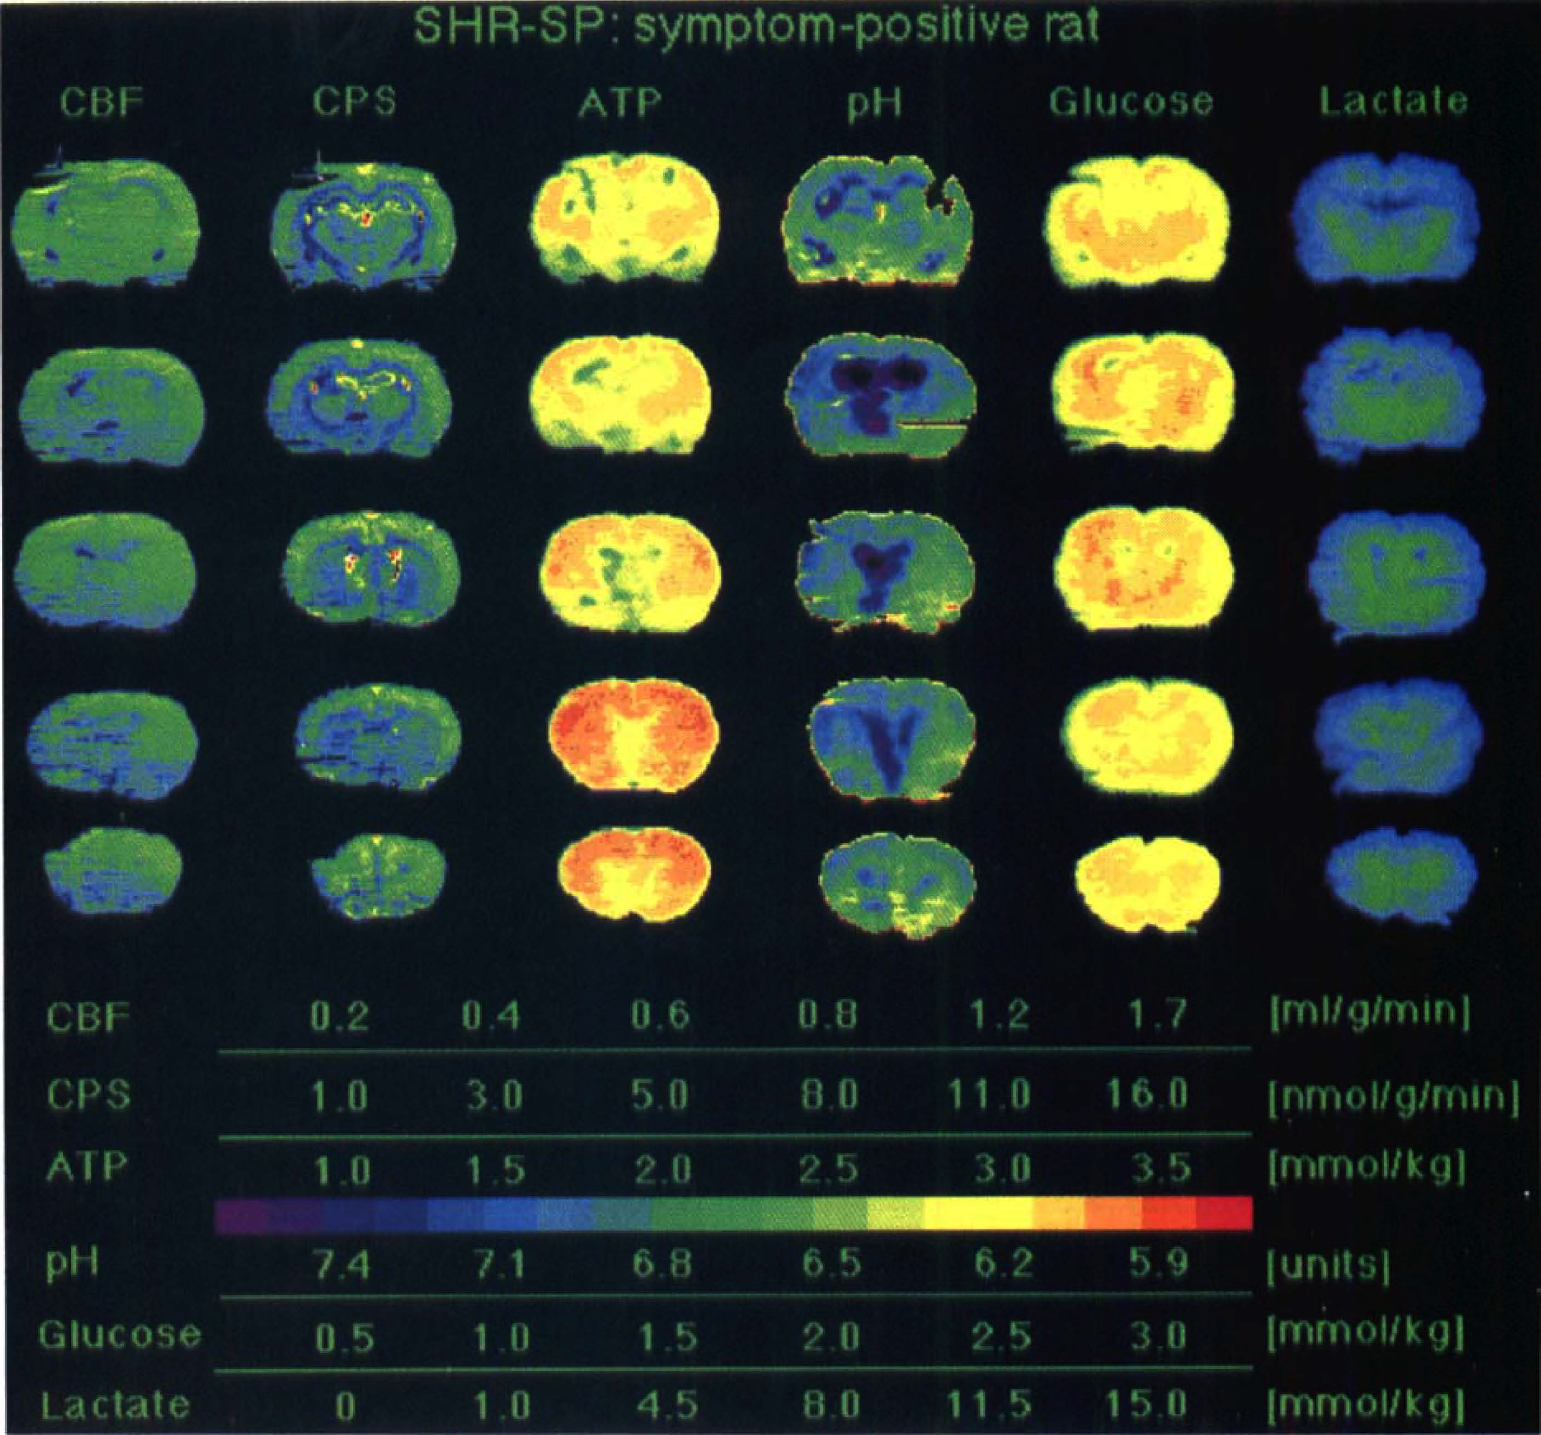
Multiparametric imaging in a SHR-SP rat with functional deficits after being placed on a salt-rich diet. Regional ATP, glucose, and lactate values were measured by substrate-induced bioluminescence, tissue pH with the umbelliferone technique, and CBF and cerebral protein synthesis (CPS) by double-tracer autoradiography (same color coding as in Fig. 1). Notice global decline of CBF and CPS but no regional abnormalities except periventricular alkalosis.
Enzymatic measurements of metabolites in tissue samples taken from cerebral cortex demonstrated that lactate was mildly elevated, but ATP and glucose were in the normal range in both groups. In S+ SHR-SP, ATP, glucose, and lactate concentration amounted to 2.9 ± 0.8 (range 1.9 to 4.1), 2.5 ± 1.0 (range 1.3 to 4.8), and 3.1 ± 0.7 (range 2.1 to 4A) μmol/g, and in S– SHR-SP to 3.1 ± 0.3 (range 2.9 to 3.9), 3.1 ± 1.3 (range 1.2 to 5.5), and 3A ± 0.4 (range 2.0 to 4.1) μmol/g, respectively (no significant differences between groups). No change in cortical tissue pH was observed between S– SHR-SP (7.1 ± 0.1 units; range 7.03 to 7.24) and S+ SHR-SP (7.1 ± 0.1 units; range 6.9 to 7.21).
The quantitative evaluations of CBF and CPS are summarized in Tables 3 and 4. Global CBF was 1.1 ± 0.3 (range 0.7 to 1.6) mL · g–1 · min–1 in S– SHR-SP but declined by 33% to 0.7 ± 0.2 (range 0.6 to 1.1) mL · g–1 · min–1 in S+ SHR-SP. Global CPS declined by 16% from 8.6 ± 1.2 (range 6.2 to 10.6) to 7.2 ± 2.1 (range 3.8 to 10.4) nmol · g–1 · min–1 after appearance of functional symptoms, but this difference did not reach statistical significance (P < 0.088). Analysis of regional CBF and CPS, however, confirmed a widespread reduction in S+ SHR-SP in most of the evaluated brain structures, with the only exception of hippocampal CPS and CPS in thalamic ventral nucleus, which did not differ significantly between the two groups.
Regional and global cerebral blood flow
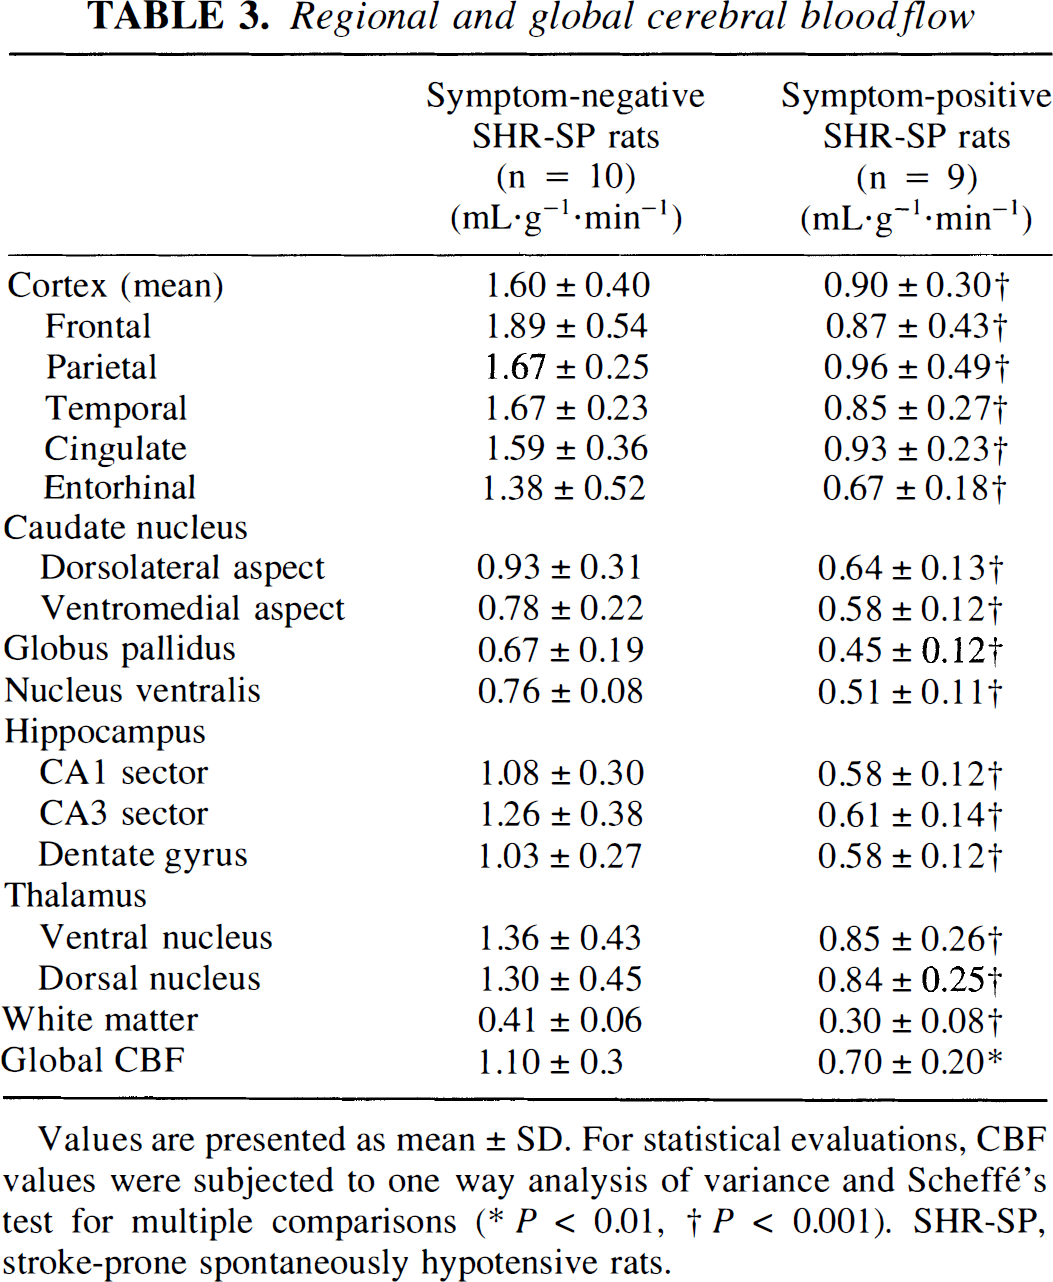
Values are presented as mean ± SD. For statistical evaluations, CBF values were subjected to one way analysis of variance and Scheffé's test for multiple comparisons
P < 0.01
P < 0.001). SHR-SP, stroke-prone spontaneously hypotensive rats.
Regional and global cerebral protein synthesis
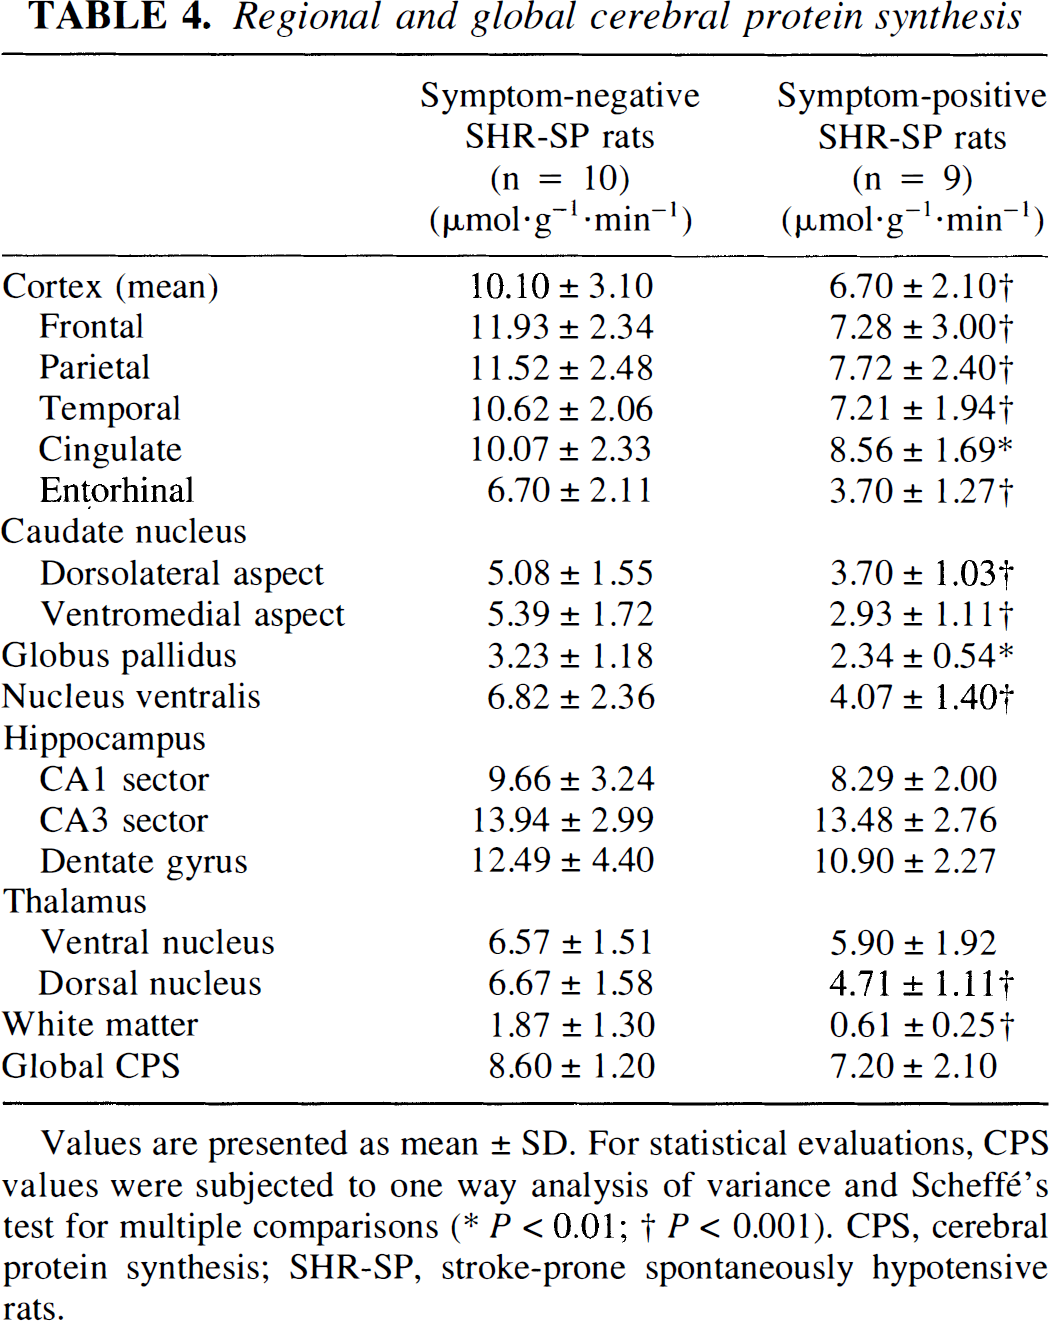
Values are presented as mean ± SD. For statistical evaluations, CPS values were subjected to one way analysis of variance and Scheffé's test for multiple comparisons
P < 0.01
P < 0.001). CPS, cerebral protein synthesis; SHR-SP, stroke-prone spontaneously hypotensive rats.
Correlation analyses
The decline in global brain perfusion correlated significantly with both the functional deficit score (Fig. 3; y = 38.1 − 55.7× + 20.7×2; r = 0.717; P < 0.001) and global protein synthesis (Fig. 4; y = −1.7× + 14.3 −4.0/×; r = 0.634; P < 0.05). Within cerebral cortex (Fig. 5; y = 0.1× + 12.7 − 4.1/×; r = 0.704; P < 0.001) and caudate-putamen (not shown; y = −2.8x + 11.7 − 3.7/×; r = 0.524; P < 0.01), pixel analyses revealed a similar relation between local CBF and local protein synthesis. Interestingly, no such relation was seen in the hippocampal (y = 5.5× + 3.3 + 2.5/×; r = 0.254; not significant) and thalamic (6 = −0.3× + 8.5 − 2.1/×; r = 0.186; not significant) formation or in the white matter (y = −4.7× − 45.8 − 0.008/×; r = 0.137; not significant).
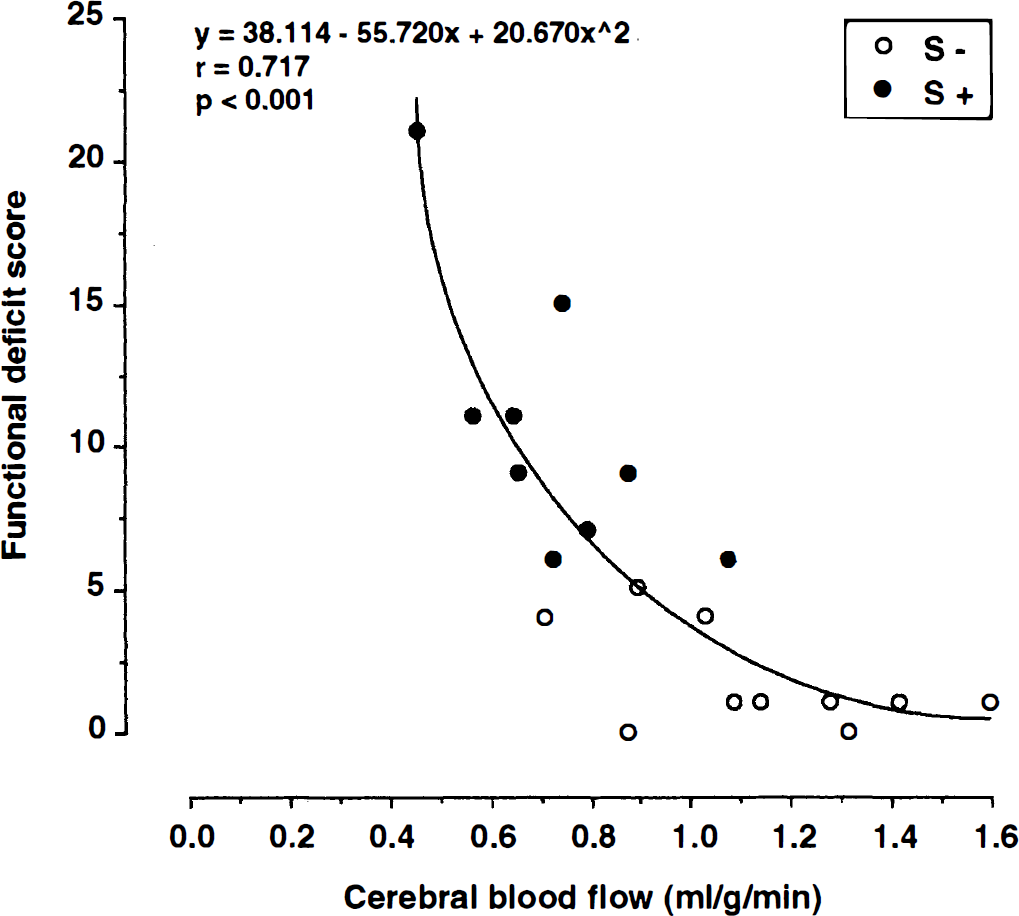
Relation between CBF and functional deficit score. Correlation analysis demonstrates highly significant increase of functional deficits at declining flow values (n = 10 symptom-negative and n = 9 symptom-positive SHR-SP; r = 0.7 17; P < 0.001).
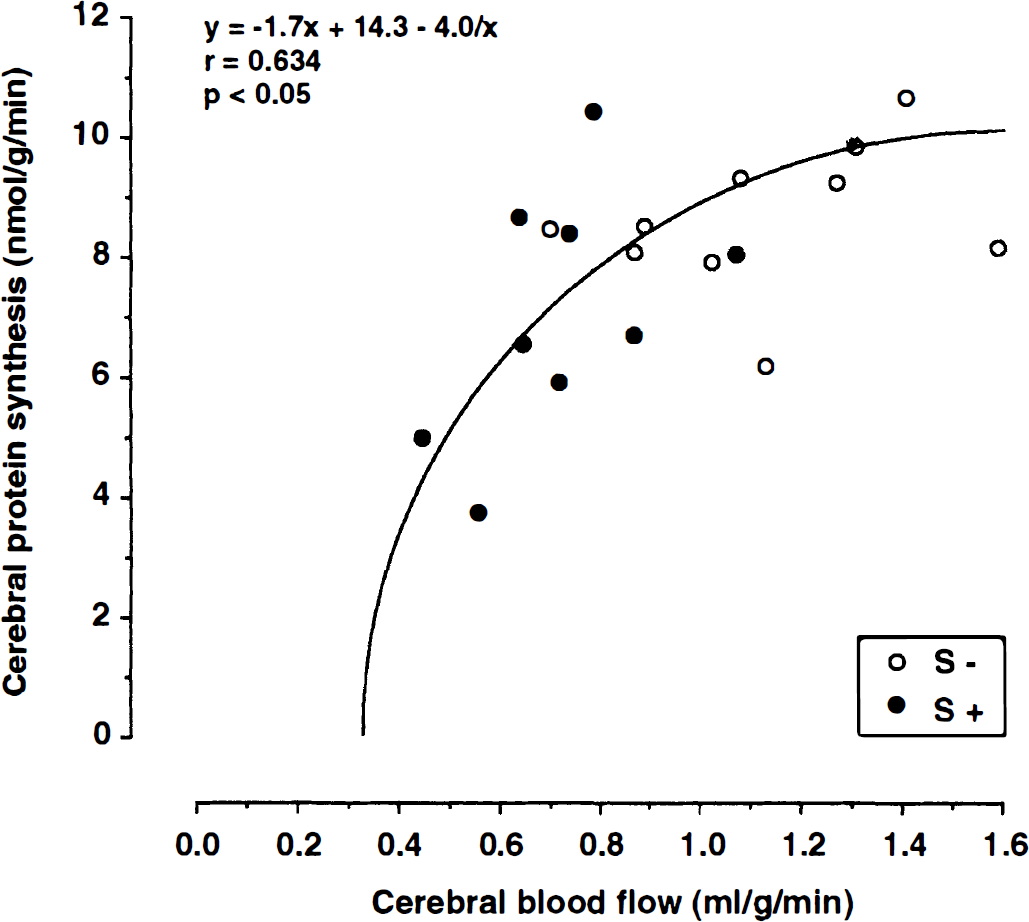
Relation between global CBF flow and protein synthesis. Notice the exponential decline of CPS with decreasing flow valuse (n = 10 symptom-negative and n = 9 symptom-positive SHR-SP; = 0.634; P < 0.05).
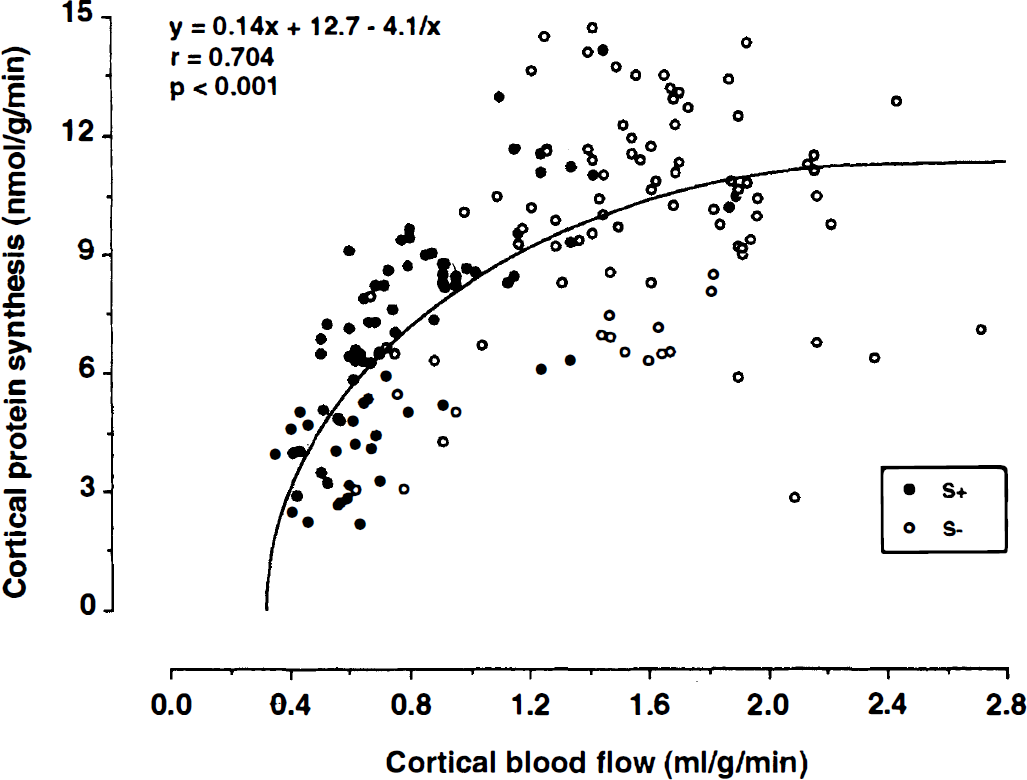
Relation between cortical CBF and protein synthesis (values are from five cortical regions of interest per animal). Notice the exponential decline of CPS with decreasing flow values (n = 10 symptom-negative and n = 9 symptom-positive SHR-SP; r = 0.704; P 0.001).
DISCUSSION
In SHR-SP, focal neurologic symptoms such as hemiparesis or abnormal circling behavior have been associated with the manifestation of morphologically (Ogata et al., 1981) or biochemically identifiable brain infarcts (Paschen et al., 1985a). To capture the earliest of phase of infarction which occurs in this strain before the forty-third day after beginning of the salt diet (Rubattu et al., 1996), we selected animals for our investigation in which subtle functional symptoms were detected that had not progressed to the full neurologic symptomatology of stroke. In addition, age-matched symptom-free animals were studied to identify the presymptomatic brain disease. Our data demonstrate that brains of animals without clinical deficits did not exhibit any major brain disease and that, in the early symptomatic animals, hemodynamic alterations were global rather than focal, as would be expected just before the manifestation of massive brain infarcts. Analysis of the multiparametric imaging data reveals that before the onset of brain infarction, blood flow and protein synthesis—but not A TP—are reduced throughout the brain in SHR-SP. Obviously, global blood flow declines at the onset of functional symptoms to levels that interfere with protein synthesis but not with energy metabolism (Mies et al., 1991). Because a decrease in brain perfusion is associated with a decline in tissue oxygen tension (Crockard et al., 1976; Back et al., 1994), the most likely explanation for the disturbance of the protein synthesizing machinery is the known sensitivity of brain protein synthesis of hypoxia (Metter and Yanagihara, 1979). Notice that pixel analysis with the rational function (i.e., y = a*× + b + c/×) revealed a significant flow threshold-dependent decline of cortical and striatal CPS, whereas such interdependency did not reach the level of significance in the hippocampal formation, thalamic nuclei, or white matter. This suggests that in the latter structures, the CBF-CPS interdependency probably is more complex. A significant flow dependency of CPS inhibition in cortex and caudate-putamen could be related to the oxygen sensitivity of CPS, but it cannot be excluded, as for the other examined structures, that regional flow is partially coupled to the reduction of the metabolic rate for glucose. In such an instance, the decrease in regional blood flow might have been unrelated to changes in the rates of protein synthesis. Further studies are necessary to clarify this issue.
The manifestation of brain infarcts follows later, when blood flow falls to the lower threshold of A TP breakdown (Mies et al., 1991). This event occurs first in the areas in which flow impairment is most pronounced, which explains the focal localization of infarctions (Ogata et al., 1980; Ogata et al., 1981). If this interpretation is correct, the clinical symptoms observed here of exploration deficits and torso rotation reflect brain disturbances that occur at higher flow rates than those causing brain infarction, and such symptoms would be serious predictors of impending stroke.
Our observations of an initially global reduction of blood flow in SHR-SP are in line with the earlier demonstration of progressive vascular disease in this strain. Nordborg and Johansson (1980) showed that the ratio of the vessel wall thickness to the diameter of medium-sized intraparenchymal arteries and larger vessels (e.g., internal carotid artery) was significantly increased in SHR already at an age of 15 days compared with Wistar Kyoto rats, probably because of differences in the genetic background of these rat strains. During the progressive development of arterial hypertension in SHR, a continuous remodeling and reconstruction of extracranial and perforating arteries, as well as intraparenchymal cerebral arterioles, occurred, which led to a further increase in the wall-lumen ratio and wall thickness caused by hypertrophy of vascular smooth muscle cells (Arribas et al., 1996; Baumbach, 1996; Nordborg and Johannson, 1980). These structural alterations might explain the increased cerebrovascular resistance in SHR and SHR-SP needed for the normalization of blood pressure before it reaches the microcirculation (Folkow, 1982). Light microscopic and ultrastructural studies further reveal that the initial vascular lesions included focal cytoplasmic necrosis in the outer layer of the media progressing to widespread medial necrosis without damage to the endothelium (Tagami et al., 1987).
After the manifestation of brain infarction, histologic examination showed typical vascular damage, such as hyaline degeneration of small intracerebral arterioles of less than 30 μm in diameter and subintimal deposition of fibrinoid material in neocortical infarct, and, to a lesser extent, in the basal ganglia (Ogata et al., 1981). Such fibrinoid vascular lesions, in which damaged endothelial and smooth muscle cells were replaced by fibrin-like material, were located mainly in arterial border zones, showing stenosis and occasionally thrombotic occlusion of the lumen (Fredriksson et al., 1985; Fredriksson et al., 1988). In addition, increased vascular permeability (Shibota et al., 1978; Tamaki et al., 1984) and edema (Fredriksson et al., 1987; Kalimo et al., 1986; Paschen et al., 1985a) were observed within and around such lesions. Consequently, the regulatory failure of the vasculature leading to critically reduced flow levels in circumscribed brain regions was thought to be responsible for the onset of stroke in these animals (Paschen et al., 1985a; Tamaki et al., 1984; Yamori and Horie, 1977).
In two studies, the vascular alterations developing during the asymptomatic stage of SHR and SHR-SP were shown to cause a gradual decline in CBF (Katayama et al., 1997; Yamori and Horie, 1977), which we and others (Fredriksson et al., 1984; Hoffman et al., 1982; Izuta et al., 1995; Nishiyama et al., 1976) could not confirm. It remains to be clarified whether in both of these studies this resulted from an age-dependent decrease in cerebral perfusion or was brought about by the vascular angiopathy. In other flow studies on age-matched normotensive Wistar Kyoto rats and S– SHR and SHR-SP, no differences in global in regional brain perfusion were observed between the various strains (Fredriksson et al., 1984; Hoffman et al., 1982; Izuta et al., 1995; Nishiyama et al., 1976). The regulatory capacity of brain perfusion, however, was found to be disturbed in chronic hypertension. Symptom-negative SHR showed a shift of the lower limit of CBF autoregulation, which increased the susceptibility to ischemic brain damage during hypotension (Barry et al., 1982; Sadoshima and Heistad, 1983). Another indicator of a disturbed vasodilatory response of the arterial vessels is a reduced Pco2-reactivity of brain perfusion in SHR-SP before stroke onset (Yamori and Horie, 1977). Compared with normotensive rats, the dilator reserve of cerebral collateral vessels was reduced in SHR-SP, suggesting structural differences in those vessels (Coyle, 1987). Experimental results indicate that the blood flow through cerebral collaterals is much lower in SHR-SP (Coyle and Heistad, 1986) and thereby produced larger brain infarcts after occlusion of the middle cerebral artery in SHR-SP (Coyle and Jokelainen, 1983; Coyle et al., 1984).
The results of the current study demonstrate that with the appearance of early functional deficits, regulation of brain perfusion was globally impaired, resulting in a global reduction of CBF but not in local flow deficits. With the reservation that the use of cryostat sections for light microscopic examinations might obscure minor histopathologic changes, morphologic lesions could be excluded. The decompensation of global blood flow may be related to the structural alterations of the vascular system, but changes in cerebrovascular reactivity to arterial Pco2 cannot be excluded (Yamori and Horie, 1977). It also has to be considered that the decline of global CBF in S+ SHR-SP could be coupled with reduced rates in glucose consumption resulting from the impairment of motor activity. Finally, abnormalities in the renin-angiotensin system should be considered. Because both the systemic and cerebral renin-angiotensin system play an important role in hypertension-induced vascular and cerebral lesions (Pinto et al., 1998) and because treatment with angiotensin I converting enzyme blockers is effective in preventing or delaying the onset of cerebral stroke (Harper, 1987; Hoffman et al., 1982; Yamori et al., 1975b), such therapy may provide further insights into the mechanisms of flow impairment. Experimental evidence shows that treatment of SHR-SP with angiotensin I converting enzyme inhibitors resets both the lower and upper limits of autoregulation by acting on the cerebrovascular endothelium (Barry et al., 1984; Vorstrup et al., 1984). Further studies are therefore warranted to clarify whether angiotensin I converting enzyme inhibition is effective in normalizing brain perfusion after the occurrence of early functional deficits, and whether this treatment could be used to prevent the subsequent manifestation of brain infarcts.
In conclusion, the results of the current study demonstrate that in SHR-SP, functional symptoms appear before the manifestation of brain infarcts and that these symptoms are initiated by a global decline in CBF and cortical and striatal CPS. This supports the hypothesis that the genetic abnormality in this strain (i.e., the quantitative trait locus STR1 on rat chromosome 1 [Rubattu et al., 1996]) is associated with a global vascular process and that acute focal decompensation of blood flow and metabolism occurs at a later stage of the disease process.