
Abstract
Positron emission tomography (PET) has hitherto been used to examine D2 dopamine receptor binding in the striatum, a region with a high density of receptors. Research has been hampered by the lack of suitable radioligands for detection of the low-density D2 dopamine receptor populations in the limbic and cortical dopamine systems that are implicated in the patophysiology of schizophrenia. [11C]FLB 457 is a new radioligand with the very high affinity of 20 pmol/L (Ki) for the D2 and D3 dopamine receptor subtypes. This study in eight healthy subjects was designed to evaluate the suitability of [11C]FLB 457 for quantification of extrastriatal D2/D3 dopamine receptors. PET-data were acquired in the three-dimensional mode and the arterial input function was corrected for labeled metabolites. The standard three-compartment model and four derived approaches were applied to calculate and compare the binding potentials. Besides the striatum, conspicuous radioactivity was found in extrastriatal regions such as the thalamus, the anterior cinguli, and the temporal and frontal cortices. The time activity curves could be described by the three compartment model. The different approaches gave similar binding potential values and the rank order between regions was consistent with that found in vitro. The short time of a PET measurement using [11C]FLB 457 (63 minutes) seemed not to be sufficient for reliable determination of the high binding potential in the striatum. These results are of principal importance because they show the potential for PET quantification of minute receptor populations in the human brain.
The dopamine neurotransmission system is of outmost interest in research on neuropsychiatric disorders. The striatum has a key role in movements disorders whereas several experimental and clinical studies in schizophrenia rather point to a disturbed function of limbic and cortical dopaminergic neurotransmission (Davis et al., 1991; Stevens, 1991; Reynolds, 1992; Weinberger et al., 1992; Okubo et al., 1997). Extrastriatal dopamine receptors, in addition, have since long been proposed as targets for antipsychotic drugs (Anden and Stock, 1973; Costall and Naylor, 1976; Bunney, 1984; Janowsky et al., 1992; Fibiger, 1994; Deutch and Duman, 1996). Consequently, the quantification and visualization of extrastriatal dopaminergic parameters represents an identified objective of future positron emission tomography (PET) research in schizophrenia.
In studies with PET, the striatum has been a feasible target for quantitative measurements mainly because of the regions high concentration of dopamine receptors (Hall et al., 1994; Gurevich and Joyce, 1999) and relatively large size. Quantification of dopamine receptors in extrastriatal regions has been hampered by the low receptor density which in most such regions is 1 to 10% of that in the striatum, i.e., 0.5 to 3 pmol/g tissue (Lidow et al., 1989; Hall et al., 1991; Kessler et al., 1993; Hall et al., 1996a; Gurevich and Joyce, 1999). To accurately measure such small densities in regions of which some have limited volume, the radioligand used should have very high affinity, thus providing a signal to noise ratio which is sufficiently large for reliable detection of low receptor densities.
[11Clraclopride and [11C]NMSP are the radioligands that have been most widely used for PET measurements of D2-like receptors (Wagner et al., 1983; Farde et al., 1985). A limitation of [11C]raclopride is the comparatively low affinity for D2 receptors (l to 2 nmol/L). [11C]NMSP has higher affinity (0.1 to 0.3 nmol/L) but also binds to 5HT2 and α1 receptors. Despite these limitations, attempts have been made to use these ligands for visualization of extrastriatal dopamine receptors (Yosef et al., 1995; Volkow et al., 1997).
We recently developed [11C]FLB 457, a substituted benzamide with the very high affinity of 0.02 nmol/L for D2 and D3 dopamine receptors in vitro, whereas the affinity to other putative central receptors is negligible (Halldin et al., 1995a). Initial PET studies in Cynomolgus monkeys, healthy subjects, and antipsychotic drug—treated patients indicate that [11C]FLB 457 binds specifically to dopamine receptors and that binding in extrastriatal regions satisfies the condition of transient equilibrium during time of PET measurement (Hall din et al., 1995a; Farde et al., 1997b).
The primary goal of the present study was to evaluate the suitability of [11C]FLB 457 for quantification of D2 and D3 receptor binding in extrastriatal brain regions. The standard three-compartment model (3-CM) and four derived approaches were used and compared in an attempt to select the most appropriate method for applied quantitative studies. The validity of the cerebellum as a reference region devoid of specific binding sites was specifically examined.
METHODS
Subjects
The study was approved by the Ethics and the Radiation Safety committee of the Karolinska Hospital. Eight male subjects, ages 23 to 38 years, participated in one PET measurement after giving informed consent. They were healthy according to history, physical examination, psychiatric interview, blood and urine analysis, and magnetic resonance imaging (MRI) of the brain. They did not use any medication. All participants were nonsmokers.
MRI and the head fixation system
The MRI system used was GE Signa, 1.5 tesla. T2-weighted and proton density MRI scans of the brain were obtained for all subjects. A head fixation system with an individual plaster helmet was used both in the PET and MRI measurements to allow the same head positioning in the two imaging modalities (Bergström et al., 1981).
Radiochemistry
[11C]FLB 457 was synthesized as described previously (Halldin et al., 1995a). The specific radioactivity at the time of intravenous injection varied between 1081 and 2086 Ci/mmol. The radioactivity injected was 189 to 299 MBq. This corresponds to a injected mass of 1.1 to 2.1μg.
Arterial blood sampling
To obtain the arterial input function, an automated blood sampling system was used during the first 5 minutes of each PET measurement (Eriksson et al., 1988). Thereafter, arterial blood samples were taken manually at the midpoint of each frame until the end of the measurement (Farde et al., 1989). The experimentally defined difference between appearance of radioactivity in the automatic blood sampling system and brain was about 10 seconds.
Determination of radioactive metabolites in plasma
The fractions of plasma radioactivity corresponding to unchanged [11C]FLB 457 and labeled metabolites were determined as has been described recently (Halldin et al., 1995a; Halldin et al., 1995b). In short, arterial blood samples (2 m) were drawn at 4, 10, 20, 30, 40, 50, and 60 minutes after injection. The supernatant obtained after centrifugation was deproteinized with acetonitrile. It was then analyzed by gradient high performance liquid chromatography on a reverse phase column (Waters μ-Bondapak C18; 7.8 × 300 mm, 10 μm) and eluted at 6 mL/min over 9 minutes with acetonitrile/0.01 mol/L phosphoric acid, using a gradient of 10/90 to 70/30 acetonitrile from 0 to 6.5 minutes and back to 10/90 at 7.5 minutes. The radioactivity in a certain fraction was expressed as the percentage of the total radioactivity in plasma.
PET experimental procedure
The PET system used was Siemens ECAT Exact HR which was run in the three-dimensiomil mode (Wienhard et al., 1994). The in plane and axial resolutions is about 3.8 mm and 4.0 mm, respectively, full width at half maximum. The reconstructed volume was displayed as 47 sections with a center to center distance of 3.125 mm.
In each PET measurement, the subject was placed recumbent with his head in the PET system. A cannula was inserted into the left brachial artery and another cannula into the right ante-cubital vein. A sterile physiologic phosphate buffer (pH = 7.4) solution containing [11C]FLB 457 was injected as a bolus during 2 seconds into the right cubital vein. The cannula was then immediately flushed with 8 mL saline.
Brain radioactivity was measured in a series of consecutive time frames for up to 63 minutes. The frame sequence consisted of three 1-minute frames followed by four 3-minute frames and eight 6-minute frames.
Regions of interest
Regions of interest (ROIs) were delineated according to anatomic boundaries on the MRI and transferred to the corresponding reconstructed PET images. ROIs were chosen for brain regions of interest in schizophrenia research, and were defined for the putamen, the thalamus, the lateral temporal cortex, the anterior cinguli, the frontal cortex, and the cerebellum. The ROIs for the cerebellum were drawn in three adjacent sections, the ROIs for the other regions in four to five adjacent sections. Data were pooled so that the average radioactivity concentration for the whole volume of interest was obtained. To obtain regional time-activity curves (TACs), regional radioactivity was calculated for each frame, corrected for decay, and plotted versus time.
Cerebral blood volume
The tissue TAC were corrected for the effect of radioactivity in the cerebral blood volume (CBV). A reference value of 4% for regional CBV (Phelps et al., 1979) was used together with the curve for measured radioactivity in arterial whole blood. The thereby calculated radioactivity in CBV was then subtracted from the regional TAC before the kinetic analyses.
Quantitative analyses
The standard 3-CM and four derived approaches were used and compared in an attempt to select the most appropriate method for applied quantitative studies. The binding potential (BP) was the parameter compared.
Kinetic analysis—BPDirect
Radioligand binding to receptors has often been interpreted using the general four-compartment model. The four compartments correspond to the radioactivity concentrations of unchanged radioligand in plasma (CP), free (unbound) radioligand in brain (CF), nonspecifically bound radioligand in brain (CNS) and radioligand specifically bound to receptors (CB). All concentrations have the dimension nCi/mL and all compartments are assumed to be homogeneous in concentration.
One common assumption is that the concentrations in CNS and CF equilibrate rapidly to form one effective compartment (Wong et al., 1986). This compartment corresponds to nondisplaceable radioligand in brain (CN). The thereby simplified model with three compartments and four first order rate constants k1, k2, k3, and k4 was used to describe the TACs for [11C]FLB 457 binding in the brain (Fig. 1). The rate constants k1 and k2 correspond to the influx and outflux rates to and from the nonspecifically bound compartment over the blood-brain barrier, respectively. The rate constants k3 and k4 correspond to the rates of radioligand transfer between the nonspecifically bound compartment and the specifically bound compartment, respectively. The radioactivity concentration in plasma was not corrected for plasma protein binding.
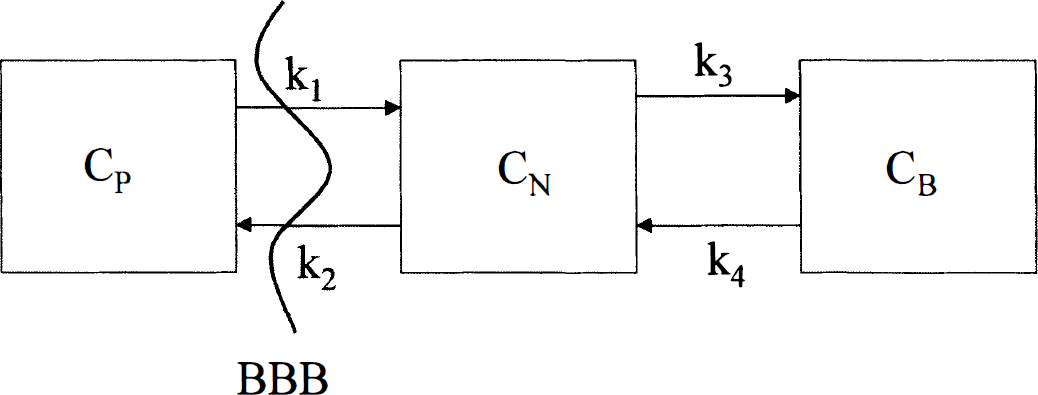
The three-compartment model used to interpret regional brain radioactivity after intravenous injection of [11C]FLB 457. BBB, blood—brain barrier.
Based on this model, the following differential equations can be expressed:


where CT(t) is the radioactivity concentration in the brain as measured by PET corrected for CBV.
The conventional strategy in kinetic PET modeling is to estimate the rate constants by fitting the model in a least square sense to the TAC obtained from the PET experiment. The differential equations were solved using a convolution approach (Lammertsma et al., 1996). All tissue points were given equal weight.
On the basis of one PET measurement with high specific radioactivity, the receptor density (Bmax) and affinity (kd) cannot be differentiated (Mintun et al., 1984). The ratio of Bmax to kd has been referred to as the BP and corresponds to the ratio k3 / k4 in the kinetic analysis. BP calculated directly from the k3 and k4 of the 3-CM analysis is referred to as BPDirect. The BP was also calculated accordingly to the following four approaches.
The volume of distribution—BPIndirect
[11C]FLB 457 binding was also expressed using the concept of the total volume of distribution, Vt, which is defined as:
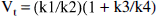
The rate constants obtained from the 3-CM analysis were entered into Eq. 4 to yield Vt.
Apart from the above-mentioned direct estimation of the BP, the BP was calculated in an indirect manner. The ratio of the Vt in the ROI (VtROI) and the Vt in the cerebellum (VtCBL) was used in the following equation and referred to as BPIndirect:
The reference tissue model—BPRefA and BPRefB
According to this approach, the time activity curve for a region devoid of receptors, CREF, is used as an indirect approximation of the plasma input function, CP. With the assumption that the ratio k1 / k2 is the same in this region as in the target ROI, an expression of CT and CREF can be derived (Lammertsma et al., 1996). The expression includes the BP and is solved in a convolutional manner and fitted to the obtained data in a least square sense. The BP calculated with this approach is referred to as BPRefA in the present study.
Lammertsma and Hume have introduced a simplification of the above-mentioned reference tissue model. The tissue ROI is approximated by a single compartment and the parameters required for a model fit is thereby reduced from four to three (Lammertsma and Hume, 1996). The BP obtained is referred to as BPRefB.
The linear graphical analysis—BPLogan
[11C]FLB 457 binding was also analyzed using the linear graphic analysis for reversible ligand binding to receptors that has been developed by Logan et al (Logan et al., 1990). The slope of the linear phase of the obtained plot corresponds to the total distribution volume, Vt, of the ligand plus the plasma volume. The regional distribution volume (DV) was determined from the slope and the binding potential was calculated as follows using cerebellum as reference region:

The transient equilibrium approach—BPEq
The ratio CB / CN is equal to the BP when d CB / dt = 0. This moment is called transient equilibrium since, theoretically, at that very moment the number of molecules associating to the receptors is equal to the number that dissociate from the receptors (Farde et al., 1989). The cerebellum is a brain structure with low density of D2 and D3 receptors (Hall et al., 1996a; Hall et al., 1996b). The radioactivity concentration in the cerebellum was therefore used as an estimate for CN(t). CB(t) was defined as CT(t) minus CN(t). However, because of the flat shape of CB(t), transient equilibrium could not be reliably defined for all curves. Instead, the area under the TAC for CB(t) and CN(t) during the time interval 27 to 63 minutes was used to calculate BPEq.
The cerebellum as reference region
The cerebellum is a region with very low density of D2 and D3 receptors in the human brain in vitro (Hall et al., 1996a; Hall et al., 1996b). In a region devoid of specific binding sites, which thus do not have the specific binding compartment, a two-compartment model (2-CM) with two rate constants, should be sufficient to describe the TAC. To evaluate if specific binding in the cerebellum can be regarded as negligible, both a two-compartment two-parameter fit and a three-compartment four-parameter fit were applied for this region (Farde et al., 1989). To compare the two models we performed an F-test and applied the Akaike information criterion (AIC) (Akaike, 1974) and the Schwarz criterion (SC) (Schwarz, 1978) on the squared differences between model output and obtained data.
RESULTS
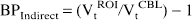
After injection of [11C] FLB 457 with high specific radioactivity, the radioactivity appeared rapidly in brain (Fig. 2). The highest radioactivity concentrations were observed in the striatum. Low but conspicuous radioactivity was found in extrastriatal regions such as the thalamus, the temporal cortex, the anterior cingulate, the frontal cortex, and the cerebellum (Fig. 3). Furthermore, slightly higher uptake of radioactivity than in the cerebellum was observed in other extrastriatal regions such as the amygdala, the substantia nigra, the colliculi, the tuberculum olfactorium, and the pituitary (data not shown). The TACs for all regions but the putamen reached a peak within the time span of the PET measurement. The ratio of the radioactivity in the putamen to cerebellum at the end of the measurement was 10.8±5.3 (mean±SD). In the different extrastriatal regions the ratio varied between 2.1 and 4.5 (mean, n = 8).
Positron emission tomography images showing horizontal, coronal, and axial sections through the caudate putamen level after intravenous injection of [11C]FLB 457 in a healthy subject. The images are summation images of frames 6 to 15, i.e., 9 to 63 minutes.
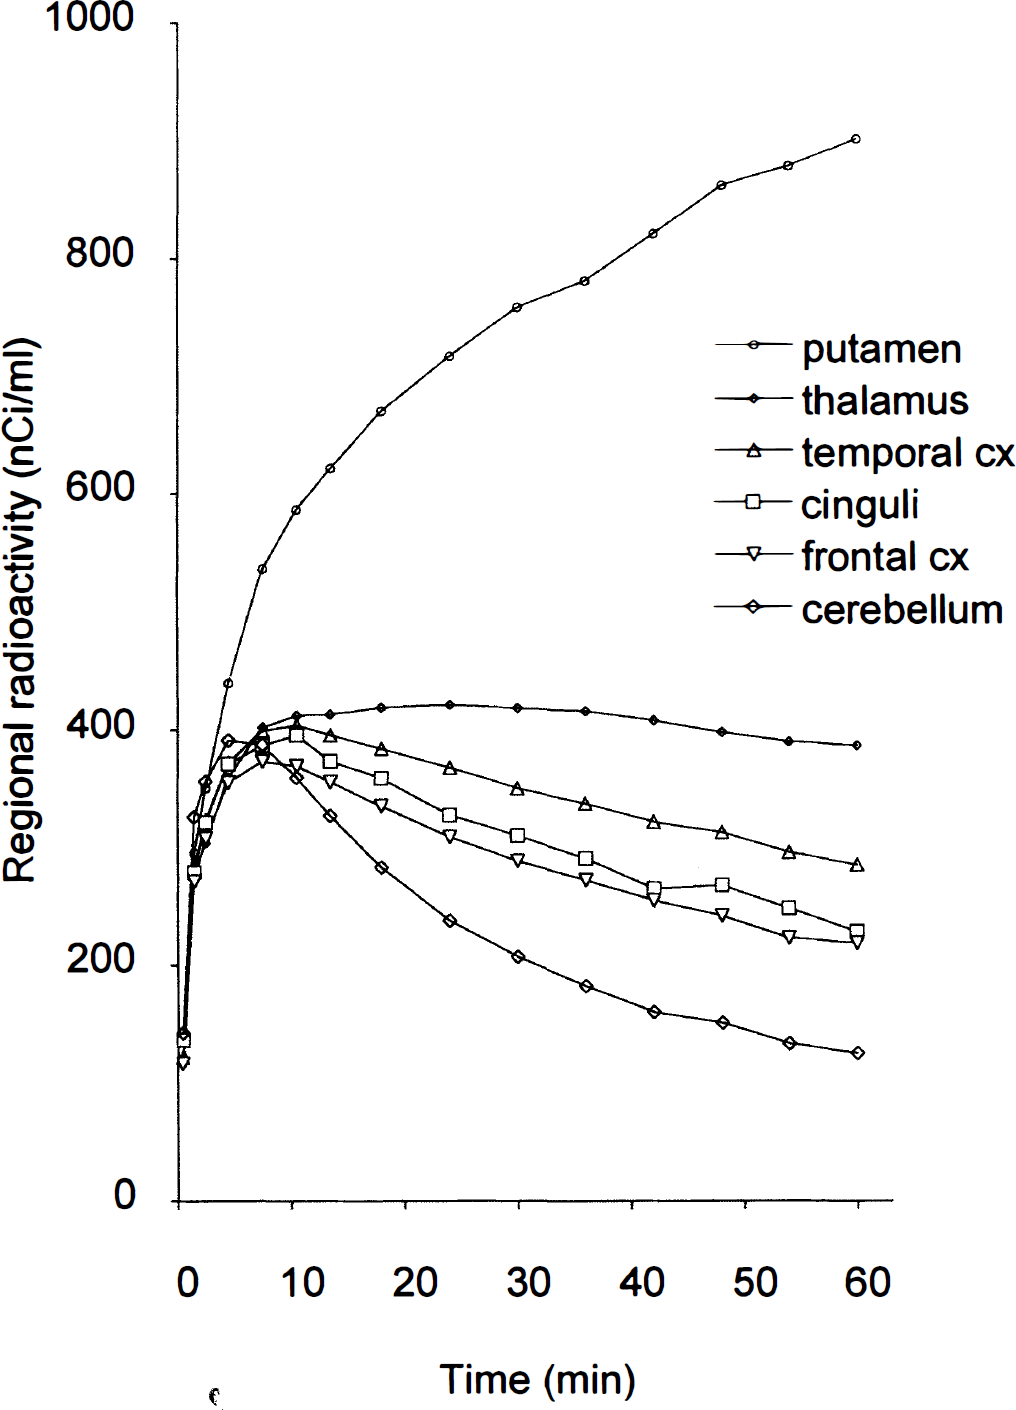
Measured time activity curves for the putamen and extrastriatal regions of interest after intravenous injection of [11C]FLB 457 in one healthy subject.
The plasma radioactivity curves were corrected for labeled metabolites and plotted versus time (Fig. 4). There was a rapid decrease of radioactivity during the first 5 minutes after radioligand injection. After this time, the radioactivity decreased at a slower rate. The fraction of unmetabolized [11C]FLB 457 in plasma decreased throughout the whole measurement and was about 25% at 60 minutes (Fig. 5). Besides hydrophilic metabolites, that cannot pass the blood-brain barrier, approximately 5% of the plasma radioactivity at 60 minutes represented a lipophilic metabolite.
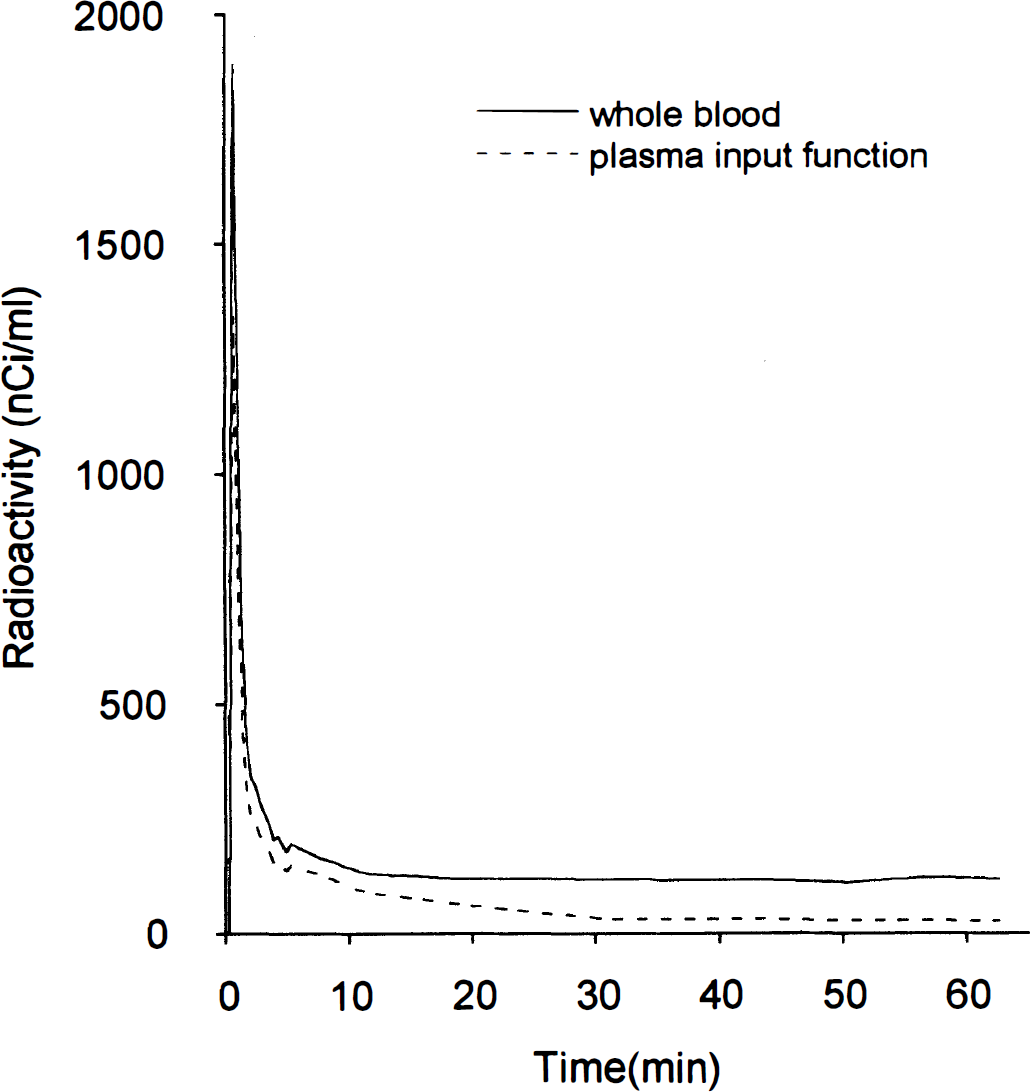
Time curves showing radioactivity in whole blood and plasma after intravenous injection of [11C]FLB 457 in one healthy subject. The plasma curve was corrected for metabolites.
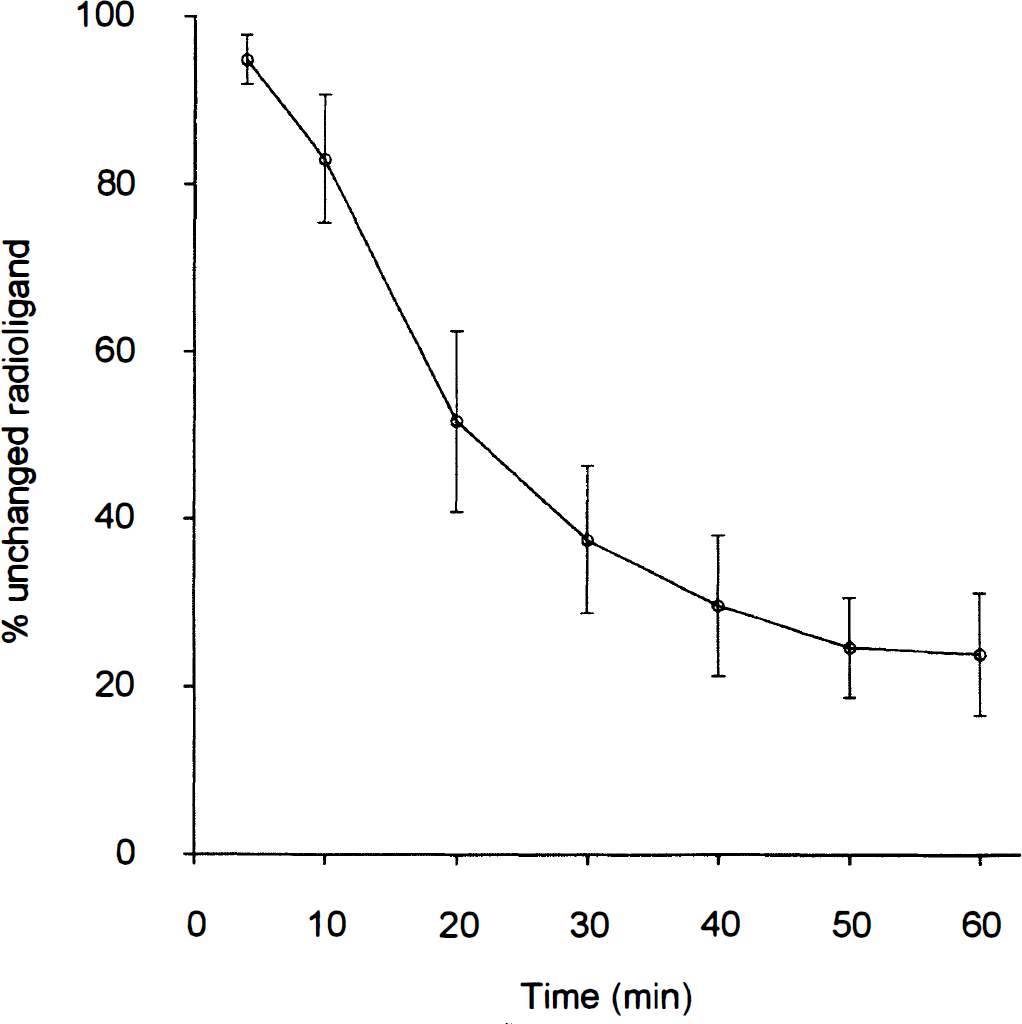
Time curve for the percentage of radioactivity in plasma representing unchanged [11C]FLB 457 in eight healthy subjects (mean±SD).
The TAC for all extrastriatal brain regions could be described by the 3-CM. The estimated rate constants are given in Table 1. The fit of the 3-CM to the putamen gave low k2 and k4 values as compared to other regions.
Rate constants obtained by the kinetic 3CM analysis of [11C]FLB 457 binding (mean ± SD, N = 8)
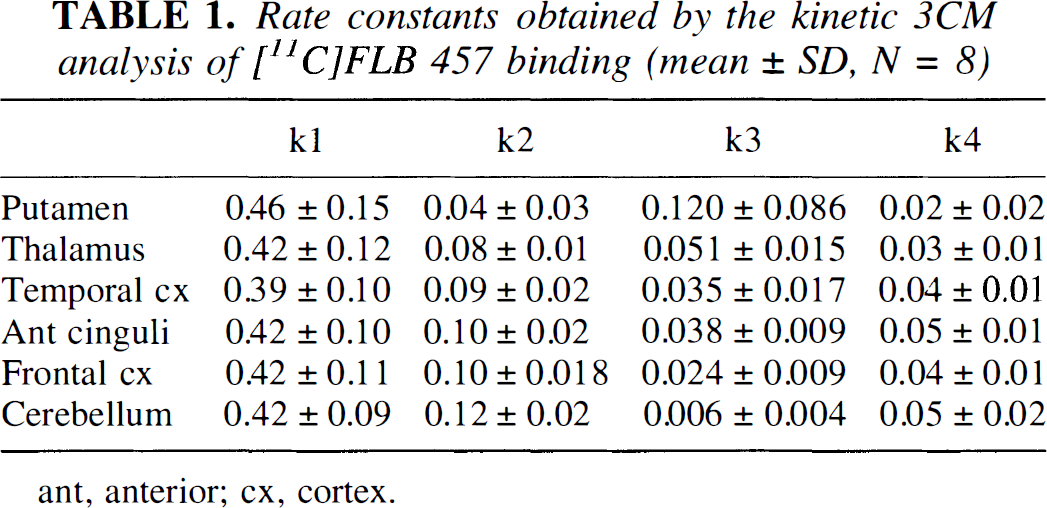
ant, anterior; cx, cortex.
The total volume of distribution, Vt, and the distribution volume, DV, obtained by the line graphical analysis are given in Table 2. In the graphic analysis a linear phase was observed for all extrastriatal regions. In the putamen the line was almost vertical, however, and reliable calculations of DV for this region could accordingly not be made.
Comparison of the total distribution volume (Vt) calculated using rate constants from the kinetic 3-CM and the linear graphical analysis (DV) (N = 8)
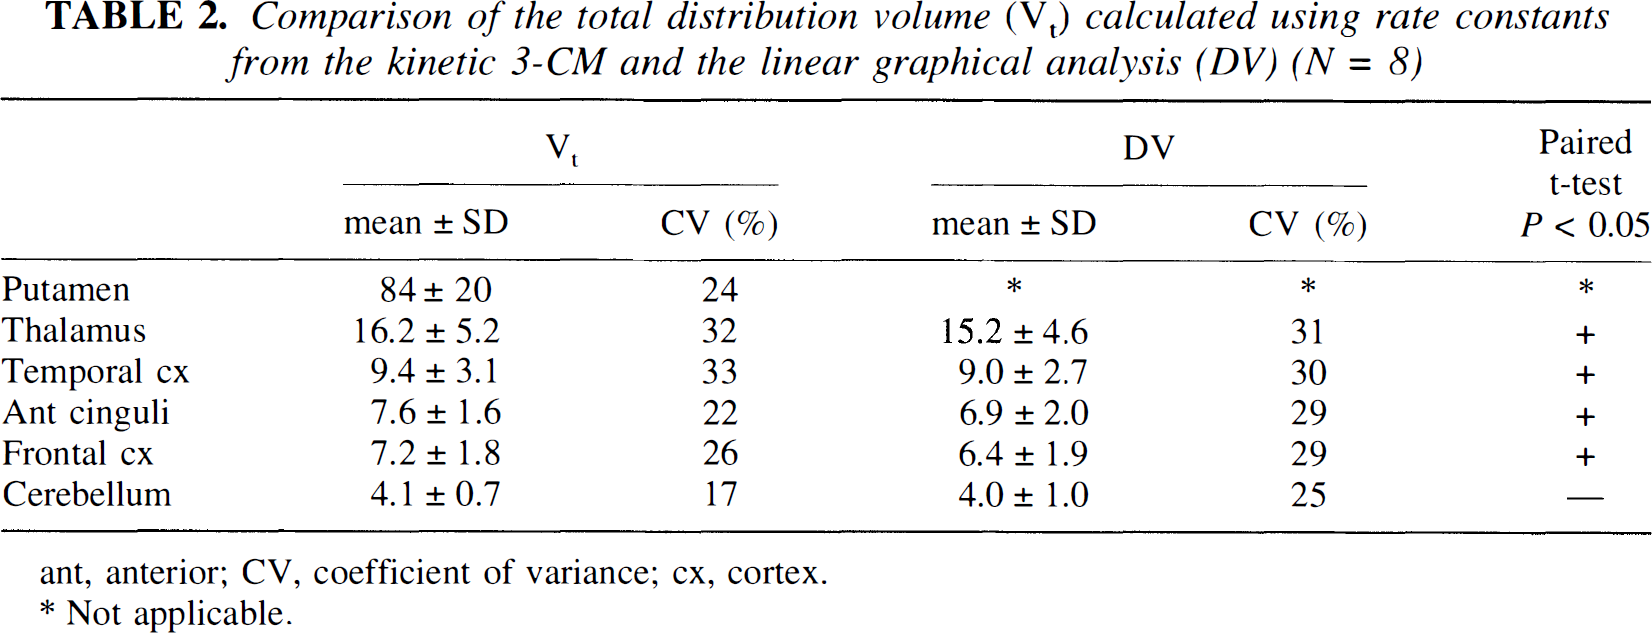
ant, anterior; CV, coefficient of variance; cx, cortex.
Not applicable.
The BP obtained by the five approaches are presented in Table 3 and Fig. 6. The binding potentials showed the same rank order for all subjects and spanned from 0.17 in the cerebellum to 20.2 in the putamen. For the putamen, the indirect kinetic analysis and the reference tissue model gave larger BP values than any of the other approaches. The coefficients of variance in extrastriatal regions were largest for BPOirect and smallest for BPLogan. The TAC for the cerebellum could be described by a 2-CM (Fig. 7). The F statistics did not reject the null hypothesis, i.e., the mean of squared errors of the two models were not significantly different. The AIC and SC did not show significantly different values for the 2-CM and the 3-CM.
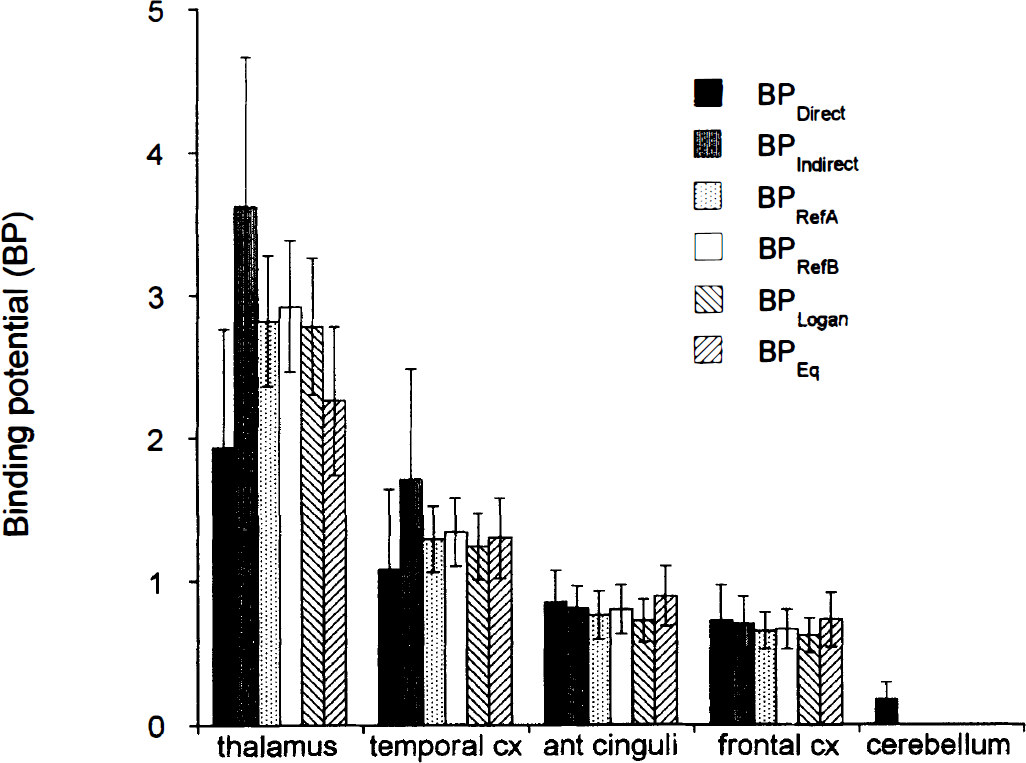
[11C]FLB 457 binding potentials in extrastriatal regions. Five different approaches were applied on data from eight healthy subjects.
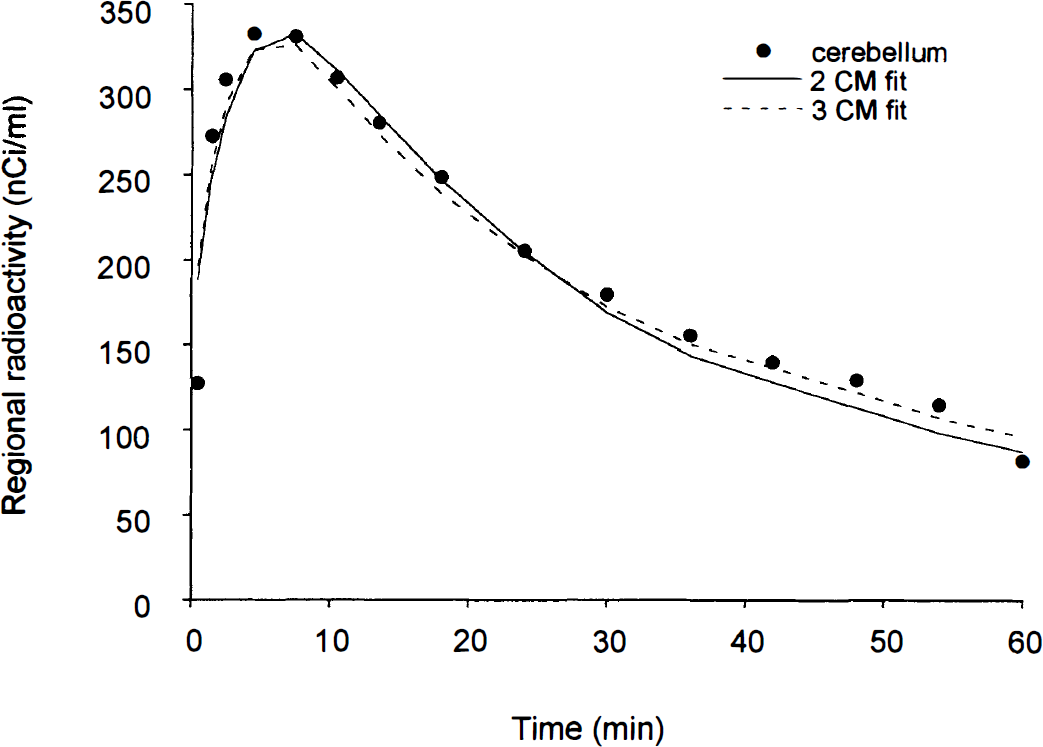
Two- and three-compartment model fit of measured radioactivity in the cerebellum in one healthy subject after intravenous injection of [11C]FLB 457.
Binding potential (BP) of [11C]FLB 457 binding in the human brain calculated with five different approaches (N = 8)
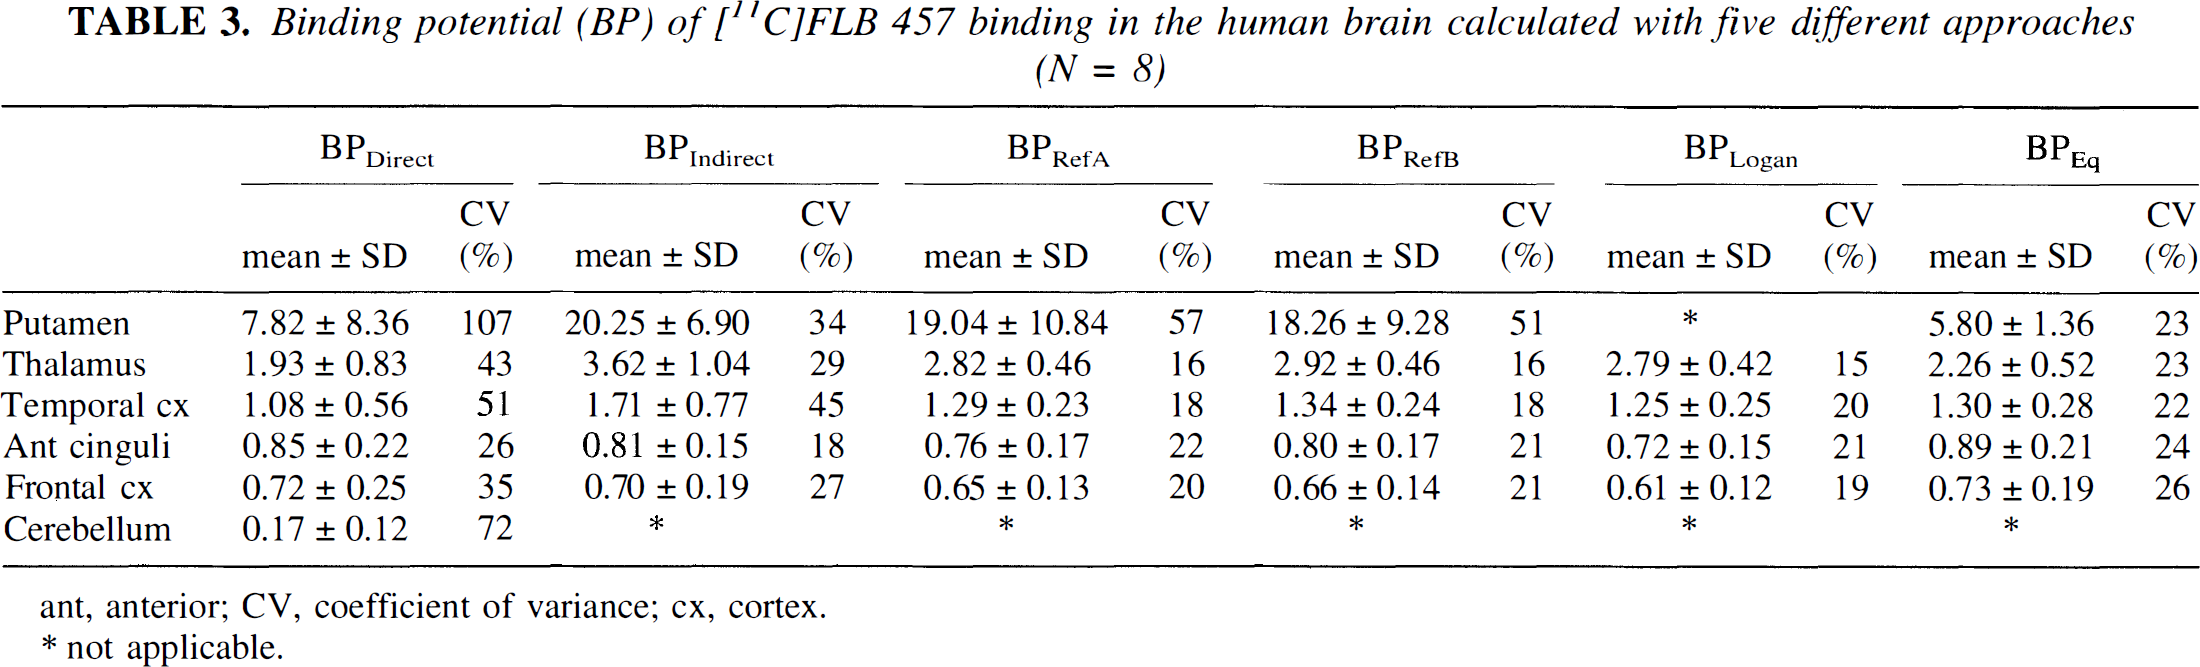
ant, anterior; CV, coefficient of variance; cx, cortex.
not applicable.
DISCUSSION
After injection of [11C] FLB 457 there was a marked uptake of radioactivity not only in the striatum, but also in several extrastriatal regions. The common affinity of FLB 457 to D2 and D3 dopamine receptors (Halldin et al., 1995a) implies that the regional radioactive uptake represents binding to any or both of these subtypes. D3 dopamine receptors as shown in the post mortem human brain are restricted mainly to the ventral striatum and the Islands of Calleja (Sokoloff et al., 1990; Bouthenet et al., 1991; Landwehrmeyer et al., 1993; Murray et al., 1994; Gurevich and Joyce, 1999). The distinct anatomic distribution of D3 receptors supports the view that [11C]FLB 457 binding in all other regions represents binding to D2 dopamine receptors only.
Striatum
The D2 receptor density in the striatum is 10 to 100 times higher than in any of the extrastriatal regions (Kessler et al., 1993; Hall et al., 1996a; Gurevich and Joyce, 1999). As evident from Fig. 3 the TAC for the putamen increased throughout the whole measurement. However, the 3-CM fit gave low values for the rate constants k2 and k4 as compared to the values for the extrastriatal regions. Furthermore, the rate constant k3 was lower than that expected from the high receptor density in the putamen (Kessler et al., 1993). In particular, the low rate constant k3 resulted in BP values with the direct kinetic approach that were smaller than the values obtained with several of the other methods. Moreover, the BPDirect calculated in the present study showed high standard deviations and high coefficients of variance. Of interest is a similar observation reported for [11C]raclopride binding showing that BPDirect correlates poorly with the BPlndirect' BPRefA or BPEq (Lammertsma et al., 1996). A suggested reason for this low correlation was a relatively poor separation between the 2-CM and 3-CM in the putamen resulting in low reliability of the parameter BP.
This instability of the BP parameter as a suggested consequence of poor separation of the 2-CM and 3-CM can be considered further in relation to the nondisplaceable compartment, CN. When the TAC in a region with a very high density of specific binding sites steadily increases, the derivative of the curve will be positive and large. The TAC for CN can be calculated by the equation:

As seen from Eq. 7, when dCT(t)/dt is large, as in the early phase of [11C]FLB 457 binding in the striatum, the TAC for CN will be small (Fig. 8). The information contained in the time activity curve will thus not be sufficient for an adequate estimate of the individual model parameters in the three compartment model.
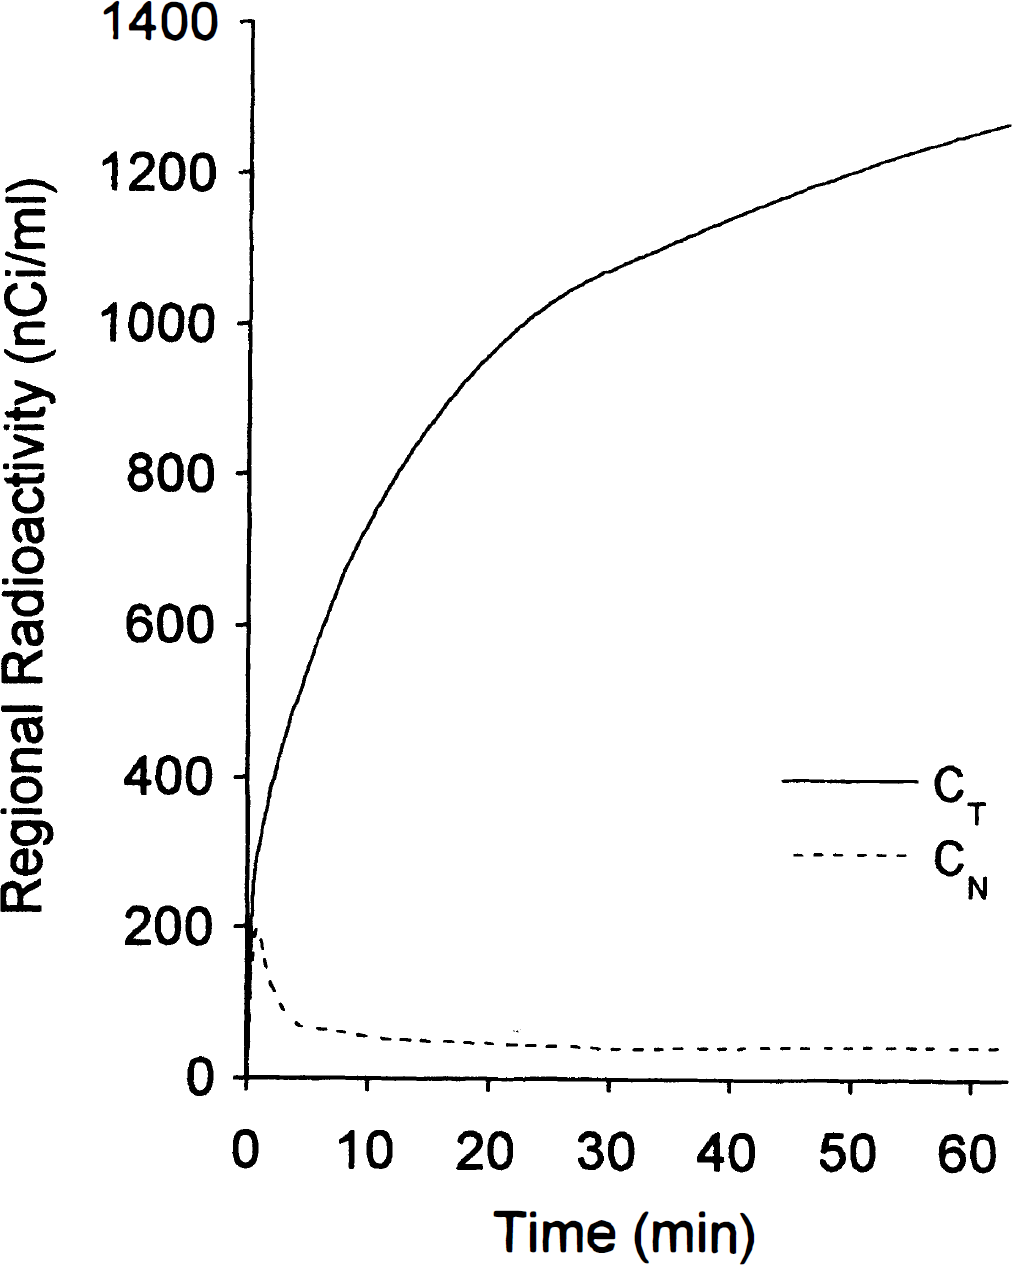
Simulated time activity curves for the three-compartment model in a region with high density of receptors. Notice the small nonspecifically bound compartment produced.
Using single-photon emission tomography and e23I]epidepride, a close analog to [11C]FLB 457, equilibrium conditions were suggested in the human striatum at approximately 5 hours postinjection (Kuikka et al., 1997). Furthermore, despite 5 hours of data acquisition, equilibrium was not reached in the striatum of baboons examined with PET and [76Br]FLB 457 (Loc'h et al., 1996). The length of measurement in the present study was 63 minutes, which in all probability is very short as compared to the time required for transient equilibrium in the caudate putamen.
Extrastriatal regions
The BP of [11C]FLB 457 was found to be highest in the putamen, followed by the thalamus, the temporal cortex, the anterior cinguli, the frontal cortex, and the cerebellum. The rank order for the BP in extrastriatal regions presented in the present study is consistent with the rank order for dopamine D2/D3 receptor density in vitro in the human brain using the closely related analog [125I]epidepride (Kessler et al., 1993; Hall et al., 1996a).
The TACs for all extrastriatal regions could be described by the 3-CM and the five different approaches showed similar BP for all ROIs (Table 3). This was expected since all approaches are derived from the same basic 3-CM.
The calculated DV was for all regions but the cerebellum statistically smaller (P < .05, paired t-test) than the Vt obtained by the kinetic approach, An explanation for this difference might be given by the observation that k2 was much larger than k4. At such conditions the DV has been shown to be lower than the systems Vt even though the Logan plot shows a linear phase (Leenders et al., 1997).
The coefficients of variances (CV) were in the order of 30% for the estimated DV values (Table 2). In a previous extensive PET study the interindividual variability of striatal receptor density measured with [11C]raclopride was shown to be three-fold for a similar group of healthy subjects (Farde et al., 1995). Our observation of a 30% CV of the DV in extrastriatal regions is close to the 22 to 26% CV obtained for raclopride binding in the putamen, a large striatal region with a high density of receptors. The most likely interpretation of the CV obtained in the present study is a considerable biological variability in extrastriatal D2-dopamine receptor density. The variability is by itself a promising condition for research on receptor density in relation to brain function (Farde et al., 1997a).
Transient equilibrium
Theoretically, at the time of transient equilibrium, the ratio CB/CN is a measure of the BP (Farde et al., 1989). However, using [11C]FLB 457 the equilibrium time could not be reliable defined because of the flat shape of the TAC for the specifically bound compartment. Moreover, at transient equilibrium, the slope of the CB/CN ratio was high, i.e., a small error in the identification of the equilibrium point would lead to a large error in the CB/CN ratio. Therefore, to obtain reliable BP we used a time interval that included the time of transient equilibrium. The operational choice of 27 to 63 minutes gave BP values that were consistent with those obtained by the different kinetic methods. Larger samples are needed to determine an optimal time interval for use in routine studies as has been performed previously for [11C]raclopride binding in the putamen (Nakashima and Farde, 1995). Because of pre-equilibrium conditions in the striatum, the low BP values obtained with the transient equilibrium approach should be regarded as underestimated values.
Cerebellum
In the present study the cerebellum was used as a reference region in four out of five approaches. The critical assumption is that the cerebellum is devoid of specific binding sites. This assumption is supported by in vitro findings of very low D2 receptor density in the cerebellar cortex when examined with [125I]epidepride (Hall et al., 1996a) or [125I]NCQ 298 (Hall et al., 1991). However, in situ hybridization in the human brain suggests some expression of mRNA for the D3 receptor in the cerebellar cortex (Suzuki et al., 1998). The existence of minute densities of D2 and D3 receptors in the cerebellum can thus not be excluded on the basis of available in vitro studies. Although the D2 and D3 receptor densities in all probabilities are extremely low in the cerebellum, the very high affinity of [11C]FLB 457 for these receptors might be sufficient to yield a signal representing specific binding. However, it has previously been shown that haloperidol has no evident effect on [11C]FLB 457 binding in the human cerebellum (Farde et al., 1997b).
By using the rate constants obtained with the 3-CM, the TAC for CN can be generated. In the cerebellum it can be calculated that 90±5% of the area under the curve of the total radioactivity represents CN (Fig. 9). This about 10% difference between CT and CN may represent specific binding, kinetically distinguishable nonspecific binding and/or heterogeneity within the sampled cerebellum (i.e., gray and white matter). The explanation that there is a small amount of kinetically distinguishable nonspecific binding would be supported if there was a somewhat different dissociation rate constant (k4) for the cerebellum as compared with the regions containing dopamine receptors. In the present study, the k4 for the cerebellum was not markedly different from the k4 in extrastriatal regions, an observation that does not support the existence of kinetically distinguishable nonspecific binding in the cerebellum. Heterogeneity within the cerebellum would produce parallel rather than sequential compartments. The mixture of white and gray matter in one sampled ROI may thus mimic the observed discrepancy between CT and CN in the cerebellum.
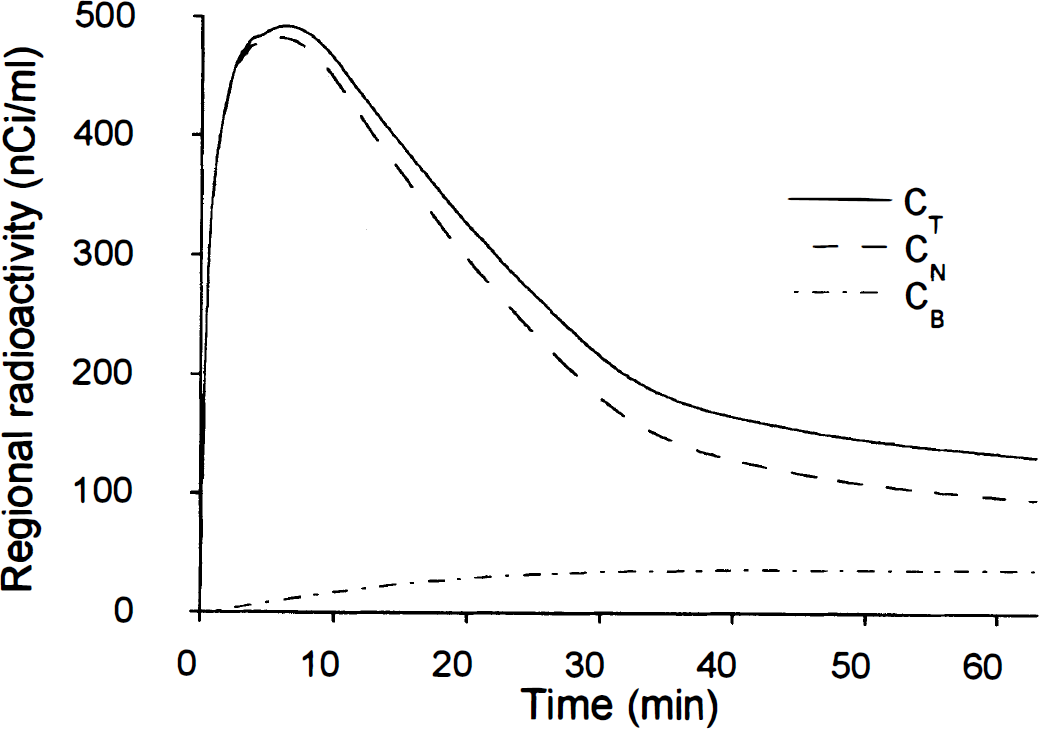
CT, CN, and CB in the cerebellum in one healthy subject. The time activity curves were generated with the rate constants obtained from the kinetic analysis.
A 2-CM should sufficiently describe the TAC in a region devoid of specific binding sites and the addition of a third compartment should not significantly improve the model fit. The AIC and SC were not significantly different between the 2-CM and 3-CM. Furthermore, the F-test showed no significant difference between the two models. In conclusion, although specific binding cannot be excluded for the cerebellar cortex, the statistical analysis does not support this.
The fraction of unmetabolized [11C]FLB 457 in plasma decreased continuously (Fig. 5). Approximately 5% of the plasma radioactivity at the end of measurement represented a lipophilic metabolite. This metabolite has likely a lactam structure in similarity with the major metabolite (5 to 25% at 42 minutes) of raclopride (Halldin et al., 1995b). In a monkey study with the 11C-labeled lactam metabolite of raclopride we found that about 1 % entered the brain (Swahn et al., 1997). The present quantitative analyses were based on the assumption that the possible appearance in brain of a lipophilic metabolite of [11C]FLB 457 is not of quantitative importance.
In summary, [11C]FLB 457 can be used to visualize and quantify low density dopamine receptor populations in the human brain. The distribution of radioactivity is consistent with the known distribution of dopamine D2 and D3 receptors. The standard 3-CM and its derived approaches seem to be applicable in extrastriatal regions and the rank order for the BP values was the same as that for the density of dopamine D2 receptors found in vitro. Because there was no strong support for specific binding in the cerebellum, simplified quantitative methods that make use of the cerebellum as reference region should be useful for applied studies. Several recently discovered neuroreceptors are expressed in low density in the human brain. This study is of principal importance because it shows the feasibility of quantitative brain imaging of such minute receptors populations.
Footnotes
Acknowledgments
The authors thank the members of the PET group at the Karolinska Institutet in Stockholm and Kjerstin Lind for technical assistance.