
Abstract
The novel mGluR agonist L Y354740 and a related analogue LY379268 are selective for mGluR2/3 receptors and are centrally active after systemic administration. In this study, rates of local cerebral glucose use were measured using the [14C]2-deoxyglucose autoradiographic technique to examine the functional consequences of their systemic administration in the conscious rat. Both LY354740 (0.3, 3.0, 30 mg/kg) and LY379268 (0.1, 1.0, 10 mg/kg) produced dose-dependent changes in glucose use. After LY354740 (3.0mg/kg), 4 of the 42 regions measured showed statistically significant changes from vehicle-treated controls: red nuclei (−16%), mammillary body (−25%), anterior thalamus (−29%), and the superficial layer of the superior colliculus (+50%). An additional 15 regions displayed significant reductions in function-related glucose use (P < .05) in animals treated with L Y354740 (30 mg/kg). LY379268 (0.1, 1.0, 10 mg/kg) produced changes in glucose metabolism in 20% of the brain regions analyzed. Significant increases (P < .05) in glucose use were evident in the following: the superficial layer of the superior colliculus (+81 %), locus coeruleus (+57%), genu of the corpus callosum (+31%), cochlear nucleus (+26%), inferior colliculus (+20%), and the molecular layer of the hippocampus (+14%). Three regions displayed significant decreases: mammillary body (−34%), anteroventral thalamic nucleus (−28%), and the lateral habenular nucleus (−24%). These results show the important functional involvement of the limbic system together with the participation of components of different sensory systems in response to the activation of mGluR2 and mGluR3 with LY354740 and LY379268.
Glutamate, the main excitatory neurotransmitter in the mammalian CNS, acts on multiple receptors. Fast synaptic transmission is mediated via the ligand-gated cationic channels: the NMDA, AMP A, and kainate receptors (Monaghan et al., 1989; Bettler and Mune, 1995). Metabotropic glutamate receptors (mGluR) are coupled to G-proteins, and can be subdivided into three groups according to their amino acid sequence, pharmacologic properties, and transduction mechanisms (Nakanishi, 1992; Schoepp and Conn, 1993; Pin and Duvoisin, 1995). Group I mGluR (comprising of mGluR1 and mGluR5) stimulate phospholipase C, shown by the hydrolysis of phosphatidylinositol. These receptors are selectively activated by the compound 3-5-hydroxyphenylglycine (Baker et al., 1995). Group II mGluR (mGluR2 and 3) are coupled to the inhibition of adenylate cyclase, and are activated by (2R, 4R)-4-aminopyrrolidinedicar-boxylic acid (Monn et al., 1996). Group III mGluR (mGluR4, 6, 7 and 8) are also negatively coupled to adenylate cyclase, but are selectively activated by L-amino-4-phosphonobutyrate, (Nakanishi, 1992). These compounds inter alia, have been useful for investigating the properties of the mGluR in vitro, but their utility as pharmacologic tools in vivo has been limited for a number of reasons. Previous studies have shown that some selective mGluR ligands can also activate other classes of glutamate receptors (e.g., the most widely used mGluR 2/3 agonist (2S, 1′R, 2′R, 3′R)-2-(2′, 3′-dicarboxycyclopropyl) glycine is also a relatively potent NMDA receptor agonist (Wilsch et al., 1994). In addition, none of the existing compounds have shown potent central effects after systemic administration.
The novel mGluR agonist (1SR, 2SR, 5RS, 6SR)-2-aminobicyclo [3.1.0] hexane-2,6-dicarboxy late, LY354740 (Monn et al., 1997) and a heterobicyclic amino acid related to this molecule, (1R, 4R, 5S, 6R)-2-oxa-4-aminobicyclo[3.1.0]hexane-4,6-dicarboxylate, LY379268 (Monn et al., in press) are potent agonists selective for Group II mGluR (Monn et al., 1996; Schoepp et al., 1997), and effective when administered systemically, (Bond et al., 1997) although the precise anatomical sites of action of these ligands in the CNS are poorly defined. Therefore, in this study, the [14C]2-deoxyglucose autoradiographic technique (Sokoloff et al., 1977) was used to determine the functional events in the brain after the systemic administration of LY354740 and LY379268.
MATERIALS AND METHODS
Preparation of animals and measurement of local cerebral glucose use
Forty-three male SD rats (300 to 400 g) were anesthetized initially with 5% halothane and subsequently maintained with 0.8 to 1.0% halothane in a nitrous oxide and oxygen gas mixture (70:30). Polyethylene cannulae were inserted into the right femoral vein and artery to allow the injection of [14C]2-deoxyglucose and the sampling of blood, respectively. The cannulae were then passed subcutaneously and externalized at the nape of the neck. Xylocaine anesthetic gel was applied liberally to the incision sites and the cannulation incision site was sutured. The halothane anesthesia was discontinued and the rats allowed to recover from the effects of the anesthetic for a minimum of 2 hours before any further manipulation. Arterial blood pressure and rectal temperature were monitored continuously throughout the surgical procedure and heating lamps were used to maintain body temperature normothermic.
Local cerebral glucose use was measured in fully conscious, freely moving rats by means of the [14C]2-deoxyglucose technique originally described by Sokoloff et al., (1977). An intravenous pulse of 50 μCi [14C]2-deoxyglucose in 0.7 mL of saline (specific activity 55.0 mCi/mol, Amersham Life Science) was injected and timed arterial blood samples were drawn at fixed time points over the next 45 minutes. Rats were killed and their brains removed. The brains were cut serially (3: 13) into 20-m thick coronal cryostat sections and autoradiograms were generated by exposing the brain sections with medical radiographic film (Biomax MR film, Eastman Kodak Company) for 3 days, together with a series of precalibrated [14C]-methyl methacrylate standards. Local tissue concentrations of 14C (referring to the calibrated standards), and consequently local rates of glucose use, were determined in 42 separate brain regions with quantitative densitometric analysis using a computer-based densitometer (MCID, Imaging Research Inc.).
Drug administration and physiologic monitoring
The compounds LY354740 (0.3, 3.0, 30 mg/kg) and LY379268 (0.1, 1.0, 10 mg/kg) were dissolved in 0.7 mL saline (0.9%). An intravenous injection of either agent was administered 10 minutes before the injection of [14C]2-deoxyglucose. Control animals (n = 11) received vehicle (0.9% saline). Arterial blood pressure was monitored for at least 20 minutes before the pulse of [14C]2-deoxyglucose was administered and subsequently discontinued, while rectal temperature was monitored throughout the experiment. Arterial blood samples were also taken 10 minutes before, 5 and 45 minutes after drug administration for analysis of P
Data analysis
All the data were analyzed for statistical significance by analysis of variance, followed by Student's unpaired t-test. A Bonferroni correction factor of 3 was applied to the probability values to consider the comparisons between each control and drug treatment groups. Each drug was compared with contemporaneous, randomized vehicle-treated control animals.
The extent of responsiveness of each of the 42 regions to LY354740 (0.3, 3,0, 30 mg/kg) and LY379268 (0.1, 1.0, 10 mg/kg) was assessed by applying the arithmetic function
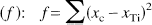
where xc is the mean of loge(glucose use) for the control group members, and xTi is the mean of loge(glucose use) for the ith dose of the treatment group, T.
This arithmetic function incorporates all the dose response data available for each of the brain regions. The rank order of responsiveness was then obtained from the derived f values. A frequency distribution of responsiveness was generated for LY354740 and LY379268. The reliability of this method of data handling has previously been described (Ford et al., 1985).
RESULTS
Physiologic parameters
The administration of LY354740 (0.3, 3.0, 30 mg/kg) and LY379268 (0.1, 1.0, 10 mg/kg) produced no detectable changes in mean arterial blood pressure or blood gas levels. However, both compounds induced a small increase in rectal temperature at 45 minutes after the administration of the agonists.
Before drug administration, all the rats exhibited signs of inquisitive behavior, with intermittent periods of movement and grooming. They all responded to auditory, visual, and tactile stimulation. After the administration of LY354740 and LY379268, marked changes in the gross behavior between the two different treatment groups of the rats were noted. No major overt changes in behavior of LY354740-treated animals were observed, although they appeared less active than the vehicle-treated controls. In contrast, animals treated with LY379268 (10 mg/kg) appeared especially hypersensitive to auditory stimuli. After the administration of the drug, the rats would appear less active with little body movement. However, noises would trigger a noticeable startle response which remained for the duration of the experiment. All animals displayed a slight stress-related increase in glucose levels 45 minutes after the administration of vehicle/drug. However, plasma glucose levels were significantly increased 45 minutes after LY379268 (10 mg/kg) compared with control levels. Similar changes in glucose levels were not detected after LY354740 administration.
LY354740 and local cerebral glucose use
LY354740 (0.3, 3.0, 30 mg/kg) produced dose-dependent changes in glucose use, which were anatomically widespread in the CNS at the highest dose (Table 1). Only one region, the superficial layer of the superior colliculus, displayed significant increases in glucose use with LY354740 while 18 regions displayed significant decreases in glucose use. No significant changes in glucose use were detected in any regions in animals treated with LY354740 (0.3 mg/kg). The magnitude of the f values provides an indication of how pronounced the alterations in glucose use were within a particular region across the entire dose-response relationship (a high value signifies the most pronounced alterations). The most pronounced changes after LY354740 (i.e., largest f values) were found in the anteroventral thalamic nucleus, mammillary body, superficial layer of the superior colliculus, anterior cingulate cortex, and lateral habenular nuclei (f >0.15). For other regions, the f values were normally distributed around a mean of 0.05. This distribution of f values reflects the relative homogeneous effects of LY354740 on function related glucose use globally in the CNS.
Local cerebral glucose utilization (μmol · 100g−1 · min−1) after administration of LY354740
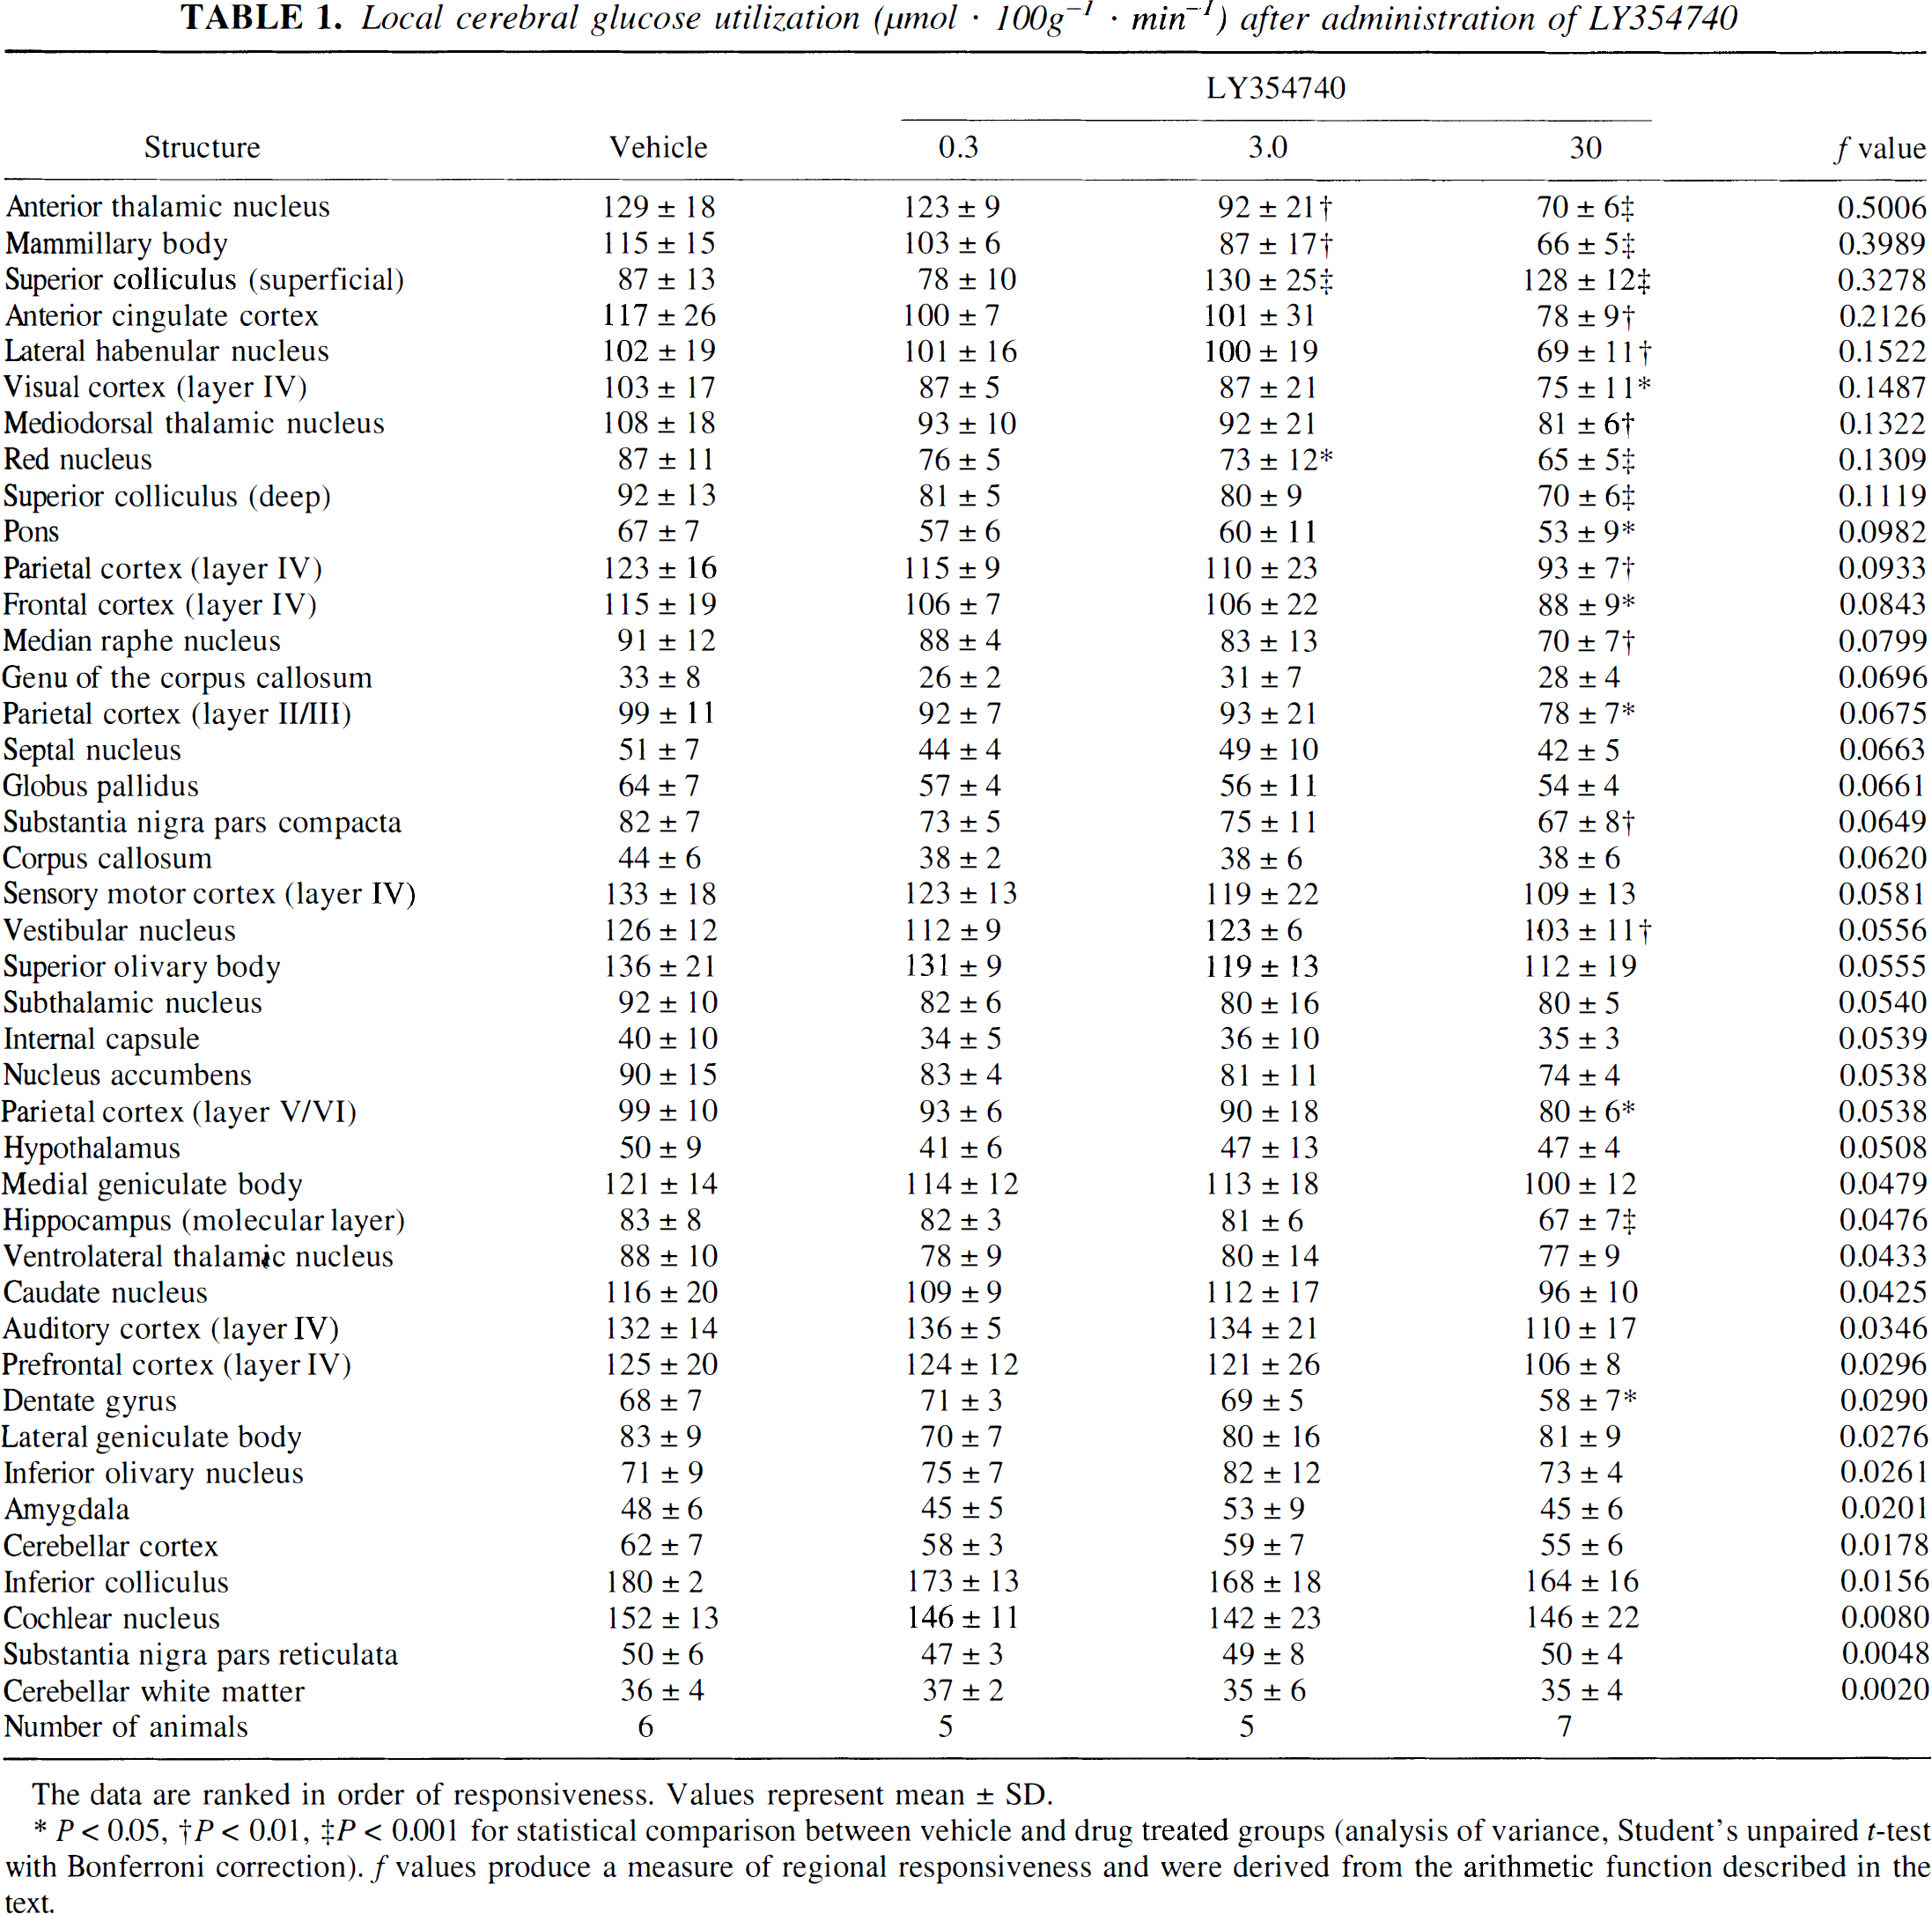
The data are ranked in order of responsiveness. Values represent mean ± SD.
* P < 0.05, †P < 0.01, ‡P < 0.001 for statistical comparison between vehicle and drug treated groups (analysis of variance, Student's unpaired t-test with Bonferroni correction). f values produce a measure of regional responsiveness and were derived from the arithmetic function described in the text.
LY379268 and local cerebral glucose use
LY379268 (0.1, 1.0, and 10 mg/g) produced anatomically circumscribed and dose-dependent changes in glucose use (Table 2). Six regions displayed significant increases in glucose use after LY379268 (the superficial layer of the superior colliculus, locus coeruleus, genu of the corpus callosum, cochlear nucleus, inferior colliculus, and the molecular layer of the hippocampus) and three regions displayed significant decreases (mammillary body, anteroventral thalamic nucleus, and the lateral habenular nucleus). The anatomical circumscribed effects of L Y379268 were apparent from the skewed distribution of f values obtained from the dose response data with LY379268. Brain areas in which f >0.15 were the superficial layer of the superior colliculus, locus coeruleus, mammillary body, and the anteroventral thalamic nucleus.
Local cerebral glucose utilization (μmol · 100g−1 · min−1) after administration of LY379268
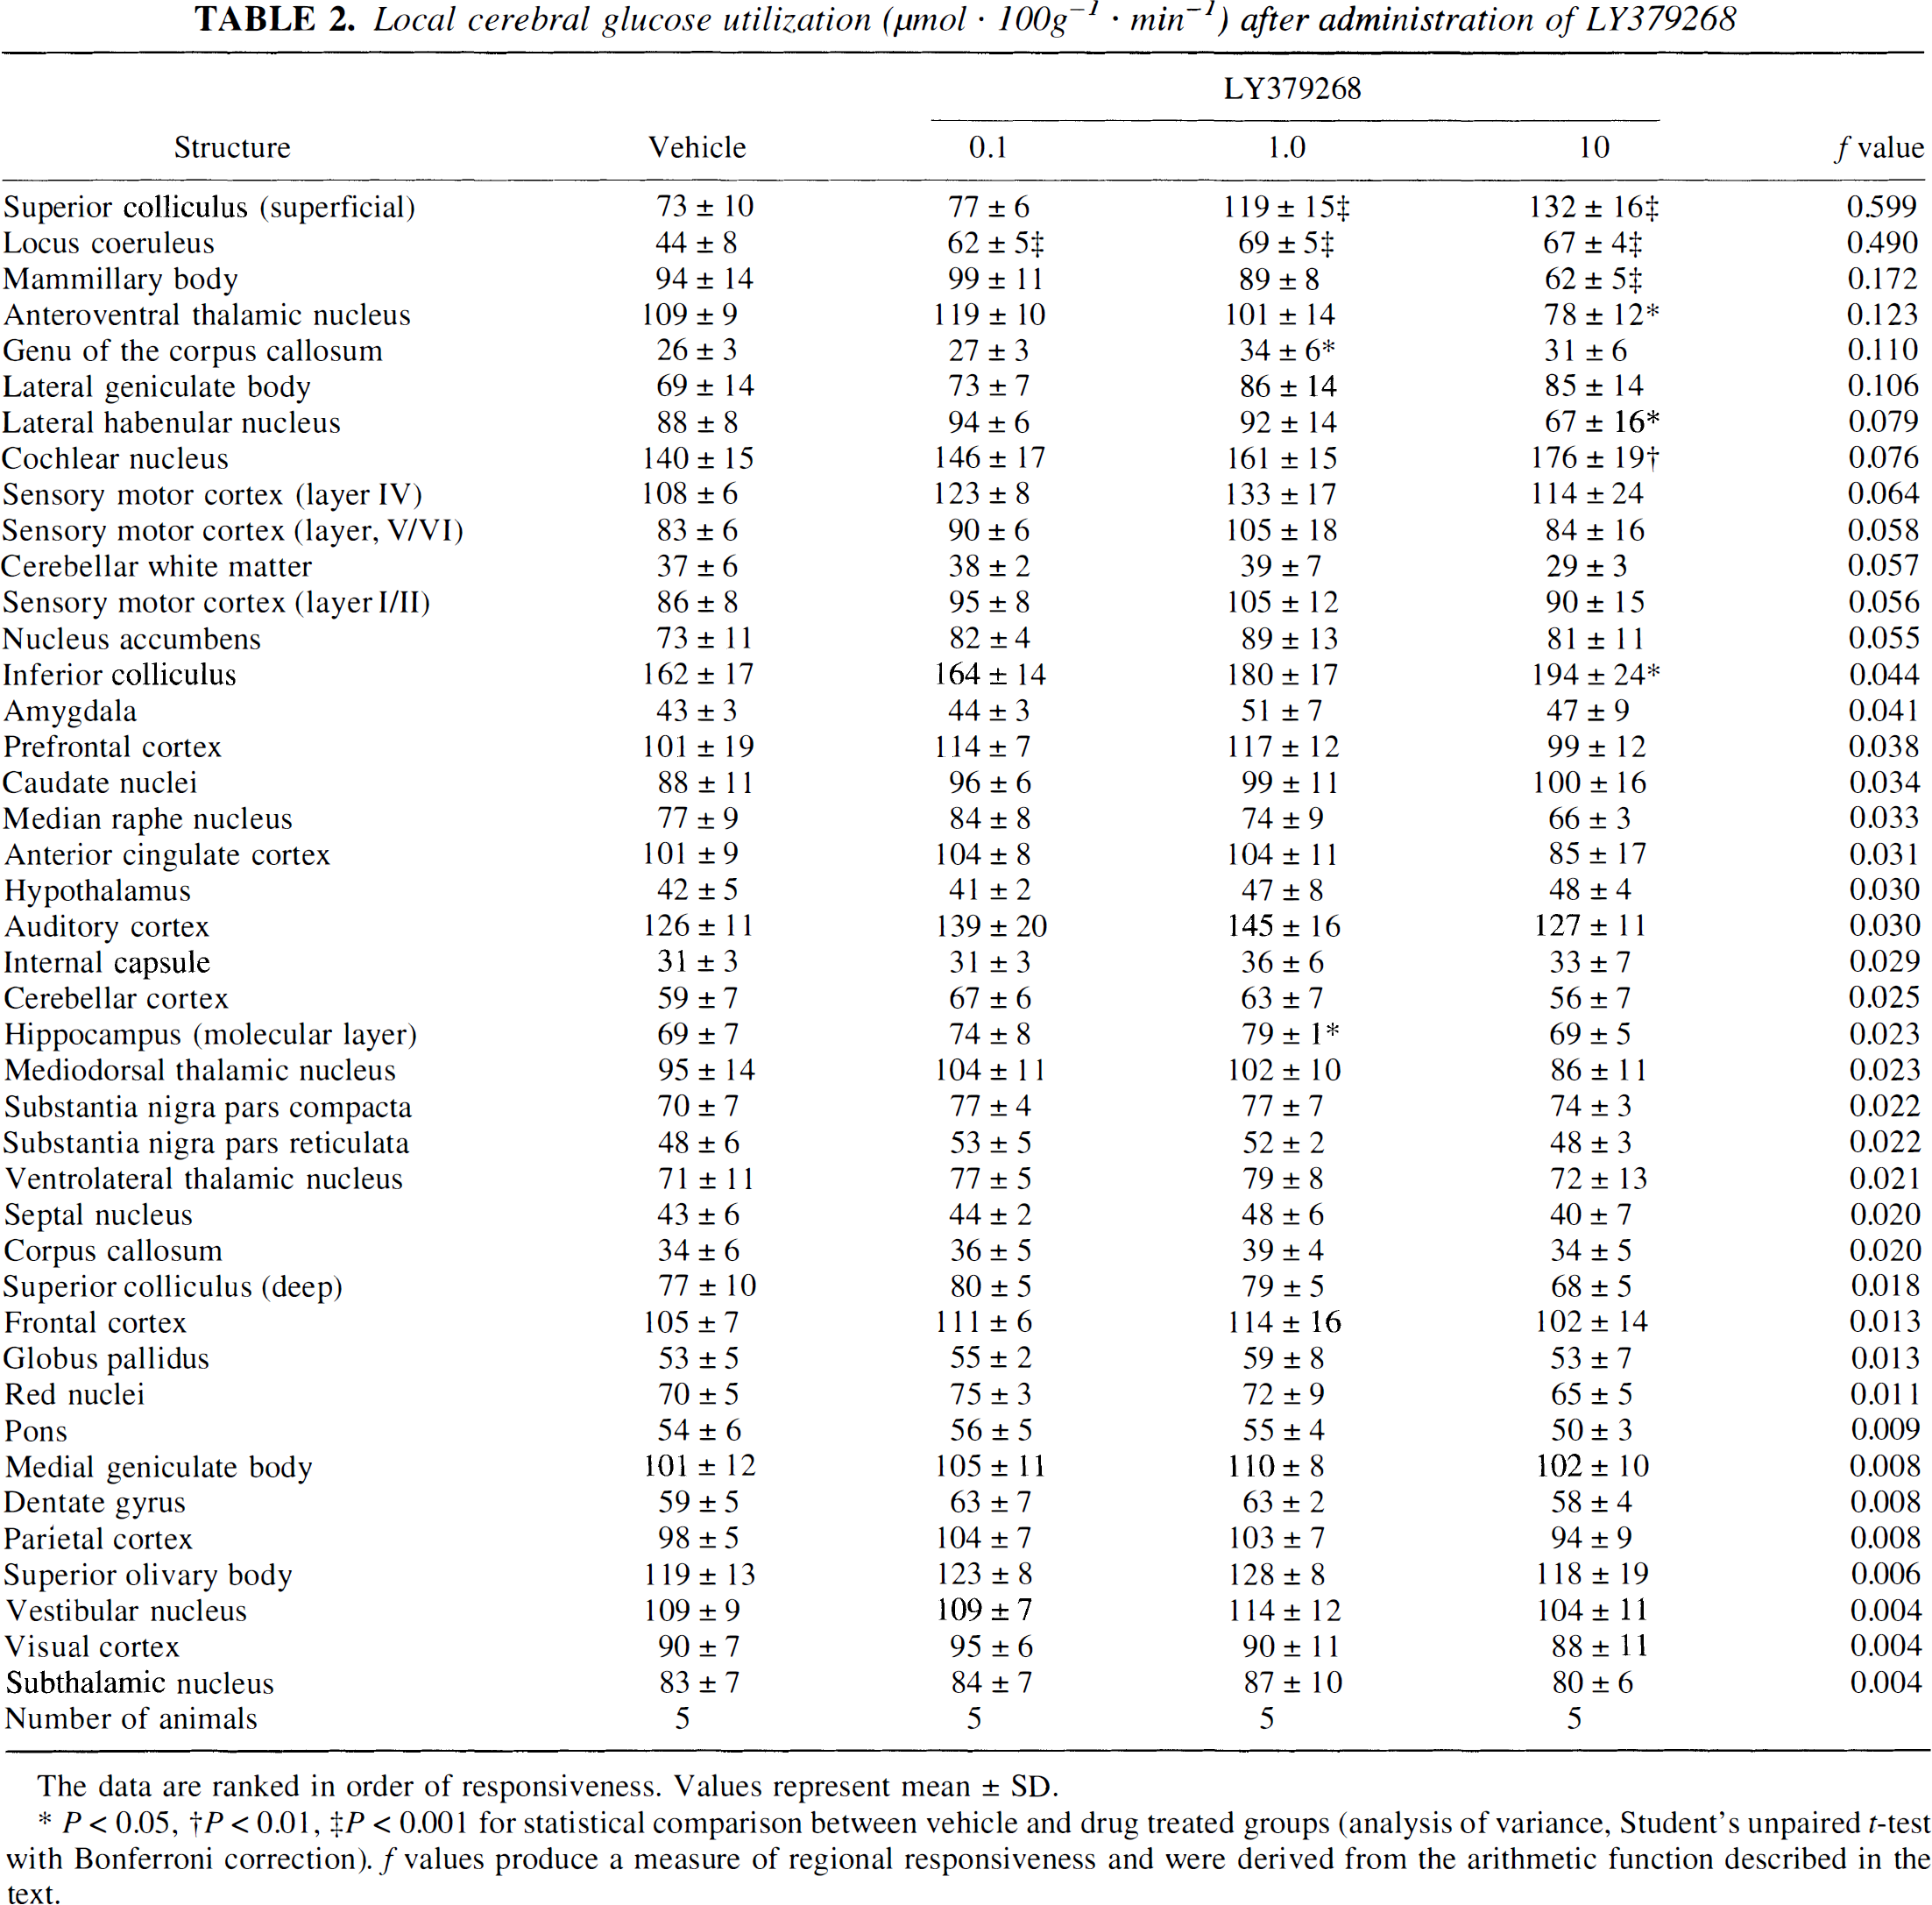
The data are ranked in order of responsiveness. Values represent mean ± SD.
* P < 0.05, †P < 0.01, ‡P < 0.001 for statistical comparison between vehicle and drug treated groups (analysis of variance, Student's unpaired t-test with Bonferroni correction). f values produce a measure of regional responsiveness and were derived from the arithmetic function described in the text.
Comparison of LY354740 and LY379268
The numerical alteration in glucose use, the computed f values, and visual inspection of the autoradiograms indicate that there were some similarities in the regional response to both metabotropic glutamate agonists, i.e., the increased glucose use in the superficial layer of the superior colliculus, the marked reductions in glucose use in three limbic areas (mammillary body, anteroventral thalamic nucleus, lateral habenular nucleus) after both agonists (Figs. 1 and 2). Despite these similar effects, the overall patterns of glucose use response to the two metabotropic agents were dissimilar (Fig. 1). After LY354740 administration, there were widespread reductions in glucose use not just in limbic areas, but also in the cerebral cortex and motor areas (substantia nigra, red nucleus). In autoradiograms from animals treated with LY354740, there was a loss of anatomical detail and sharpness of image reflecting the widespread metabolic depression. After LY379268, there was no widespread reduction in glucose use, with the mean rate of glucose use tending to be greater than in vehicle-treated animals. In a number of regions (e.g., some auditory relay nuclei and the hippocampus) the increased glucose use achieved statistical significance. In contrast to the autoradiograms generated from animals treated with LY354740, the autoradiograms generated from animals treated with LY379268 showed excellent anatomical detail and sharpness of image.
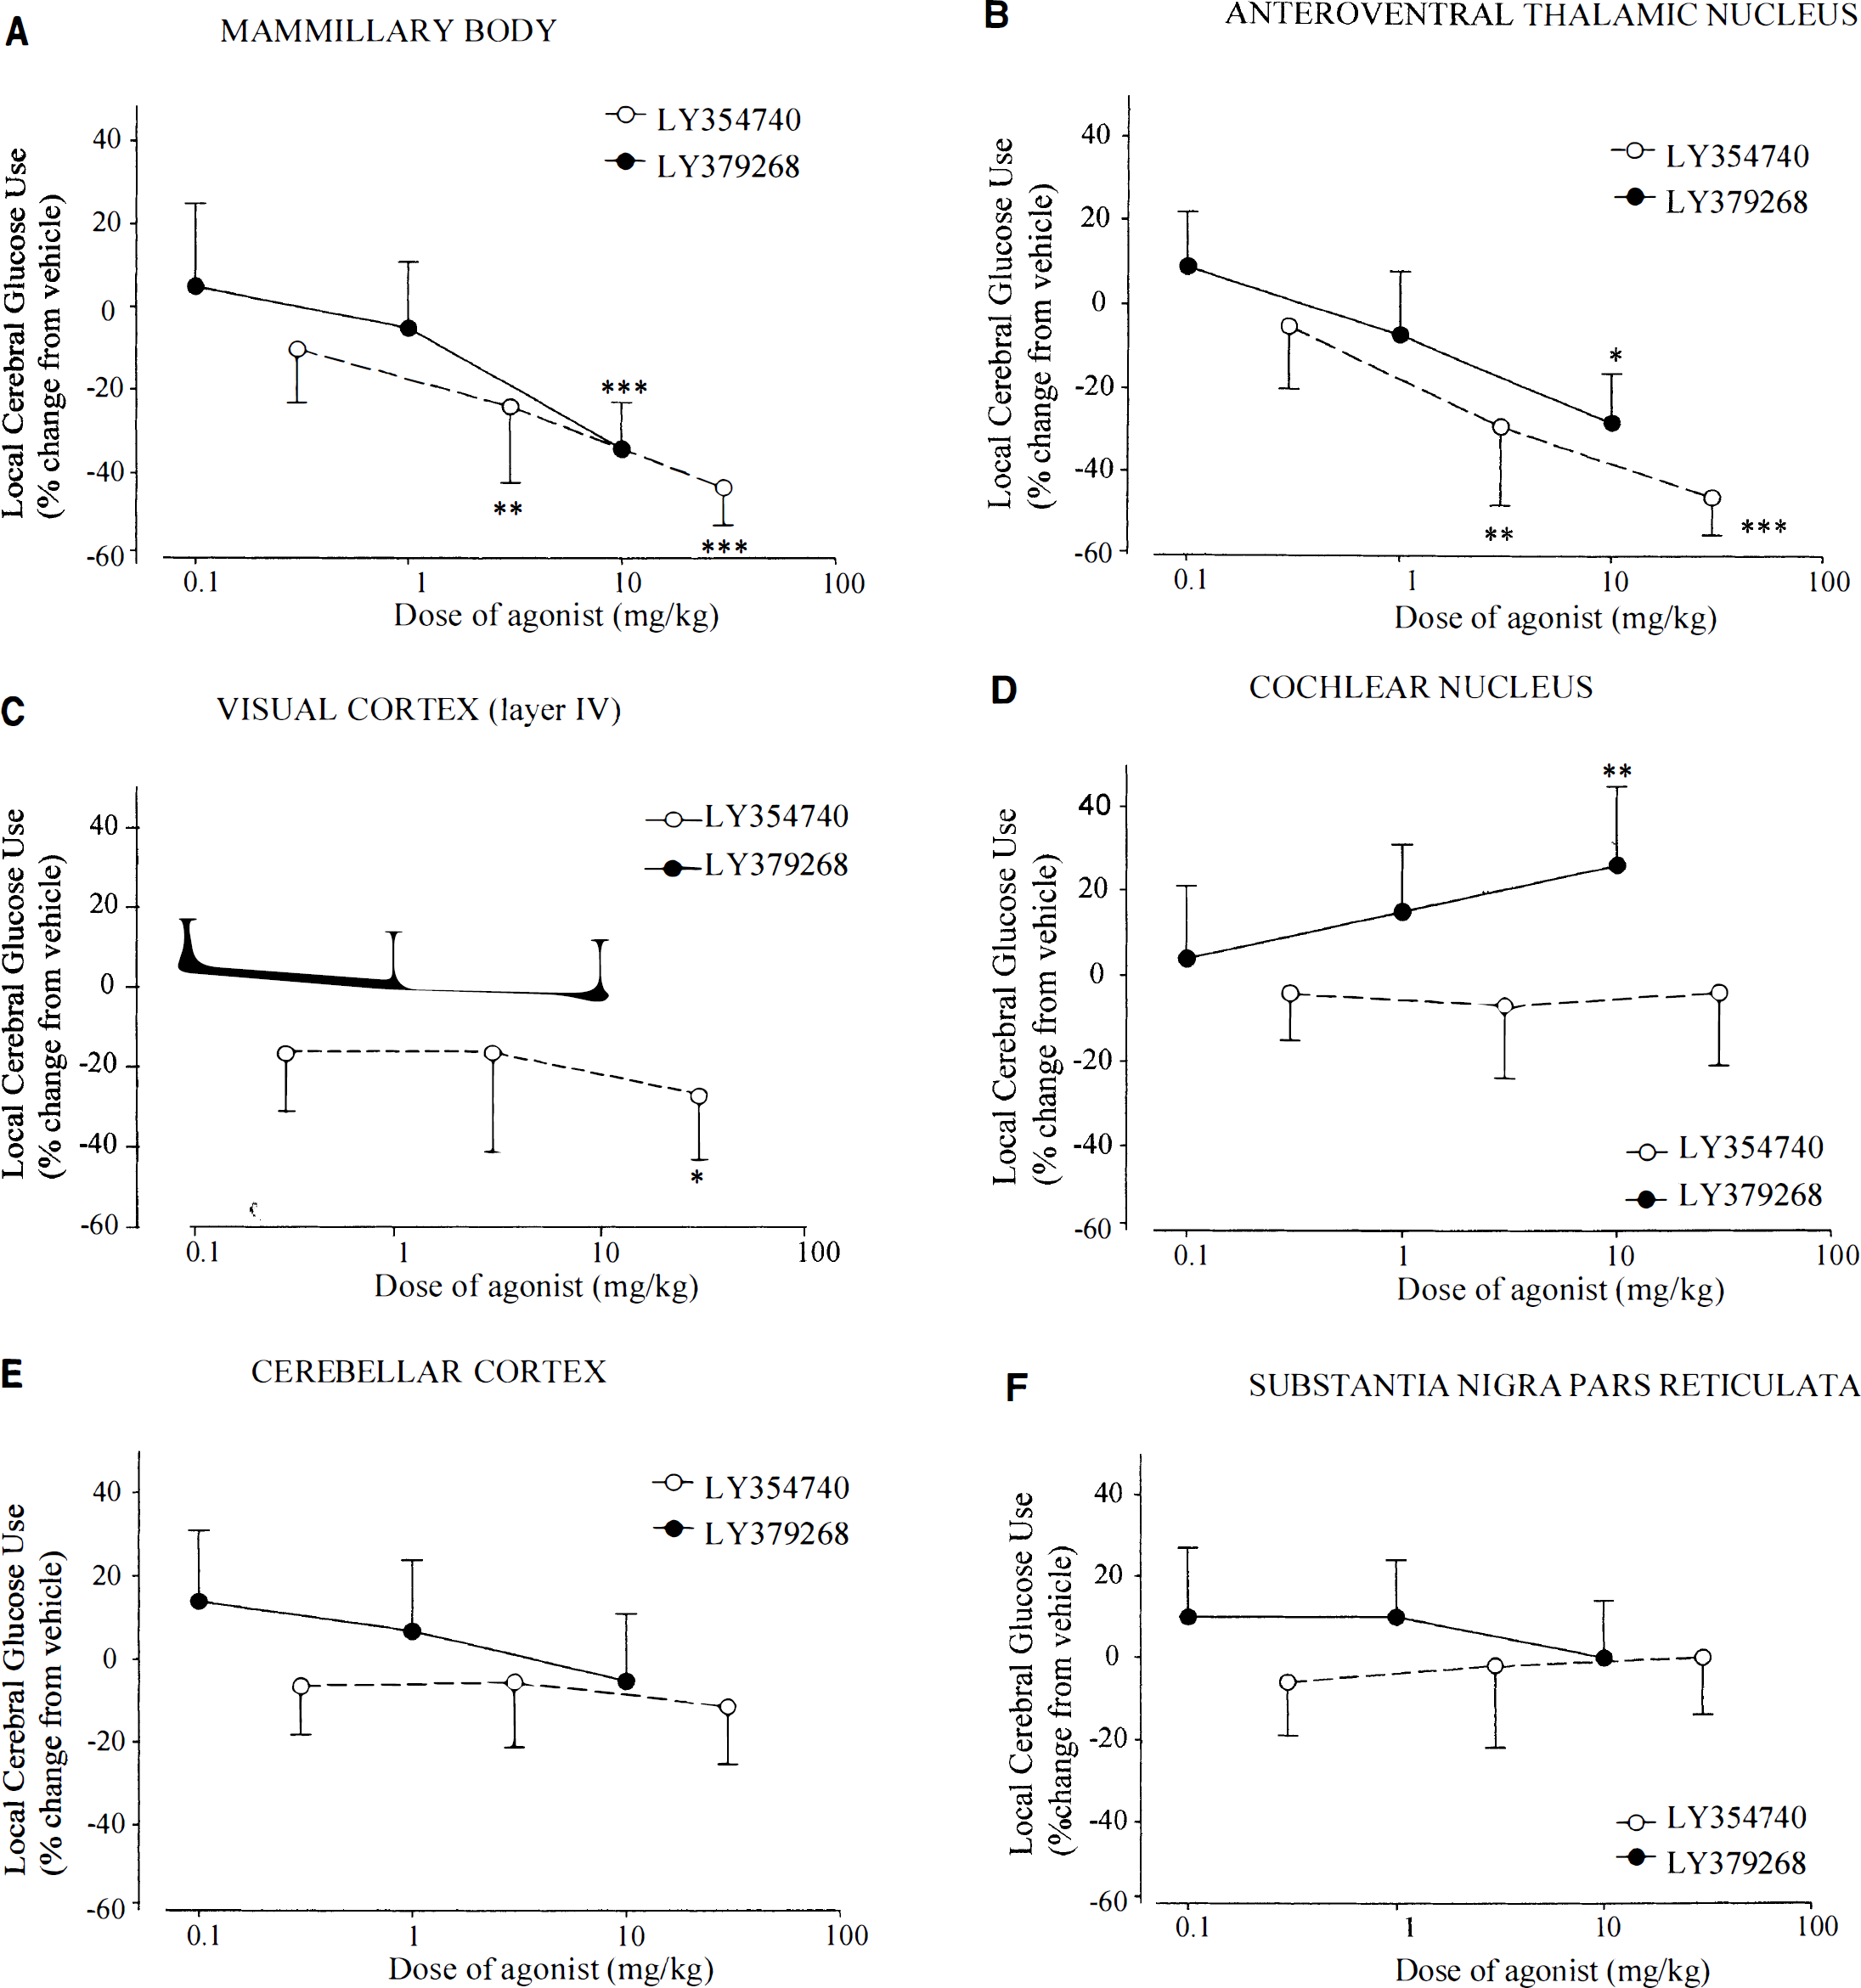
Changes in glucose use in six separate brain regions. The data are presented as % change in glucose use relative to glucose use in vehicle-treated control animals (mean ± SD). Similarities in the regional response to both L Y354740 ● and LY379268 • were observed in various brain regions such as
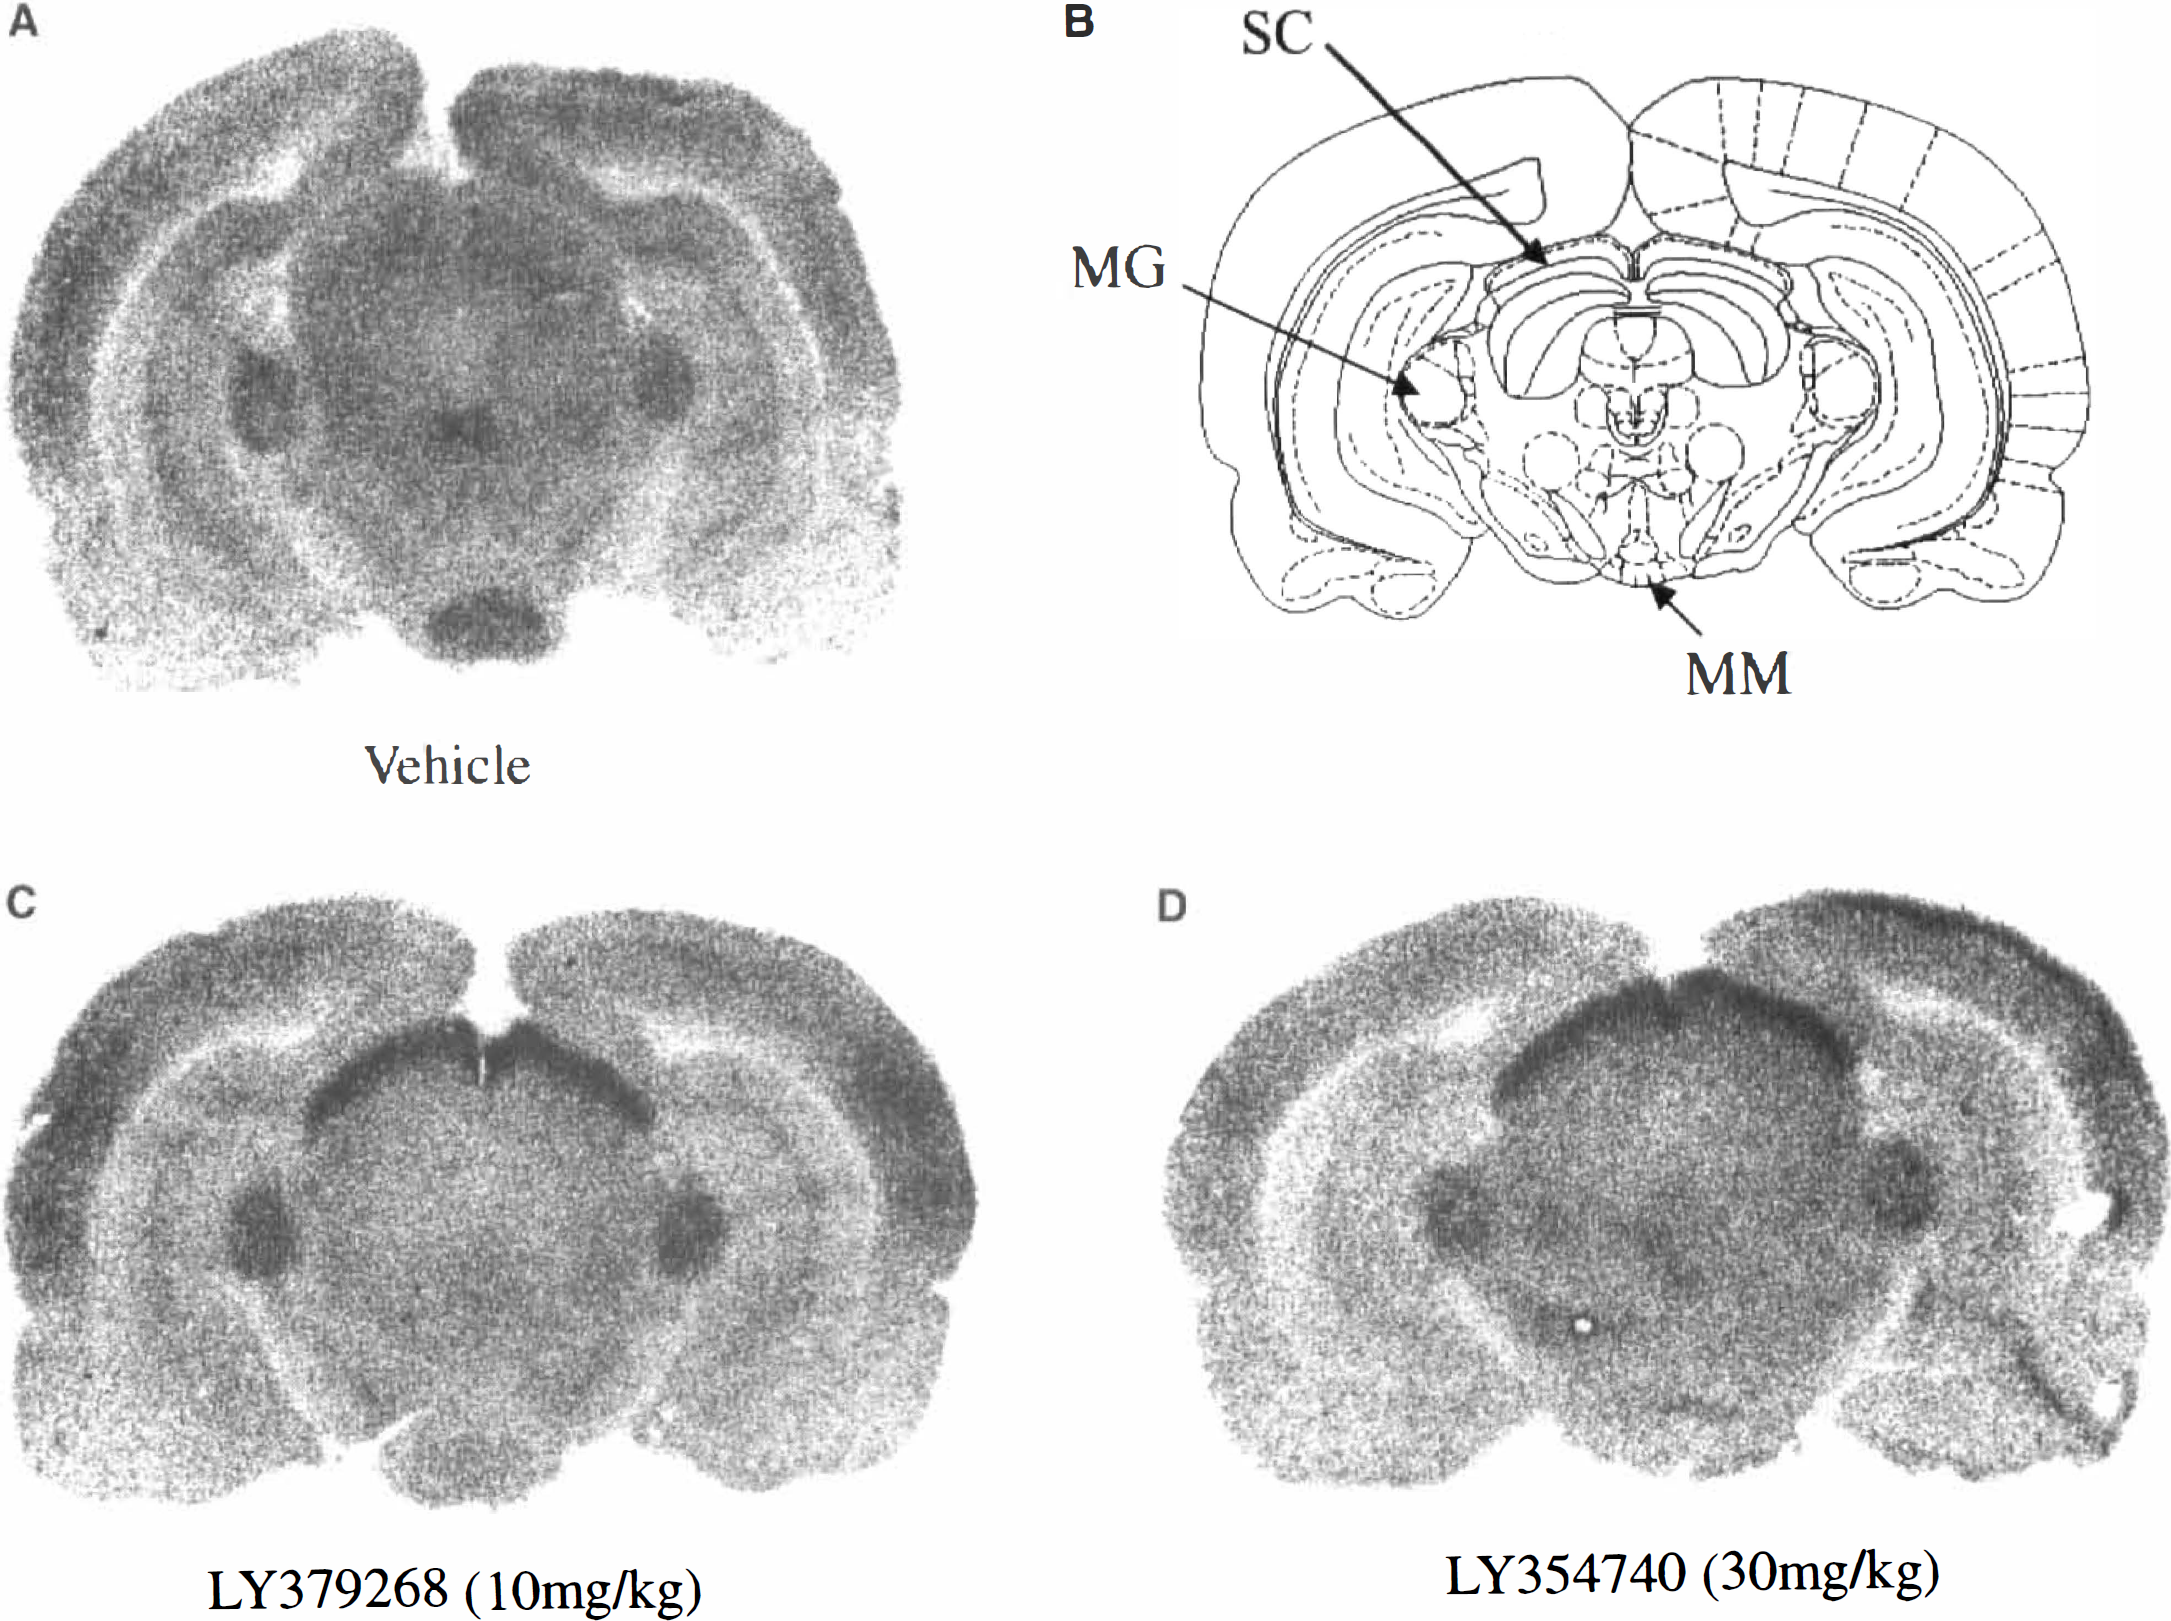
Autoradiograms showing the similar changes in glucose use in the superficial layer of the superior colliculus (Se) following:
DISCUSSION
In this study, the effects of two mGluR agonists, LY354740 and LY379268, on local cerebral glucose use were examined. Previous studies have shown that these two agonists are highly potent and selective for group II mGluR (mGluR2 and mGluR3). By using recombinant mGluR expressed in non-neuronal cells, Monn et al. (1999) showed that LY354740 suppressed forskolin-stimulated cAMP with nanomolar potency (mGluR2 EC50 = 11 nmol/L; mGluR3 EC50 = 38 nmol/L) and displaced the high affinity binding of [3H]LY341495 at low concentrations (mGluR2 Ki = 75 nmol/L; mGluR3 Ki = 93 nmol/L). LY379268 showed even greater agonist potency on the mGluR2 (EC50 = 3 nmol/L) and mGluR3 (EC50 = 5 nmol/L) cloned receptors together with a higher affinity to the receptors (mGluR2 Ki = 14 nmol/L; mGluR3 Ki = 6 nmol/L).
Further in vitro studies using recombinant human mGluR have shown that L Y354740 has no activity at group III receptors (mGluR4 and mGluR7) up to 100 mol/L, or at group I (mGluR1 and mGluR5) receptors even at 300 μmol/L or more. However, agonist responses have been demonstrable at mGluR6 and mGluR8 at the low μmol/L dose range (Monn et al., 1999). In addition, the application of 100 μmo/L of LY354740 alone on recombinant AMPA and kainate receptors produced only negligible currents, while binding assays confirmed that the agonist (up to 100 μmol/L) did not have any NMDA activity (Monn et al., 1997). Similarly, LY379268 did not produce any effects (agonist or antagonist) in cells expressing recombinant mGluR1, mGluR5, or mGluR7 at concentrations up to 100 μmol/L, and again no NMDA activity was measured at concentrations up to 100 μmol/L. In contrast to LY354740, LY379268 has been shown to have higher affinity at mGluR6 (inhibition of forskolin stimulated cAMP EC50 = 0.4 μmol/L), mGluR4 (21 μmol/L), and mGluR8 (2 μmoI/L) (Monn et al., 1999). In rat cortical slices, LY354740 has also shown the inhibition of forskolin-stimulated cAMP formation (EC50 = 55 nmol/L) with no phosphoinositide stimulation (Monn et al., 1997), which indicates that it has similar group II mGluR selectivity in rat tissue as in recombinant cells.
LY354740 and LY379268 are structurally similar and are constrained analogues of glutamate. While LY354740 is approximately equipotent at mGluR2 and mGluR3, LY379268, although more potent than its heterobicyclic analogue for both receptors (16X at mGluR3, 5X at mGluR2), has a higher affinity for mGluR3 (Monn et al., 1999). This may explain both the different responses measured in the brain regions and the contrasting behavior elicited after the administration of the two drugs. LY379268 (10 mg/kg) could possibly have produced nonselective effects due to mGluR6 activation, which are thought to be implicated in sensory function (Schoepp et al., unpublished data). The behavioral changes elicited after the administration of LY354740 and LY379268 may reflect this difference in receptor selectivity.
The use of the ranking function f provides a system that allows the interpretation of data from the entire dose-response relationship. By making use of all the available data, distinct patterns of altered local cerebral glucose use can be described for both metabotropic agonists and used to supplement percentage changes in function-related glucose use, or significance levels in specific regions. Irrespective of how the data are analyzed, a number of similarities and, more obviously, dissimilarities can be identified in the regional responses of local glucose use to the two metabotropic glutamate agonists. Glucose use in a number of anatomically interconnected regions of the limbic systems (anteroventral thalamic nucleus, mammillary body, lateral habenular nucleus) were sensitive to reduction by both LY354740 and LY379268. Glucose use in the superior colliculus (superficial layer) was increased by both metabotropic agonists. In contrast, LY354740 provoked anatomically widespread reductions in glucose use, notably in the cerebral cortex and visual system, whereas LY379268 elicited circumscribed increases in glucose use in the auditory relay nuclei and locus coeruleus.
The patterns of glucose alterations found in this study could simply reflect the distribution of mGluR2 and mGluR3 in the CNS. In situ hybridization and immunohistochemical studies have been performed to examine the distribution of these receptors in the rat brain (Ohisi et al., 1993a, b ; Ohishi et al., 1994; Neki et al., 1996; Petralia et al., 1996). mGluR2 and mGluR3 are found throughout the rat brain but mGluR3 are distributed more widely in the forebrain, glia, and white matter. While the distribution of local cerebral glucose use changes after the administration of the drugs displayed a general relationship to the topography of group II mGluR localization, discrepancies were also evident. Substantial alterations in glucose use were measured in the red nuclei and the inferior colliculus with LY354740 and LY379268, respectively, but the presence of mGluR2 and mGluR3 in these areas are not substantial. Dynamic alterations in glucose use appear to reflect mostly the activity in axonal terminals of neuronal pathways (Schwartz et al., 1979), so that alterations in local rates of glucose use are not restricted to the regions rich in group II mGluR, but also the functional involvement of neuronal pathways connected to the receptor-rich areas.
Glutamate is the major excitatory neurotransmitter of the perforant pathway (White et al., 1977), which projects from the entorhinal cortex and terminates in the hippocampus and dentate gyrus. Petralia et al. (1996) showed that the hippocampus, and, in particular, the terminals of axons located in the hippocampus originating from the entorhinal cortex, was the region richest in mGluR2 and mGluR3. In this study, the molecular layer of the hippocampus was substantially affected with both compounds, but it did not show the most significant changes in local cerebral glucose use. However, this would be an expected finding because the metabolic effect of the activation of these receptors would be expected downstream at the next synapse of that pathway. The mammillary body is an important efferent area of the hippocampal region, while the mammillary body in turn projects onto the anterior thalamus via the mammillothalamic projection. These structures form the main components of the circuit described by Papez (1937); entorhinal cortex → hippocampus → mammillary body → anterior thalamus → cingulate cortex. Local rates of glucose use were substantially altered in the majority of these structures in this study.
The [14C]2-deoxyglucose autoradiographic technique has been widely used to investigate the changes after a wide range of neuropharmacologic manipulations (McCulloch, 1982). The anatomical patterns of response to the two metabotropic agonists in the present study do not resemble those described previously for glutamate receptor blockade (NMDA or AMPA) (Browne and McCulloch, 1994; Nehls et al., 1988), or modulators of presynaptic glutamate release, such as κ receptor agonists (Mackay and McCulloch, 1994). The group II mGluR are known to have a modulatory role pre and perisynaptically (Forsythe and Barnes-Davies, 1997). Here they can exist either as autoreceptors at glutamatergic synapses, or as heteroreceptors at gamma aminobutyric acid–(GABA)ergic synapses. Thus, a reduction in GABA release at GABAergic synapses may account for some of the increases in glucose use while reductions in glucose use may result from the activation of presynaptic autoreceptors that function as negative feedback receptors. Recent studies have provided further support for the involvement of group II mGluR in the negative modulation of glutamate release. Battaglia et al. (1997) showed that L Y354740 completely prevented veratridine-evoked release of glutamate and aspartate in the striatum. There is also recent evidence to suggest that mGluR2 are localized in perisynaptic areas that could permit activity-dependent receptor activation (Scanziani et al., 1997), suggesting their involvement in the suppression of overexcited systems. While this study has shown more general reductions in glucose use after LY354740 (but not LY379268), the exact sites of action of this agonist in the brain could be more fully exploited. By increasing glucose metabolism (i.e., exciting neuronal systems), one may well observe clear and specific reductions in brain metabolism directly related to the activation of mGluR2 as a direct result of their modulatory role perisynaptically.
In summary, this present study has shown the important functional involvement of the limbic system in response to the activation of mGluR2 and mGluR3 with LY354740 and LY379268. Aside from this change produced in the limbic system, the two agonists produce essentially different CNS effects after systemic administration. These central effects shown after systemic administration show their usefulness as pharmacologic tools, especially with their different affinities to the two receptor subtypes, and that they may be of potential therapeutic use in conditions where there is an apparent overactivity of the limbic system.
Footnotes
Acknowledgment
The authors thank the technical staff at the Well come Surgical Institute for their assistance with this study.