
Abstract
Deep spontaneous vasodilatatory events are frequently recorded in various cerebral diseases, causing dramatic increases (A-waves) in intracranial pressure (ICP) and subsequently provoking ischemic brain insults, The relationship between fluctuations in CBF, ICP, and arterial blood pressure (ABP) is influenced by properties of cerebrovascular control mechanisms and the cerebrospinal pressure-volume compensation, The goal of this study was to construct a mathematical model of this relationship and to assess its ability to predict the occurrence and time course of A-waves, A group of 17 severely head-injured patients were included in the study, In our model ICP was derived from the ABP waveform using a linear signal transformation. The transformation was modified during the simulation by a relationship between ABP and flow velocity, i.e., by the characterization of the cerebrovascular bed. In this way the ICP could be calculated from the ABP waveform. This model was verified by comparison of simulated and directly measured ICP during A-waves recorded in seven of the patients. In all simulations, plateau elevations of ICP were well replicated. The mean absolute error between real and simulated ICP was 8.3 ± 5.4 mm Hg at the baseline and 7.9 ± 4.3 mm Hg at the top of plateau waves. The correlation coefficient between real and simulated increase in ICP was R = 0.98; P < .001. Similarly, correlation between real and simulated increase in pulse amplitude of ICP was highly significant (R = 0.94; P < .001). The mathematical model of the relationship between ABP, flow velocity, and ICP is of potential clinical use for the noninvasive detection of A-waves in patients in whom invasive ICP assessment is not conducted.
Keywords
Acute cerebral pathology frequently leads to an increase in intracranial pressure (ICP). Various spontaneous waves of different duration may be observed during ICP recording. Plateau, or A-waves, as described by Lundberg (1960, 1968) are large spontaneous increases of ICP, usually occurring in patients with low cerebral compliance. The ICP plateau can reach 60 to 80 mm Hg for a duration of 5 to 20 minutes, constituting an ischemic insult to the brain. Early investigations have indicated an increased cerebral blood volume and a decreased blood flow during the peak of the ICP wave (Risberg et al., 1969; Czosnyka et al., 1996; Newell at al., 1997). Further modeling studies (Rosner, 1984) have confirmed that A-waves represent a disorder of cerebral circulatory control resulting from a positive-feedback loop established between cerebral vasodilatation and increases in ICP. A simultaneous decrease in blood flow velocity (FV) in the middle cerebral artery (MCA) and an increase of the pulsatility of flow velocity waveform was observed using transcranial Doppler (TCD) monitoring (Czosnyka et al., 1994). This correlation between A-waves and hemodynamic changes corresponds to findings concerning the relationship between FV parameters, arterial blood pressure (ABP) and ICP in general (Aaslid et al., 1986; Klingelhöfer et al., 1987 a,b, 1988; Chan et al., 1992; Homburg et al., 1993; Shigemori et al., 1989; Czosnyka et al., 1998). These investigators suggested that changes of FV in the MCA might be used to estimate the course of A-waves noninvasively.
In earlier publications (Schmidt et al., 1997, 1998), we introduced a method for a noninvasive, continuous simulation of ICP derived from the simultaneously recorded waveforms of ABP and of FV in the MCA. This method used the technique from analysis of dynamic systems (Kasuga et al., 1987; Marmarelis et al., 1978). The intracranial compartment was considered as a “black box” with ICP being a system response to the incoming signal ABP. Transformation of the ABP into the ICP waveform was modified according to the changes in the cerebrovascular circulation using the TCD waveform. The objective of the current study was to verify the predictive value of this noninvasive method to monitor ICP plateau waves in patients with severe head injury.
SUBJECTS AND METHODS
Patients
Seventeen severely head-injured patients (15 to 74 years of age, mean age: 29 ± 17 years; 12 male, S female) treated in Technical University Medical School, Munich, and Addenbroke's Hospital, Cambridge, United Kingdom, were studied (N = 5, Munich; N = 12, Cambridge). At the time of data recording all the patients were sedated (regime of anesthesia did not differ considerably between two centers), paralyzed, and mechanically ventilated. Their arterial PaCO2 ranged from 30 to 35 mm Hg. No patient showed vasospasm or a stenosis of the intracranial or extracranial arteries.
Monitoring
TCD measurements were taken by a 2-MHz pulsed Doppler device (TC 2–64B, EME, Uberlingen, Germany - in Munich and PCDop842, Scimed, Bristol, UK- in Cambridge). Flow patterns of the MCA were continuously recorded on the same side as where the ICP was measured directly. The ultrasound probe was fixed mechanically with a holder using elastic bands and fixation strips. According to our unpublished survey (M. Czosnyka, 1965), the ability to detect maximal blood FV is the same in both ultrasonographs, providing FV is less than 200 cm/s. PCDop842 is not able to detect greater velocity, therefore, it is not suitable for detection of cerebral vasospasm. Experienced TCD operators were in both centers responsible for TCD measurements.
In both clinics blood pressure was measured with standard manometer line inserted into the radial or femoral artery connected to a transducer (Gould Statham 23 ID, USA). In all cases damping of the arterial line was assured to be insignificant for the frequency below 8 Hz.
The ICP was measured using an implanted intraparenchymal Camino fiber-optic probe (Camino Laboratories, San Diego, CA, U.S.A. [in Cambridge]) or parenchymal ICP monitoring device with an air pouch probe and an hourly automatic calibration (Spiegelberg Plc/Ltd./Co., Hamburg, Germany [Munich]). The following plausibility criteria were confirmed: the measured ICP was consistent with the overall clinical picture of the patient, lifting the head led to a decrease in ICP, and a short-duration increase in ICP occurred when the airway was suctioned.
Analog signals from the output of bed-side monitors were fed directly to computers running monitoring software.
Computer-assisted recording
The simulation procedure was developed and verified using clinical material consisting of continuously recorded FV, ABP, and ICP waveforms. Two IBM PC computers were used for recording and analyzing the FV, APB, and ICP curves. Both in Cambridge and Munich the computers for signal recording were portable IBM PCs and each was fitted out with a data acquisition system (in Munich: DAP 2400, Microstar Laboratories, Bellevue, W A, USA, in Cambridge: DTA2814, Data Translation, Marlboro, CA, U.S.A.). The used sampling frequency was 25 Hz or 50 Hz in Munich and Cambridge, respectively. The signals were recorded daily for the duration of 20 to 120 minutes, free from therapeutic intervention, physiotherapy, suctioning, etc. In both centers purpose-written software for data recording was used (Schmidt et al., 1997 [in Munich]; Zabolotny et al., 1994 [in Cambridge]). The mathematical and statistical calculations were performed using in-house written software (Schmidt et al., 1997) supported by a software tool (Real Time Graphics & Measurement Tools/Quinn Curtis, Needham, MA, U.S.A.).
Noninvasive intracranial pressure simulation
Clinical material containing FV, ABP, and direct ICP monitoring in 17 patients was used to construct the ICP simulation model. The model presumed that both FV and ICP waveforms might be calculated from the ABP waveform and using sets of parameter {ti} and {wi} (Fig. 1); for the detailed description see Appendix). The parameters of the association between ABP and FV were computed from the measurement of FV and ABP waveforms, while the parameters of the association between ABP and ICP were calculated from the measurements of ABP and ICP. Using a multiple regression model the ABP-ICP parameter set was correlated to the parameters of the ABP-FV association and the pulsatility index (PI = FV peak-to-peak amplitude / FV mean) as an additional parameter. Transformations established in this way (matrix A and vector B - for details see Appendix) were used for noninvasive continuous simulations of ICP in seven patients presenting with plateau waves. For each of the seven patients tested, the data of the remaining 16 patients was taken to generate the ICP simulation as described above. For each patient the association between ABP and FV was calculated using ABP and FV waveforms. Then, using precalculated transformation coefficients (matrix A and vector B) the parameters of association between ABP and ICP were computed. Using these parameters, ICP waveform was simulated using ABP waveform.
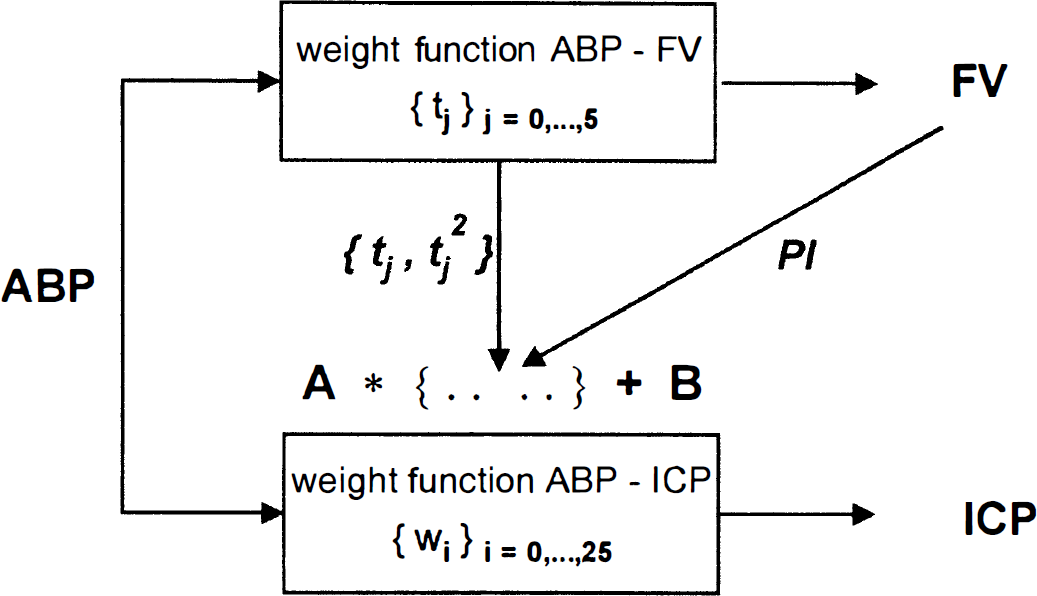
Structure of the intracranial pressure (ICP) simulation: From flow velocity (FV) and arterial blood pressure (ASP) curves, the transcranial Doppler (TCD) characteristics consisting of the ASP-FV filter coefficients {ti}, its squares {ti2}, and pulsatility index are computed. The multiplication of the TCD characteristics by matrix
For a comparison between measured and simulated ICP we averaged ICP over a period of 10 seconds (ICPm). The simulation's accuracy was described by the mean of the absolute differences (Δ ICPm) between measured and simulated ICPm values. Periods of the data in which one of the three curves FV, AEP, or ICP was obviously erroneous (e.g., caused by device errors or disturbances during recording) were excluded from evaluation.
RESULTS
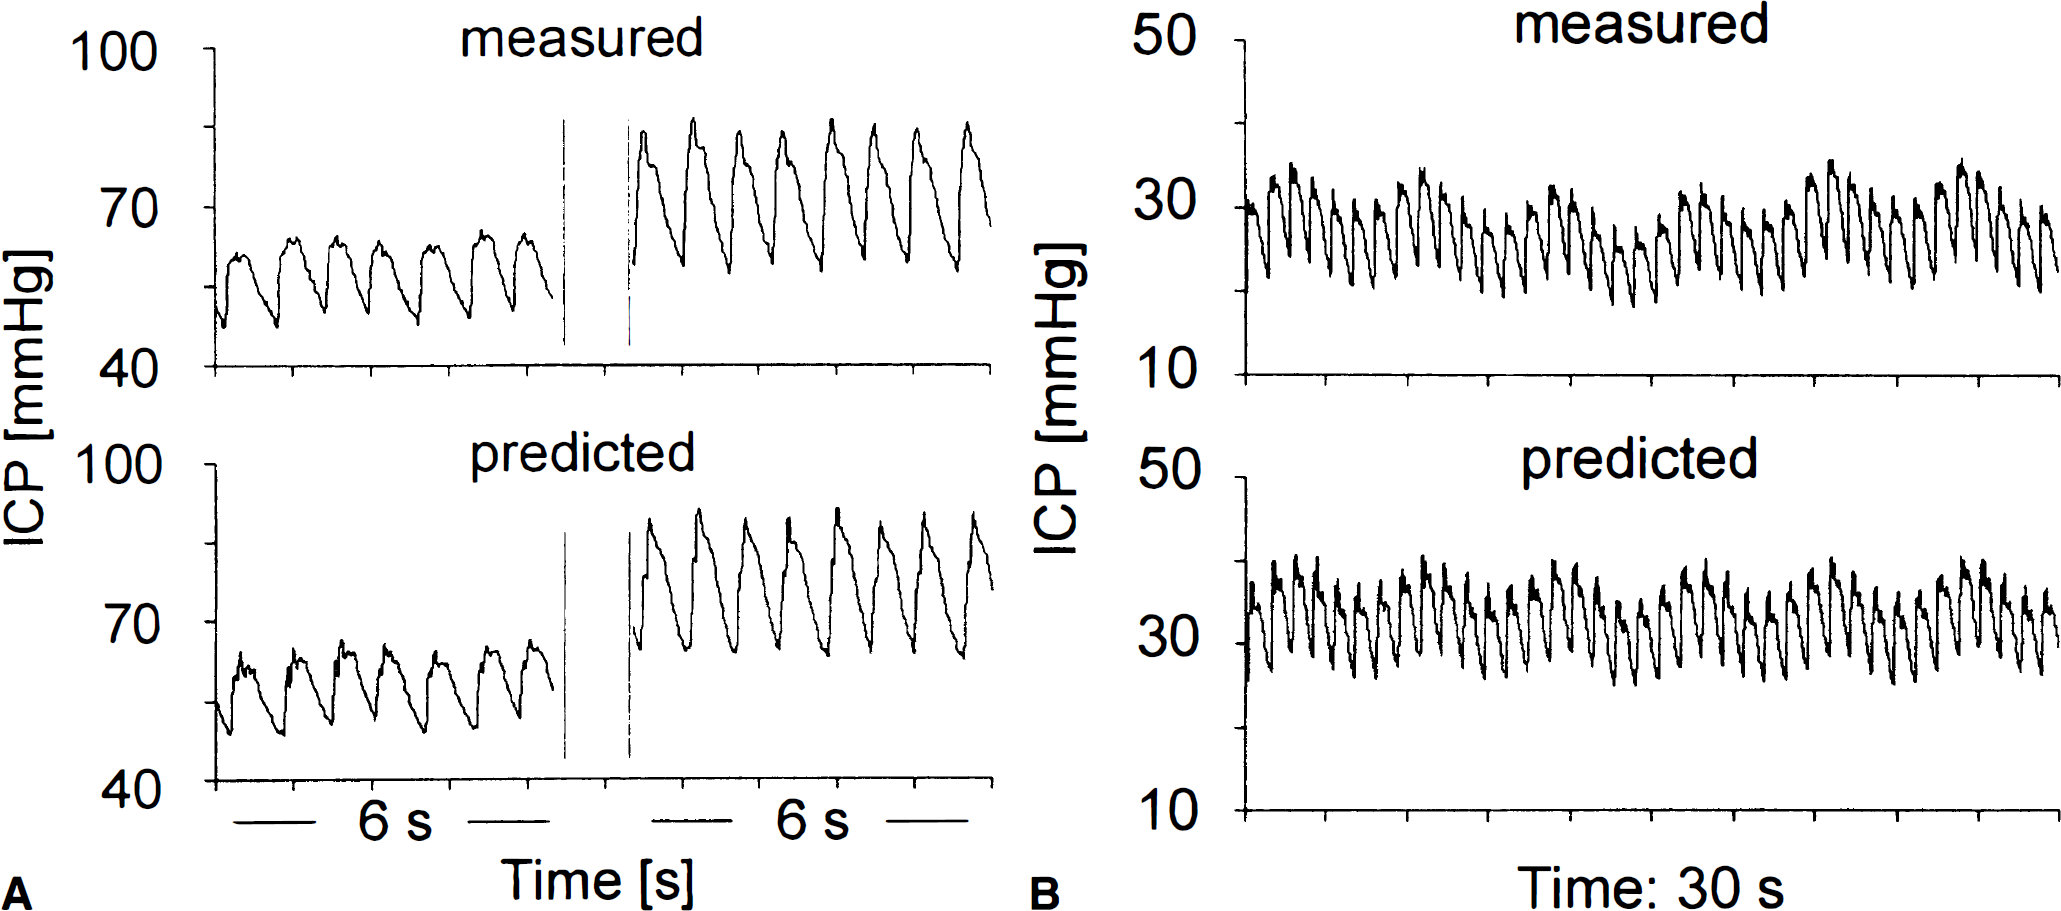
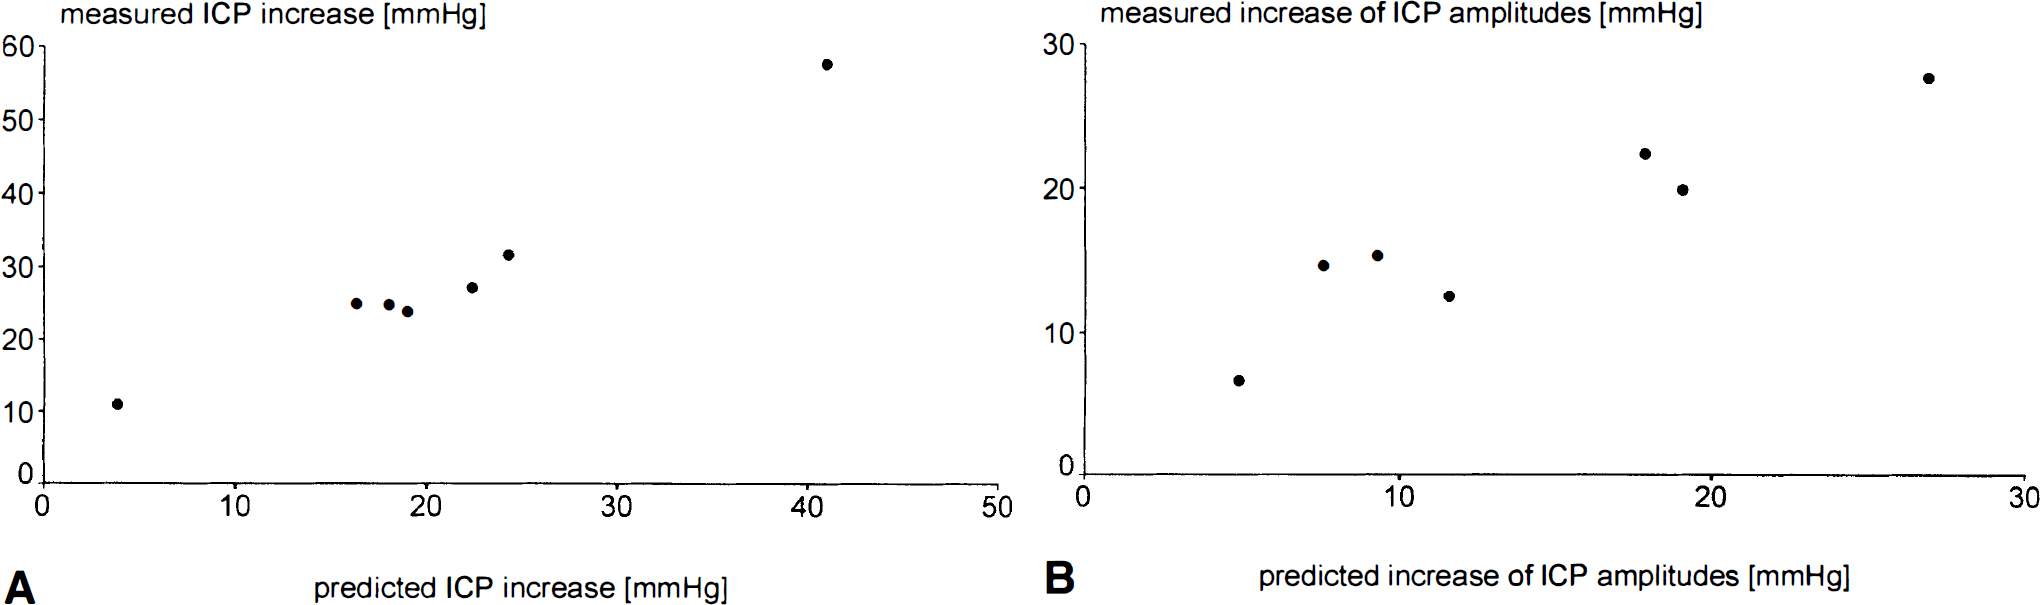
In seven patients recorded in Cambridge (16 to 32 years of age, mean age: 20 ± 6 years; 4 male, 3 female) A-waves of ICP were observed in recordings. A comparison of measured and predicted ICP in these patients showed that the typical plateau shapes of ICP waves were clearly visible in the predicted ICP curves (Figs. 2A to 2D). The pulse waves of ICP, typically presenting with specific changes in its profile from a notched to more triangular shape during the plateau wave were well replicated in the simulations Fig. 3A. The simulated respiratory waves of ICP were clearly visible and well dynamically correlated with the recorded one (Fig. 3B). Values of real and simulated ICP at the baseline and during plateau are presented together with mean absolute differences in Table 1. The average Δ ICPm was 8.3 ± 5.4 mm Hg at the baseline and 7.9 ± 4.3 mm Hg at the top of plateau waves. The correlation coefficient between the increase in the simulated and real ICP was 0.98 (P < .001; a scatterplot is given in Fig. 4A). Similarly, the correlation coefficient between the increase in pulse amplitudes of both waveforms was 0.94 (P < .005) (Fig. 4B).
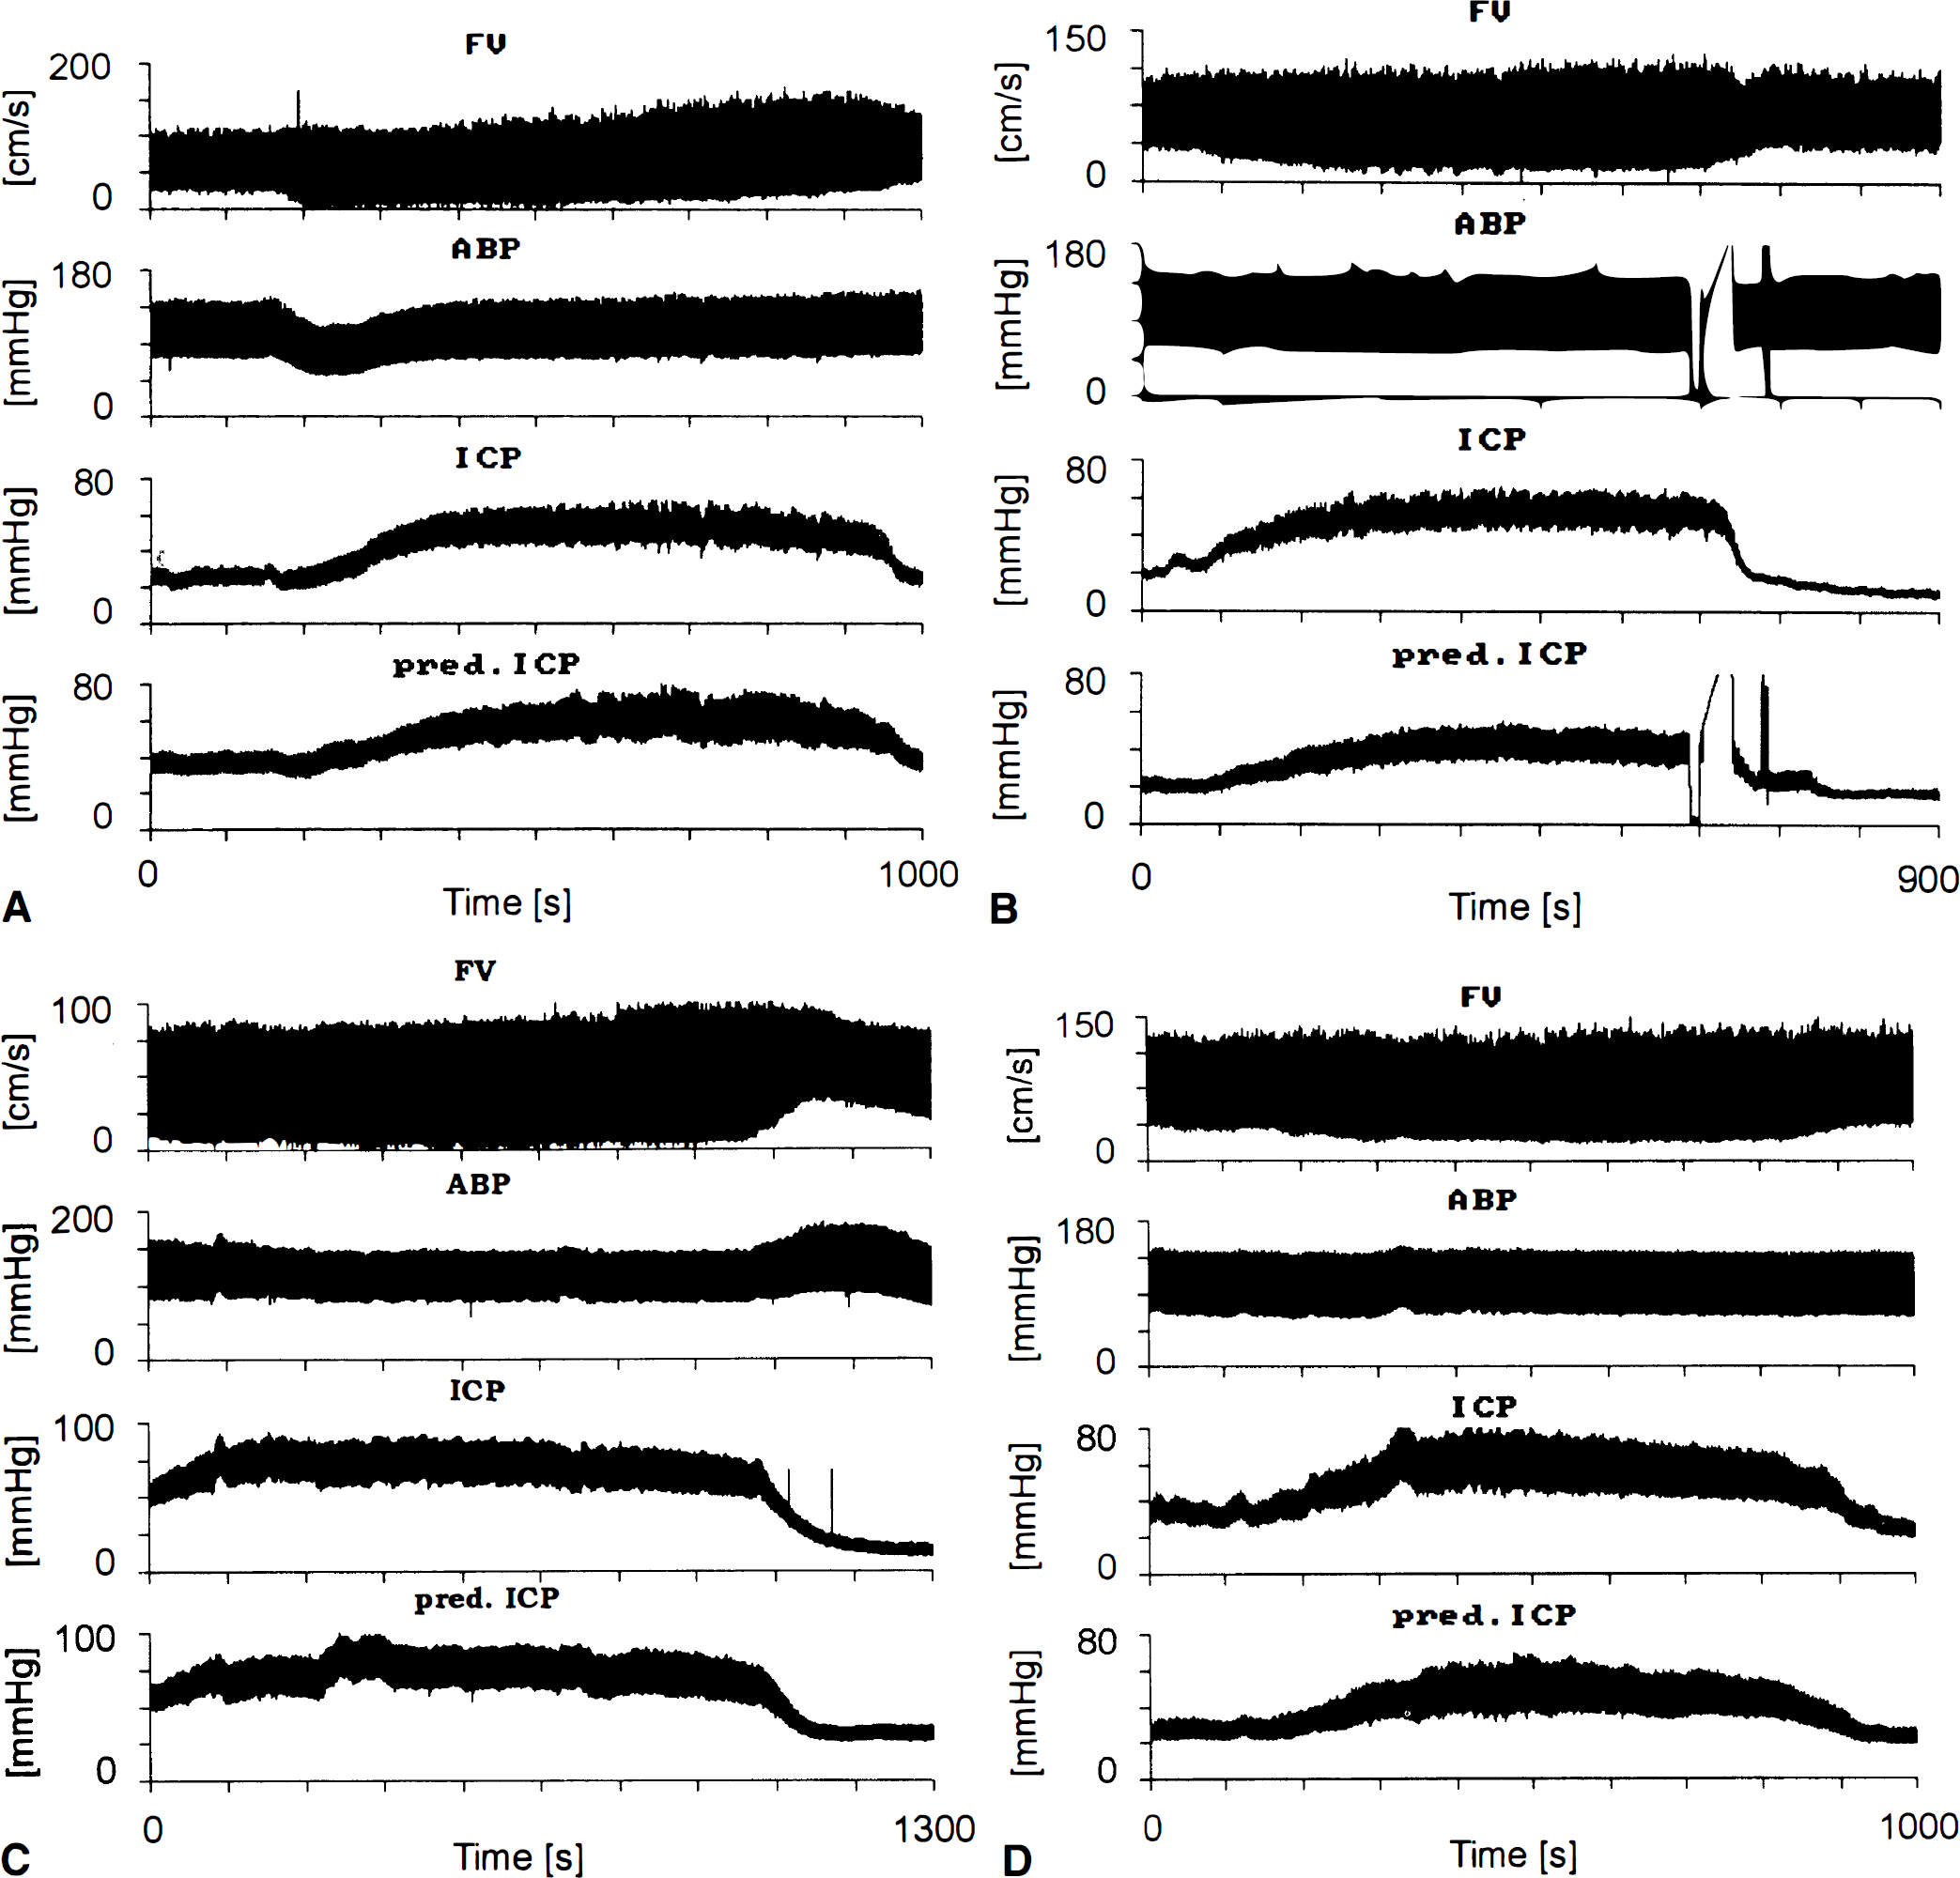
Flow velocity, arterial blood pressure (ASP), and measured and predicted intracranial pressure (ICP) plateau waves in
Comparison of measured and predicted ICP in 7 patients during the occurrence of A-waves evaluated at baseline and plateau line level
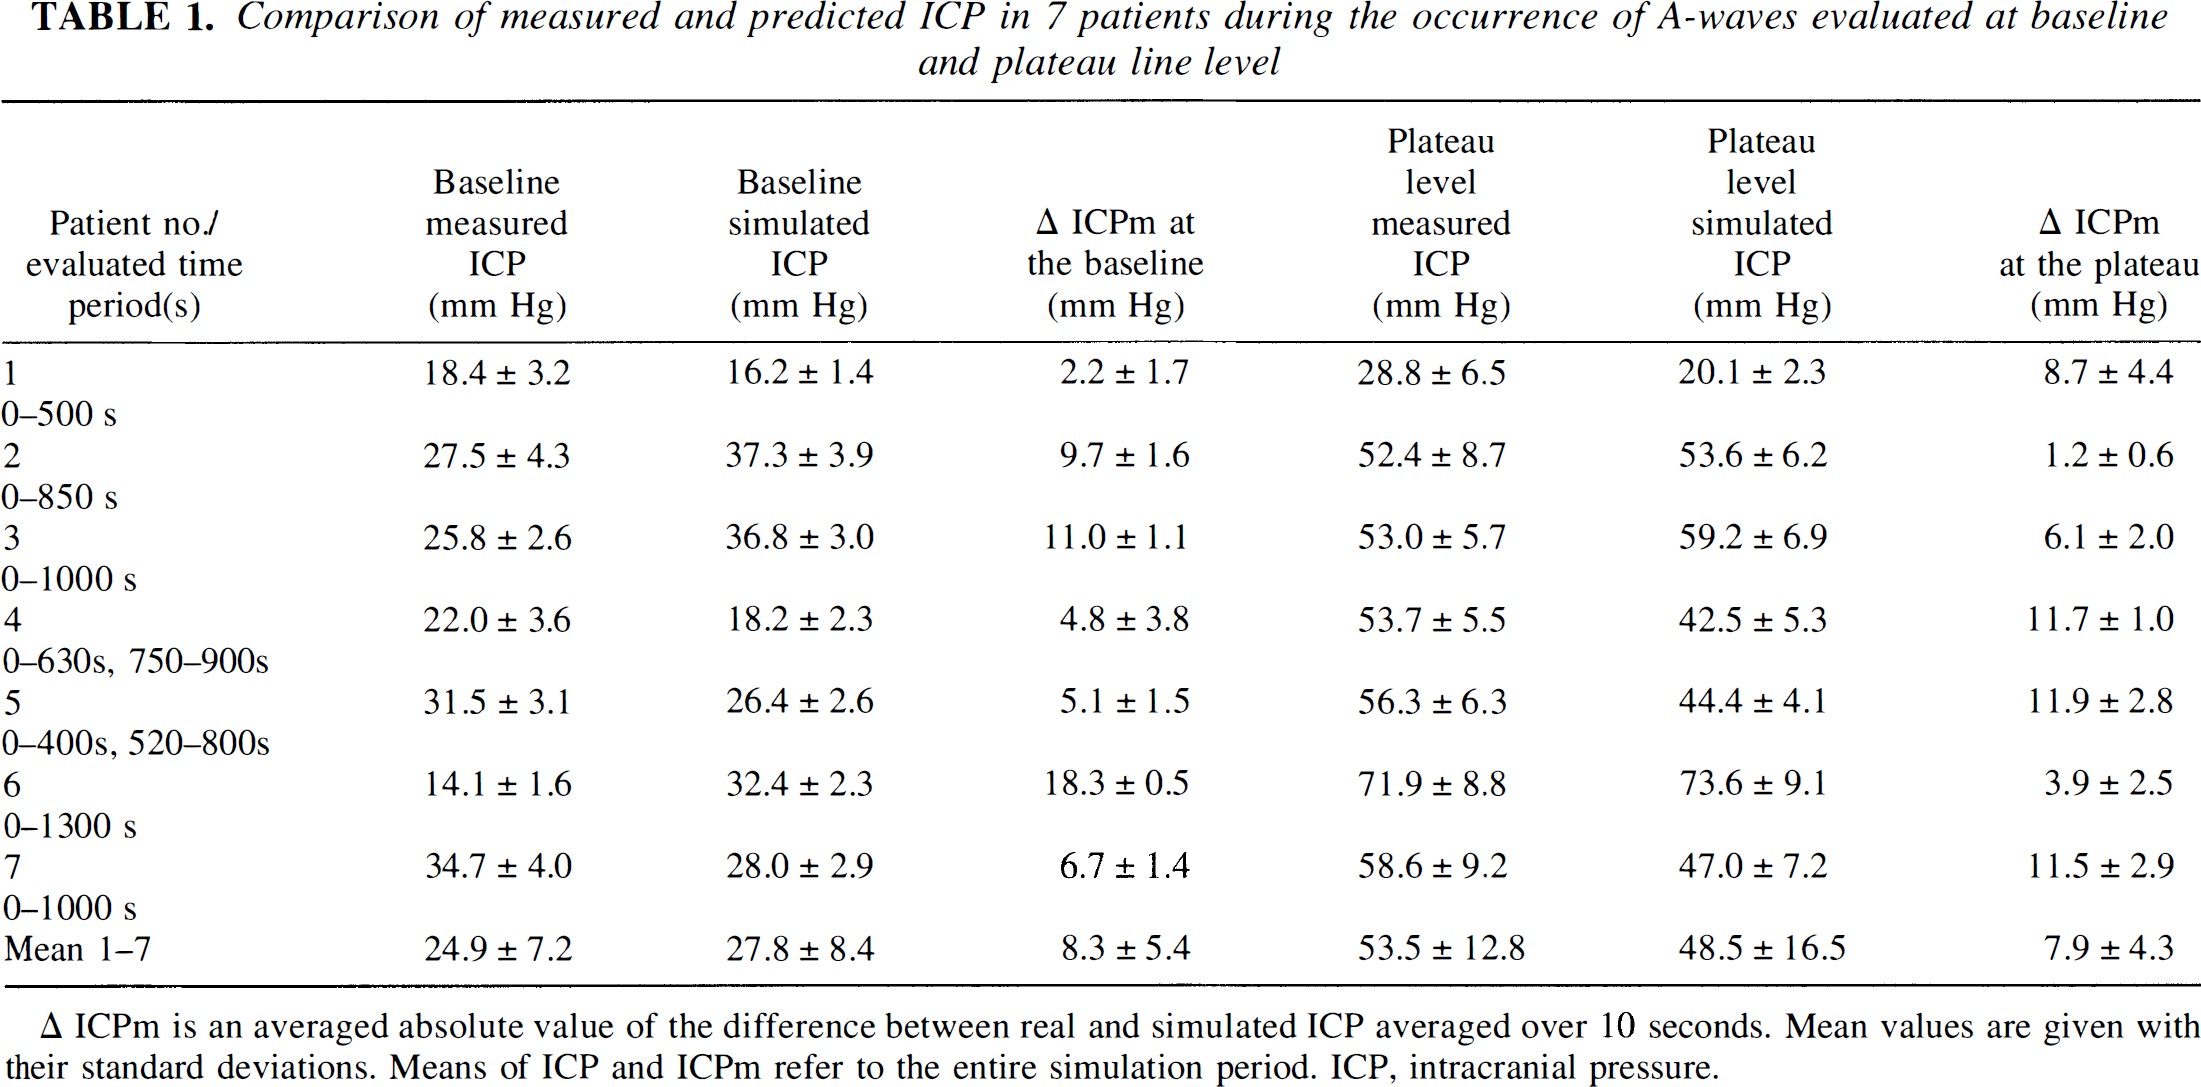
Δ ICPm is an averaged absolute value of the difference between real and simulated ICP averaged over 10 seconds. Mean values are given with their standard deviations. Means of ICP and ICPm refer to the entire simulation period. ICP, intracranial pressure.
DISCUSSION
The investigated mathematical model could be used to predict dynamic changes in ICP related to global cerebral vasodilatation. We have shown that the described ICP simulation procedure was capable of assessing the typical shapes of A-waves in all seven patients. Our algorithm (Fig. 1) describes the relationships between ICP, ABP, and FV more simply than mathematical models of cerebrospinal dynamics based on physiologic mechanisms (Hoffman, 1987; Ursino, 1996; Czosnyka et al., 1997b) and may easily be applied in clinical practice. The relationship between changes in ABP and ICP is related to the state of cerebral autoregulation: with autoregulation intact an increase in ABP produces decreases in ICP, with autoregulation impaired variations in ABP are passively transmitted to ICP (Muizelaar et al., 1989; Czosnyka et al., 1997a). It is assumed that before the plateau wave, autoregulation is preserved (Rosner, 1984). On top of the plateau wave, where cerebral vessels are maximally dilated, autoregulation is disturbed—this may be confirmed in data, which has been studied from this aspect before (Czosnyka et al., 1996, 1997b). Therefore, during plateau wave the character of the dynamic relationship between ABP and ICP should reverse. In a “black box” model these changes are difficult to show, nevertheless the modification is smooth, as the shapes of simulated plateau wave are continuous (Fig. 2) and average absolute errors in ICP simulation are similar for the baseline and plateau levels (Table 1). Transition of the filter coefficients from autoregulating to nonautoregulating stages is controlled by the change in the dynamic relationship between ABP and FV and by the change of PI described by many investigators as correlating well with ICP (Klingelhöfer et al., 1988; Chan et al., 1992). TCD characteristics describing vascular modification of the ABP-ICP relationship are derived from six consecutive samples of ABP and FV, i.e., from a fraction of one pulse evolution of both signals. This part of the relationship probably reflects the mechano-elastic properties of arterial bed (Giller et al., 1996).
The number of patients studied was limited, therefore calculated mean errors in simulation cannot be easily accepted as absolute assessment of accuracy with a high confidence. The opportunity to monitor the hemodynamic effects of plateau waves using TCD is difficult in clinical practice. This is due not only to the random occurrence of A-waves, but also to difficulties in obtaining artifact-free periods of recording with noninvasive external TCD probes, which prone to displacement, thus producing changes in angle of insonation, interference from artificial respiration, etc.
The described method of testing one patient and use the remaining 16 patients as reference group was chosen to enable both to generate the ICP simulation procedure (matrix A and vector B [see Appendix]) from a maximum number of reference patients and to avoid a direct influence of the tested patient.
According to the American National Standard of the Association for Advancement of Medical Instrumentation, errors of 10% in the assessment of mean ICP are tolerated even in accurately working ICP monitoring devices (Brown, 1988). The absolute error (Δ ICPm) in our simulation was around 30% at the baseline but only 15% at top of plateau wave. Good agreement between the relative increase in ICP during plateau wave and an increase resulting from ICP simulation is particularly important. This may mean that even if an absolute accuracy for ICP prediction is limited, the method is able to detect waves of ICP noninvasively. Unstable ICP contains a clinically important warning message about decreasing cerebrospinal compensatory reserve. This may happen after mild and minor head injuries, due to increase in brain swelling, intracerebral bleeding, etc. Therefore, the method, being able to indicate such an instability noninvasively would be clinically useful, even if the absolute accuracy is limited. It would be also of great help in monitoring those patients in whom direct ICP measurement cannot be used (frequently in liver failure, pregnancy, etc). Theoretically, time of simulation is unlimited, as long as ABP and FV waveforms are monitored properly. Limitations arise from the possible impairment of the patient caused by long-term fixations of the Doppler probe. During long-term prediction of ICP over a day or longer monitoring breaks are necessary.
A good accuracy of simulation was observed in absolute increase in ICP pulse wave and a specific change in the shape of this wave commonly found during plateau wave. During plateau waves the amplitude of ICP pulsations increases (Lundberg et al., 1968; Rosner, 1984) due to reduced compliance of cerebrospinal space and increased compliance of walls of cerebral arteries (Czosnyka et al., 1997a). Information included in pulse amplitude of ICP is important clinically (Portnoy et al., 1982; Eijndhoven et al., 1986; Piper et al., 1990; Price at al., 1993). Therefore, simulation of its dynamic fluctuations may further facilitate clinical continuous noninvasive bed-side monitoring of ICP.
CONCLUSION
A mathematical model is able to simulate plateau waves of ICP. The method is of potential clinical use for noninvasive detection of unstable behavior of ICP using TCD ultrasonography and direct ABP measurement.
Footnotes
APPENDIX: CONSTRUCTION OF THE INTRACRANIAL PRESSURE SIMULATION PROCEDURE
Precise descriptions of the calculations performed can be found in earlier studies (Schmidt et al., 1997; 1998). The intracranial compartment was considered a “black box” with arterial blood pressure (ABP) and intracranial pressure (ICP) as the input and output variables, a model which was earlier used by Kasuga et al. (1987). In a configuration such as this, the system's response may be approximately calculated by a linear signal transformation, more precisely called a weight function or digital filter of finite impulse response. The rule of transformation is given by the formula
They could be calculated from flow velocity (FV) and ABP measurements. They were suitable to estimate the above-mentioned filter coefficients wi.
Six coefficients t0, …, t5 of a weight function from ABP to FV signal were used as TCD characteristics. The coefficients were determined by the formula
A multiple regression model was constructed and applied to the 1585 calculated pairs of data sets {wi} and {tj, PI} by the approach
The set {tj}, its squares {tj2}, and PI were considered as independent variables and sequentially each of the wi, i = 0, …, 25 as dependent variables. After a process of 26 multiple regression analyses, a (26 × 13) dimensional matrix Calculation of the set of coefficients {tj} and PI using ABP and FV sequences during a period of 14 cardiac cycles. Transformation of {tj} and PI into {wi} using the precalculated matrix Calculation of the current sample of the simulated ICP using the set of {wi} coefficients and 26 samples of ABP. Every 10 seconds interval points 1 and 2 of this algorithm are repeated to adjust the ABP-ICP transformation to a current presentation of cerebral hemodynamic profile.
A block diagram showing a conceptual structure of our model is presented in Fig. 1.
Abbreviations used
Acknowledgments
The authors thank Dr. HK Richards (Cambridge) for language corrections. Dr. M.Czosnyka is on leave from Warsaw University of Technology, Poland.