
Abstract
In positron emission tomography studies using bolus injection of [15O]water, activation responses reflect underlying CBF changes during a short time (15 to 20 seconds) after arrival of the bolus in the brain. This CBF sensitivity window may be too short for complex activation paradigms, however, particularly those of longer duration. To perform such paradigms, we used a slow infusion method of tracer administration to lengthen the CBF sensitivity window. The present study was designed to determine if this slow infusion technique yields similar results to a bolus injection with a short activation task involving memory for faces. When analyzed using statistical parametric mapping, scanning durations of either 90 or 120 seconds and a 90-second slow infusion schedule produced very similar results to a standard 60-second scan collected after bolus injection, indicating that statistically similar brain activation maps can be produced with the two infusion techniques. This slow infusion approach allows for increased flexibility in designing future studies in which a short CBF sensitivity window is a limiting factor.
Intravenous injection of 15O-labeled water is a standard method used to measure regional CBF with positron emission tomography (PET). With the conventional autoradiographic technique, [15O]water is administered as a bolus injection and data collection begins once the tracer reaches a threshold level in the brain (Herscovitch et al., 1983; Raichle et al., 1983). Many aspects of CBF measurement have been carefully evaluated, including optimal scan duration (Kanno et al., 1991). Although the data acquisition period typically varies from 60 to 120 seconds, the sensitivity of the final scan values to changes in CBF is not uniform throughout this period.
To assess the time-varying sensitivity of the scan value to CBF, the concept of contribution-weighted PET data (Iida et al., 1991) can be used in which the final scan value is considered to be a linear weighted average of the time-varying CBF. That is, each weight defines the contribution of CBF at a given time point to the final image values. Simulations of these weighting functions for a bolus injection of [15O]water show a sharp peak in their value after tracer administration, coincident with the arterial input function. Because of this rapid increase and decrease of the weighting functions, the final radioactivity measurements have a window of sensitivity to CBF of only 15 to 20 seconds. Studies using both bolus injections (Hurtig et al., 1994) and slow infusions (Silbersweig et al., 1993) of radiotracers have evaluated the temporal window of [15O]water activation scans by controlling the timing of the activation task with respect to tracer arrival in the brain. Slow infusions were found to substantially lengthen this period of sensitivity to changing CBF. Furthermore, using a new formula for contribution weight derived from the scanner count rate, Silbersweig et al. (1994) developed a slow infusion method to detect transiently occurring changes in CBF. A similar approach has recently been used by Braun et al. (1997).
For many [15O]water studies, the 15- to 20-second sensitivity window is sufficient to capture the event of interest. However, with more complex brain activation paradigms, this short period may not provide adequate sampling time. For example, if more than 20 seconds is required to complete the components of a task, the bolus technique will produce a tissue measurement that is sensitive to only a portion of the total task. This may add variability to the data as the sensitivity window will overlap with different components of the task from subject to subject. Additionally, a longer sensitivity window will cause the CBF signal to be the average of the subject response over multiple trials or stimuli. Thus, for some activation paradigms, a slow infusion technique that prolongs the CBF sensitivity window may provide better data than the bolus method.
The goal of the present study is to determine if the bolus injection and slow infusion techniques produce similar results when the two methods are used in the same subjects. That is, does performance of the same task during different infusion conditions yield similar brain activation patterns when assessed with traditional data analysis techniques? To address this issue, we designed an experiment in which healthy volunteers performed a cognitive activation task while undergoing scans with [15O]water administered either as a bolus injection or a 90-second slow infusion. We used a working memory task involving recognition of faces which has been used extensively in previous studies (Grady et al., 1994; Haxby et al., 1995; McIntosh et al., 1994). To determine if the two infusion techniques yield similar results, a delay interval for the working memory task was chosen that would allow for completion of at least one trial within the 15-second sensitivity window of the bolus technique. Previously, Sadato et al. (1997) has shown using simulation studies that comparable signal-to-noise ratios can be achieved with different tracer infusion methods by prolonging the scanning interval. To test these results, we produced brain activation maps at different scan lengths to determine the optimal slow infusion scan time that best correlates with the bolus results. In addition, we present a new formula for the time dependence of flow sensitivity and apply it to the measured bolus injection and slow infusion input functions.
METHODS
Subjects
Five healthy female volunteers, 21 to 39 years old, participated in the study. After full explanation of purpose, procedures, and risks of the study, informed consent was obtained from each subject. All subjects were medically screened to exclude brain or systemic diseases that might affect brain function. Although all subjects had normal blood work, ECG, and neurologic examinations, one subject did show white matter hyperintensities on magnetic resonance imaging examination. This study was approved by the National Institute on Aging Institutional Review Board and the National Institutes of Health Radiation Safety Committee.
Activation tasks
The subjects performed two tasks throughout the course of the scanning session (Haxby et al., 1995). For the control condition, a perceptual face matching task was administered. Performance of this task requires the subjects to indicate with a manual button press which of two faces shown in the bottom squares matches the face in the top square of a three-square array (4-second period for display and response). After a 1-second intertrial interval, the next trial begins. For the activation task, a delayed match to sample memory task was used. In this task, the subject is shown a sample face in the top square of the three-square array (3-second display). After a 6-second delay, the subject is shown the sample face along with a novel face in the bottom two squares of the display. The subject then has a 5-second period to respond. A correct response requires the subject to indicate which of the two faces was previously shown. After a 1-second intertrial interval, the next trial begins. The control and delayed memory tasks were administered in an alternating fashion throughout the scanning session. For both infusion conditions, task performance began approximately 30 seconds before injection and continued for 4 minutes. Accuracy and reaction times were recorded throughout the session.
PET imaging
[15O]water was used to measure CBF during task performance. Catheters were placed in a radial artery to obtain arterial blood data and in an antecubital vein of the opposite arm for radiotracer injection.
Each subject underwent 12 scans, 6 using a bolus injection and 6 using slow infusion. For each subject, the bolus and slow methods were alternated throughout the session, with the first pair of control and delayed memory scans gathered with bolus injection and the second pair with slow infusion. For the bolus condition, 10 mCi of [15O]water were injected manually over approximately 5 seconds. With bolus injection using three-dimensional imaging, higher doses were not used because the 10 mCi dose achieves a noise equivalent count rate that is only 8% lower than the maximum rate achieved with a 12 to 15 mCi injection (Sadato et al., 1997). For the slow infusion condition, tracer administration began with 12.8 mCi of [15O]water in the syringe and activity was infused over 90 seconds using an automatic infusion pump (Harvard model 22, Harvard Instruments, South Natick, MA, USA). This infusion duration was chosen in anticipation of subsequent studies, in which a 90-second window would allow for the capture of multiple trials when using long delay intervals of the delayed match to sample task. Because of the radioactive decay in the syringe during infusion, the actual dose of [15O]water to the subject was also 10 mCi for the slow condition. Injections were performed at 10-minute intervals.
Imaging was performed with a GE Advance tomograph (Waukesha, WI) with the interslice septa retracted. This scanner provides 35 slices with 4.25-mm slice preparation. For both bolus injections and slow infusions, acquisition began automatically when the scanner trues (plus scatter) count rate increased at least 50,000 counts per second above background levels. This threshold was set high enough to avoid premature triggering due to the earlier peak in the count rate curve caused by scattered events as the bolus passes through the arm veins and into the heart and lungs (Holm et al., 1996). Scans following bolus injections began 15±4 seconds (subject mean ± SD) after the start of injection. For slow infusions, scanning began at 42±5 seconds, much later due to the slow increase in count rate and the presence of some dead space in the intravenous injection line.
Scan acquisition consisted of one 60-second frame followed by four 30-second frames. Images were reconstructed using the algorithm of Kinahan and Rogers (1989) with a Hanning filter (cutoff at 0.25 mn−1) in the transverse direction and a ramp filter (cutoff at the Nyquist frequency) in the axial direction, resulting in reconstructed resolution of 6 to 7 mm in all directions. A transmission scan, using two rotating 68Ge pin sources, was used for attenuation correction. Scatter correction was performed by Gaussian fitting of the projection data (Stearns, 1995). Corrections for randoms, normalization, and deadtime were also applied. After reconstruction, the images were summed over time to produce data equivalent to frames of 60-, 90-, 120-, 150-, and 180-second duration. Image summation was performed without decay correction.
Arterial input functions were measured through 1.6-mm diameter tubing with an automated blood counting system. Blood was withdrawn at 3.8 mL/min and coincident events were counted at 1-second intervals by paired NaI(T1) detectors. These data were corrected for randoms, deadtime, and sensitivity. Dispersion correction was performed by deconvolution of the measured dispersion function, a sum of two exponentials (Daube-Witherspoon et al., 1992), with a mean transit time of up to 20 seconds, depending on the length of the tubing. Time shifts between blood and brain data were determined by aligning the scanner trues count rate data (measured once per second) to the blood data in a manner similar to that described by Iida et al. (1988).
CBF images were produced on a pixel-by-pixel basis by the autoradiographic method of Herscovitch et al. (1983), using an assumed value of the partition coefficient of 0.8 mL/gm (Iida et al., 1989). Data were calculated for each scan duration (60, 90, 120, 150, and 180 seconds) for both infusion methods. Final CBF images have units of mL/min/100 g, where a correction for average brain density of 1.05 g/mL has been applied. The global mean CBF was calculated for all scans by defining whole brain regions of interest on each brain slice with an automated edge-finding procedure started from a user-defined seed point. Whole brain CBF was determined from the average CBF value of all brain voxels. The effects of infusion method and scan length on the value of global CBF were assessed.
Activation analysis
All scans were registered and stereotactically normalized (Friston et al., 1995) into the space of Talairach and Tournoux (Talairach and Tournoux, 1988). Images were smoothed using a Gaussian filter with a full width at half maxima of 20 × 20 × 12 mm (x, y, z). For each subject, pixel CBF values from all scans were normalized to the global mean flow of that subject and than scaled to 50 mL/min/100 g across all subjects using a ratio adjustment method (Fox et al., 1988).
Data were analyzed using statistical parametric mapping (SPM 95; Welcome Department of Cognitive Neurology, London, England). Voxel-by-voxel comparisons of significant increases in CBF during the delayed memory task relative to the perceptual control task (Z-score threshold = 3.06; P ≤ .001) were assessed for both the bolus and slow infusion for each scan length. To determine differences between the bolus injection and slow infusion techniques, infusion by task interactions were analyzed, i.e., (taskbolus – controlbolus) – (taskslow – controlslow), contrasting each of the slow infusion scan lengths with the 60-second bolus data (Z-score threshold = 3.06; P ≤ .001). The 60-second scan duration was chosen as the standard for the bolus condition based on work of Sadato et al. (1997) where this length was found to provide the optimal signal-to-noise ratio with three-dimensional data on the GE Advance. Additionally, because multiple scans were collected for both bolus and slow conditions, the first scan was contrasted with the last scan of each condition to assess the effects of habituation and fatigue on brain activation patterns.
After conversion of the t-values to Z-scores, a cluster analysis was performed on each comparison to determine areas of significant activation based on significance level and spatial extent (Z-score threshold = 3.06; spatial probability threshold = 0.05) (Friston et al., 1994). Regional activations are described in terms of Brodmann areas (BA) from Talairach and Tournoux (Talairach and Tournoux, 1988).
Flow sensitivity profile
The purpose of the slow infusion was to prolong the CBF sensitivity window. The appendix presents the derivation of a formula (equation A.10) for the sensitivity of the PET integrated radioactivity value as a function of time. This function, based on the arterial input function, is used to define the time window during which the PET signal is sensitive to CBF for the different tracer administration schemes.
RESULTS
Whole brain CBF
Table 1 shows the whole brain CBF values as a function of infusion method and scan duration. For 60-second acquisitions, the global CBF values obtained with the two infusion methods differed by only 3% (36.3 versus 35.2 mL/min/100 g). As the acquisition was lengthened to 180 seconds, global CBF values decreased by 5.4 ± 3.3% for the bolus injection and by only 2.0 ± 2.8% for the slow infusion. Similar changes were found if the baseline or activation scans were analyzed separately. This small decrease as a function of duration could occur if the value used for the partition coefficient (0.8 mL/g) is slightly incorrect. In fact, because tracer clearance is more pronounced in the bolus case, an error in partition coefficient (which affects the clearance rate of the model) would produce a larger time-dependency for the bolus injection than the slow infusion, as found here. Other potential causes of the change in whole brain CBF with acquisition duration include errors in correction for time shift, dispersion, and tissue heterogeneity (Kanno et al., 1987).
Global mean cerebral blood flow
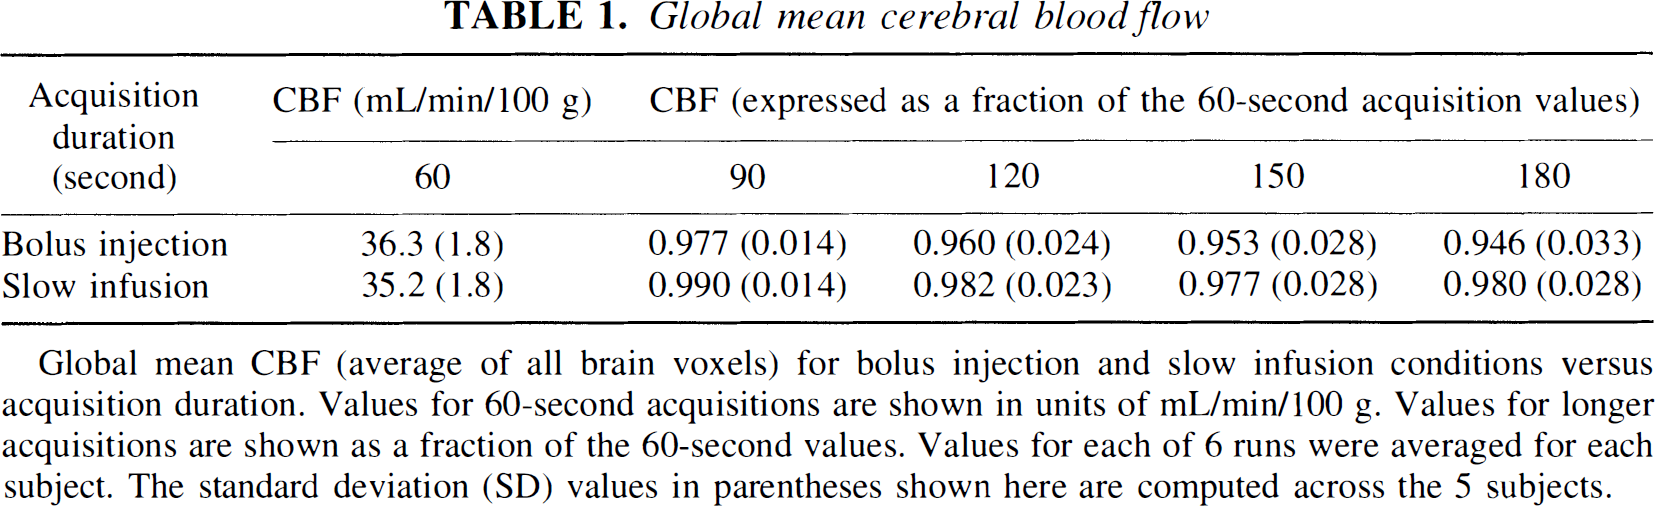
Global mean CBF (average of all brain voxels) for bolus injection and slow infusion conditions versus acquisition duration. Values for 60-second acquisitions are shown in units of mL/min/100 g. Values for longer acquisitions are shown as a fraction of the 60-second values. Values for each of 6 runs were averaged for each subject. The standard deviation (SD) values in parentheses shown here are computed across the 5 subjects.
In this small sample of young normal controls, the intersubject variation in global CBF values was small (~5%). The variability was very similar for bolus injection and slow infusion.
Task performance results
Data were analyzed using repeated-measure analysis of variance. No significant between- or within-group (infusion type) differences were found for task accuracy or reaction times. Also, no significant differences in accuracy were found between- or within-task (matching/delay). Subject performance averaged 98.6, 98.1, 98.9, 99.5% correct on the bolus matching, bolus delay, slow-infusion matching, and slow-infusion delay tasks, respectively. Subject reaction times averaged 1240±108, 1204±109, 1273±126, 1142±91 msec (mean ± SEM) for the bolus matching, bolus delay, slow matching, and slow delay tasks, respectively.
Activation results
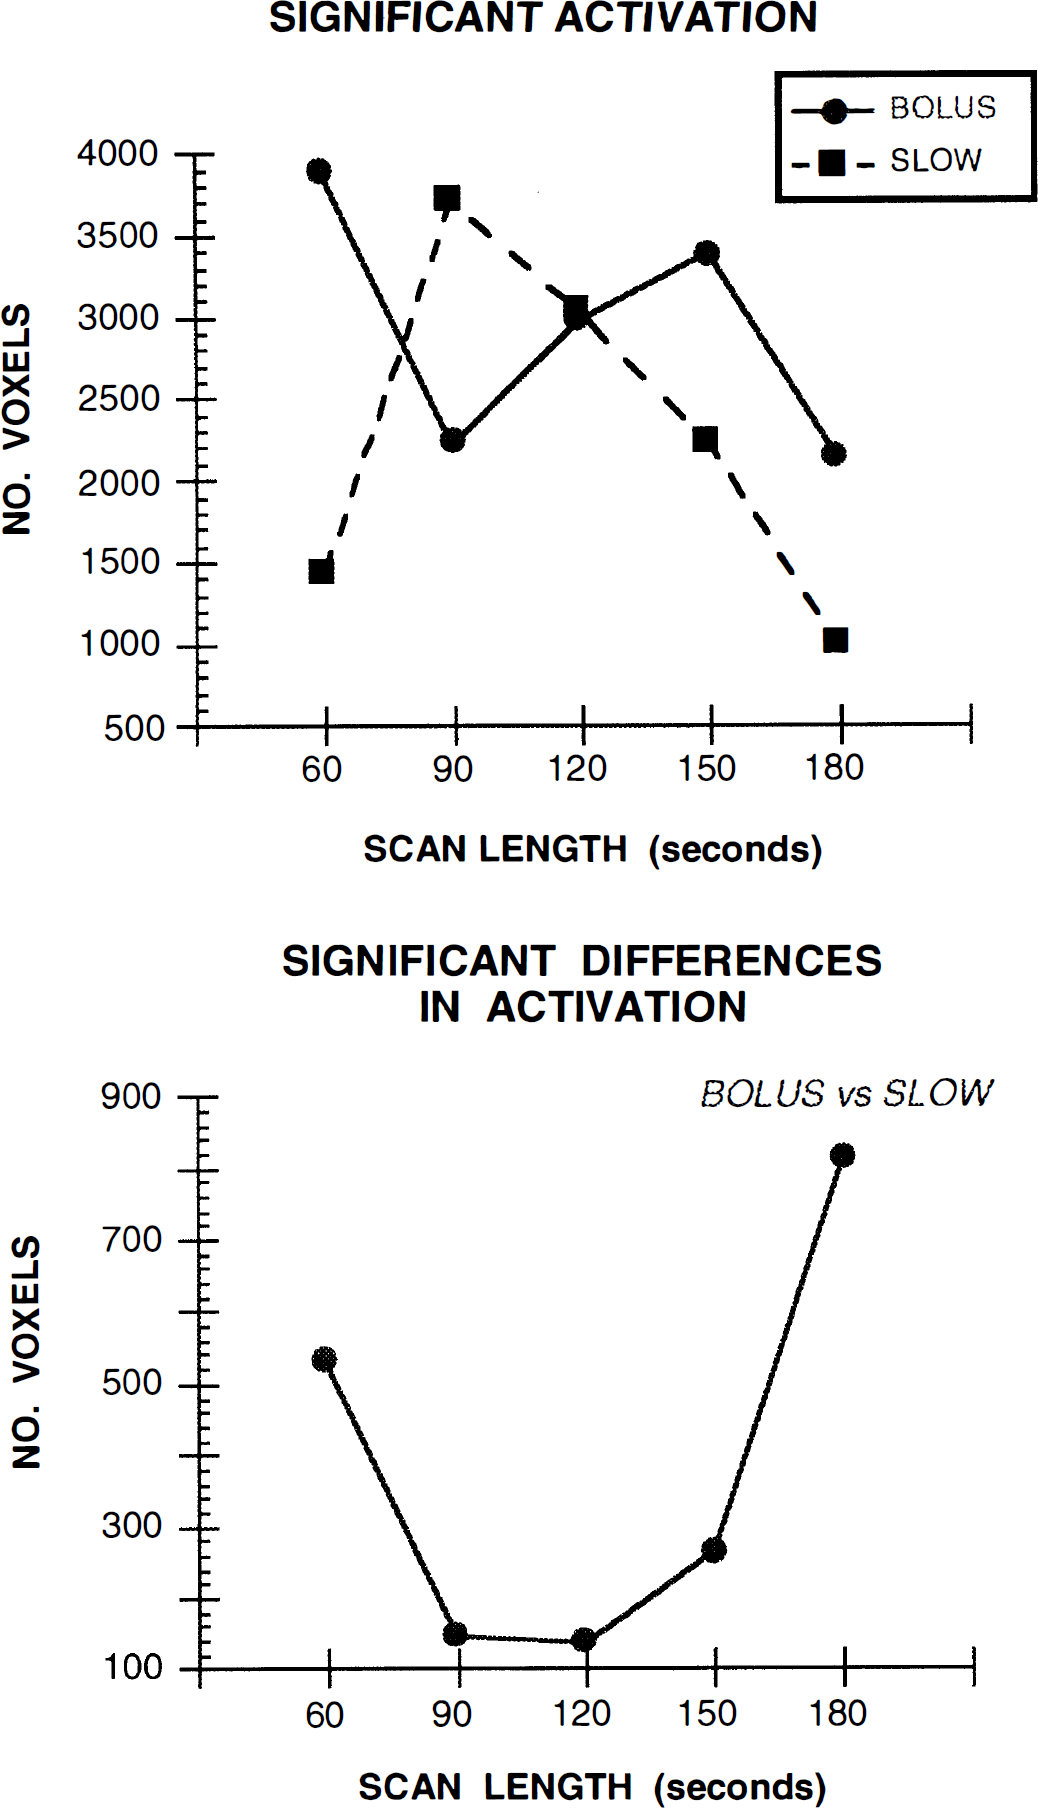
For the bolus condition, the activation map that showed the largest number of statistically significant voxels occurred for the 60-second scan length (Fig. 1A). While there was some fluctuation in the number of activated voxels at the different scans lengths, relative to the 60-second scan, fewer activated voxels were observed for scans of longer duration.
Changes in significant brain activation as a function of infusion method and scan duration.
Statistical parametric maps for bolus injection and slow infusion conditions are shown in Figs. 2A and 2B, respectively. Local maxima of regional activations are shown in Table 2. During bolus injection, the 60-second scan length resulted in widespread significant brain activation during the delayed memory task relative to the perceptual control task. This activation was observed in the cuneus (BA 19) and frontal lobes (BA 44/45/46) of both cerebral hemispheres. Right hemisphere activations were observed in the precuneus (BA 7) and the anterior cingulate (BA 32). In the left hemisphere, additional activations were observed in the parietal lobe (BA 7) and anterior insula.
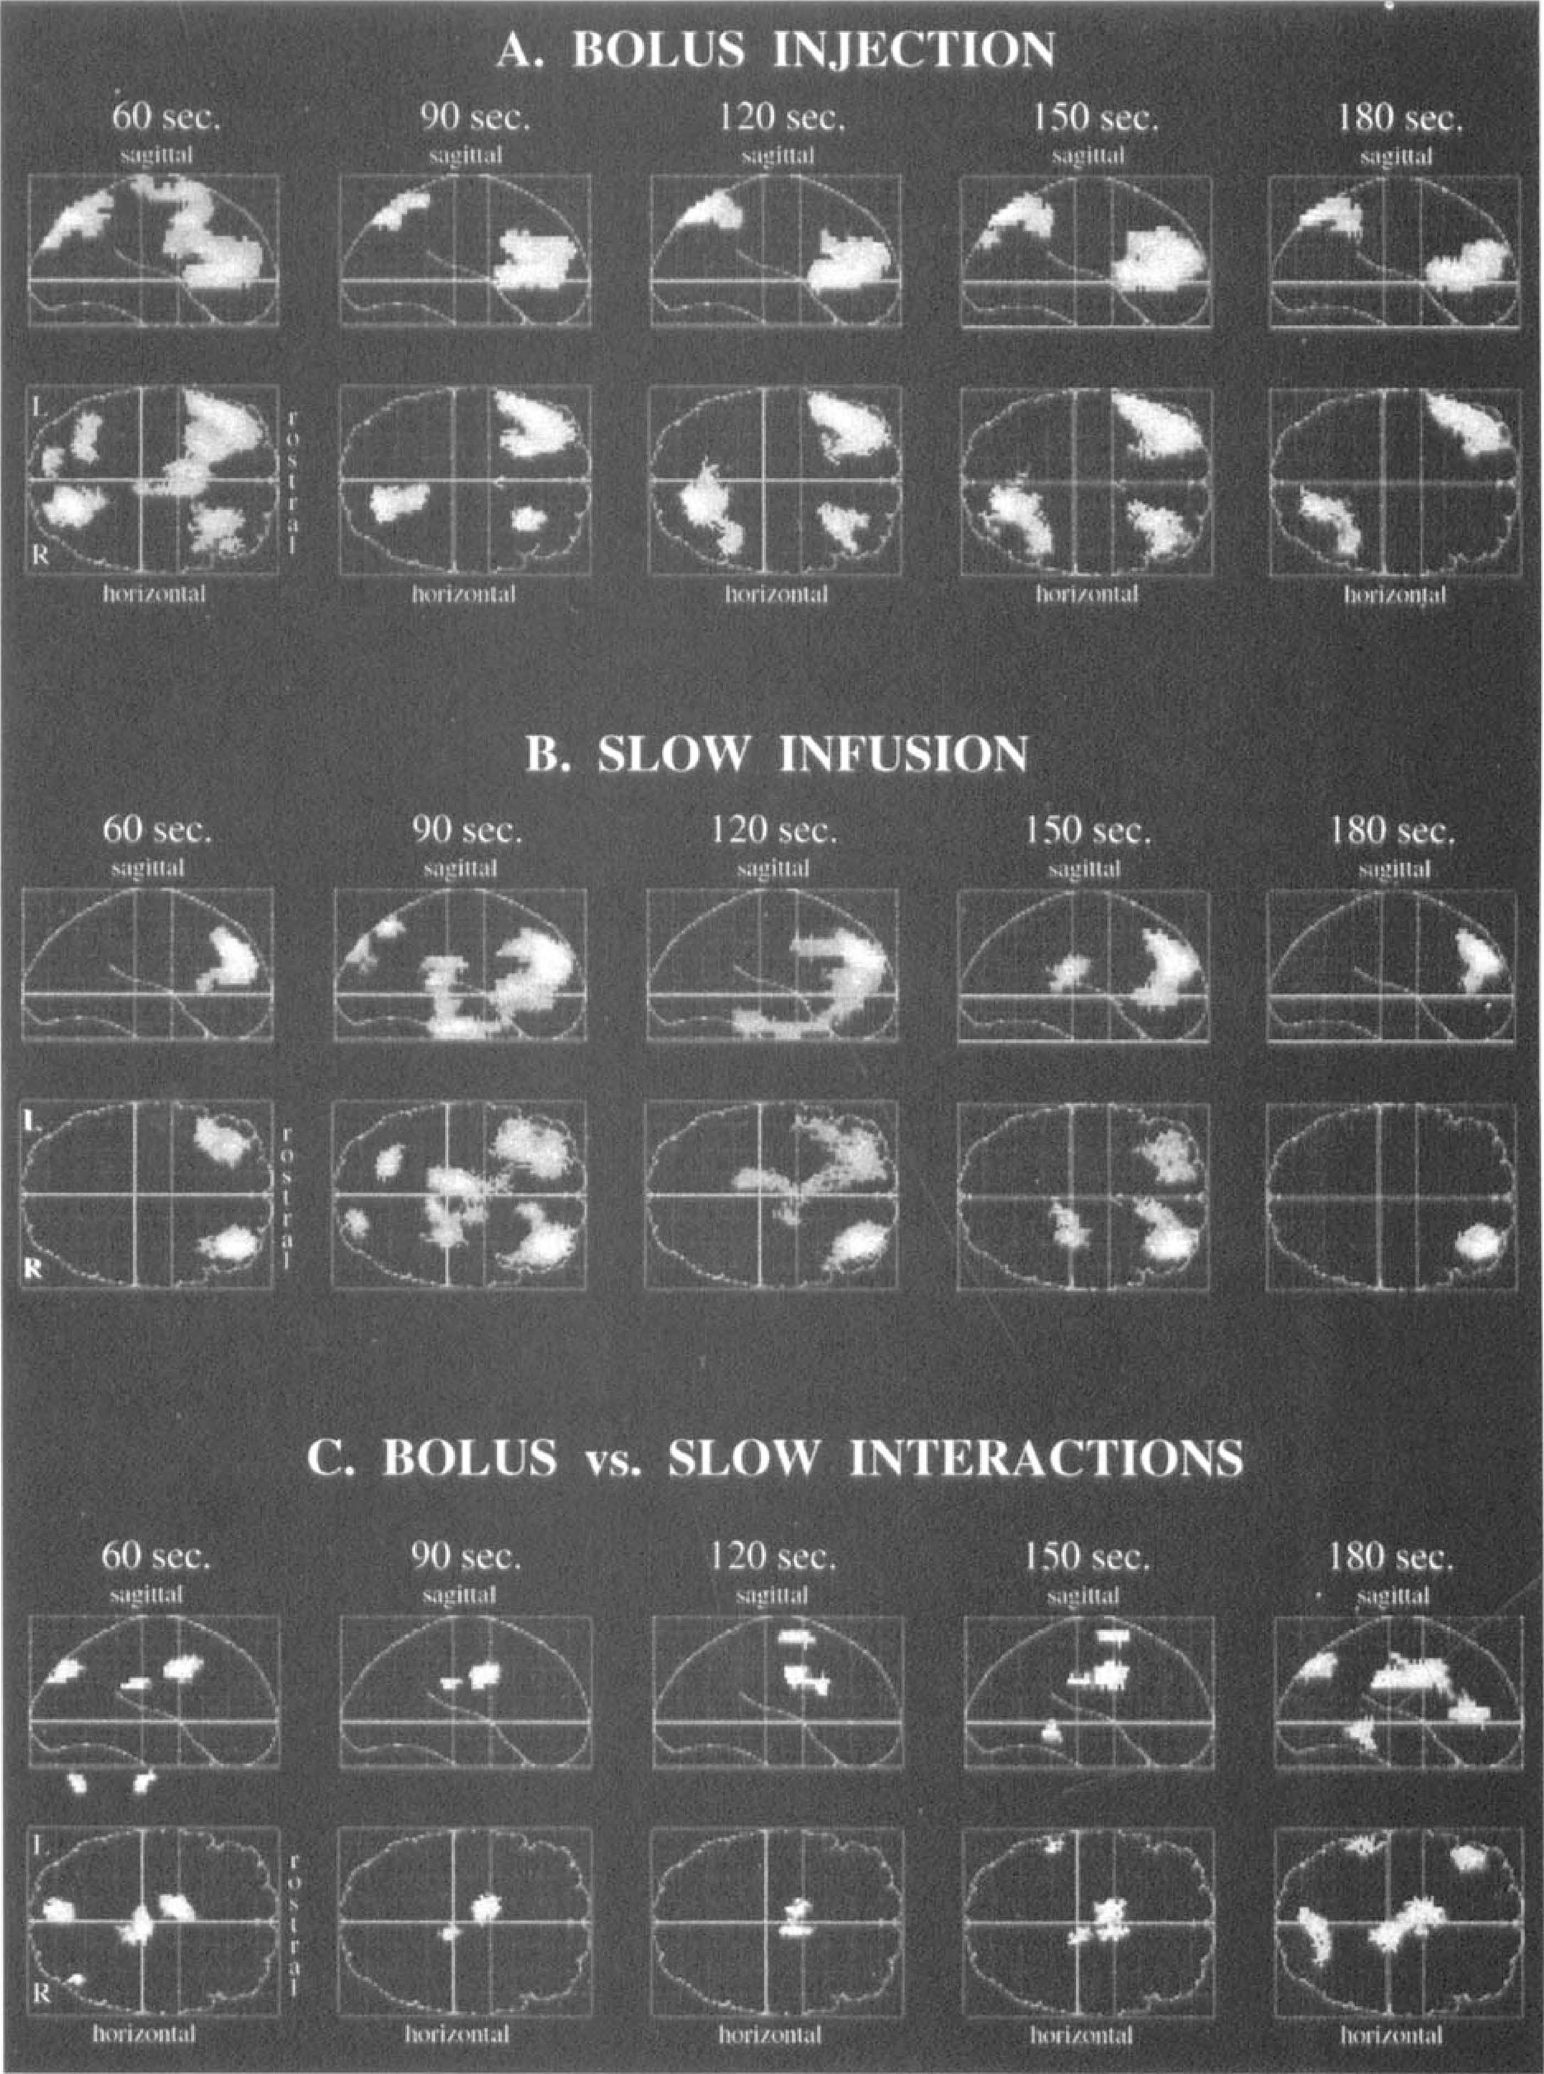
Brain activation maps illustrating significant differences during the delayed memory for faces task relative to the perceptual matching control task. Data for the different tracer infusion methods and scan durations are shown.
Activation local maxima
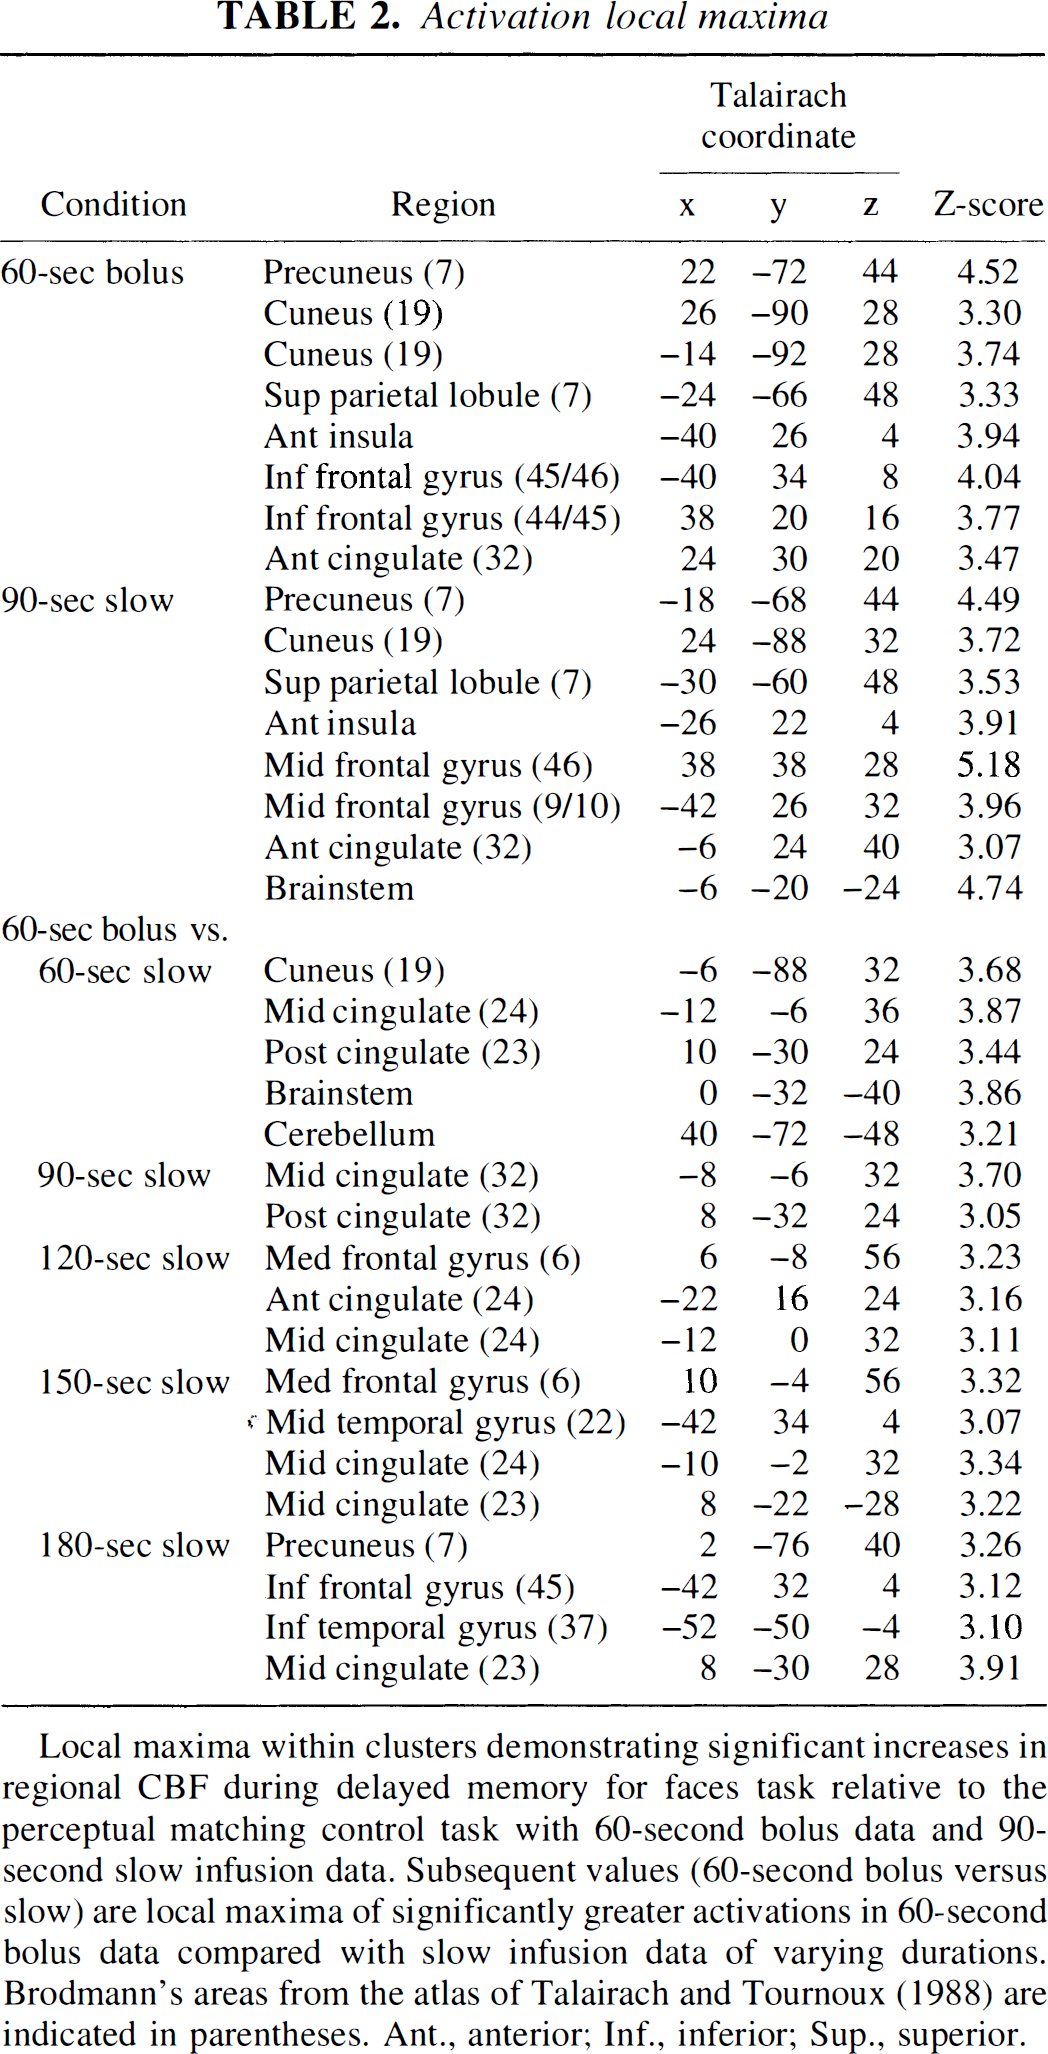
Local maxima within clusters demonstrating significant increases in regional CBF during delayed memory for faces task relative to the perceptual matching control task with 60-second bolus data and 90-second slow infusion data. Subsequent values (60-second bolus versus slow) are local maxima of significantly greater activations in 60-second bolus data compared with slow infusion data of varying durations. Brodmann's areas from the atlas of Talairach and Tournoux (1988) are indicated in parentheses. Ant., anterior; Inf., inferior; Sup., superior.
During slow infusion, the activation map showing the greatest number of significant voxels occurred with the 90-second scan length (Fig. 1B). A decrease in the number of activated voxels was observed for scans of longer duration. For the 90-second scan length, bilateral activation was found in the frontal lobes (BA 9/10/46). Additional activation of the cuneus (BA 19) was found in the right hemisphere. Precuneus (BA 7), parietal (BA 7), anterior insula, anterior cingulate (BA 32), and brainstem activations were found in the left hemisphere (Table 2 and Fig. 2B).
Interaction analysis, i.e., (taskbolus – controlbolus) – (taskslow – controlslow), was performed to contrast the slow infusion scans of different lengths with the 60-second bolus scans. This analysis was performed to determine the slow scan length which provided the most similar activation pattern to that of the 60-second bolus scan (Fig. 2C). Figure 1B shows that, relative to the 60-second bolus, the 90- and 120-second slow scans showed the smallest number of significantly different voxels (145 and 136 voxels, respectively), and the smallest number of regions showing significant differences in activation (Table 2). During the 90- and 120-second slow scans, smaller CBF increases were observed in the cingulate (BA 24/32) and medial frontal gyri (BA 6) relative to the 60-second bolus data (Bolus activation minus Slow activation). In analyzing the reverse interaction (Slow activation minus Bolus activation), 436 and 267 voxels were found in 90- and 120-second scans, respectively, showing a statistically greater activation with slow infusion than with the 60-second bolus injection. Increased activation was observed during the 90- and 120-second slow scans in the brainstem, putamen, and posterior parahippocampal gyrus (BA 35) relative to the 60-second bolus.
As for the assessment of time-dependent changes in brain activation patterns, a comparison of the first bolus scan with the last bolus scan revealed no significant differences in brain activation. Analysis of the slow infusion scans also did not show significant differences in activation.
Flow sensitivity profile
Figure 3 shows single-subject flow sensitivity profiles for a 60-second scan after a bolus injection (Fig. 3A) and for a 120-second scan after a slow infusion (Fig. 3B) calculated from Equation A.10. Since scanning began automatically after a required true count rate was achieved, some activity had reached the brain before the scan began; thus, there is sensitivity to CBF for “negative” times (Here, t = 0 corresponds to start of scan). The bolus curves in Figure 3A show that most of the sensitivity to CBF occurs within a 15- to 20-second period after arrival of the bolus in the brain. There is considerable variability in this profile between subjects, presumably due to cardiovascular differences in tracer delivery to the brain.
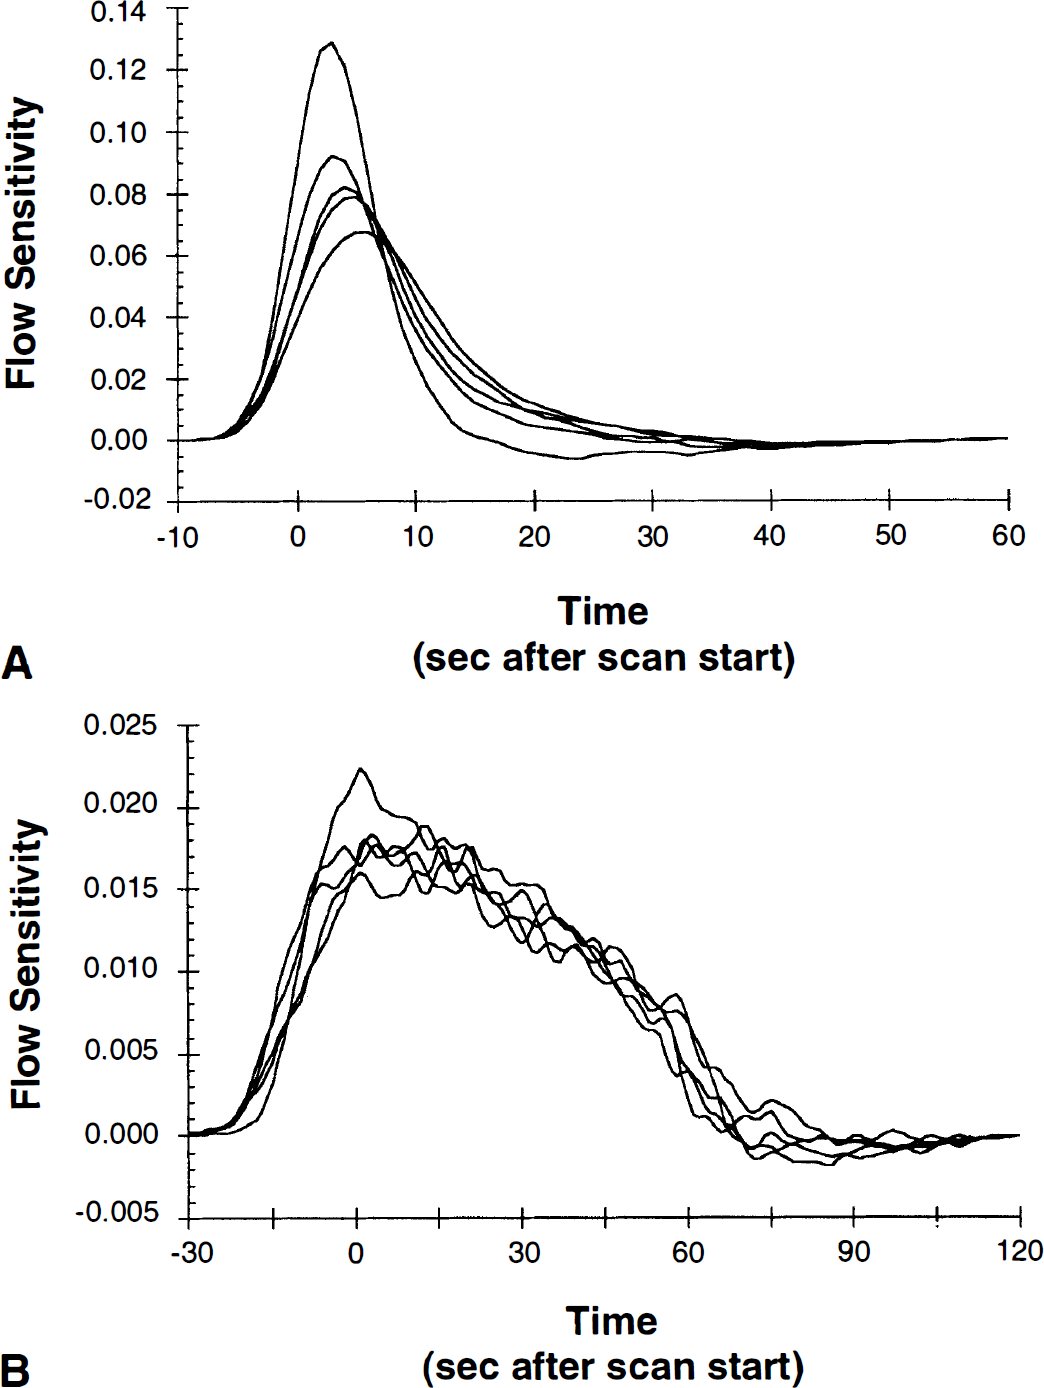
Flow sensitivity profiles. Each line is the flow sensitivity profile for a single subject calculated from equation A.10.
Figure 3B shows the flow sensitivity profiles for the slow infusions. Here, the PET radioactivity values are sensitive to flow for a period of approximately 90 seconds (the duration of the infusion). Thus, the slow delivery of tracer has substantially lengthened the critical time window for this measurement. In addition, the intersubject variability in these curves in reduced compared to the bolus curves. The curves for Figures 3A and 3B were generated with an assumed average flow value of 80 mL/min/100 g. Flow sensitivity curves calculated for a flow of 50 mL/min/100 g (data not shown) were very similar.
DISCUSSION
This study shows that similar results can be obtained with [15O]water bolus injection and slow infusion techniques. Brain activation maps from subjects performing the same task during both infusion conditions show only minor regional differences. The activation maps are similar, however, only when the optimal scan lengths are chosen for each tracer administration protocol.
Bolus injection and slow infusion
Activation after bolus injection of [15O]water was observed in extrastriate visual areas, the cingulate, insula, and parietal and frontal lobes when subjects performed a task involving delayed memory for faces. As with previous bolus three-dimensional studies (Sadato et al., 1997), the number of significantly activated voxels was greatest with a 60-second scan duration. This scan time proves to be optimal relative to longer intervals because the contrast between high and low CBF areas is reduced as imaging time increases due to more rapid tracer washout from the high flow regions. However, count data collected during this study was converted to CBF images by use of a measured arterial input function. While this provides quantitatively accurate CBF values which are nearly independent of scan duration, conversion of count data to CBF values will not improve the ability to detect statistically significant activation because the image signal-to-noise ratio is not improved (conversion from counts to CBF increases contrast and also increases noise).
The slow infusion method with automated injection of [15O]water over 90 seconds produced the greatest number of significantly activated voxels with scan lengths of 90 or 120 seconds. Similar to the bolus data, both slow scan durations showed activation of extrastriate visual areas, the cingulate, insula, and parietal and frontal lobes of the brain during the delayed memory task. Shorter scan times (60 seconds) yielded significant brain activation, yet maximum activation was not reached at this point because tracer infusion (90-second duration) was still occurring. With longer scan times of 150 and 180 seconds, a decrease in significant voxels was found because tracer washout from high flow regions lead to a reduced signal-to-noise ratio. Thus, when analyzed with methods typically used to assess brain activation patterns during cognitive activation paradigms, data gathered using the slow infusion technique were sensitive to the scanning duration. This finding agrees well with the simulation results of Sadato et al. (1997), who found that peak signal-to-noise for 2- and 3-minute infusions was achieved with scan durations of 2- and 3-minutes, respectively.
The task used in this study was designed with several issues in mind. For example, trial unique stimuli were used to provide a similar level of stimulation throughout the session. The effects of adaptation and fatigue were also controlled by alternating between bolus and slow infusion scans throughout the session. Assessment of time-dependent changes in activation patterns revealed no significant differences between the first and last scans of either the bolus or slow infusion conditions. Despite these controls, however, some differences are apparent in the activation maps when qualitatively comparing the results of the two infusion methods. For example, while both methods result in bilateral frontal lobe activation, the local maxima of the bolus condition occur in the inferior frontal gyri whereas the maxima of the slow condition occur in the middle frontal gyri. Additionally, the slow infusion maps show brainstem activation whereas the bolus maps do not.
These qualitative differences in the brain activation maps between the bolus and slow infusion conditions may be a function of several factors. One such factor is the variance of local maxima positions within activated clusters. Because local maxima serve as an indicator of the highest statistical value within a region, the regions activated during the two conditions can cover the same anatomical areas but vary in the exact position of the maxima evident within the significant clusters. This may lead to the differences in location of the maxima between the two conditions, but other factors may be responsible for anatomic variations in the activation patterns themselves. Because all subjects began the session with the bolus injection followed by slow infusion scans, it may be that scan order plays a role in the brain activation patterns. For example, subjects may be more alert during the first few scans, leading to slightly different regional activation than that found later in the session. However, a comparison of the first and last scans for either infusion condition showed no significant differences, suggesting that the pattern and magnitude of activation was consistent throughout the session. Furthermore, analysis of performance data revealed no significant differences in accuracy or reaction times between either method.
Thus, a more likely factor in these activation differences is the issue of the overlap of the CBF sensitivity window with task performance. With the bolus method, only one trial is captured within this window (~15 seconds) while the slow infusion method is sensitive to performance over approximately six trials with a 90-second window. Because the bolus CBF sensitivity profile is sharply peaked (Fig. 3), the bolus injection results may be more heavily weighted towards one portion of the task. The CBF sensitivity profile of the slow infusion, on the other hand, should weight the CBF changes more evenly and provide a more accurate representation of regional involvement during the task as a whole or over an average of several trials. Another factor is the temporal lag of the arrival of the tracer to the brain in relation to the start of behavioral performance. While the task was begun 30 seconds before isotope injection for all scans, scanning began approximately 15 seconds after tracer administration during the bolus condition and approximately 40 seconds after tracer administration during the slow condition. Thus, the CBF sensitivity profile and the arrival time of the tracer in the brain may be factors in the more dorsal activation pattern found in the bolus condition and the more ventral activation pattern found in the slow condition.
In terms of statistically significant differences between the two infusion methods, however, infusion by task interactions reveal only slight differences between either the 90- or 120-second slow infusion data relative to the 60-second bolus data. The areas of significant differences between the bolus and slow infusion methods involve primarily the cingulate gyrus and are relatively small. Because cingulate activation is associated with attentional processes in humans (Posner and DiGirolamo, 1998), these differences may be attributable to factors such as the CBF sensitivity profile and the arrival of the tracer in the brain as previously mentioned. That is, because the bolus condition captures information from a limited period at the start of the scan, heightened cingulate activity in this case may reflect more focused attention at the start of the task.
With regard to infusion by task interactions, it should be noted that in performing a statistical comparison of scans with different infusion methods and durations, as in Fig. 2C, it is important to make the statistical comparison of activation size after conversion to CBF values. If normalized count data were used, the absolute magnitude of the activation is expected to be different for the slow infusion method and a statistical test might artifactually show a difference, despite the fact that the bolus injection and slow infusion methods have comparable signal-to-noise levels. We conclude from these comparisons that a 90-second slow infusion of [15O]water with scan lengths of 90- or 120-seconds produce results similar to the standard bolus method. Based on the simulation results of Sadato et al. (1997), a small reduction in signal-to-noise would be expected with the 90-second infusion used here compared with bolus injection.
Using an activation task in which each trial required 15 seconds to complete, an entire event was captured within the 15- to 20-second CBF sensitivity window of the bolus method. By collecting multiple scans and gathering data over extended periods, both bolus injection and slow infusion methods averaged the CBF response over several trials and produced comparable results. Generally, this would not be the case for tasks of longer duration. For example, consider using a delay interval for a similar memory task that is longer than the 6-second delay used here. Depending on how the timing of the stimulus overlapped with the bolus arrival in the brain, the PET signal could vary from run to run and between subjects if the regional CBF pattern changes within different phases of the task. By using a slower infusion method during long stimulation periods, the CBF sensitivity window is extended (Fig. 3) and the activation results should be more consistent between subjects. Another factor to consider when using the slow infusion approach, however, is the possibility of habituation occurring during the extended imaging window. If one anticipates significant decreases in activation or changes in cognitive strategy occurring over a relatively short period, the slow infusion method may not be the method of choice.
Flow sensitivity profile
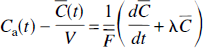
Equation A.10 shows the time-varying sensitivity of the PET scan value to CBF. Consideration of the mathematical terms in the flow sensitivity equation can give some insight into the shape of the curves in Fig. 3. The first term in the equation (Ca(τ)–̄C(τ)/V) accounts for the lack of equilibrium between tissue and blood, since ̄C/V = Ca at equilibrium. Therefore, the PET measurement is completely insensitive to flow for all times when the voxel of interest is in equilibrium with blood. Furthermore, for times when the tissue activity exceeds the equilibrium value, flow sensitivity is negative, i.e., increases in flow produce reductions in the PET signal because of increased tracer washout. This first term in equation A.10 is the dominant one and gives the sensitivity curves their shape. The second term in the equation (with exponentials) accounts for the clearance of tracer during the scanning period.
Equation A.10 is similar but not identical to that proposed by Iida et al. (1991), with the difference being the term ̄C(τ)/V. This term is missing from Iida's equation because the effect of time-varying flow was only considered in the influx portion of the model, and flow was assumed to be constant in the efflux term. Thus, unlike equation A.10, Iida's formulation predicts a positive flow sensitivity so long as the input function is non-zero.
Silbersweig et al. (1994) proposed a different flow sensitivity formula based on the derivative of the scanner count rate curve. This formula was used to define a covariate for statistical analysis during CBF studies in the presence of transient, randomly occurring events. The flow sensitivity formula derived here has been used in a similar application to produce a covariate for correlation analysis in an [15O]water study during intermittent stuttering (Braun et al., 1997). There is a close correspondence between the formula used in Silbersweig et al. (1994) and the one derived here. This can be shown by rearranging equation A.1 in the case of constant flow, i.e.,
The left hand side of equation 1 is the dominant term in equation A.10, and can thus be estimated from the derivative of the voxel radioactivity curve. Since the count rate curve is approximately linearly proportional to the average brain concentration, the scanner count rate data can be used to estimate d̄C/dt. The term λ̄C in equation 1 effectively corrects d̄C/dt for decay effects.
CONCLUSION
This work shows that the signal-to-noise characteristics of activation paradigms with prolonged infusion of [15O]water are comparable to those of bolus studies as long as the scan duration is increased appropriately. Use of the one-compartment model predicts that the CBF sensitivity window can be extended by prolonging the infusion. This approach provides an alternative method that is applicable for tasks with durations comparable to or longer than the 15- to 20-second sensitivity window of the original bolus method.
Footnotes
APPENDIX
This appendix presents a derivation of the time-varying sensitivity to CBF. Consider the differential equation for the one-compartment CBF model in the presence of time-varying flow:
A PET voxel value P is the tissue activity integrated over a scan frame from times t1 to t2 (t = 0 is the time of injection), i.e.,
To determine the sensitivity of P to the time-varying flow, it is convenient to express F(t) in terms of a discrete set of flow values Fj, i.e.,
Here, hj(t) are basis functions that together cover the time 0 to t2, so that for a set of increasing times τ k = kΔt, hj(t) = 1 for τj-1 t≤τ j and 0 otherwise. Thus, Fj is the CBF value from t = τj-1 to t = τ j . Then, the sensitivity of the PET value P to each flow value Fj, can be approximated by Taylor expansion of the Fj values about ̄F, the mean flow during the scan, i.e.,
Thus, the PET value P can be approximated as a linear weighted average of the time varying CBF Fk and the partial derivative of P with respect to Fk is the contribution weight (w(τ k )) at that time. Taking partial derivatives of equation A.3 with respect to Fk yields:
Substituting equation A.4 into A.2 and taking partial derivative with respect to Fk yields:
Rearranging integrals yields:
where ̄C(s) is the tissue concentration from equation A.2 when flow is constant, i.e., Fj = ̄F. Substituting equation A.8 into A.6 yields the contribution weight at time τ k :
Finally, by taking the limit as Δt goes to zero, the discrete contribution weights w(τ k ) become the continuous flow sensitivity function w(τ) as follows:
Equation A.10 excludes a leading multiplicative constant. For presentation purposes (Fig. 3), w(τ) is normalized to have an integral of 1.0.
Acknowledgments
The authors thank the NIH PET staff for their technical expertise and Gerard Jacobs for data processing assistance. The support of Dr. Mark Schapiro is also appreciated.