
Abstract
The equilibrium brain/plasma distribution ratio for 3-O-methyl-D-glucose (methylglucose) varies with plasma and tissue glucose contents and can be used to determine local glucose levels in brain. This ratio was previously found to rise as brain glucose concentration fell in response to lowered plasma glucose content. The ratios, however, differed with the same tissue glucose levels in conscious and pentobarbital-sedated rats, suggesting that changes in metabolic demand might alter the quantitative relationship between the methylglucose distribution ratio and brain glucose concentration. To examine this possibility, metabolic rate was varied by focal drug application, and hexose concentrations measured in treated and surrounding tissue. When tissue glucose levels were reduced by raised metabolic demand, methylglucose distribution ratios also fell. When brain glucose levels rose due to reduced consumption, the methylglucose distribution ratio also rose. Thus, in contrast to the inverse relationship between brain/plasma methylglucose ratio and brain glucose concentration when brain glucose content is altered secondarily to changes in plasma glucose level, changes in brain glucose content induced by altered glucose utilization cause the brain glucose level and methylglucose distribution ratio to rise and fall in a direct relationship. Determination of brain glucose content from methylglucose distribution ratios must take into account rates of glucose delivery and consumption.
3-O-Methyl-D-glucose (methylglucose), a nonmetabolizable analogue of glucose, is often used to study properties of hexose transporters in animals and humans (Buschiazzo et al., 1970; Feinendegen et al., 1986) as well as assay intracellular water space (Kletzien et al., 1975; Foulkes et al., 1994). Because methylglucose competes with glucose for carrier-mediated transport across the blood–brain barrier, it is distributed between brain tissue and plasma according to tissue and plasma glucose concentrations (Buschiazzo et al., 1970; Gjedde, 1982; Gjedde and Diemer, 1983; Sokoloff et al., 1990; Dienel et al., 1991; Holden et al., 1991). Equation 1, derived from Michaelis–Menten kinetics for competitive transport, provides a theoretical basis for the assessment of local brain tissue glucose levels from measured equilibrium tissue/plasma distribution ratios for labeled methylglucose, i.e., CE*/CP* (Gjedde and Diemer, 1983).

where KT is the Michaelis–Menten half-maximal transport constant for glucose; S is the physical distribution space for hexoses in brain (e.g., generally considered equal to the tissue water content); CE* and CE are labeled methylglucose and glucose concentrations in brain, respectively; and CP* and CP are labeled methylglucose and glucose concentrations in plasma, respectively.
Determination of local rates of glucose utilization (LCMRglc) with the deoxyglucose (DG) method requires the use of a factor, the so-called “lumped constant,” to convert the rate of DG phosphorylation to glucose utilization (Sokoloff et al., 1977). The lumped constant has been found to vary with the concentration of glucose in the tissue, particularly in hypoglycemia (reviewed by Sokoloff et al., 1990). Normally, the glucose level is acceptably uniform throughout the brain and the lumped constant can be determined directly in the brain as a whole. In pathophysiological conditions with focal abnormalities and local changes in tissue glucose content due to local imbalances between glucose supply and demand, however, the local lumped constant must be determined specifically for the local regions of interest. Also, in such conditions, if labeled glucose is used as the tracer to determine LCMRglc, tissue glucose concentrations should be determined at the local level since the brain/plasma distribution ratio for glucose is needed to calculate LCMRglc (Hawkins et al., 1985; Hawkins and Mans, 1989). A method to determine local glucose contents in all regions of the brain simultaneously would, therefore, be of considerable usefulness in studies of local functional and metabolic activities in pathophysiological states.
Our ultimate goal was to develop a double-label autoradiographic method with which to determine local glucose concentrations, local lumped constants, and LCMRglc simultaneously in the same brain structure for use in pathophysiological conditions (Sokoloff et al., 1990). We, therefore, previously examined experimentally the relationships among brain glucose content, equilibrium methyl-glucose distribution ratio, and the lumped constant of the [14C]DG method (Dienel et al., 1991; Holden et al., 1991). In that study, brain glucose levels were altered by clamping the arterial plasma glucose concentration at various levels ranging from hypoglycemia to hyperglycemia. Under these conditions, the equilibrium methylglucose distribution ratio was found to rise very slowly with decreasing plasma and brain glucose contents in the hyperglycemic and normoglycemic range but to rise steeply with progressively greater severity of hypoglycemia. Distribution ratios obtained in our conscious rats (Dienel et al., 1991) were, however, lower than those obtained with similar brain glucose levels in barbiturate-sedated rats (Gjedde and Diemer, 1983) in which LCMRglc would be reduced (Crane et al., 1978). This discrepancy suggested that there could be more than one value for the methylglucose distribution ratio with the same brain glucose level, depending upon whether the tissue level of glucose was altered by a change in its utilization, its delivery to the tissue, or a combination of both. Indeed, theoretical considerations (Gjedde, 1982; Gjedde and Diemer, 1983; Holden et al., 1991) and Eq. 1 predict such a discrepancy. Decreases in CE without decreases in CP would result in decreases in CE*/CP*. On the other hand, when CE decreases in proportion to decreases in CP, which is approximately what happens when CP is reduced (Buschiazzo et al., 1970; Dienel et al., 1991; Holden et al., 1991), CE*/CP* would rise since CE is much smaller compared to KT S in the numerator than is CP when compared to KT in the denominator (see discussion). In this present study we, therefore, directly examined the possibility that changes in local glucose content in brain due to altered metabolic demand might influence the relationship between brain glucose content and methylglucose distribution ratio differently than do changes due to reduced glucose delivery. Results confirm that changes in glucose level arising from altered metabolic demand must be taken into account when methylglucose is used to assay glucose levels in brain; they also suggest that metabolic demand might influence the values for intracellular water space determined with methylglucose.
MATERIALS AND METHODS
Chemicals
2-Deoxy-D-[1-14C]glucose (specific activity, 51 mCi/mmol), 3–O-[14C]methyl-D-glucose (57 mCi/mmol), and [3H]-methoxy inulin (174 mCi/g; stated purity, 99%) were purchased from DuPont NEN, Boston, MA, U.S.A. Before use, radiochemical purities of the hexoses were assayed as previously described (Dienel et al., 1990, 1991) and found to be >98%. The [3H]inulin was dissolved in 1 ml of 0.9% NaCl and purified by chromatography on Sephadex G25 M columns (PD-10, Pharmacia LKB Biotechnology, Uppsala, Sweden) to remove any labeled low molecular weight compounds (Cohen, 1969); fractions of the column effluent containing the 3H peak were pooled and, in some experiments, chromatographed again on Sephadex prior to use. Sodium penicillin G, sodium barbital, bicuculline methiodide, muscimol, and Evans Direct blue 53 were obtained from Sigma Chemical Co., St. Louis, MO, U.S.A.
Animals
Male Sprague-Dawley rats (Taconic Farms, German-town, NY, U.S.A.), weighing 300400 g, were fasted overnight before the experimental procedure to stabilize plasma glucose levels. On the day of the experiment, rats were anesthetized (1–1.5% halothane in 70% N2O/30% O2). Burr holes (2 mm diameter) were drilled through their skulls with a trephine; the holes were placed 2.5 mm from the midline and 4 mm from the bregma. The drill bit was cooled with ice-cold saline to minimize local heating, which causes tissue damage. For applications of penicillin, one burr hole was drilled over the left sensorimotor cortex and a small incision was made in the dura. For application of other drugs, one-to-four (one or two holes on each side of the midline) burr holes were drilled in the skull, but the dura was not cut. Burr holes were covered with Gelfoam (Upjohn, Kalamazoo, MI, U.S.A.) soaked in 0.9% saline. Polyethylene catheters (PE 50, Clay-Adams, Parsippany, NJ, U.S.A.) were inserted into a femoral artery and vein, and a plaster cast applied to the lower torso to restrain locomotion. In some of the experiments with penicillin and bicuculline, electroencephalogram (EEG) activity was monitored with a Beckman R611 Dynograph Recorder (Beckman Instruments, Fullerton, CA, U.S.A.).
All procedures were in strict accordance with the NIH Guide for Care and Use of Laboratory Animals and were approved by the local Animal Care and Use Committee.
Physiological variables
Rectal temperature was monitored with a thermistor (Yellow Springs Instrument Co., Yellow Springs, OH, U.S.A.) and maintained at 37°C with a thermostatically-controlled heating lamp. Arterial blood gases and pH were measured with a Model 170 pH/Blood-gas analyzer (Corning Medical Scientific, Medfield, MA, U.S.A.). Arterial hematocrit was determined from centrifuged arterial blood samples. Mean arterial blood pressure was measured with a Blood Pressure Analyzer (Micro-Med, Louisville, KY, U.S.A.) that had been calibrated with an air-damped Hg manometer. Arterial plasma glucose contents were measured in a Glucose Analyzer 2 (Beckman Instruments, Fullerton, CA, U.S.A.).
Experimental procedures
Induction of focal changes in rate of glucose utilization. Animals were allowed at least 2.5 h to recover from the surgery and anesthesia. Drugs were then applied topically to the exposed dura at 20–30 min intervals to produce and sustain focal increases or decreases in LCMRglc in the underlying tissue. To increase LCMRglc, focal seizures were induced by application of 50 U of penicillin G dissolved in 0.5 μl water or 1–4 μl of bicuculline (10 mM in 0.9% NaCl/10 mM sodium phosphate, pH 7.2–7.4). Rats exhibited facial twitching and marked right forelimb (hindlimbs were restrained) hemiparesis and hypotonia within 5–10 min after the application. Unilateral high amplitude spike EEG activity coincided with the behavioral changes, and both EEG and behavioral changes were maintained throughout the experimental interval by reapplication of 50 U of penicillin as needed; the average total dose per rat was 150 U.
To depress LCMRglc, sodium barbital (10 or 20 mM in 0.9% NaCl/10 mM sodium phosphate, adjusted to pH 7.2–7.4 with 1 N HCl) was applied in 2 μl (i.e., 20–40 nmol) doses; one-to-four doses spaced at 20–30 min intervals were reapplied to each burr hole so that the total dose per application site was either 40, 80, 120, or 160 nmol. Application of 1–4 μl of muscimol (20 mM in 0.9% NaCl/10 mM sodium phosphate, pH 7.2–7.4) was also used to depress LCMRglc.
Determination of LCMRgU and brain/plasma [14C]methylglucose distribution ratios. LCMRglc and equilibrium brain/plasma [14C]methylglucose distribution ratios were determined in separate groups of rats during either focal metabolic activation or depression. Procedures for their determination were initiated after the focal changes in LCMRglc had been sustained for 20–30 min; an additional topical application of the drug was made immediately before injection of the tracer and repeated at ∼20-min intervals thereafter, depending upon the schedule for each drug.
LCMRglc was determined by the [14C]DG method (Sokoloff et al., 1977). Briefly, after an intravenous pulse of [14C]DG ∼125 μCi/kg), timed samples of arterial blood were drawn for determination of plasma [14C]DG and glucose contents; plasma 14C concentrations were assayed by liquid scintillation counting (Model No. LS5801, Beckman Instruments) with external standardization. At ∼45 min after the pulse, rats were given a lethal dose of pentobarbital and their brains rapidly removed, frozen in isopentane chilled to −40 to −50°C with dry ice, and stored at −80°C. Each brain was cut into 20 μm-thick coronal sections in a cryostat at ∼ −20°C, dried at 60°C, and exposed to SB-5 x-ray film (Kodak, Rochester, NY, U.S.A.). Local tissue 14C concentrations were determined by quantitative autoradiography, and LCMRglc was calculated with the operational equation of the method (Sokoloff et al., 1977).
Steady-state brain/plasma distribution ratios for methylglucose were determined by quantitative autoradiography after a prolonged programmed infusion of [14C]methylglucose (50–70 μCi/kg) designed to maintain a constant concentration of 14C in arterial plasma throughout the experimental period (Dienel-et al., 1991). Arterial blood was sampled at 5–10-min intervals to monitor plasma glucose and 14C levels; animals were not included in the study if either value varied by > ± 10% during the experiment. At ∼60 min after initiation of the programmed infusion, a sample of arterial blood was drawn and the rats given a lethal dose of pentobarbital; their brains were rapidly removed and processed for quantitative autoradiography as described above. Local steady-state brain/plasma distribution ratios were calculated by dividing the local brain tissue 14C concentrations (determined by quantitative autoradiography) by the concentration in the final plasma sample.
Local brain/plasma distribution ratios for both glucose and [14C]methylglucose were also determined in another group of rats by direct chemical measurement of the hexose contents in extracts of dissected samples of funnel-frozen brain tissue. At 60 min after a pulse of [14C]-methylglucose (125 μCi/kg), rats were briefly anesthetized with thiopental (25 mg/kg) and their heads immediately funnel-frozen in situ with liquid nitrogen (Pontén et al., 1973). The heads were then removed, placed in liquid nitrogen, and stored at −80°C. During the funnel-freezing procedure, 100% O2 was administered via a nose cone to minimize tissue hypoxia. Immediately before and at ∼1 min after starting the freezing procedure, additional samples of arterial blood were taken for determination of plasma glucose and 14C contents, arterial pH, and arterial Po2 and Pco2 tensions. Means of the plasma hexose concentrations in the last two blood samples were used to calculate the brain/plasma distribution ratios; the ratios for [14C]methylglucose determined after the pulse would be within 10% of the true steady state value (Jay et al., 1990).
Sampling, extraction, and analysis of brain tissue. The frozen heads were brought to ∼ −25°C in a cryostat, and the skin, muscle, and skull removed. Superficial membranes and blood vessels were scraped from the surface of cerebral cortex, and 5–15 mg samples of cerebral cortex dissected out. Samples from rats given penicillin were dissected from homologous regions of the experimental and control cerebral cortex at the locations of the burr holes; three-to-five additional samples of tissue surrounding the burr holes were also taken, weighed, and analyzed. Samples from rats given barbital, bicuculline, or muscimol were dissected out similarly at the location of each burr hole as were three-to-five additional samples of surrounding tissue. Tissue samples were extracted with aqueous ethanol as previously described (Dienel et al., 1990), stored at −80°C until assayed for glucose content, by fluorometric enzymatic assay with hexokinase and glucose-6-phosphate dehydrogenase (Lowry and Passonneau, 1972), and for [14C]methylglucose contents, by liquid scintillation counting.
Assessment of blood–brain barrier damage. Cerebral cortical tissue directly under the burr holes through which barbital was applied was occasionally pink in color in contrast to the usual white, suggesting that barbital, particularly the highest doses, might be damaging the blood–brain barrier and allowing blood extravasation. To examine this possibility, rats were injected intravenously with 1 ml of Evans blue (20 mg/ml in 0.9% NaCl) and anesthetized with halo thane 5 min later. Their brains were then perfused with 0.9% NaCl for 5 min followed by 4% paraformaldehyde for 4 min. Results showed that staining of untreated foci by Evans blue occurred but could be minimized or prevented by careful drilling of the burr holes and cooling of the drill bit. Best results were obtained if the dura was not cut to facilitate drug delivery to tissue. None of the penicillin, bicuculline, or muscimol foci assayed and reported in this study were pink; data obtained with different doses of barbital for both undamaged and damaged (i.e., pink) tissue are presented separately.
To determine if the pink color reflected increased blood volume in the tissue, blood volume was determined with [3H]inulin. Rats were injected intravenously with [3H]inulin (∼200 μCi in 0.5–1 ml of 0.9% NaCl) at −60 min after application of the barbital or penicillin, and timed blood samples drawn for determination of their 3H contents; later 15–60 min, the final blood sample was drawn, rats were anesthetized, their brains funnel-frozen, and samples of brain dissected out and weighed as described above. Tissue samples were dissolved by shaking at room temperature overnight in 0.5 M NaOH, acidified with glacial acetic acid, after which their 3H contents were determined. Inulin space (%) was calculated as 100 (dpm/mg brain tissue)/(dpm/μl whole blood) (Smith and Rapoport, 1984).
RESULTS
Physiological variables
Physiological variables were essentially the same before and after topical application of penicillin or barbital and were also similar in the different experimental groups (Table 1).
Physiological variables in rats sampled by funnel-freezing
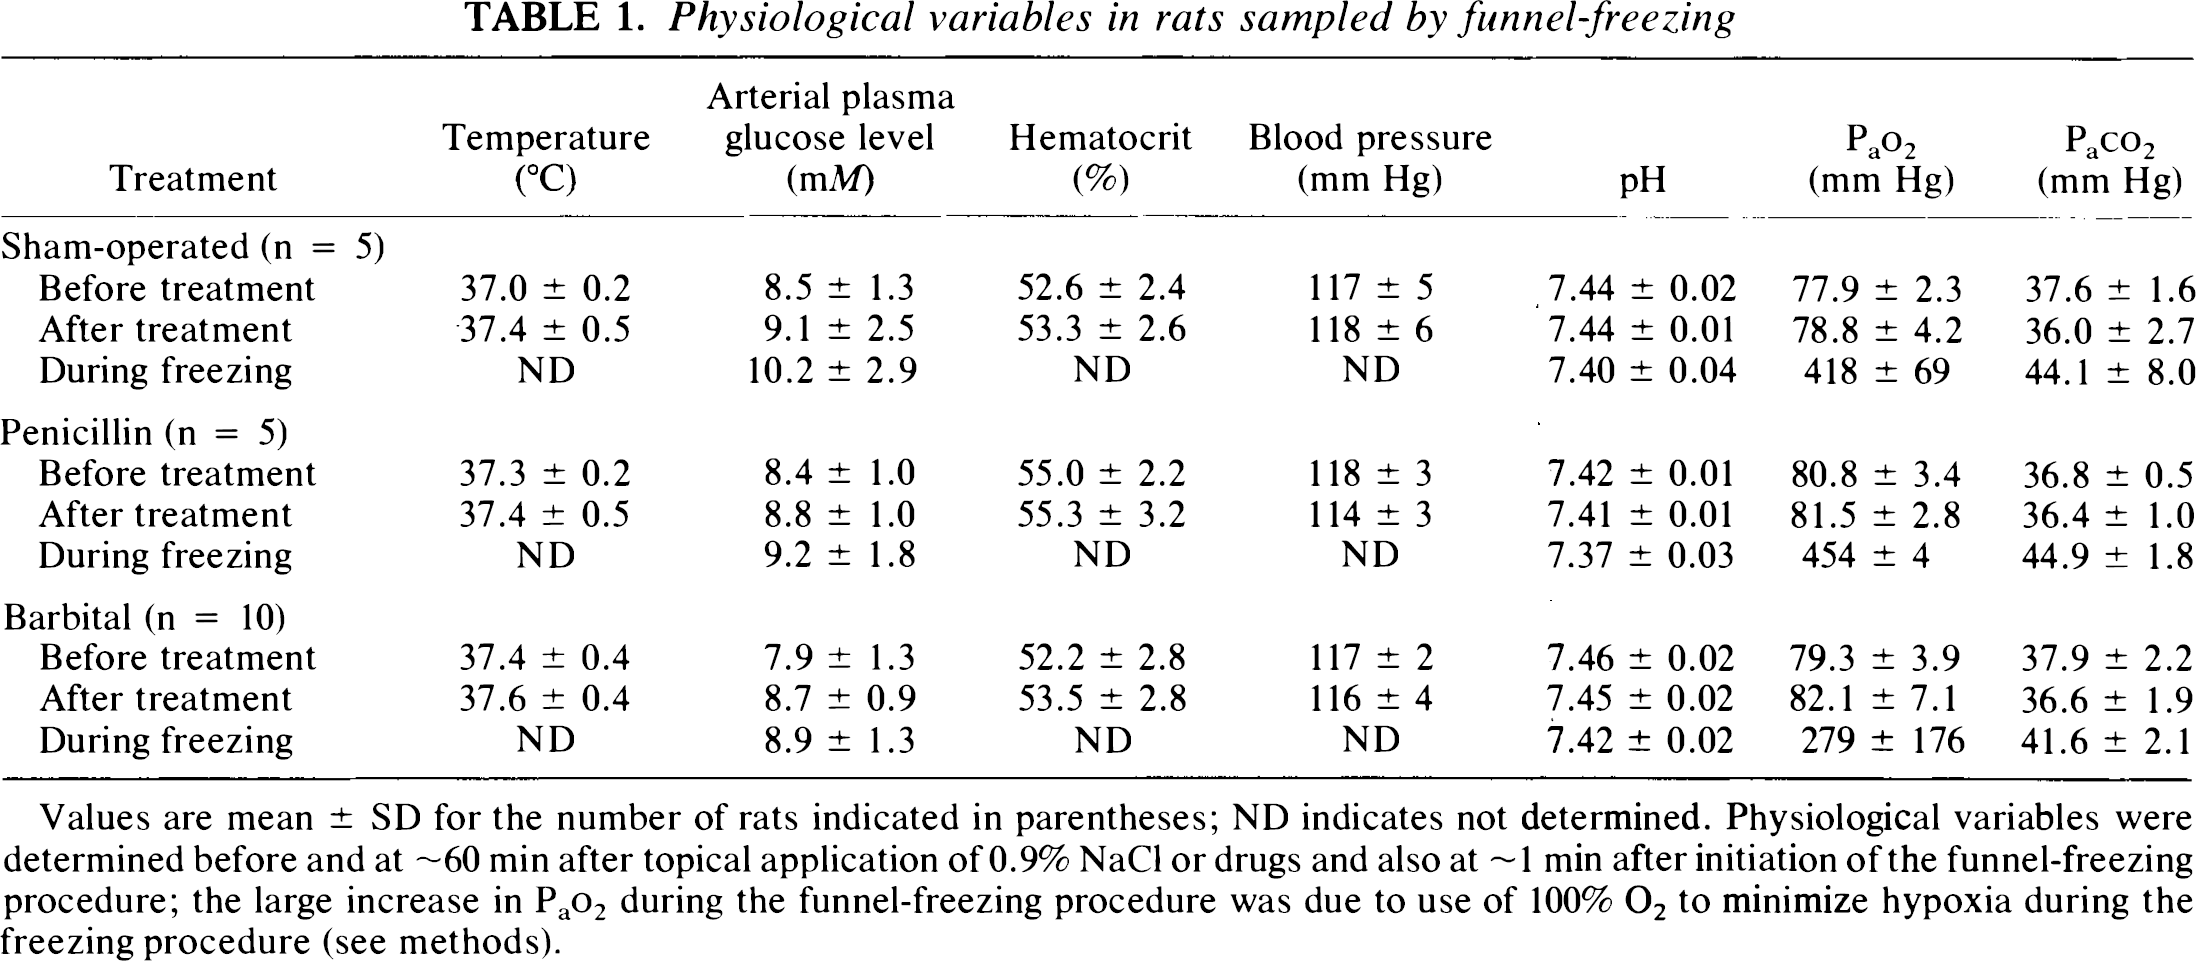
Values are mean ± SD for the number of rats indicated in parentheses; ND indicates not determined. Physiological variables were determined before and at ∼60 min after topical application of 0.9% NaCl or drugs and also at ∼1 min after initiation of the funnel-freezing procedure; the large increase in Pao2 during the funnel-freezing procedure was due to use of 100% O2 to minimize hypoxia during the freezing procedure (see methods).
Effects of sustained, focal activation of metabolism
Autoradiography demonstrated localized changes in both LCMRglc and methylglucose distribution ratio in response to topical application of penicillin that were restricted to cerebral cortical tissue in the vicinity of the burr hole; contralateral and adjacent cerebral cortical tissue were unaffected (Fig. 1). A doubling of LCMRglc (Fig. 1A) was associated with a 13% decrease in the steady-state brain/plasma distribution ratio for methylglucose in the seizure focus compared to that in homologous contralateral cortical tissue (Fig. 1B). Direct chemical analyses of glucose and [14C]methylglucose contents in dissected samples of funnel-frozen tissue taken from the seizure focus and unaffected adjacent tissue (see Fig. 1) showed that they were 10–20% lower in the seizure focus than in adjacent tissue (Table 2). Compensatory mechanisms apparently maintained tissue glucose concentrations in the penicillin seizure foci close to normal, even after ∼75 min of continuous seizure activity. The small decrease in tissue glucose content that did occur would cause the value of the lumped constant of the DG method to increase only slightly (Table 2); LCMRglc in the penicillin seizure focus (Fig. 1) calculated with a value for the lumped constant for normal rat brain would, therefore, be overestimated by only ∼10%.
Influence of sustained, focal, penicillin-induced seizures on brain glucose level, hexose distribution ratios, and lumped constant of DG method
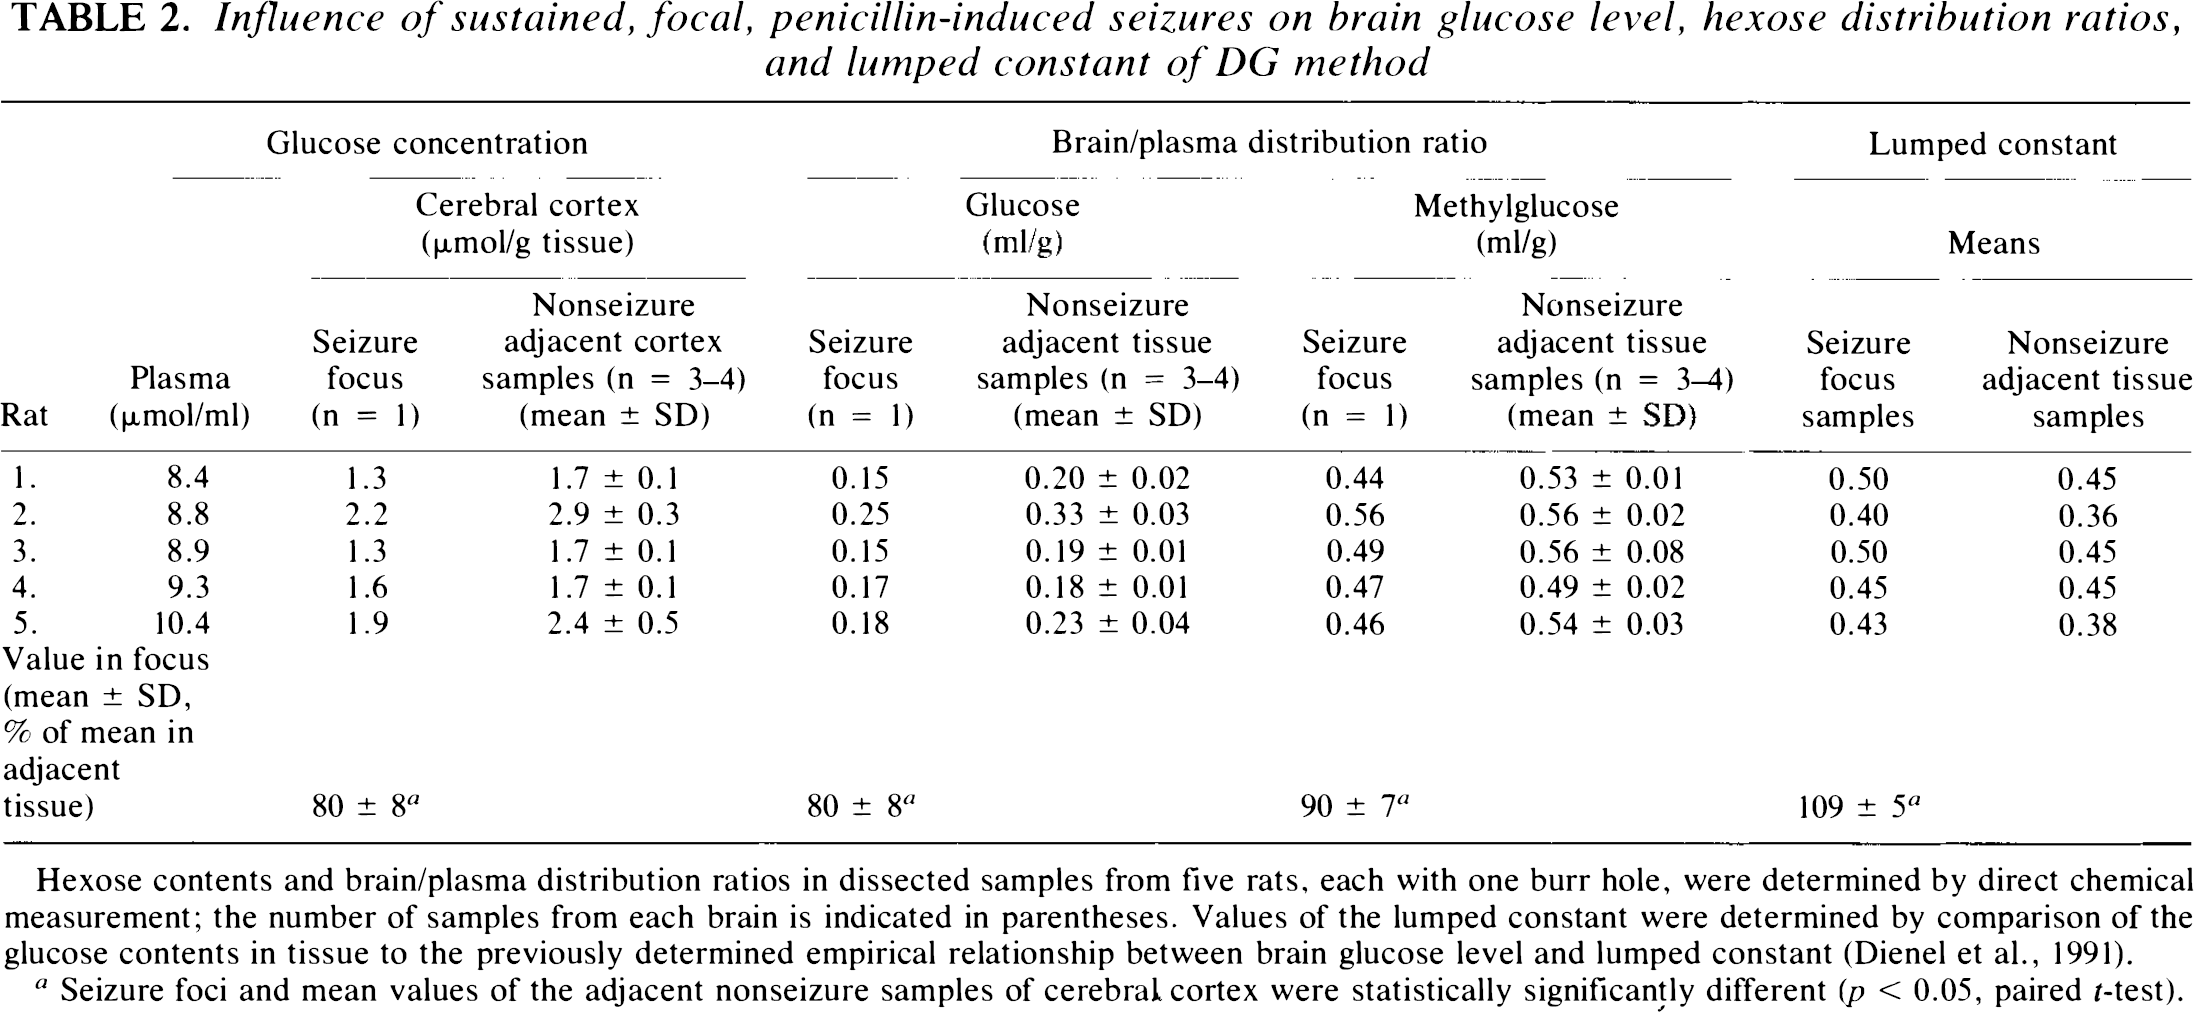
Hexose contents and brain/plasma distribution ratios in dissected samples from five rats, each with one burr hole, were determined by direct chemical measurement; the number of samples from each brain is indicated in parentheses. Values of the lumped constant were determined by comparison of the glucose contents in tissue to the previously determined empirical relationship between brain glucose level and lumped constant (Dienel et al., 1991).
Seizure foci and mean values of the adjacent nonseizure samples of cerebral cortex were statistically significantly different (p < 0.05, paired t-test).
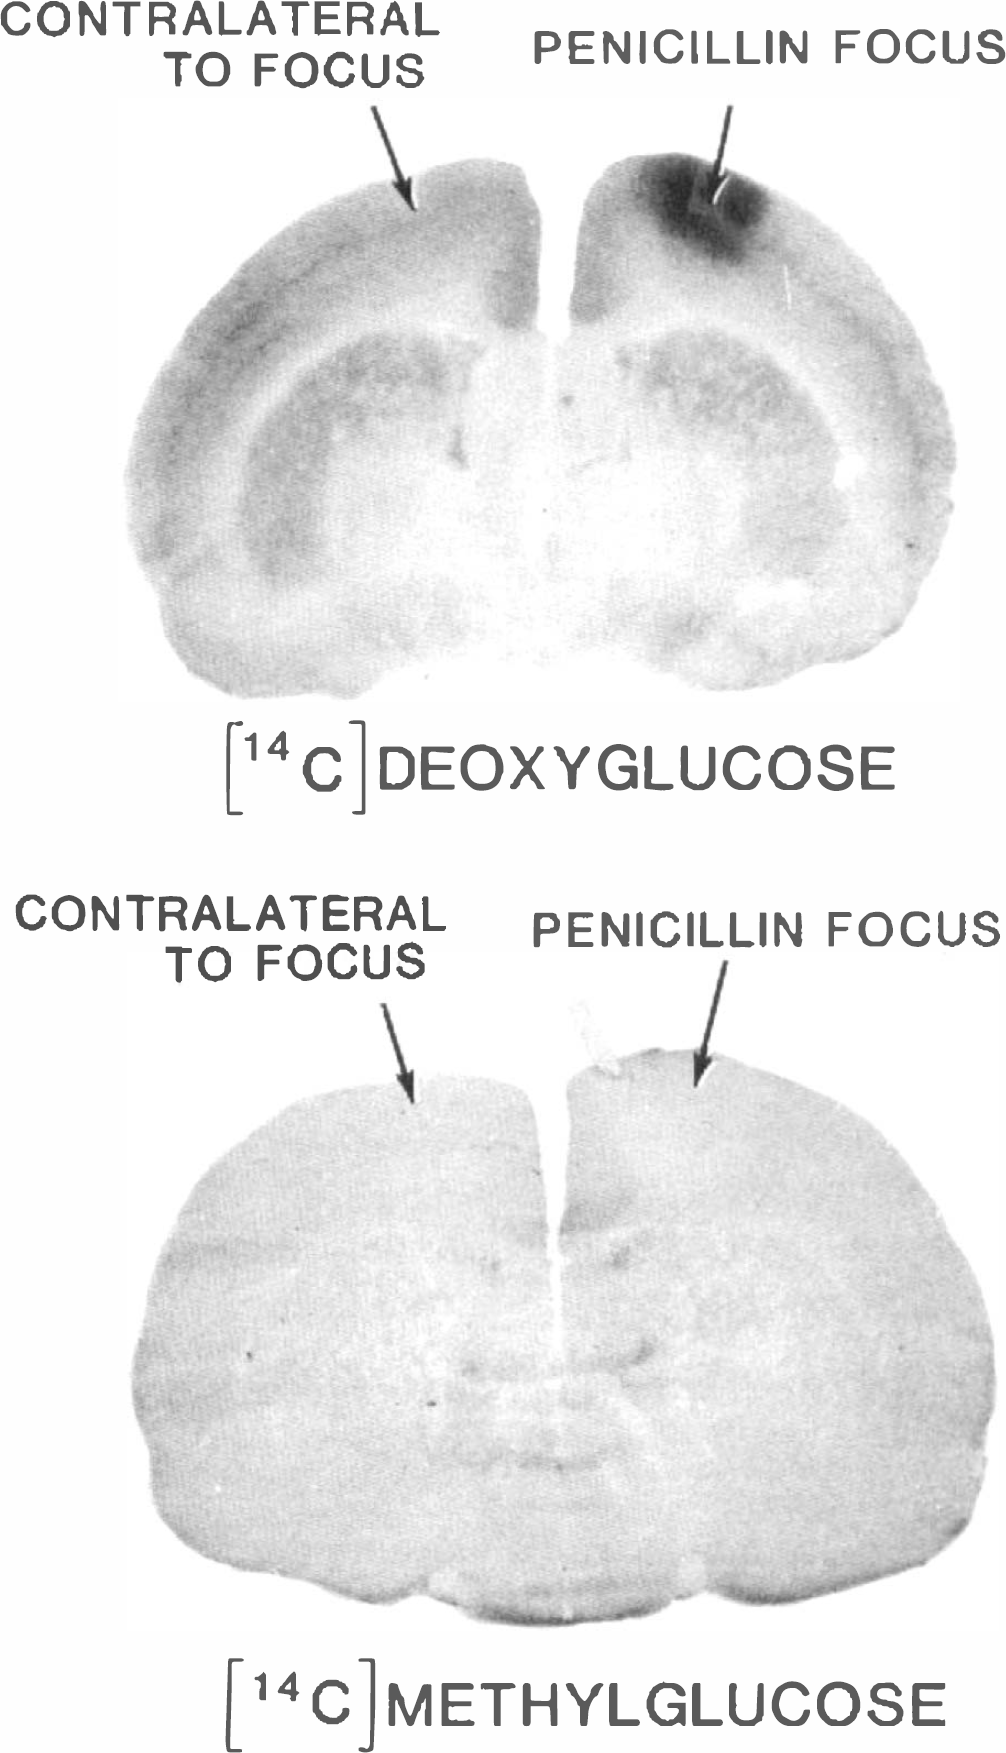
Representative [14C]DG (upper panel) and [14C]methylglucose (lower panel) autoradiographs showing influence of sustained, penicillin-induced, focal seizures on LCMRglc and steady state brain/plasma distribution ratio for methyl-glucose. LCMRglc and methylglucose distribution ratios were determined by quantitative autoradiography (see methods). The ratio of LCMRglc in the seizure focus to that in normal homologous contralateral cerebral cortical tissue was 2.0 ± 0.4 (mean ± SD, n = 5); metabolism was increased by ∼100% (p < 0.05, paired t-test). The corresponding ratio of seizure (i.e., 0.44 ± 0.07) to control (i.e., 0.51 ± 0.08) values for the steady-state brain/plasma distribution ratio for [14C]methylglucose was 0.87 ± 0.04 (n = 4), a decline of −13% in the methylglucose ratio (p < 0.05, paired t-test). Mean (±SD) arterial plasma glucose levels were 8.8 ± 1.3 and 9.2 ± 1.9 mM for the DG and methylglucose groups, respectively. There were no significant side-to-side differences in either LCMRglc or methylglucose distribution ratio in brains of normal animals; the mean left/right ratio of methylglucose distribution ratios was 1.01 ± 0.03 (n = 3).
Effects of sustained, focal depression of metabolism
Topical application of 40, 80, 120, or 160 nmol of barbital caused focal reductions in LCMRglc in the vicinity of the application site by a similar magnitude, i.e., −40–50% (Fig. 2A; only 40 and 160 nmol data are shown) and caused focal 15–20% increases in the steady-state brain/plasma distribution ratio for methylglucose (Fig. 2B). Because blood–brain barrier damage was found to sometimes occur in barbital-treated tissue—more often in tissue exposed to the highest doses (see below)—brain glucose content and distribution ratios for both glucose and methylglucose were next examined in barbital foci given the lower doses (i.e., 40 and 80 nmol). Both glucose concentration and methylglucose distribution ratio increased in the dissected cortical samples from the barbital foci compared to surrounding normal tissue from funnel-frozen brain (Table 3). This increase in tissue glucose level would cause the value of the lumped constant in the tissue with depressed metabolism due to the barbital treatment to decrease 5–15% (Table 3), which would lead to proportional underestimations of LCMRglc if calculated with the value of the lumped constant for normal rat brain (Fig. 2A).
Influence of sustained, focal, topical barbital application on brain glucose level, hexose distribution ratios, and lumped constant of DG method
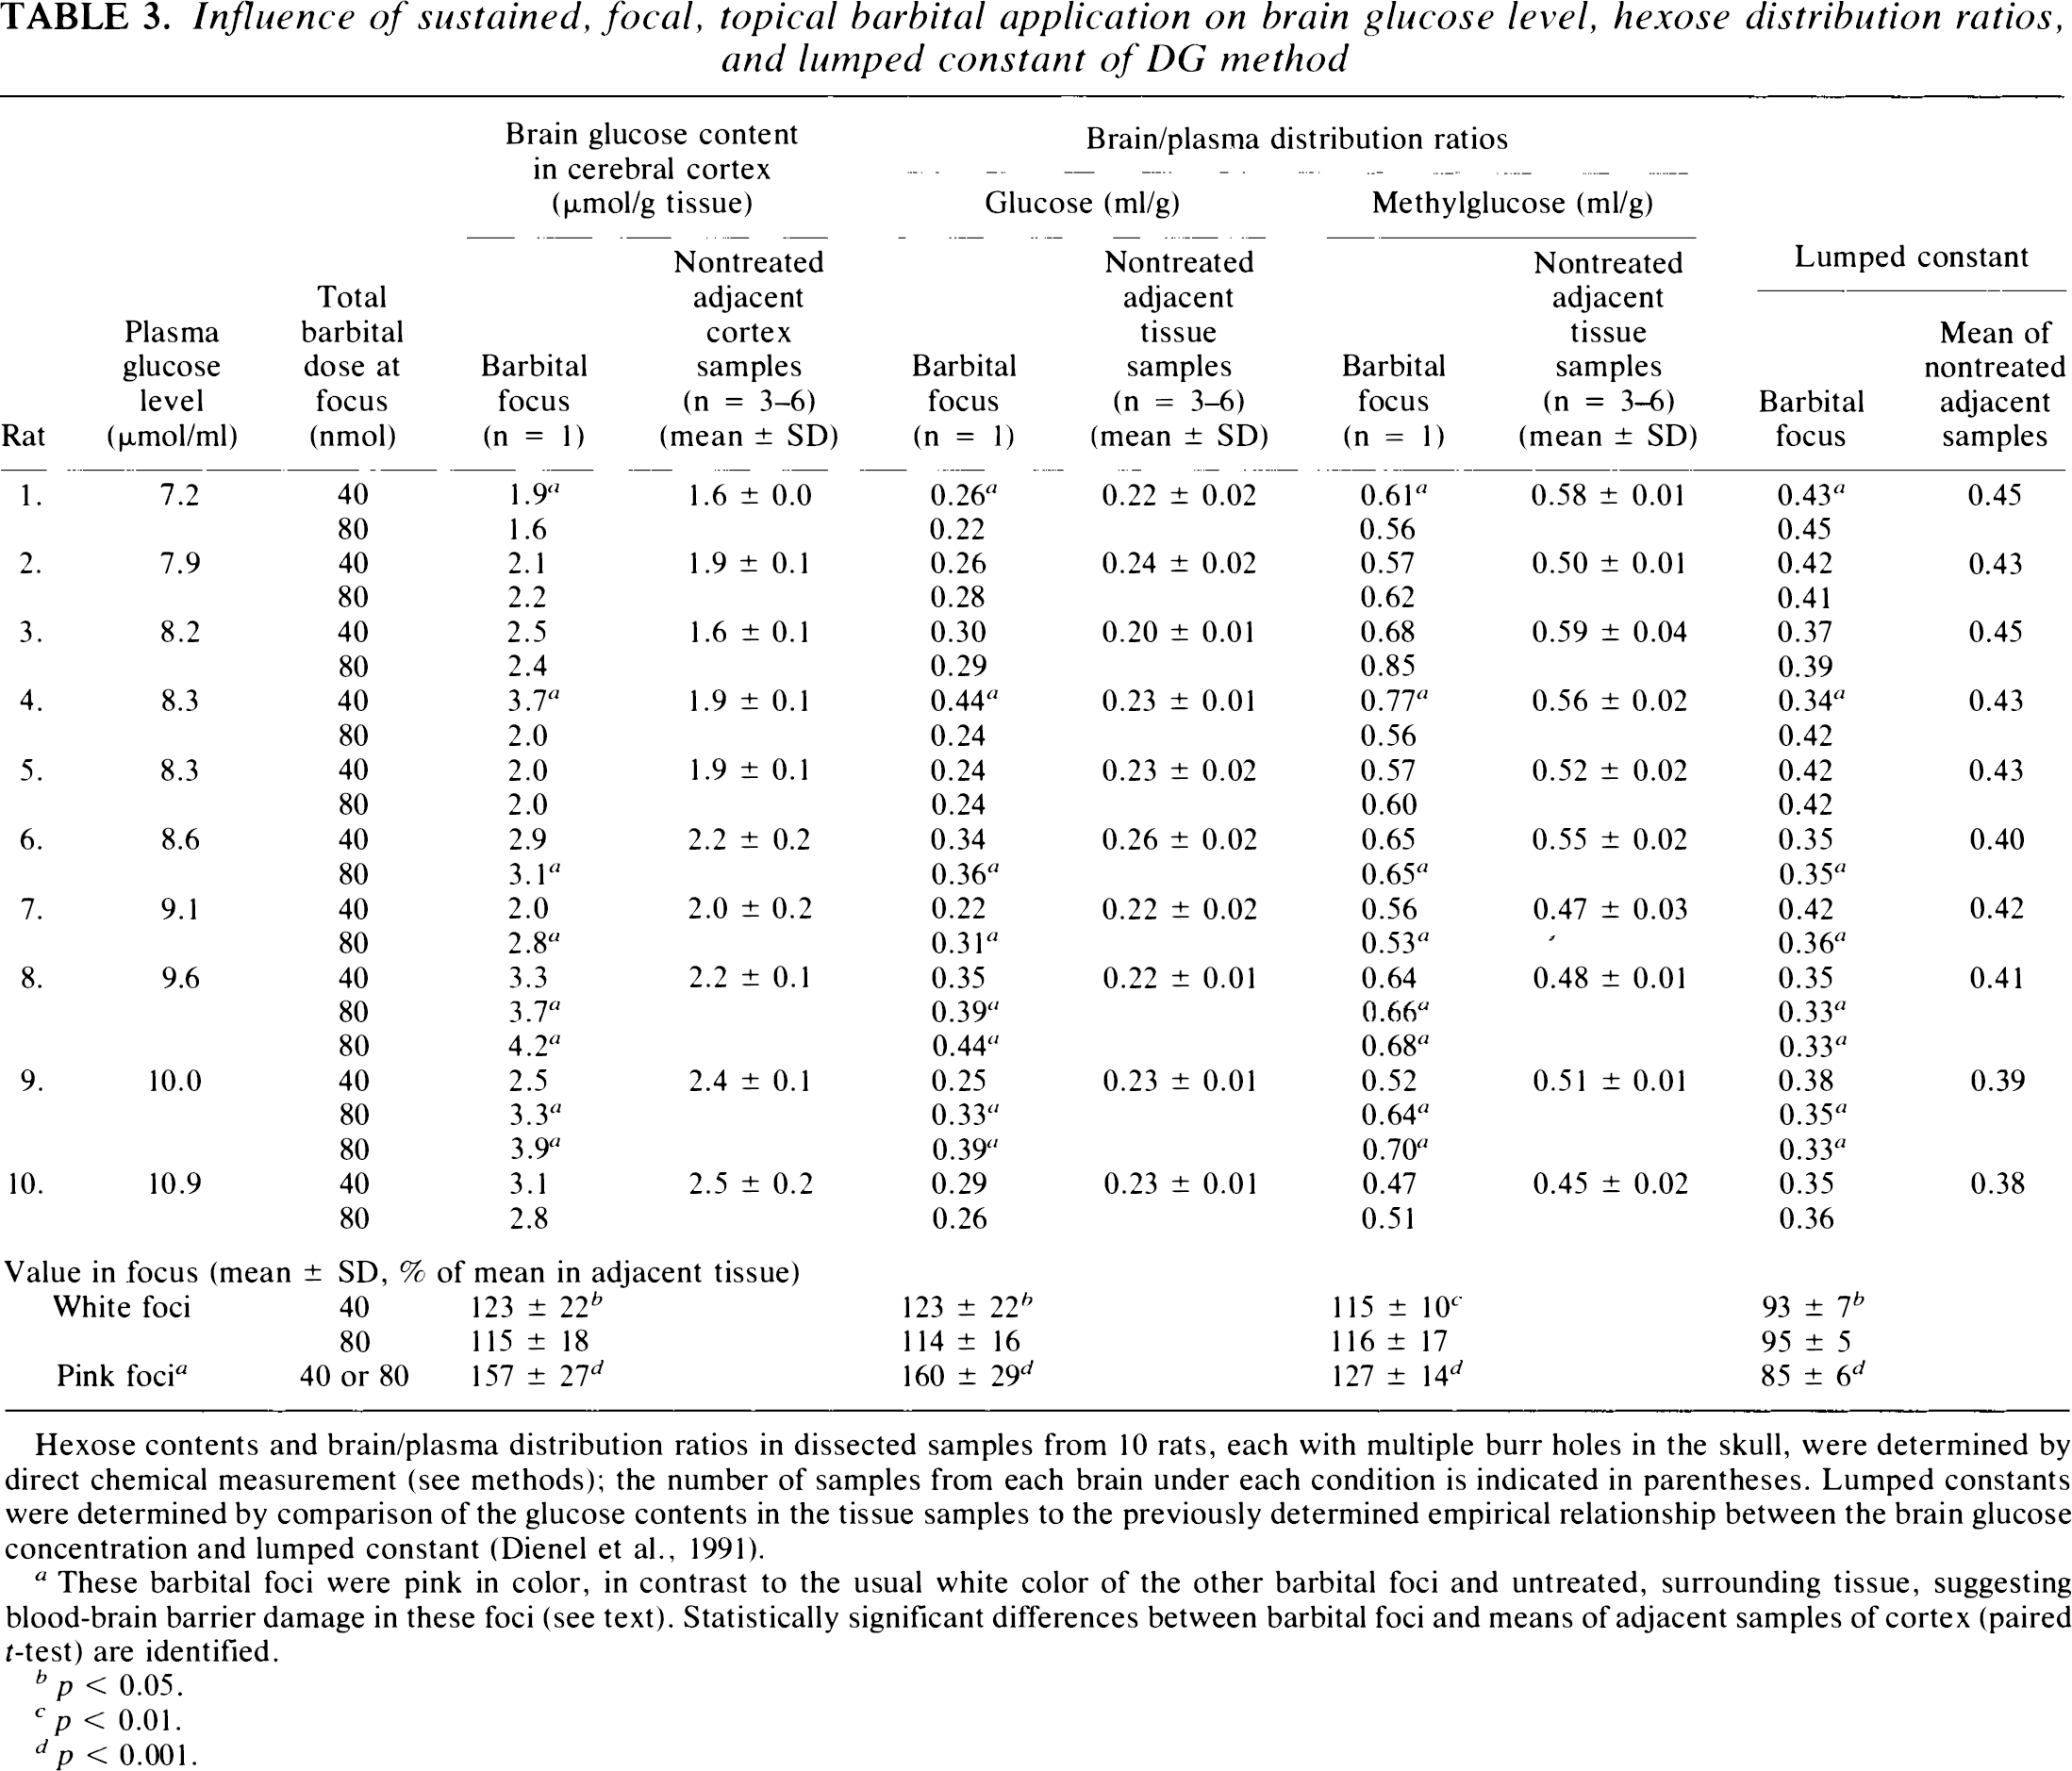
Hexose contents and brain/plasma distribution ratios in dissected samples from 10 rats, each with multiple burr holes in the skull, were determined by direct chemical measurement (see methods); the number of samples from each brain under each condition is indicated in parentheses. Lumped constants were determined by comparison of the glucose contents in the tissue samples to the previously determined empirical relationship between the brain glucose concentration and lumped constant (Dienel et al., 1991).
These barbital foci were pink in color, in contrast to the usual white color of the other barbital foci and untreated, surrounding tissue, suggesting blood–brain barrier damage in these foci (see text). Statistically significant differences between barbital foci and means of adjacent samples of cortex (paired r-test) are identified.
p < 0.05.
p < 0.01.
p < 0.001.
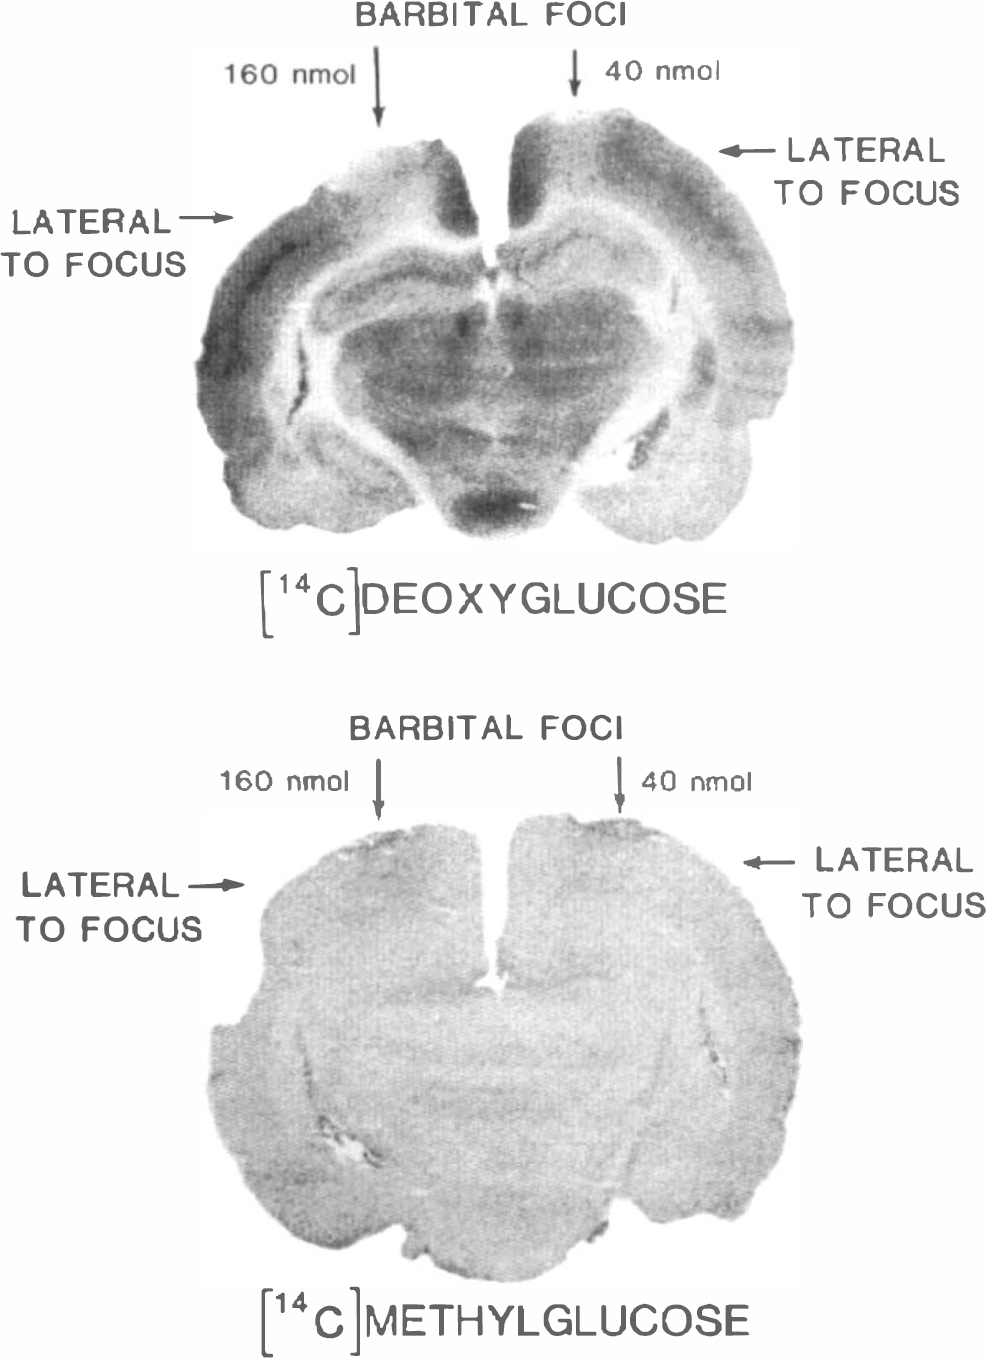
Represer tative [14C]DG (upper panel) and [14C]methylglucose (lower panel) autoradiographs showing effects of repeated local topical applications of barbital on LCMRglc and the steady-state brain/plasma distribution ratio for methylglucose. LCMRglc was 66 ± 8 μmol 100 g−1 min−1 (mean ± SD, n = 4), and the methylglucose distribution ratio was 0.51 ± 0.05 ml/g (mean ± SD, n = 5) in the normal cerebral cortical samples surrounding the barbital-treated foci (see methods); arterial plasma glucose levels were 8.8 ± 1.1 and 8.8 ± 0.9 mM in the DG and methylglucose groups, respectively. Ratios of LCMRglc values in barbital foci to those in surrounding normal cortical tissue were 0.64 ± 0.20 (n = 5) and 0.48 ± 0.08 (n = 4) when the total barbital doses were 40 and 160 nmol, respectively. Corresponding ratios for the steady-state brain/plasma distribution ratios for [14C]methylglucose were 1.14 ± 0.06 (n = 4) and 1.19 ± 0.06 (n = 4) for the 40 and 160 nmol doses of barbital, respectively. Differences in LCMRglc and methylglucose distribution ratios in the barbital foci and the surrounding normal cortical tissue were statistically significantly different (p < 0.05, paired t-test).
Some dissected barbital foci (i.e., two of 10 with the 40 nmol dose and six of 12 with the 80 nmol dose) were pink in color, contrasting with the usual white color of cortical tissue. Both glucose level and methylglucose distribution ratio in pink samples were generally higher than those in white barbital foci (Table 3). When Evans blue was used to examine blood–brain barrier integrity, two of nine foci with the 40 nmol barbital dose and six of nine foci with the 80 nmol dose were blue, indicating vascular damage; extravasation of Evans blue was also evident when blue-stained foci were examined by fluorescence microscopy (data not shown). Blood volume (i.e., % inulin space, see methods) was, therefore, determined in untreated cerebral cortical tissue, and pink and white barbital foci in funnel-frozen brains. The inulin space determined with twice-purified [3H]inulin in untreated tissue from four rats was 2.4 ± 0.8, 2.4 ± 0.3, 2.1 ± 0.3, and 2.1 ± 0.5% (means ± SD of 8–13 samples of cerebral cortex from each rat); these values are similar to those previously reported (Smith and Rapoport, 1984). The inulin space in untreated tissue from 10 other barbital- and penicillin-treated rats in which [3H]inulin was purified only once was higher, 3–4%, suggesting the presence of lower molecular weight compounds that might cause overestimation of vascular damage, if any. Regardless of the initial purity of the [3H]inulin, the inulin space in pink barbital foci exceeded those of untreated tissue in the same brain by 7–17-fold (n = 29). In contrast, the inulin space in white barbital foci was, on average, 50% (n = 10) greater than in control tissue; seven of these samples were within 24% of control. The inulin space in white penicillin foci was also elevated but close to normal, 118% (n = 13) of control. In summary, brain glucose and methylglucose levels were either unchanged or rose in parallel in barbital foci, more in pink foci with vascular damage.
Comparison of influence of glucose supply and demand on methylglucose distribution ratio
Relatively large changes in LCMRg,c caused the methylglucose distribution ratio and brain glucose level to change in the same direction. The methylglucose distribution ratio decreased when either penicillin- or bicuculline-induced seizures reduced the brain glucose concentration, whereas this ratio rose when depressed LCMRglc, due to either barbital or muscimol, resulted in elevated brain glucose content (Fig. 3A). The magnitude of measured changes in the methylglucose distribution ratio in relation to the changes in brain glucose concentration was in good agreement with theoretically predicted changes (Fig. 3A). The regression line calculated with data from untreated and undamaged samples (Fig. 3A) was not statistically significantly different from the line (not shown) (see legend to Fig. 3A) calculated with all data, including damaged (i.e., pink) barbital foci. These results suggest that the levels of glucose and methylglucose in damaged tissue were determined mainly by glucose transporter-dependent processes in spite of vascular damage; in fact, brain levels of both hexoses in the pink samples were much lower than those in plasma (Table 3), indicating that even in damaged tissue, the blood–brain barrier prevented the brain hexose concentration from rising to the level in plasma, i.e., brain/plasma distribution ratios were <1.0 (Table 3). Thus, the relationship between the glucose level and methylglucose distribution ratio in barbital-damaged tissue was similar to that in undamaged and seizure foci (Fig. 3A), suggesting that methylglucose might also be useful to determine brain glucose concentrations in abnormal tissue.
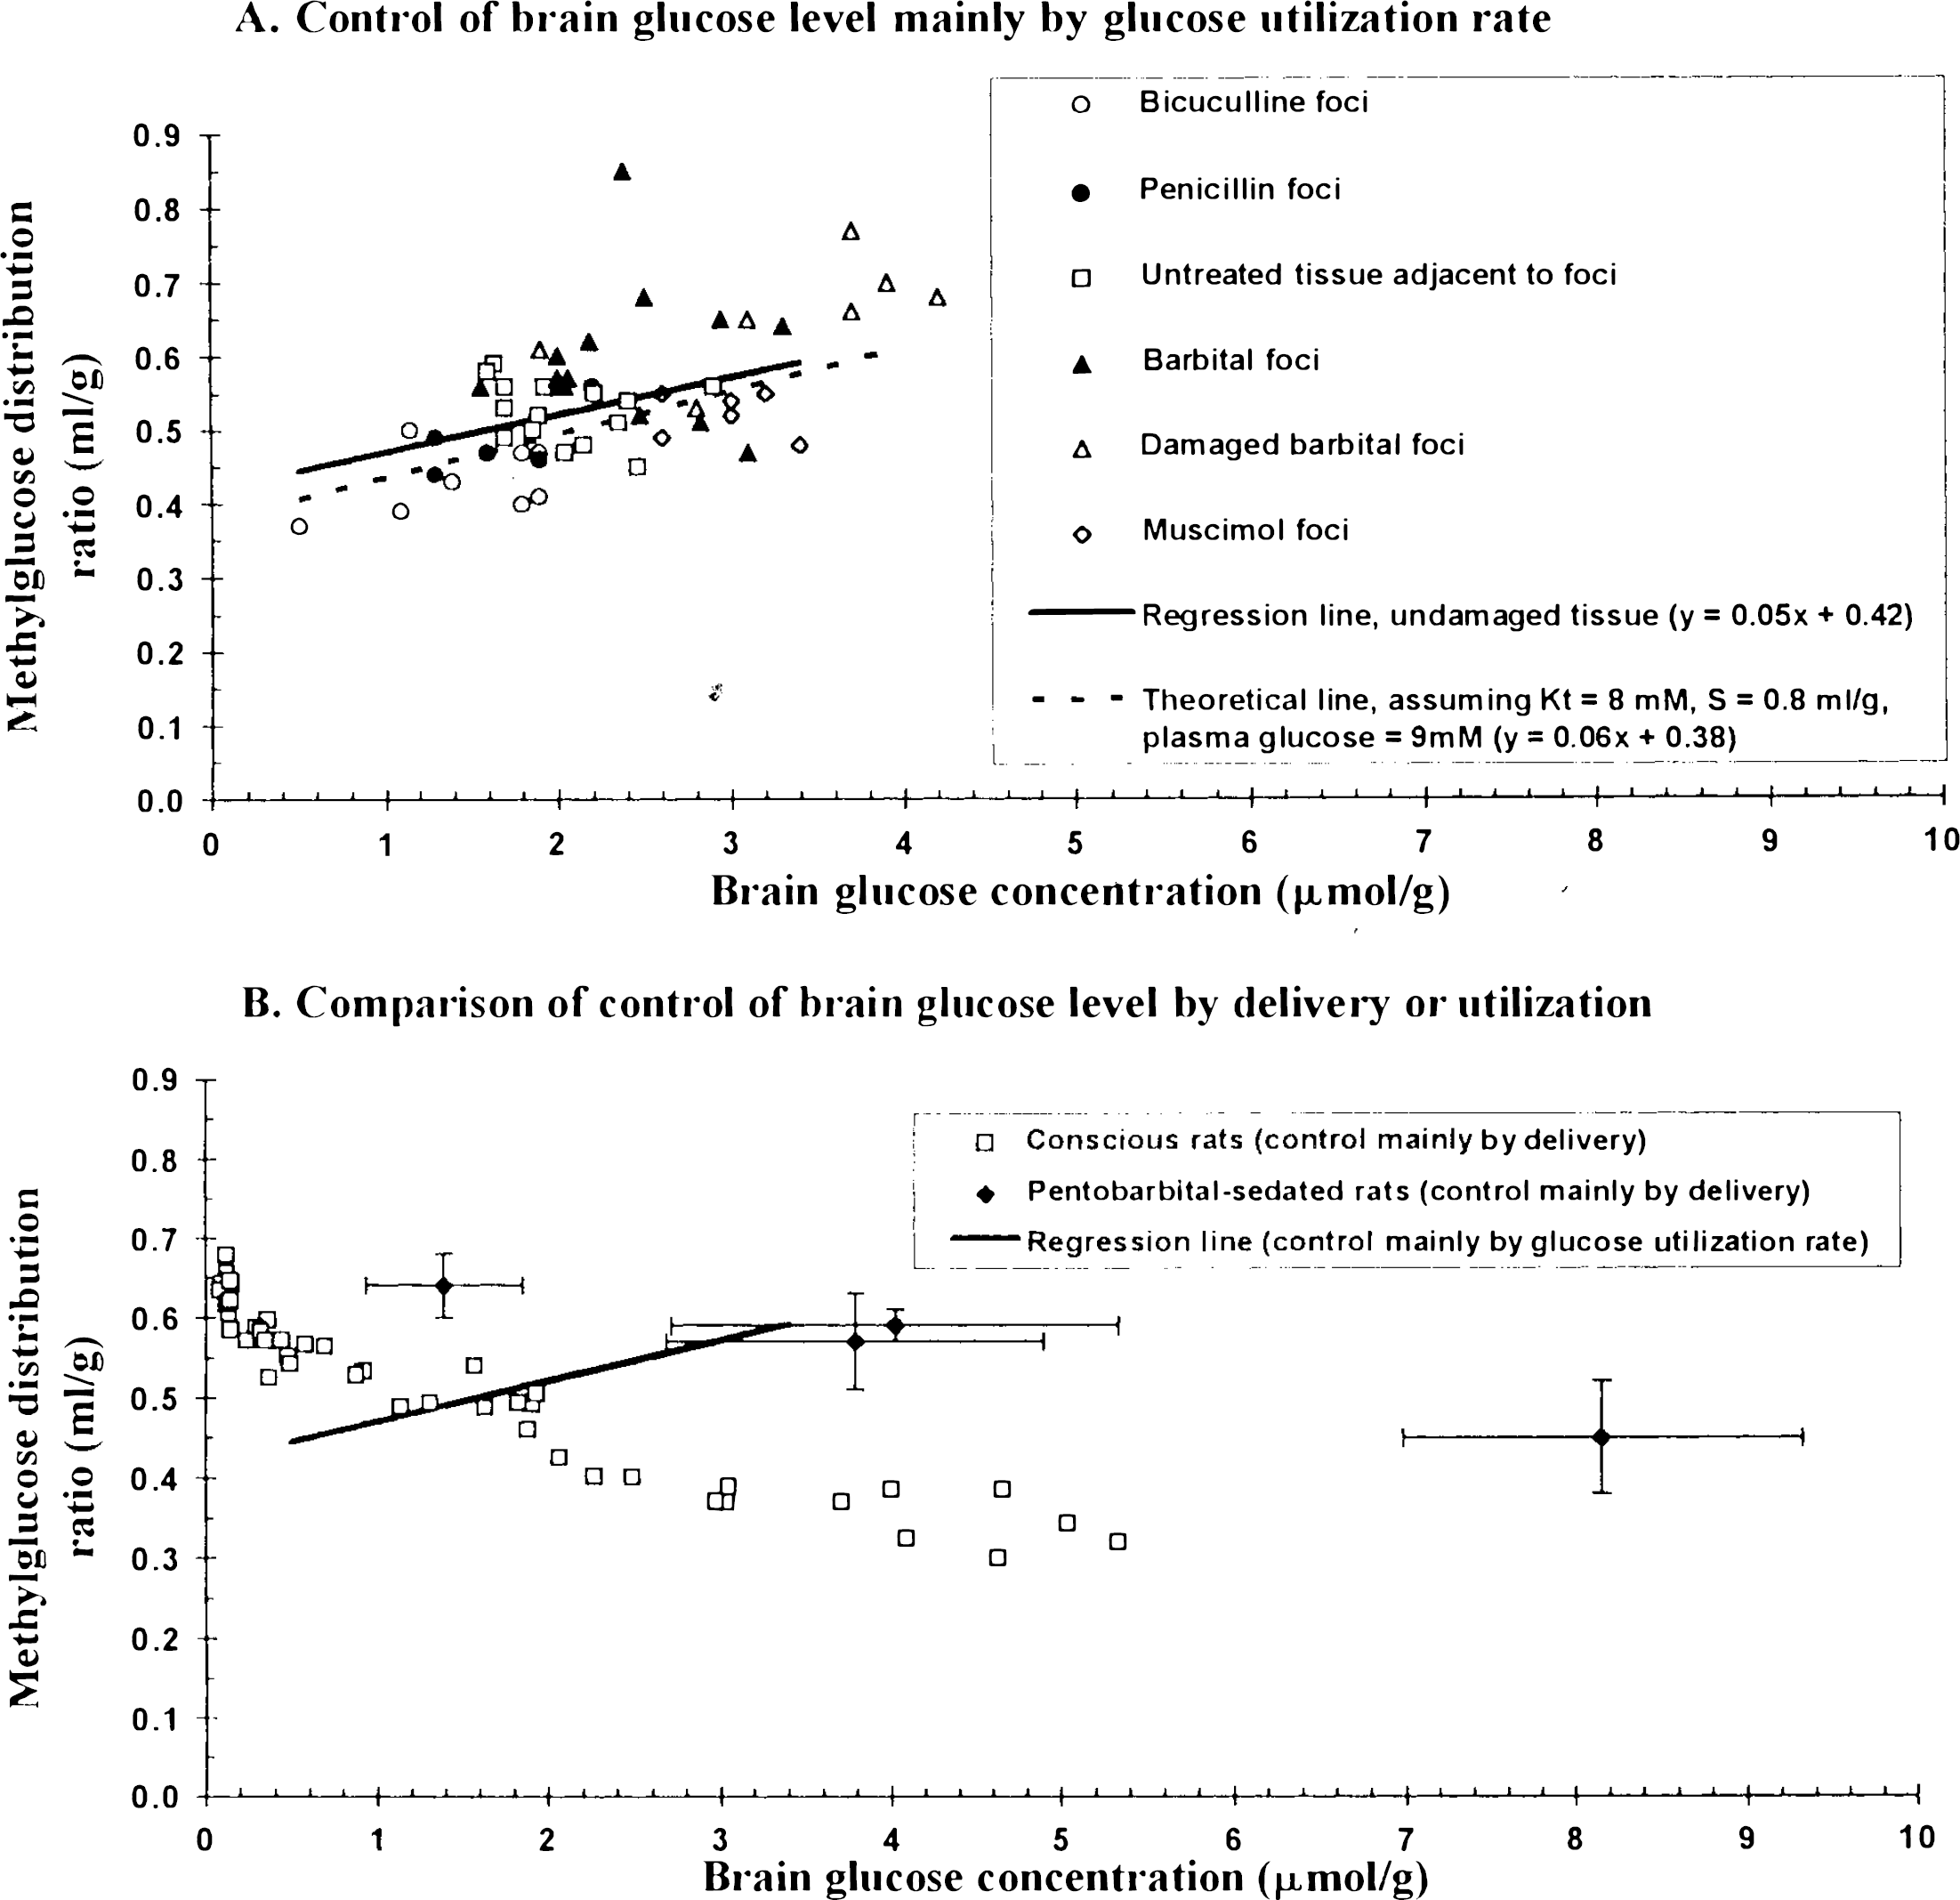
Relationships between methylglucose distribution ratio and brain glucose concentration when brain glucose level is controlled mainly by demand or mainly by supply.
DISCUSSION
Influence of rate of glucose consumption on brain/plasma distribution ratio for methylglucose
Results of the present study demonstrate that relatively large changes in local metabolic demand in brain influence, primarily, the tissue glucose level and, secondarily, the distribution of methylglucose between brain and plasma. Increased metabolism lowers both tissue glucose content and the steady-state brain/plasma distribution ratio for methylglucose; decreased metabolism raises both. The effects of altered metabolism on the relationship between tissue glucose content and the methylglucose distribution ratio are, therefore, opposite to those seen when tissue glucose level is altered secondarily to altered plasma glucose levels (Buschiazzo et al., 1970; Gjedde and Diemer, 1983; Dienel et al., 1991). These experimental results agree well with theoretical predictions based upon Michaelis–Menten kinetics for hexose transport across the blood–brain barrier. They also appear to resolve the discrepancy between results obtained previously in pentobarbital-sedated (Gjedde and Diemer, 1983) and conscious rats (Dienel et al., 1991). The methylglucose distribution ratio increased in both pentobarbital-sedated rats and conscious rats as the brain glucose level fell due to reduced plasma glucose levels, but the values of the methylglucose distribution ratios obtained in sedated rats were much higher than those in conscious rats with equivalent brain tissue glucose levels (Fig. 3B). In the present studies, merely depressing glucose utilization in local regions of brains in conscious rats without lowering plasm glucose content raised the local methylglucose distribution ratio (Fig. 3A) to levels similar to those previously obtained in pentobarbital-sedated animals (Fig. 3B). Differences in rates of consumption of glucose relative to its rate of delivery probably account, at least in part, for the differences in results in conscious and sedated rats.
Interactions of glucose supply and demand influence the methylglucose distribution ratio
The theoretical basis for the opposite relationships between methylglucose distribution ratio and brain glucose content when brain glucose level is changed due to altered metabolic demand (Fig. 3A) or to altered plasma glucose levels (Fig. 3B) is apparent in Eq. 1. When the plasma glucose level is constant and brain glucose concentration is altered by changes in metabolic demand, the methylglucose distribution ratio and tissue glucose level vary in the same direction. Straight-line relationships between tissue glucose level and methylglucose distribution such as illustrated in Fig. 3A can then be plotted, one line for each plasma glucose concentration with a slope and intercept dependent upon the plasma glucose concentration. Dispersion of the experimental points around the regression line in Fig. 3A reflects, in part, differences in the actual plasma glucose contents, which ranged from ∼7 to 11 mM, in the individual rats; barbiturate-induced changes in kinetic properties of the glucose transporter in the blood–brain barrier (Gjedde and Rasmussen, 1980; Otsuka et al., 1991) might also have contributed to this dispersion. On the other hand, when LCMRg,c remains constant and brain glucose concentration is altered by changing the plasma glucose level, the methylglucose distribution ratio is inversely related to the tissue glucose level (Buschiazzo et al., 1970; Gjedde and Diemer, 1983; Dienel et al., 1991) (Fig. 3B). For example, with reductions in plasma glucose level, both plasma and brain glucose levels fall, but even if both decreased in exact proportion, the denominator in Eq. 1 falls disproportionately more than does the numerator, resulting in increased methylglucose distribution ratios. This is because the value for tissue glucose concentration, CE, is so much smaller compared to KT S in the numerator than when the value for the plasma content, CP, is compared to KT in the denominator in Eq. 1; in the rat KT ≈ 7–9 mM and S ≈ 0.7–0.8 ml/g (Buschiazzo et al., 1970; Gjedde and Rasmussen, 1980; Gjedde, 1982; Gjedde and Diemer, 1983; Holden et al., 1991). The reverse is true when the tissue glucose level is changed by altered metabolism while plasma glucose level remains fixed; the numerator changes in the same direction as does the change in tissue glucose level while the denominator remains unchanged, and the methylglucose distribution ratio then changes in the same direction as does the tissue glucose level. The situation in the pentobarbital-sedated rats (Gjedde and Diemer, 1983) was probably as follows. Reduced demand for glucose relative to its delivery raised tissue glucose content and, therefore, also the value of the methylglucose distribution ratio above those obtained in normal conscious animals at equivalent plasma glucose levels; then, further restriction of glucose supply by lowering the plasma glucose levels caused the methylglucose distribution ratio to rise even higher (Fig. 3B). Lines such as those obtained in the studies with clamped plasma glucose levels (Fig. 3B) describe the influence of changes in glucose supply relative to demand at different but fixed rates of glucose utilization; when demand for glucose is increased relative to its delivery, the lines fall below those obtained in conscious rats. In brief, the lower the demand relative to supply (e.g., during anesthesia, hypothermia, etc.), the higher is the methylglucose distribution ratio for a given brain or plasma glucose concentration, and, conversely, the higher the demand relative to supply (e.g., during seizures, hyperthermia, etc.), the lower the methylglucose distribution ratio for the same plasma or brain glucose level.
Use of methylglucose distribution ratio to determine intracellular water space and tissue glucose level
The present results also have implications for the use of methylglucose to determine the intracellular water space available to hexoses in vivo and in cultured cells in vitro. Because methylglucose is not metabolized (Jay et al., 1990), it is often assumed that, at equilibrium, the concentration of methylglucose in the intracellular space equals the extracellular concentration; intracellular water space is then calculated from a known extracellular concentration and the measured intracellular level of labeled methylglucose (Kletzien et al., 1975; Foulkes and Blanck, 1994). This assumption is valid only if there is no glucose transporter or no competition between methylglucose and any other substrate for the transporter, such as glucose. The results summarized in Fig. 3A show that when the plasma glucose level is constant, methylglucose concentration in the tissue can vary by ∼twofold due to changes in tissue glucose concentration. The competition for transport of methylglucose by glucose and other hexoses could alter the equilibrium intracellular to extracellular ratio for methylglucose and cause errors in determinations of intracellular water space. Removal of glucose from the test medium to minimize this problem would likely cause energy failure and ionic imbalance, thereby changing the intracellular volume. Thus, serious errors can arise from use of methylglucose to estimate intracellular volume unless experimental and control conditions are equivalent and carefully controlled.
Results of the present study also demonstrate that any attempt to determine local brain glucose levels from methylglucose distribution ratios must take into account the influences of both glucose delivery and glucose demand. Our previously empirically determined relationship between steady-state brain/plasma distribution ratios for methylglucose and brain glucose contents was determined under conditions in which brain glucose levels were altered mainly by delivery, i.e., plasma glucose concentration (Dienel et al., 1991). Results of the present study suggest that this relatively simple relationship can also be used when there are small-to-moderate, but not large, changes in the balance between glucose supply and demand. For example, even during sustained twofold increases or 50% decreases in LCMRglc, tissue glucose concentrations were maintained at levels close to normal. The lumped constant of the DG method was, therefore, relatively stable; the methylglucose distribution ratio in undamaged tissue did not deviate from normal by more than ∼15% (Tables 2 and 3), and any errors in estimated glucose level and the lumped constant would be small. The potential for much larger changes in brain glucose content (Fig. 3) and, therefore, lumped constant under more severe pathological conditions, however, reinforces the need for the development of methods designed to determine local glucose concentrations, lumped constants, and LCMRglc simultaneously. Until such methods are established, there are strategies that can be employed to avoid or minimize the effects of changes in the lumped constant when DG is used to assay LCMRglc in pathophysiological conditions. For example, use of fed, mildly hyperglycemic rather than fasted subjects in studies of extreme or prolonged increases in metabolic activity would help to stabilize brain glucose levels. On the other hand, localization of small glycolytic tumors and seizure foci does not require quantification of LCMRglc; the sensitivity of the test might then be increased by inducing mild-to-moderate hypoglycemia in order to reduce glucose levels in tumors or seizure foci, thus disinhibiting the rate of phosphorylation of DG and increasing the contrast between normal and abnormal tissue.