
Abstract
[18F]Fluoropropyl-TZTP (FP-TZTP) is a subtype-selective muscarinic cholinergic ligand with potential suitability for studying Alzheimer's disease. Positron emission tomography studies in isofluorane-anesthetized rhesus monkeys were performed to assess the in vivo behavior of this radiotracer. First, control studies (n = 11) were performed to characterize the tracer kinetics and to choose an appropriate model using a metabolite-corrected arterial input function. Second, preblocking studies (n = 4) with unlabeled FP-TZTP were used to measure nonspecific binding. Third, the sensitivity of [18F]FP-TZTP binding to changes in brain acetylcholine (ACh) was assessed by administering physostigmine, an acetylcholinesterase (AChE) inhibitor, by intravenous infusion (100 to 200 μg·kg−1·h−1) beginning 30 minutes before tracer injection (n = 7). Tracer uptake in the brain was rapid with K1 values of 0.4 to 0.6 mL·min−1·mL−1 in gray matter. A model with one tissue compartment was chosen because reliable parameter estimates could not be obtained with a more complex model. Volume of distribution (V) values, determined from functional images created by pixel-by-pixel fitting, were very similar in cortical regions, basal ganglia, and thalamus, but significantly lower (P < 0.01) in the cerebellum, consistent with the distribution of M2 cholinergic receptors. Preblocking studies with unlabeled FP-TZTP reduced V by 60% to 70% in cortical and subcortical regions. Physostigmine produced a 35% reduction in cortical specific binding (P < 0.05), consistent with increased ACh competition. The reduction in basal ganglia (12%) was significantly smaller (P < 0.05), consistent with its markedly higher AChE activity. These studies indicate that [18F]FP-TZTP should be useful for the in vivo measurement of muscarinic receptors with positron emission tomography.
Muscarinic cholinergic receptors have been divided by pharmacologic methods into four subtypes (M1 through M4) and by gene expression into five subtypes (m1 through m5) (Schliebs and Robner, 1995). Many investigators have pursued the imaging of muscarinic cholinergic receptors in the brain (for a review, see Maziere, 1995) with tracers such as [123I]QNB (Eckelman et al., 1985), [11C]benztropine (Dewey et al., 1990), [11C]scopolamine (Frey et al., 1992), [11C]tropanyl benzilate (Koeppe et al., 1994), and [11C]NMPB (Mulholland et al., 1995). To date, most tracers that cross the blood-brain barrier (BBB) have poor selectivity for the muscarinic subtypes. However, it has been observed that there is a substantial reduction in cortical M2 receptors during the course of Alzheimer's disease (Aubert et al., 1992; Flynn et al., 1995). Thus, radioligands selective for the M2 receptor are likely to provide data useful for diagnosing and monitoring this disease.
Sauerberg et al. (1992) prepared a number of subtype-selective muscarinic agonists containing a thiadiazolyl moiety attached to various heterocyclic compounds, including tetrahydromethylpyridine. Two of these compounds, xanomeline and butylthio-TZTP, demonstrated M1 selectivity and have been labeled with 11C and studied with positron emission tomography (PET) (Farde et al., 1996). Another compound, P-TZTP, was shown to be selective for the M2 receptor by the inhibition of twitch height in rabbit vas deferens and the inhibition of contraction in guinea pig atria. Based on P-TZTP, a series of 18F-labeled analogs was evaluated, and 3-(3-(3-[18F]fluoropropyl)thio)-1,2,5-thiadiazol-4-yl)-1,2,5,6-tetrahydro-1-methylpyridine ([18F]FP-TZTP) was chosen for further evaluation (Kiesewetter et al., 1995, 1996, 1998). In brain and heart tissue, [18F]FP-TZTP had an in vitro affinity (Ki) of 2.2 nmol/L for M2 and 7.4 nmol/L for M1, with much poorer affinity for M3 or sigma receptors. The biodistribution in rats showed uniform gray matter uptake, consistent with the M2 receptor distribution (Li et al., 1991) and unlike that of M1 receptors (Wall et al., 1991). Coinjection of nonradioactive FP-TZTP in rats decreased cortical binding by up to 80% in a dose-dependent manner (Kiesewetter et al., 1995). Initial PET studies in rhesus monkey demonstrated rapid uptake, uniform cortical binding, and displacement of 20% to 40% of radioactivity after a 100 to 200 nmol/kg dose of unlabeled P-TZTP or FP-TZTP (Kiesewetter et al., 1998).
In this study, we present a kinetic analysis of [18F]FP-TZTP performed in rhesus monkeys. Control studies were used to determine a kinetic model appropriate for describing the time-activity data. Preblocking studies with a large dose of unlabeled FP-TZTP (100 to 200 nmol/kg) were performed to measure nonspecific binding. Finally, the sensitivity of [18F]FP-TZTP binding to changes in brain acetylcholine (ACh) levels was evaluated using physostigmine, an acetylcholinesterase (AChE) inhibitor.
METHODS
Study design
A total of 22 experiments were performed in six rhesus monkeys. Eleven experiments measured control binding levels. In four studies, a preblocking dose (200 nmol/kg, n = 1; 400 nmol/kg, n = 3) of unlabeled FP-TZTP was administered 5 minutes before bolus [18F]FP-TZTP injection to measure the level of nonspecific binding. The dose of nonradioactive FP-TZTP was chosen from the results of rat coinjection studies (Kiesewetter et al., 1995). To reduce peripheral muscarinic effects, glycopyrrolate was administered in the preblocking and physostigmine studies.
In seven studies, physostigmine was administered by continuous infusion beginning 30 minutes before [18F]FP-TZTP was injected. An infusion was used to achieve a constant elevated ACh concentration, thus reducing the free receptor concentration. From the studies of Tavitian et al. (1995), equilibrium doses of 100 μg·kg−1·h−1 (n = 3) and 200 μg·kg−1·h−1 (n = 4) were administered. To speed the approach to equilibrium, the administration rate was doubled for the first 10 minutes. Plasma physostigmine levels were assessed periodically in four studies at the infusion rate of 100 μg·kg−1·h−1 ([18F]FP-TZTP administration was performed in only two of these studies). Physostigmine measurements were performed by an HPLC technique modified from that used by Elsayed et al. (1989). In two animals, control and physostigmine studies were performed on the same day from one radiochemical synthesis. These studies were separated by approximately 3 hours, and less than 20% of the synthesized radioactivity was used in the first injection.
Radiopharmaceutical
[18F]Fluoropropyl-TZTP was synthesized according to Kiesewetter et al. (1995). A total of 1 to 4 mCi was administered with an injected mass of 4.4 ± 6.0 nmol (range, 0.2 to 25 nmol; specific activity at time of injection, mean 1,215 Ci/mmol, range 100 to 5,000 Ci/mmol). The specific activity for each batch was determined from an aliquot of the ethanol/water solution obtained before formulation in saline. The sample was injected onto an Axxiom C-18 column (4.6 × 250 mm) (Axxiom Chromatography Moorpark, CA, U.S.A.) and eluted with 65% CH3CN and 35% buffer at 1.5 mL/min (retention time 11.2 to 11.7 minutes). The radiochemical purity (>95%) was determined from the HPLC radiochromatogram and by radio thin-layer chromatography (TLC) on Whatman LK6DF Silica gel plates (Clifton, NJ, U.S.A.) (eluted with 90:9:1 CHCl3:MeOH:NH4OH). Identity was confirmed by coelution of the authentic standard and the radiochemical component by HPLC. The ultraviolet (UV) absorption at 230 nm was calibrated for mass per unit area with the authentic product. For the specific activity determination, the UV absorption was monitored at both 230 and 310 nm. The specific activity is reported as a ratio of the quantity of radioactivity injected onto the column divided by the mass of the product peak. No correction is made for the presence of any other mass peak.
Arterial input function
Arterial samples were collected through a permanent arterial access port (Model No. 21-Y036, Sims Deltec, St. Paul, MN, U.S.A.) implanted subcutaneously at the hip. Samples were centrifuged, and a 0.1-mL aliquot of plasma was counted in a calibrated gamma counter. Samples from 3, 8, 15, 30, 50, and 90 minutes after injection were used to measure the unmetabolized fraction by TLC. In addition, a reference blood sample taken before the injection to which approximately 5 μCi of [18F]FP-TZTP was added was used to assess the efficiency of this metabolite procedure. First, 0.3 mL of plasma and 0.3 mL of acetonitrile were mixed, vortexed for >15 seconds, and centrifuged at 26,000g for 3 minutes. A 40-μL sample of the supernatant was placed on a Whatman LK6DF silica gel plate that was developed with CHCl3:MeOH:NH4OH (90:9:1). Radioactivity was counted with a Bioscan System 200 Imaging Scanner (Bioscan, Washington, DC, U.S.A.) or a Fuji BAS-1500 Phosphorimager (Fuji Medical Systems, Stamford, CT, U.S.A.). The TLC data were analyzed to determine the fraction of parent compound. These fractions were then corrected for the time-varying reduction in acetonitrile extraction efficiency (90% ± 2%, 83% ± 3%, and 78% ± 3%, at 3, 15, and 50 minutes, respectively), presumably caused by differential extraction of [18F]FP-TZTP and its metabolites. After normalization to an initial value of 1.0, the fractions were fitted to a two-exponential function constrained not to exceed 1.0 (Fig. 1). The fraction of radioactivity unbound to plasma proteins (the free fraction, fp) was assessed by ultrafiltration (Carson et al., 1993) using the reference sample.
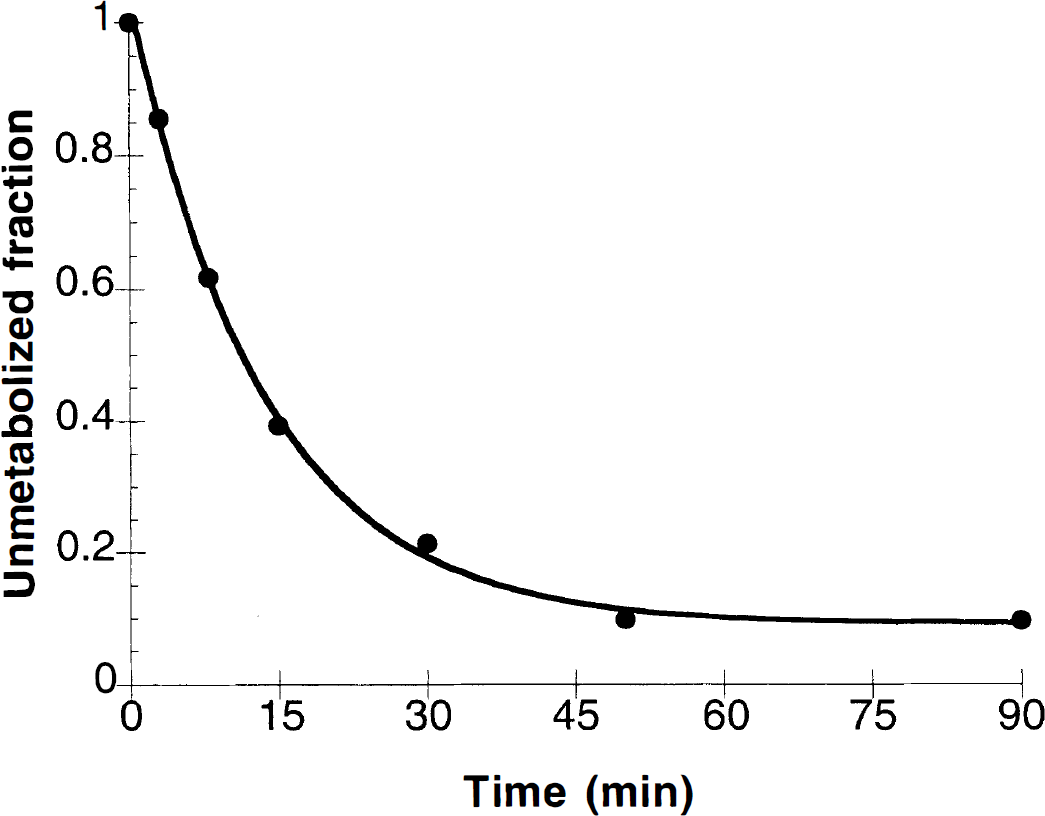
Example of the unmetabolized fraction of [18F]FP-TZTP after bolus injection, as measured by thin-layer chromatography. The solid line is the exponential fit.
Positron emission tomography scanning
Fasted male rhesus monkeys weighing 7 to 10 kg were initially anesthetized with ketamine (10 mg/kg intramuscularly) to permit endotracheal intubation and insertion of an intravenous line in a distal lower extremity. The animals were transported to the PET suite, placed under isoflurane anesthesia (1% to 2%), and positioned on the scanning table. The head was placed in a stereotactic head holder so that coronal images were acquired. Blood pressure, respiratory rate, ECG, temperature, and end-tidal Pco2 were monitored continuously. These studies were performed under a protocol approved by the NIH Clinical Center Animal Care and Use Committee.
Scans were acquired in 3D mode with the GE Advance tomograph (DeGrado et al., 1994), which acquires 35 simultaneous slices with a 4.25-mm interslice distance and a reconstructed resolution of 6 mm in all directions. Transmission scans were acquired to correct for attenuation. Reconstructed pixel values included corrections for attenuation, scatter (using Gaussian fitting of the sinogram tails [Stearn, 1995]), randoms, deadtime, and calibration in nCi/mL.
After transmission scans, multiple injections of 4 mCi of [15O]water were performed. In selected studies, an arterial input function was measured with an automated blood counting system to calculate CBF from a 60-second acquisition. Blood was withdrawn at 3.8 mL/min and coincident events were counted at 1-second intervals by paired NaI(T1) detectors. These data were corrected for randoms, deadtime, sensitivity, and dispersion. Images from the [15O]water studies were averaged and used for placement of regions of interest (ROI). [18F]Fluoropropyl-TZTP was administered as a bolus (n = 19) or bolus plus infusion (B/I, n = 3). Bolus plus infusion delivery was discontinued because of the sensitivity of the brain time-activity data to local blood flow (see Discussion). After tracer administration, dynamic scans were acquired for a period of at least 90 minutes.
Data analysis
Irregular ROI were drawn on the frontal, parietal, temporal, and occipital cortices, the thalamus, the basal ganglia, and the cerebellum using [15O]water images. These ROI were transferred to the [18F]FP-TZTP images to generate time-activity curves (TAC). Averaged values for regions with matching left and right pairs were produced (total size after averaging, approximately 5 cm2).
Preliminary evaluation of the time-activity data by graphical analysis methods suggested that [18F]FP-TZTP behaved as a reversible tracer, so compartment models with reversible binding were tested. For such models, receptor information is often measured with the distribution volume (V). The physiologic interpretation of V, the equilibrium tissue (Ci) to plasma (Cp) concentration ratio, for a receptor-binding radioligand can be described as follows (Carson et al., 1993):
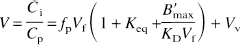
where Vf is the tissue free space (e.g., the tissue water space), Keq is the association equilibrium constant for nonspecific binding (k5/k6 in other nomenclature), B′max is the free receptor concentration (nmol/L), KD is the receptor dissociation equilibrium constant (nmol/L), and Vv is the vascular volume per unit of tissue. The mass of injected radioligand is assumed to cause no reduction in B′max.
Using the 11 control studies, the time-activity data were fitted to two models (Koeppe et al., 1991): first, a model with one tissue compartment with blood-to-brain delivery constant K1 (mL·min−1·mL−1), clearance rate k″2 (min−1), and distribution volume V = K1/k″2 (mL/mL); and second, a model with two tissue compartments and four parameters, K1, k′2, k′3, and k4, and V = K1/k′2 (1 + k′3/k4). To minimize blood volume effects, the first minute of data was ignored in both models. Fits were performed for periods of 45, 60, and 90 minutes. Model performance was compared using the Akaike Information Criterion or AIC (Akaike, 1976). Estimates of V from the compartment models and from graphical analysis (Logan et al., 1990) were compared.
In advance of fitting, the time delay (Δt) between plasma and brain was determined as follows: a whole brain TAC was obtained, and the first 10 minutes of data were fitted to a three-parameter model (K1, V, and Δt). For subsequent fitting, all time-activity data were shifted by Δt. All model solutions included integration of the model for the duration of each scan. Scan data were weighted by the inverse of the square of the standard deviation (SD) of the data. The latter was estimated for each scan as the ratio of the whole-brain mean activity to the square root of the noise-equivalent counts (NEC) based on the relationship that image coefficient of variation is inversely proportional to the square root of the NEC (Strother et al., 1990).
Functional images of K1 and V based on the one-compartment model were created as follows: each pixel's TAC (1 to 45 minutes after injection) was created, adjusted for the global time shift, Δt, and fitted to a two-parameter model (K1 and k″2) using a weighted least squares search algorithm applied to the nonlinear parameter k″2 over a range of 0.005 to 0.15 min−1 (in 256 linear steps). The range of k″2 values in the search algorithm was based on results from initial ROI model fitting. No smoothing was applied to the pixel TAC. Region of interest values were obtained from the K1 and V images.
For the two studies acquired with residual radioactivity from the previous injection, the model equation was extended to include a nonzero initial radioactivity concentration (C0), which then clears exponentially [exp(−k″2t)]. The C0 value for each pixel was estimated by averaging images acquired for a 30-minute period immediately preceding the second injection and correcting for radioactive decay. After the first minute of the second injection, the extrapolated background activity accounted for less than 10% of brain radioactivity. The metabolite correction for these studies was also modified to account for the presence of metabolites at the time of the second injection.
For [15O]water studies with measurement of the arterial input function, CBF was calculated from a 60-second acquisition. Time shifts between blood and brain data were determined by aligning the scanner count rate data to the blood data in a manner similar to that described by Iida et al. (1988). The scanner “true” count rate required a correction for an early peak of scattered counts as the bolus passed through the heart and lungs. Cerebral blood flow images were produced by the autoradiographic method (Herscovitch et al., 1983) using an assumed value of the partition coefficient of 0.8 mL/g.
RESULTS
Arterial input function
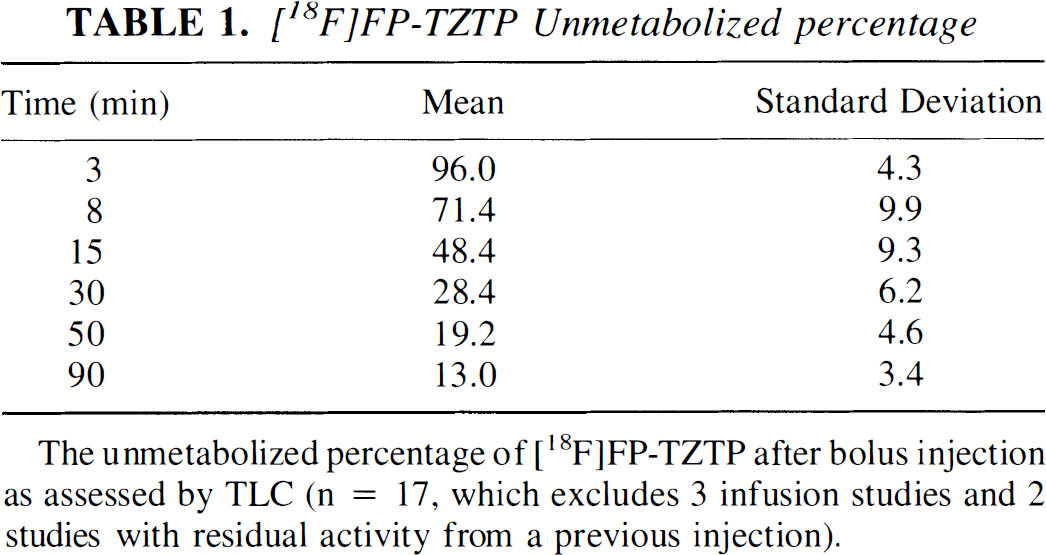
Figure 1 shows an example of the TLC measurements of the unmetabolized fraction of [18F]FP-TZTP after bolus injection, and Table 1 shows the mean and SD values. On average, the parent compound represented less than 50% of total plasma radioactivity by 15 minutes. The plasma clearance rate of unmetabolized [18F]FP-TZTP from 30 to 90 minutes was 0.015 ± 0.006 min−1 (half-life of 49 ± 14 minutes). At later time points, there was a trend toward higher unmetabolized fractions in the physostigmine and preblocking studies.
[18F]FP-TZTP Unmetabolized percentage
Thin-layer chromatography analysis showed the presence of three or four peaks (Kiesewetter et al., 1998). One metabolite was almost as lipophilic as the parent compound, and thus it may cross the BBB. The fraction of this metabolite was comparable to the parent compound at 30 minutes and was progressively larger at later times. Previous high specific activity studies in the rat showed that approximately 90% of brain radioactivity was the parent compound at 45 minutes. Studies with coinjection of 50 nmol of nonradioactive ligand, in which brain uptake was substantially reduced, showed only 62% of brain radioactivity to be parent compound (note that blockade of specific binding increases the sensitivity for detection of brain metabolites). Therefore, there was evidence that [18F]FP-TZTP metabolites can cross the BBB. Although the percentage of brain metabolites was small after high specific activity administration, and this percentage is expected to be smaller in primates than in rats because of the slower peripheral metabolism rate (Kiesewetter et al., 1998), the lipophilic metabolite may produce a small bias in the later measurements of tissue concentration (see Discussion).
Modeling
Figure 2 shows a sample TAC from a control [18F]FP-TZTP study with fits to the one-compartment model. Uptake throughout the brain is rapid and followed by tracer clearance. In eight control bolus studies, average whole brain activity peaked at approximately 20 minutes with an activity concentration of 0.045% ± 0.009% injected dose/mL.
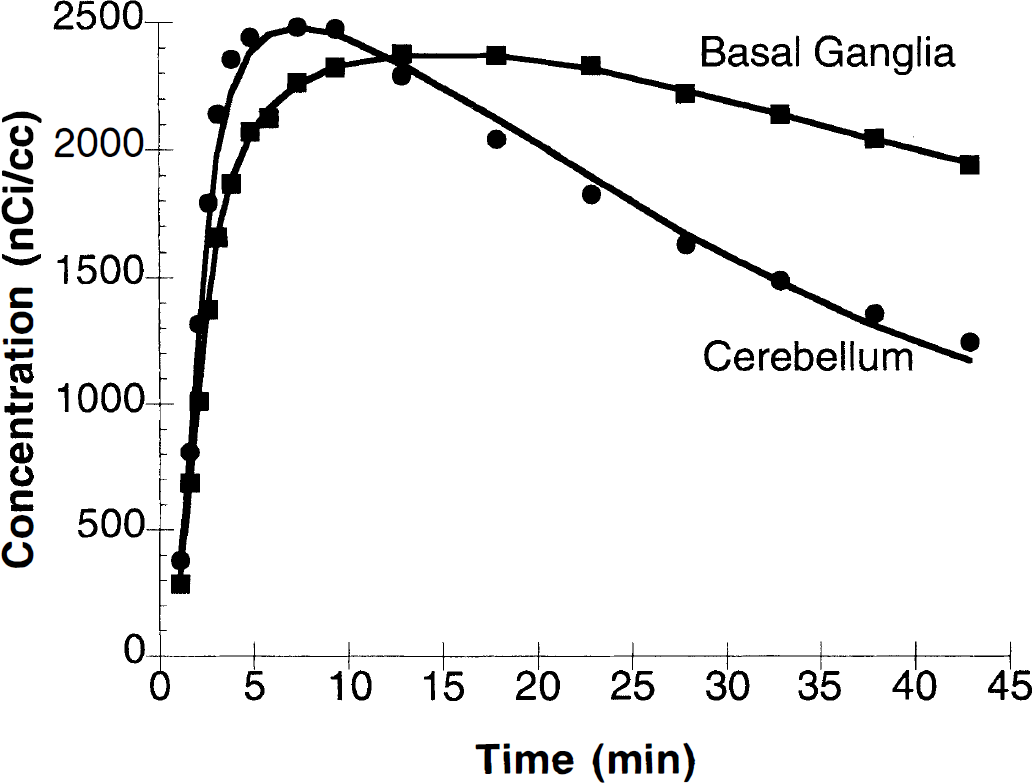
Cerebellum and basal ganglia time-activity curves (TAC) from a control [18F]FP-TZTP study (bolus injection of 4.4 mCi) with fits to the one-compartment model. The cerebellum shows more rapid clearance, consistent with a smaller distribution volume.
The time-activity data from the first 45 minutes for all regions were well described by the model with one tissue compartment (Fig. 2). For the four-parameter model, fitting convergence could not be achieved in many cases. Fits of the data from 1 to 45 minutes were improved using the four-parameter model in only 25% of the cases, as shown by a smaller AIC. Of these, 16% produced unphysiologic parameter estimates with at least one negative value. In the last 9%, the percentage change in the V estimate between the two models was small (7.7% ± 10.4%).
For analysis of longer durations of data (60 and 90 minutes), there was a visible lack of data fit with the two-parameter model in roughly half the cases. Thus, as longer durations of data were used, the four-parameter model showed progressively more improvement in quality of fit. In 48% of the cases, the four-parameter model had improved (smaller) AIC and positive rate constants, and the percentage difference in the V estimates for these cases was 15.4% ± 10.8%. Increased fitting success with the four-parameter model with a longer data set may be caused by a number of factors (see Discussion). However, in the remaining fitting cases, there was a lack of convergence, no improvement in fit quality (as measured by AIC), or negative parameter estimates. Therefore, since this model cannot be used in all cases, only the two-parameter model is considered in subsequent results.
Given the high statistical quality of the data, it was possible to add a regional time delay, Δt, to the model as a third parameter. Because a global Δt correction was already applied, this model tests for the presence of regional variation in the time delay (Iida et al., 1988). Comparing the three-parameter model (K1, V, Δt) with the two-parameter model showed that in about half of the cases the AIC was improved by adding the third parameter. However, adding this parameter produced a minimal change in the estimates of V: −1.2% ± 2.7% for the 45-minute fit, −0.8% ± 1.7% for the 60-minute fit, and +0.1% ± 0.8% for the 90-minute fit. Therefore, the use of regional Δt was not pursued further.
Estimated parameter values and their uncertainties (standard errors) were compared for the two-parameter model fits with varying durations of data. For these ROI data, the predicted standard errors for V averaged 2% to 3% for the 45-minute fit. Fitting longer periods of data decreased the standard error of V by 18% from 45 to 60 minutes and by an additional 17% from 60 to 90 minutes. In addition, V increased by 2.1% ± 3.5% from the 45-minute to the 60-minute fits. Comparing 90-minute with 60-minute fits, V values increased by 5.9% ± 5.3%. Note that shortening the data analysis period to 30 minutes typically increased the V standard error by a factor of 2, and in a case with low flow (K1 was approximately 0.2), produced V estimates with standard errors of 15% to 100%, whereas V increased by 1.8% ± 4.2% from the 30-minute to 45-minute fits (excluding the low flow case). Examination of the percentage changes in V showed that there was much greater interanimal variation than interregional variation, thus suggesting that factors affecting all regions might be the cause. These factors include errors in the metabolite correction or uptake of a lipophilic metabolite (see Discussion). Given these considerations, and the fact that the quality of the two-parameter model fit was not always satisfactory for periods longer than 45 minutes, subsequent results were limited to 45-minute analyses.
The V values produced by the two-parameter model were compared with estimates determined by graphical analysis (Logan et al., 1990). The Logan plots typically achieved linearity by 5 minutes after injection, and there was excellent agreement between the V estimates. For example, for an averaged cortical region with graphical analysis applied from 10 to 45 minutes after injection, the difference between graphical and compartment values was −1.6% ± 6.5%. If longer durations were used, graphical analysis overestimated the fit values (1 to 45 minutes) by 2.3% ± 6.4% (10 to 60 minutes) and 10.1% ± 6.4% (10 to 90 minutes), in a similar manner to the change in V found with increasing the duration for compartment model fitting. This agreement is not surprising because the graphical analysis formulation is based on a mathematical rearrangement of the integrated differential equations of the one-compartment model. Although graphical analysis provides computational ease compared with compartment model fits, the latter approach permits estimation of K1 as well as V.
Control values
Figure 3 shows distribution volume images (V, mL/mL) obtained using pixel-by-pixel fitting from a control [18F]FP-TZTP study. The statistical quality of these data is high because of 3D acquisition and high brain uptake of [18F]FP-TZTP. Uniform V is seen in cortical and subcortical regions with lower binding in the cerebellum. Figure 4 shows images of K1 (mL·min−1·mL−1) from the same study as in Fig. 3. Highest delivery is seen in the cerebellum.
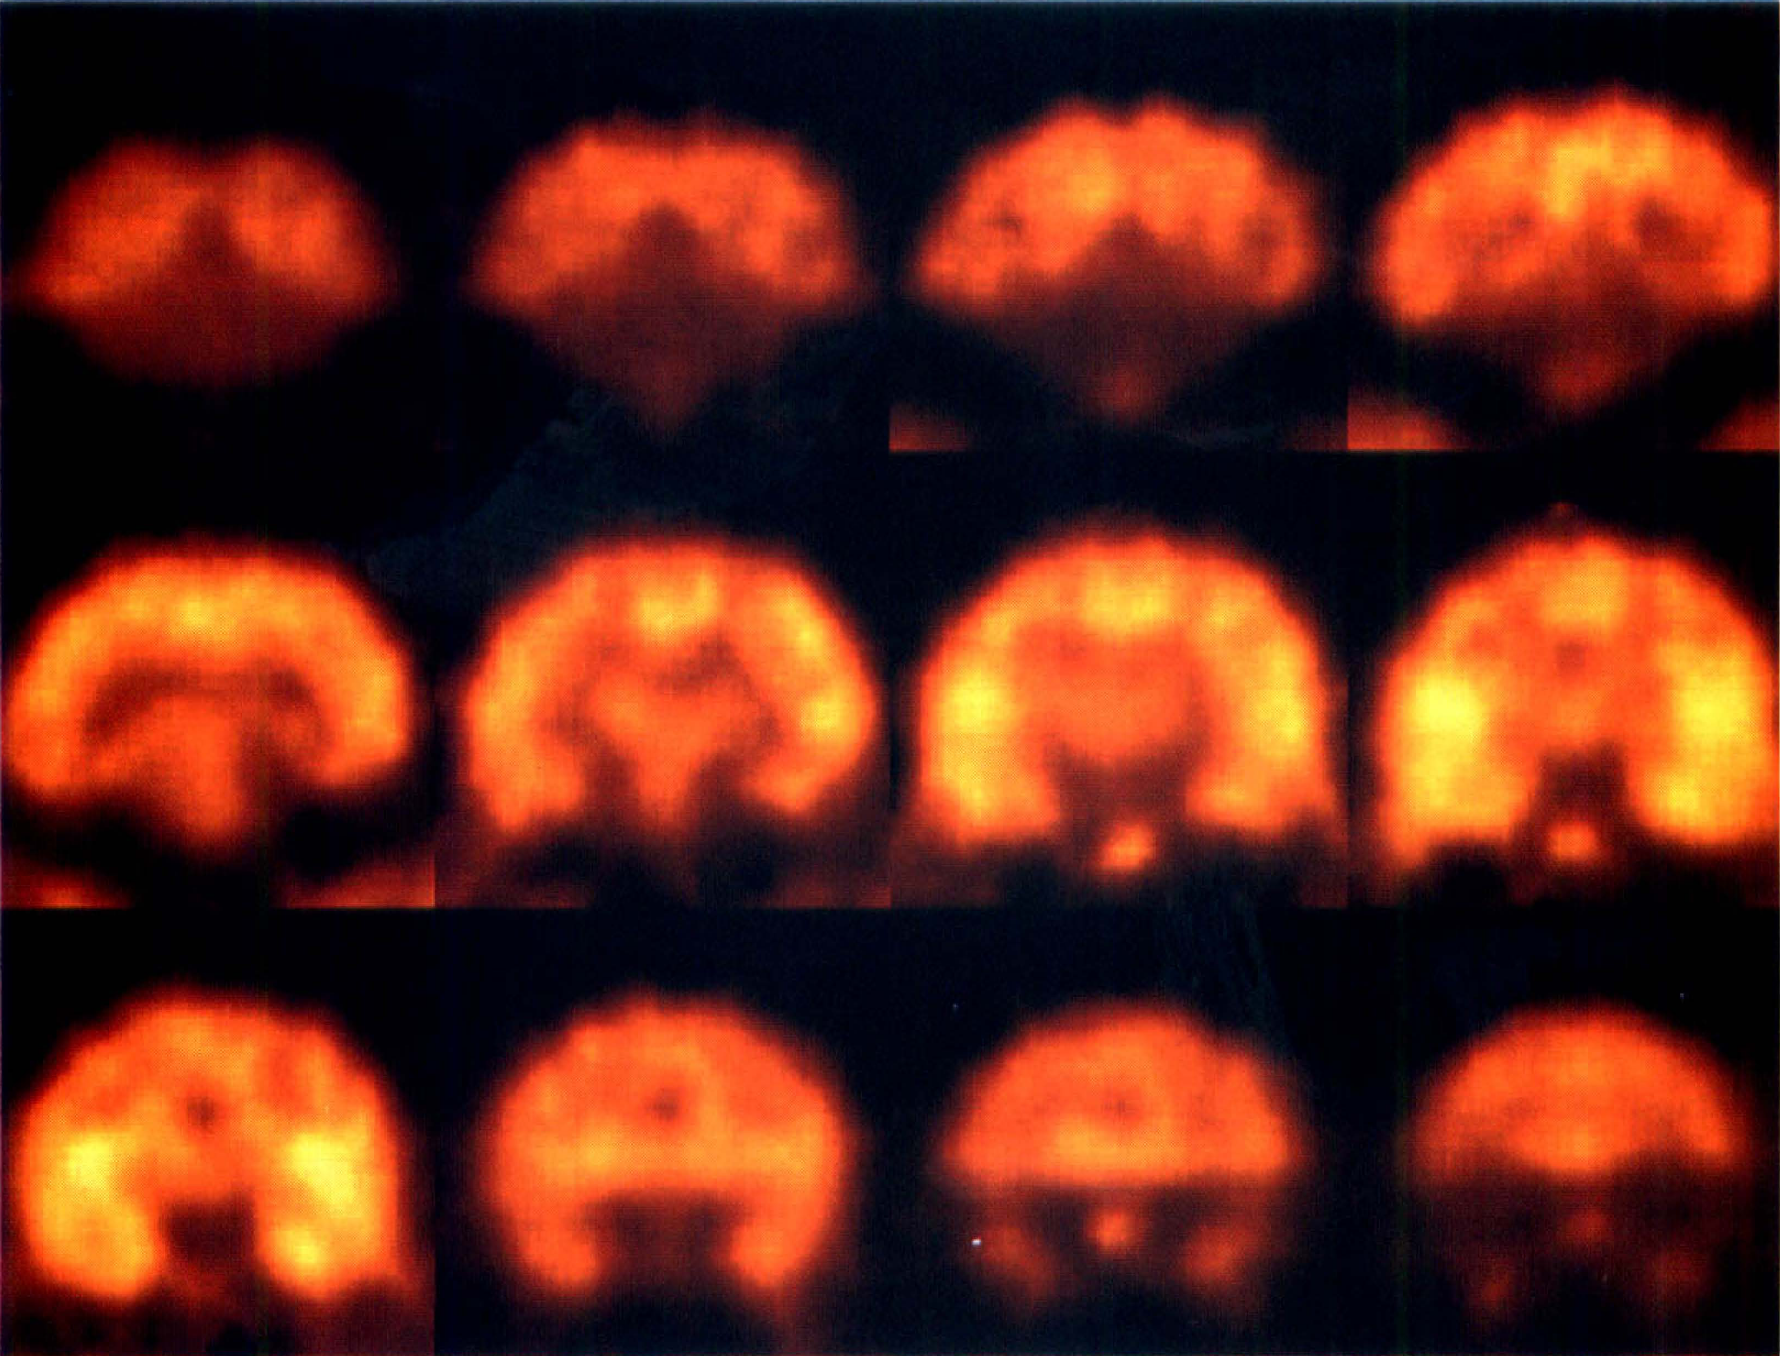
Distribution volume images (V, mL/mL) obtained using pixel-by-pixel fitting from a control [18F]FP-TZTP study (the same study as in Fig. 2). Images are coronal slices in posterior (upper left) to anterior (lower right) order with a separation of 4.25 mm displayed with a maximum intensity of 40 mL/mL. Data from an animal with typical parameter values for the group are shown. Uniform V is seen in cortical and subcortical regions with lower binding in the cerebellum (top row).
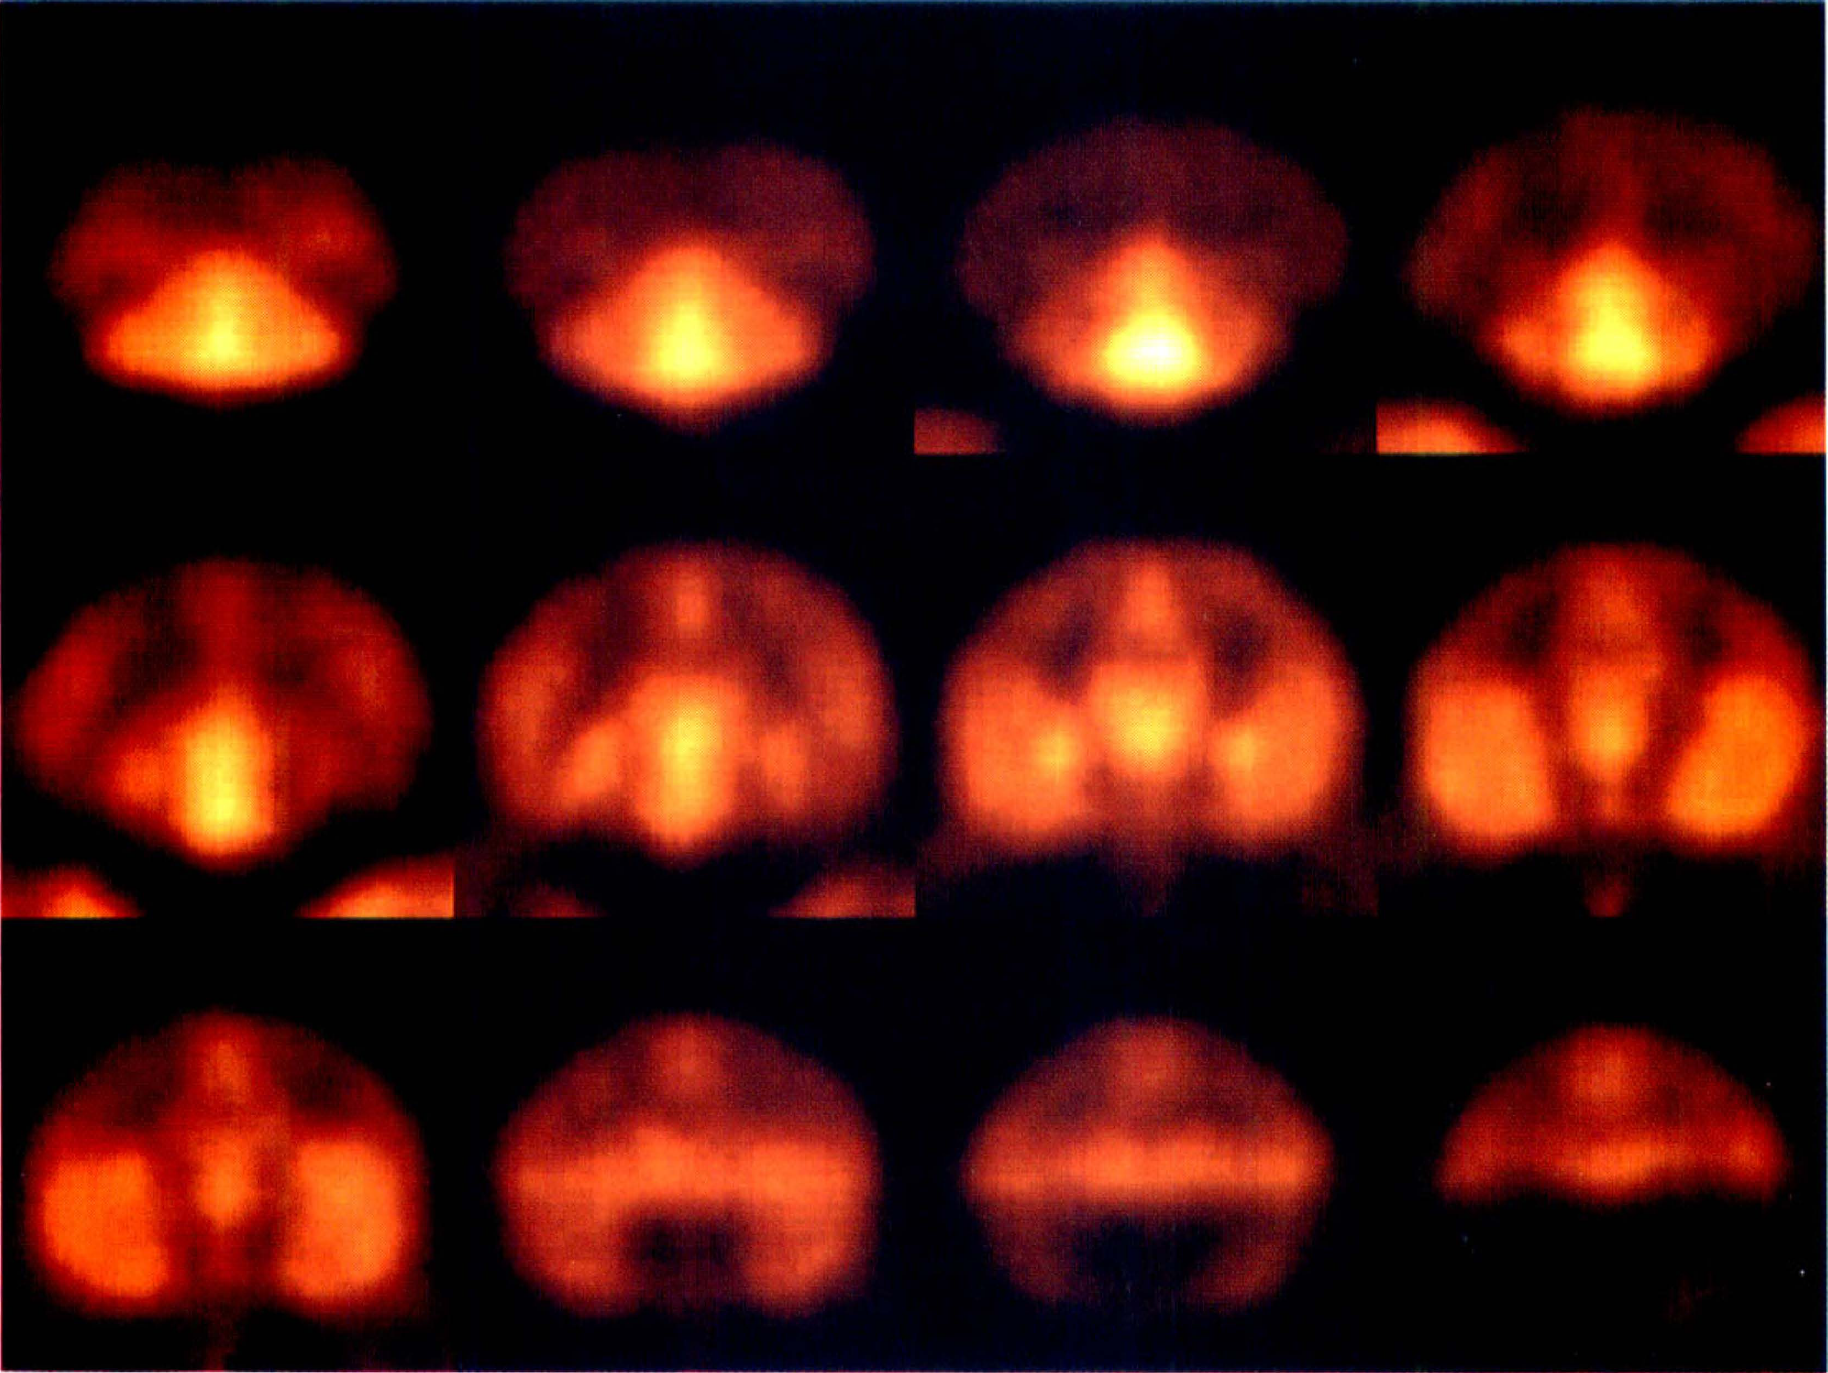
K1 (mL·min−1·mL−1) images obtained by pixel-by-pixel fitting from a control [18F]FP-TZTP study (the same study as in Fig. 3). The highest delivery is seen in the cerebellum. Images are displayed with a maximum intensity of 1.1 mL·min−1·mL−1.
Table 2 shows the mean and SD of V and K1 obtained from ROI analysis of the functional images. Control V values showed uniform cortical and subcortical binding, with lower binding in the cerebellum (P < 0.001). There were no significant correlations of regional V values with injected mass of FP-TZTP in any group (control, preblocking, and physostigmine). This is not surprising because the highest injected mass, 25 nmol (approximately 2.5 nmol/kg), was approximately 10-fold lower per unit body weight than the dose of 5 nmol (approximately 20 nmol/kg) in rats that produced 5% to 30% reduction in [18F]FP-TZTP binding (Kiesewetter et al., 1995). K1 values were large, consistent with high extraction and delivery limited by blood flow. Variability in K1 values was larger than that of V estimates, perhaps because of larger interanimal variation in CBF from the use of anesthesia.
[18F]FP-TZTP Control parameter values
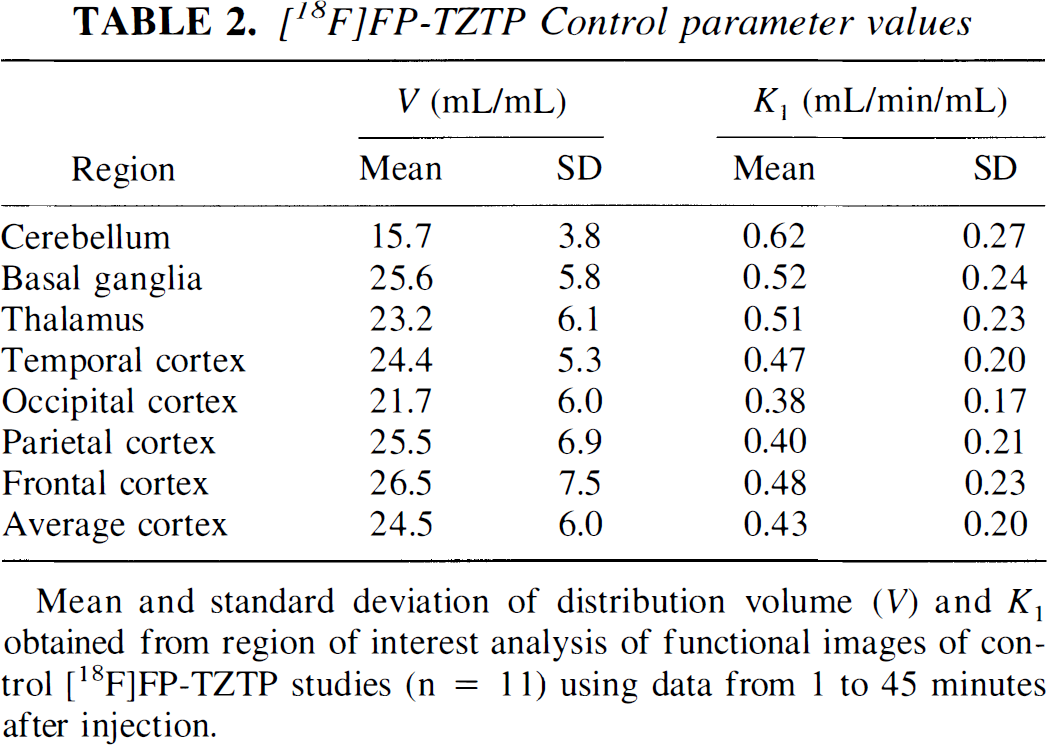
Figure 5 shows the relationship between measurements of K1 from four [18F]FP-TZTP control experiments and CBF measured with [15O]water performed 29 ± 14 minutes before [18F]FP-TZTP injection. The correlation coefficient of the entire data set was 0.85 (when each animal was analyzed separately, the correlations ranged from 0.91 to 0.98). The line of regression was K1 = 1.17 CBF − 0.07. The uncertainties in the slope and intercept values were 0.12 and 0.06, respectively, so the slope is not statistically different from 1.0 and the intercept is not different from 0.0. The correlation of the distribution volume V with CBF was insignificant (0.07). Within the range of CBF values measured here, there is excellent agreement between CBF and the K1 of [18F]FP-TZTP.
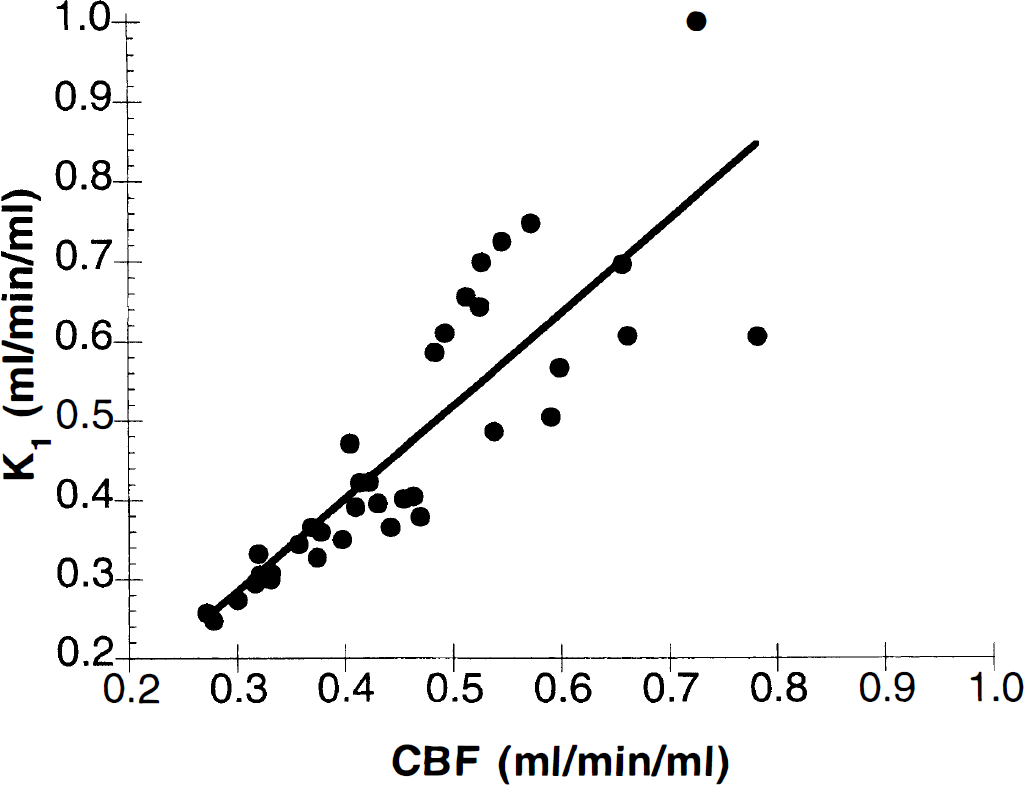
Relationship between measurements of K1 from [18F]FP-TZTP control experiments and CBF measured with [15O]water (shown in the same units as K1, mL·min−1·mL−1) from four experiments. Each point represents an individual ROI value.
Preblocking studies
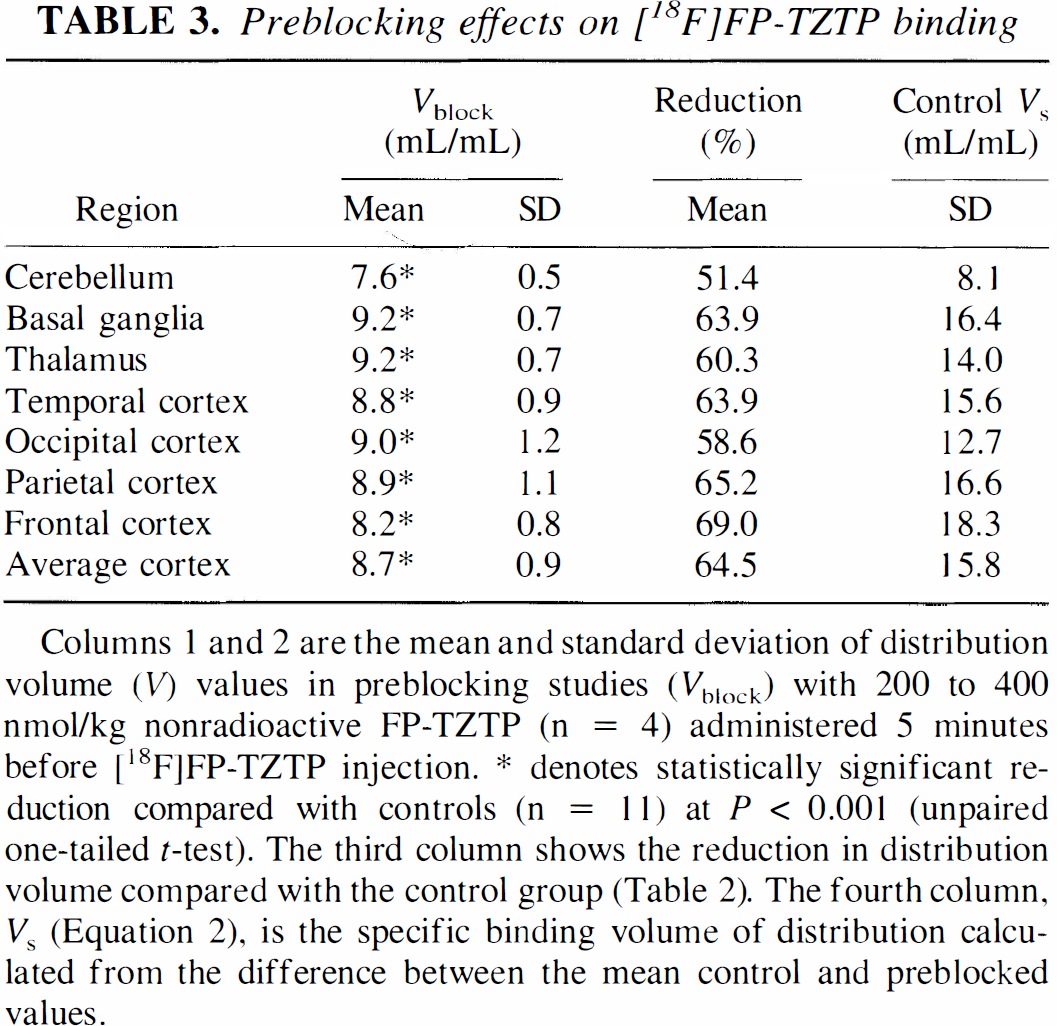
The mean and SD of V values from the preblocking studies (Vblock) are shown in Table 3. Preadministering 200 to 400 nmol/kg of nonradioactive FP-TZTP produced a dramatic reduction in total binding of approximately 50% in the cerebellum and 60% to 70% in other gray matter regions. Similar blockade of binding was seen in rat coinjection studies with comparable doses (Kiesewetter et al., 1995). This reduction was highly significant in all regions (P < 0.001, 1-tailed unpaired t test). The regional distribution of V values after preblocking became nearly uniform. In addition, the interanimal variability found in V was substantially reduced from approximately 25% in control studies to approximately 10% in the preblocking studies.
Preblocking effects on [18F]FP-TZTP binding
Analysis of the preblocking TACs showed poorer quality fits with the one-compartment model than was found for the control studies. This may be caused by (1) radioactive metabolites in the brain, which will contribute a higher percentage of counts in the preblocking studies, and will have a larger effect on the quality of the fit, or (2) time-variations in receptor saturation or blood flow from administration of the agonist FP-TZTP.
Specific binding
Assuming that the preblocked V values represent only nonspecific binding, the specific binding volume of distribution VS (Table 3) was calculated from the difference of control and preblocked V values. From equation 1, VS is linearly proportional to B′max:
In comparing these VS values with the receptor distribution found in primates or rats, there is an excellent match with the M2 distribution. In rats (Li et al., 1991), the concentration of M2 receptors in cortical structures, basal ganglia, and thalamus is highly uniform, and approximately 50% lower in cerebellum. In rhesus monkey (Flynn and Mash, 1993), the distribution of M2 receptors also shows uniform density in basal ganglia, cortex, and thalamus. This pattern is unlike that of M1 receptors in which basal ganglia > cortex > thalamus (Wall et al., 1991; Flynn and Mash, 1993).
Physostigmine studies
Infusion of physostigmine typically produced a temporary reduction in heart rate that averaged 5 beats per minute and a prolonged reduction in arterial pressure of approximately 10 mm Hg. Similar effects were seen with the administration of preblocking doses of nonradioactive FP-TZTP. The plasma physostigmine assay showed that an infusion rate of 100 μg·kg−1·h−1 produced a final concentration of 28 ± 3 ng/mL. At 15 minutes into the infusion, the plasma concentration was 65% to 86% of the final level, and at 35 to 45 minutes, it reached 73% to 99% (87% ± 11%) of the final level. Thus, plasma equilibrium was not complete by 30 minutes when the [18F]FP-TZTP injection was performed. However, near-equilibrium levels in plasma were achieved.
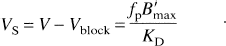
Figure 6 shows V images from an [18F]FP-TZTP study that began 30 minutes after the start of physostigmine infusion. Fits of the TACs have comparable quality to that found in the control experiments. V values in physostigmine studies and the percentage reduction in V and VS compared with controls are shown in Table 4. There were no significant differences between the V values for the two doses of physostigmine used (100 μg·kg−1·h−1, n = 3; and 200 μg·kg−1·h−1, n = 4), although the mean V value was lower for the high-dose group for all regions, so these data were analyzed as a single group. Physostigmine produced a 23% reduction in cortical V (P < 0.05, 1-tailed unpaired t test) and a 35% reduction in VS, consistent with increased ACh competition. When V values were corrected for fp (see below), the reduction in binding was statistically significant in all regions.
Physostigmine effects on [18F]FP-TZTP binding
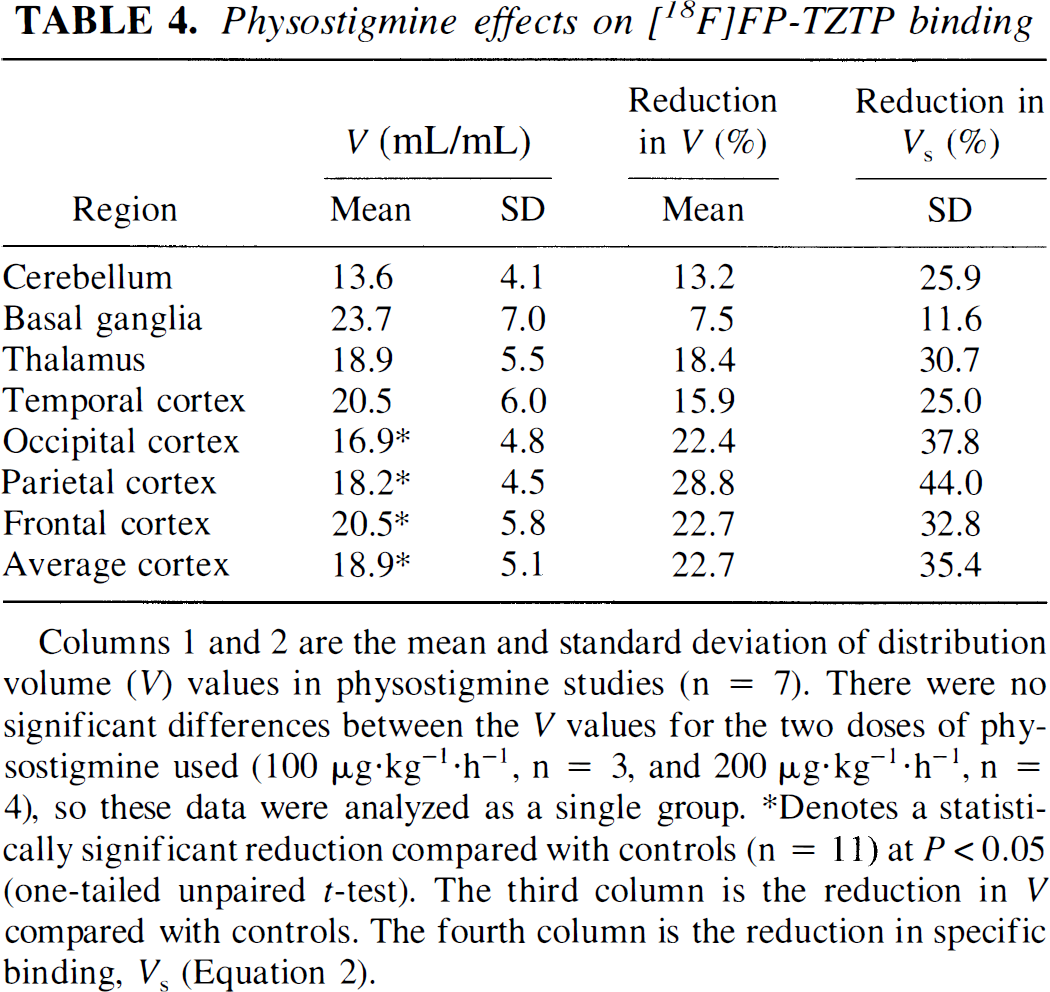
V images from an [18F]FP-TZTP study (bolus injection of 1.0 mCi) beginning 30 minutes after the start of the physostigmine infusion (200 μg·kg−1·h−1). Images are displayed with a maximum intensity of 40 mL/mL, as in Fig. 3. Data from an animal with typical parameter values for the group are shown.
The cerebellar reduction in V was smaller than that in cortex (P < 0.05, 2-tailed unpaired t test), because of its smaller specific binding fraction. The reduction in VS, however, was 25%, comparable to that found in cortical regions. It is interesting that the V and VS reductions in basal ganglia were significantly smaller than those in cortex (P < 0.01), as can be seen comparing the V images (Figs. 3 and 6). In control studies, basal ganglia and cortical binding were comparable, but with physostigmine the basal ganglia binding was relatively higher. One explanation for the difference is the markedly higher AChE activity in basal ganglia than in cortex (see Discussion).
Plasma protein binding
The fraction of [18F]FP-TZTP unbound to plasma proteins was 10.4% ± 2.0% (range, 6.2% to 13.3%). Theoretically, the higher the unbound fraction in plasma, the higher the equilibrium distribution volume, as seen in equation 1. This relationship has been demonstrated with [11C]raclopride in humans (Farde et al., 1989). Intersubject variation in fp should produce matching variation in V and VS. Ideally, there should be a strong positive correlation between V and fp, and normalization of V by fp should reduce within-group variance. In control studies, the correlation between V and fp ranged from 0.26 to 0.65 across regions (P < 0.05 for approximately half the ROIs). The correlation of fp with K1 was not significant in any region (range, 0.22 to 0.34). Normalization of the V values for fp did not, however, produce a consistent reduction in the interanimal coefficient of variation across regions. This suggests that the interanimal variance in V removed by normalization is matched by increased noise from measurement errors in fp.
When V values were corrected for fp, the statistical significance of the difference between control and physostigmine studies increased in all regions (P < 0.01 in all cortical regions, cerebellum, and thalamus and P < 0.05 in basal ganglia) because fp in control and physostigmine studies was 9.4% ± 2.0% and 11.5% ± 1.6%, respectively (P < 0.05). Thus, the higher fp in the physostigmine studies produced an apparently smaller difference in uncorrected V values. This suggests that correcting V for fp may be useful.
Effects of anesthesia
In [18F]FP-TZTP studies with physostigmine, a statistically significant increase in thalamus K1 compared with controls was found (P < .01) as well as a trend toward increases in basal ganglia and cortical regions. Absolute and relative increases in CBF after physostigmine have been previously reported (Scremin et al., 1990). Similar increases were also seen in the FP-TZTP preblocking studies, in which significant K1 increases were found in the thalamus and cortical regions (P < 0.05).
However, because of our study design, particularly the two paired control/physostigmine studies, it was often the case that the animals had been maintained on isoflurane anesthesia for a longer period of time for the physostigmine (2.7 ± 1.6 hours) or preblocking (2.2 ± 1.3 hours) studies than for the control studies (1.3 ± 0.5 hours). It has previously been reported that CBF in isoflurane-anesthetized primates increases with time (McPherson et al., 1994). The correlation of K1 with time on isoflurane (tiso) ranged from 0.59 to 0.77 (P < 0.01) across ROIs. The slope of the relationship between K1 and tiso was approximately 0.15 mL·min−1·mL−1·h−1, i.e., K1 would increase from 0.40 to 0.55 mL·min−1·mL−1 during 1 hour of isoflurane anesthesia. Using tiso as a covariate, analysis of covariance was used to determine any group differences (control, preblocking, and physostigmine) in K1 after correction for tiso; no significant effects were found.
Analysis of covariance was also applied to the V data to assess the sensitivity to time under anesthesia. There was a statistically significant (P < 0.05) linear relationship between tiso and V in half the ROIs tested. The average slope was approximately 2.0 mL·mL−1·h−1. If V values were first corrected for fp, the linear relationship with tiso was statistically significant only for the cerebellum. Analysis of covariance correction for the tiso effect increased the statistical significance of the physostigmine-induced reduction in V in all regions (P < 0.01 in the cortical regions, cerebellum, and thalamus and P < 0.05 in the basal ganglia). Interactions of inhalational anesthesia with the muscarinic system (see Durieux, 1996, for review) may account for these changes in receptor binding.
DISCUSSION
Summary
[18F]Fluoropropyl-TZTP TACs are well described by a one-compartment model. Tissue uptake is rapid, and quantification of receptor information is based on model estimates of V. In monkeys, the regional pattern of V was consistent with that of M2 receptors, uniform in cortical and subcortical regions, with lower binding in the cerebellum (Li et al., 1991; Flynn and Mash, 1993). The pattern differed significantly from the distribution of M1 receptors, the muscarinic subtype to which this tracer shows threefold lower in vitro affinity. Preblocking studies were used to estimate the level of nonspecific binding. In addition, [18F]FP-TZTP binding is significantly reduced by increased extracellular ACh levels produced by the AChE inhibitor physostigmine.
Kinetic characteristics
Because of the kinetic characteristics of [18F]FP-TZTP, modeling is essential for proper interpretation of the data. First, extraction is high, so delivery is flow-limited and the shape of the tissue TAC is heavily influenced by flow. Further, in a group of anesthetized animals, CBF is highly variable, as seen by the higher interanimal variability in K1 (approximately 46%) than in V (approximately 25%). This flow sensitivity made it difficult to choose optimum infusion parameters to achieve rapid equilibrium for B/I delivery (Carson et al., 1993), i.e., the optimal bolus fraction depended on the absolute blood flow of each animal. It is possible that the B/I approach will be useful in awake human subjects in whom flow will be higher and less variable than in anesthetized animals.
The V values in the control state are high (15 to 25 mL/mL), thus k″2 values (K1/V) are relatively low (0.015 to 0.04 min−1). If delivery of this tracer was poor, and a high volume of distribution was maintained, its kinetics would be nearly irreversible because k″2 would be even smaller. Because of the high extraction, the tracer behaves in a reversible fashion within the time frame of these studies, and V can be reliably estimated from the time-activity data.
Model selection
In comparing various modeling approaches for [18F]FP-TZTP, a model with one tissue compartment was chosen over the two-compartment model because reliable parameter estimates could not be obtained with the latter in many cases. This was particularly true for the 45-minute data analysis period. Including more data (60 and 90 minutes) increased the number of fits that improved with the two-compartment model or alternatively increased the estimated V values with the one-compartment model. There are a number of factors that could produce these effects. Errors in the metabolite correction of the input function could be a major contributor to the change in V with increasing fitting duration. Because at later times the parent fraction is small, a modest error in the unmetabolized fraction produces a large fractional change in Cp and a bias in the model.
In addition, the possible uptake of a lipophilic metabolite into the brain would have its greatest impact at later times, causing a rise in tissue radioactivity concentration. This effect could create the need for an additional compartment to fit the TAC or alternatively produce biased values if the one-compartment model is used. The effect of a lipophilic metabolite entering the brain was simulated as a linear function scaled to equal 10% of tissue activity at 45 minutes (based on high specific activity data obtained in rat brain [Kiesewetter et al., 1998]). Fits to the one-compartment model showed less than 1% bias in K1 with 18% overestimation of V for 45-minute fits increasing to 26% for 90-minute fits. Note, however, that the rate of peripheral metabolism of [18F]FP-TZTP is substantially slower in primates than in rats. For example, the ratio of lipophilic metabolite to parent in primate plasma was 0.4 and 1 at 10 and 30 minutes, respectively, whereas the ratio in rat plasma at those times was 1.6 and 10. Thus, the primate brain uptake of lipophilic metabolites should be substantially less than that used in these simulations, and the resulting bias should be much smaller.
Although the 45-minute period was chosen for animal studies, this value will need to be reevaluated for human studies. Because the radioactivity dose (per unit of body weight) will likely be smaller in human subjects than the one used here, increasing the statistical reliability of the V estimates by extending the data analysis period may be important. To evaluate this effect, the predicted standard error of the V estimate was computed from the inverse of the information matrix derived from increasing durations of data analysis from a simulated [18F]FP-TZTP TAC using a typical input function and average rate constants. This analysis suggested that the uncertainty in the V estimates can be reduced by a factor of three by extending the end of the data analysis period from 45 to 90 minutes. Other factors affecting the choice of study duration include the rate and nature of peripheral metabolism, the accuracy of the metabolite correction, and subject cooperation.
The regional V values were determined by applying ROIs to the functional images. These estimates were compared with those obtained from fitting the ROI TACs. Despite the fact that both methods used the identical model, there was a slight discrepancy in values, with the functional image values being 1.1% ± 1.5% higher. The largest differences (up to 7%) were found for the regions with the smallest k″2 values. This difference can be attributed to the slight biases introduced by fitting to a nonlinear model as the data became noisier. Because the functional images were produced on a pixel-by-pixel basis, the data values were noisier and the bias was larger. Simulations of [18F]FP-TZTP data (data not shown) with a noise level comparable to that of the ROI used here showed no significant bias. At the single pixel noise level, the bias in V ranged from 0.4% to 1.9%.
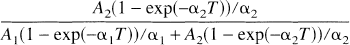
For a number of radioligands, the difference in fit quality between models with one and two tissue compartments is small (Koeppe et al., 1991; Lammertsma et al., 1996; Carson et al., 1997). Further, regions with the lowest specific binding have shown the clearer requirement for the more complex model. In these [18F]FP-TZTP experiments, the two-compartment model could not be reliably applied. This effect can be understood from the solution to the two-compartment model:

where the parameters A1, α1, A2, and α2 are functions of the rate constants K1, k′2, k′3, and k4, with α1 < α2. If the contribution of one of the two exponential terms in equation 3 is small compared with the other, then the one- and two-compartment model solution will be nearly indistinguishable. The relative magnitude of these terms can be assessed by the fraction of the area of the model impulse response attributable to the second term, up to time T, as follows:
For [18F]FP-TZTP, K1 was approximately 0.5 mL·min−1·mL−1 (Table 2), and assuming a nonspecific distribution volume of approximately 8 mL/mL (Table 3) gives k′2 = K1/V = 0.0625 min−1. Comparing the preblocked and control V values suggests binding potential values (BP′ = k′3/k4) of approximately 1 for cerebellum and 2 for other gray matter ROI. Calculating the impulse response fraction (equation 4) for k4 values of 0.1 min−1 or higher (with k′3 = BP′·k4) showed that the smaller component accounted for less than 2% and 4% of the impulse response during the first T = 45 minutes for BP′ values of 2 and 1, respectively. Thus, the detection of a second tissue compartment becomes more difficult for larger k4 values, particularly with larger binding potentials.
Measurement of nonspecific binding
In many neuroreceptor studies, nonspecific binding is assessed from a region with minimal specific binding. Furthermore, V values are often normalized to these nonspecific values, which tends to reduce variability from errors in the input function or by intersubject differences in fp. Previously, estimates of nonspecific binding in PET muscarinic cholinergic studies were taken from the cerebellum (Dewey et al., 1990). Although treating the cerebellum as a region with little specific binding may be appropriate for tracers with little muscarinic subtype selectivity, the cerebellum clearly demonstrates significant specific binding of [18F]FP-TZTP, as seen from the 50% reduction in V in the preblocking studies (Table 3). This difference can be understood by recognizing that although the total muscarinic receptor concentration in the cerebellum is low, a high fraction of those receptors are of the M2 subtype (Li et al., 1991) and so the cerebellum is not suitable for estimating [18F]FP-TZTP nonspecific binding.
Because of the widespread distribution of muscarinic receptors, an appropriate “background” region for [18F]FP-TZTP in monkey studies has not been determined. For example, although there is minimal M1 and M2 specific binding in the globus pallidus (Flynn and Mash, 1993) in rhesus monkeys, this region was not used because of PET resolution limitations. Thus, in these studies, the volume of distribution of free plus nonspecifically bound tracer was determined from preblocking studies. In cortex, free plus nonspecifically bound tracer was estimated to be approximately 36% of the cortical total volume of distribution.
Measurement of specific binding
Equation 2 defines VS in terms of the receptor parameters B′max and KD. However, this formulation assumes that the ligand binds to a single receptor population. Note, however, that because the difference between the affinity of [18F]FP-TZTP for the M1 and M2 receptors is only threefold (Ki of 7.4 nmol/L for Mi and 2.2 nmol/L for M2 [Kiesewetter et al., 1995]), there is likely some contribution of M1 binding to the [18F]FP-TZTP specific binding pattern. In this case, the interpretation of VS is:
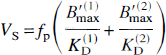
where the (1) and (2) superscripts refer to M1 and M2 receptors, respectively. In humans, the concentration of M1 receptors is considerably larger than M2 receptors (Aubert et al., 1992). Thus, the binding of [18F]FP-TZTP to M1 receptors will likely reduce the sensitivity of this tracer to detect reductions in M2 levels in Alzheimer's disease.
Competition studies with physostigmine
Microdialysis studies in rats have shown that physostigmine produces 1,000% increases in ACh levels (Cuadra and Giacobini, 1995), although the magnitude of ACh response depends on the dose, the route of administration, and the tissue sampled. Such large changes in neurotransmitter levels may be necessary for detection with radioligand methods. For example, in simultaneous [11C]raclopride and microdialysis studies in primates using amphetamine challenge (0.2 and 0.4 mg/kg), Breier et al. (1997) showed changes of 11% and 21% in specific binding after 460% and 1,370% increases in extracellular dopamine.
In control studies, basal ganglia and cortical binding were comparable, but with physostigmine, the reduction in basal ganglia binding was significantly smaller than that in cortex. One possible cause of this difference is that the basal ganglia has a markedly higher AChE activity than cortex. Mesulam et al. (1986) showed that AChE activity in putamen of rhesus monkeys is approximately 10-fold higher than in cortex. Similarly, Tavitian et al. (1993) showed uniform delivery but higher retention of [11C]physostigmine in basal ganglia, consistent with higher AChE activity. Because of the higher AChE capacity in basal ganglia, physostigmine inhibition of AChE may be less complete. Thus, the increase in ACh may be smaller and result in a lesser reduction in [18F]FP-TZTP binding in the basal ganglia. However, the effects of AChE inhibition on extracellular ACh levels are complex. For example, Messamore et al. (1993), found that different levels of AChE inhibition produced comparable extracellular ACh levels; thus, other factors, such as inhibition of ACh release by muscarinic autoreceptors, also affect extracellular ACh levels.
3D positron emission tomography acquisition
The 3D PET acquisition used here provided images with high statistical quality and permitted calculation of functional images without smoothing. The quantitative accuracy of 3D images is still under investigation because of the greatly increased scatter fraction compared with 2D data. Inaccuracies in the scatter correction can add a time-varying bias that could introduce (or remove) the need for an additional compartment in the model. To assess quantitative accuracy, phantoms designed to mimic the [18F]FP-TZTP distribution were studied (data not shown). In these phantoms, 3D and 2D measurements agreed within 5% to 10%. Thus, for these studies, the quantitative accuracy of 3D scanning was satisfactory, particularly because (1) the amount of attenuation (and thus scatter) is not large, and (2) the brain activity is high compared with other tissues, so errors in scatter correction will produce smaller percent errors in radioactivity measurements. If a region with low activity and little specific binding was used to measure nonspecific binding, a higher degree of quantitative accuracy might have been required.
CONCLUSION
These studies indicate that [18F]FP-TZTP binding to muscarinic cholinergic receptors can be reliably measured with the volume of distribution estimated from a one-compartment model. The distribution of binding is consistent with that of M2 receptors. [18F]Fluoropropyl-TZTP binding is sensitive to changes in extracellular ACh levels as produced by physostigmine. Thus, this tracer should be useful for the in vivo measurement of muscarinic cholinergic receptors with PET.
Footnotes
Acknowledgements
The authors thank the National Institutes of Health PET staff, particularly Wendy Greenley, George Elliott, Susan Fluck, Jerry Jacobs, and Wendy Linthicum for their excellent technical support. The authors also thank Drs. Christopher Endres and Hiroshi Watabe for their helpful comments, and John Bacher, DVM, and his staff for their veterinary assistance. The physostigmine plasma analysis was graciously provided by Dr. Umesha Shetty of the Laboratory of Neurosciences, NIA, National Institutes of Health.