
Abstract
Functional magnetic resonance imaging (fMRI) rests on the assumption that regional brain activity is closely coupled to regional cerebral blood flow (rCBF) in vivo. To test the degree of coupling, cortical brain activity was locally stimulated in rats by reversed microdialysis infusion of picrotoxinin, a γ-aminobutyric acid-A antagonist. Before and during the first 30 minutes of infusion, simultaneous fMRI (rCBF) and neurochemical (interstitial glutamate concentration) measures of brain activity were highly correlated (r = 0.83). After 30 minutes of picrotoxinin-induced stimulation, glutamate levels decreased but rCBF remained elevated, suggesting that additional factors modulate the relationship between neuronal neurotransmitters and hemodynamics at these later stages.
The ability to map regional brain activity by monitoring changes in hemodynamics using functional magnetic resonance imaging (fMRI) is finding widespread application. Unique among brain imaging techniques, fMRI allows noninvasive three-dimensional mapping of the functioning of the entire brain with spatial resolution less than a millimeter and temporal resolution on the scale of seconds. Presently, there are two approaches to fMRI. One is based on changes in deoxyhemoglobin that occur because of increased regional blood flow in excess of increased oxidative metabolism, known as blood oxygen level-dependent imaging (Bandettini et al., 1992; Kwong et al., 1992; Ogawa et al., 1992). The other is based on using endogenous water as a tracer to directly quantitate changes in regional cerebral blood flow (rCBF) (Detre et al., 1992; Williams et al., 1992; Edelman et al., 1994; Kim, 1995; Silva et al., 1995). Both techniques rely on the linkage between increases in regional brain activity and increases in regional brain blood flow (or oxygenation). Indeed, a major limitation of fMRI-based studies is that changes in hemodynamics are measured rather than direct measures of neural activity, such as electrical activity, intracellular calcium levels, or neurotransmitter release. There has yet to be a direct in vivo comparison of fMRI with a direct measure of neural activation, especially in response to a neurochemically specific, localized stimulus. To begin to quantitate the relationship between fMRI responses and neurotransmitter release, we turned to microdialysis, a technique that allows highly localized and neurochemically specific stimulation of a brain region, as well as sampling and quantitation of specific neurotransmitters (Bito et al., 1966; Delgado et al., 1972; Ungerstadt, 1984). Using a rat microdialysis system specially constructed for use in the MRI environment (Benveniste et al., 1992), we infused picrotoxinin, a γ-aminobutyric acid (GABA)-A inhibitor known to induce neural activity, directly into the cerebral cortex of the rat while monitoring both glutamate release and rCBF changes around the microdialysis probe tip. We wished to determine whether the spatial and temporal pattern of rCBF changes measured by fMRI would correspond to the applied picrotoxinin stimulus and also to the level of glutamate release as a direct neurochemical measure of activation.
METHODS
Microdialysis
All experiments were conducted according to protocols approved by the Animal Care and Use Committee of the University of Pittsburgh. On the day before the fMRI experiment, anesthetized (2% halothane, 50:50 mixture of N2O and O2), orotracheally intubated, and mechanically ventilated male Sprague-Dawley rats (Harlan Sprague Dawley, Indianapolis, IN, U.S.A.; n = 4, 200 to 250 g) were placed in a stereotactic frame (David Kopf, Tujunga, CA, U.S.A.) for placement of an intracerebral guide cannula (CMA/Microdialysis, Acton, MA, U.S.A.). Because we desired a microdialysis probe orientation perpendicular to our image plane (constrained to coronal-see below), we needed to insert the guide cannula as nearly horizontal as possible. Mechanical constraints limited us to a guide cannula orientation 10° below horizontal. A 0.5-cm burr hole was placed at coordinates (relative to Bregma) anteroposterior −6.0 mm, mediolateral +5.3 mm. Using the dorsal-ventral movement control we slowly advanced the guide cannula in a posterior to anterior direction 4.1 mm (from the dura at point anteroposterior −6, mediolateral +5.3). We fixed the guide cannula in position with plastic skull screws and dental cement. After the procedure each animal was extubated, awakened, and allowed to recover overnight in an individual cage with ad libitum food and water.
On the day of the experiment, we anesthetized (urethane, 1.1 g/kg, intraperitoneally), intubated, and ventilated (70:30 N2O to O2), each animal before placement of a femoral arterial line for monitoring of blood pressure, heart rate, and PCO2 and for infusion of pancuronium (0.2 mg·kg−1·h−1). After arterial line placement, we positioned each animal in a special holder incorporating a head coil and warm water blanket (controlled by a rectal probe to maintain animal temperature at 37°C). Just before placement in the magnet bore, we removed the inner stylet of the guide cannula and inserted the microdialysis probe slowly by hand. After probe insertion the animal was positioned in the magnet and anatomic scout images (see below) were made to locate the probe tip for placement of the imaging plane. Generally, there was a delay of about an hour between insertion of the probe and the start of the rCBF experiment.
Before probe insertion the microdialysis system was prepared as follows. Two 10-mL syringes (Plastipack, Becton-Dickinson, Franklin Lakes, NJ, U.S.A.) were filled, respectively, with artificial cerebrospinal fluid (ACSF: NaCl 149 mmol/L, KCl 3.7 mmol/L, MgCl2 0.9 mmol/L, CaCl2 1.2 mmol/L, NaH2PO4 1.2 mmol/L, pH 7.4, sterile-filtered before use [Pich et al., 1993]) or picrotoxinin (Sigma Chemical Co., St. Louis, MO, U.S.A.) (dissolved in 0.5 mL of ethanol and brought to final concentration of 0.5 mmol/L in the above ACSF [2.5%, final ethanol concentration]). We attached each syringe by means of a three-way stopcock to a 5-m length of PE-50 tubing extending to a Y-connector (Small Parts, Inc., Miami, FL, U.S.A.) taped to the front of the magnet. After thoroughly flushing both lines, using the stopcock we diverted the picrotoxinin flow to waste (and to prevent backflow). Flow through the ACSF line was allowed to continue at 3 μL/min. Flow through both syringes was controlled using a single syringe pump (Harvard Apparatus, South Natick, MA, U.S.A.). Two × 1-m lengths of FEP tubing (CMA, 1.2 μL/10-cm length) were attached to the inlet and outlet ports of custom, nonmetallic microdialysis probes (CMA/11, polycarbonate membrane, molecular weight cutoff 20,000, 3-mm tip length). We attached the inlet length of FEP tubing to the outlet of the Y-connector. Using this system we could change fluids using the stopcocks without having to enter the magnet room or interrupting scanning. Because of the dead space and other considerations, there was approximately 20 minutes' lag between fluid switches and arrival of solution at the probe tip.
Image acquisition and analysis
All experiments were performed in a Bruker AVANCE 4.7 Tesla/40 cm system (Bruker Instruments, Billerica, MA, U.S.A.) equipped with a 12-cm gradient insert and a 7-cm diameter 1H imaging coil. The coronal plane at the right parietal cortex corresponding to the probe tip was positioned at the isocenter of the magnet after pilot multislice, spin-echo images. The arterial spin labeling MRI technique (Detre et al., 1992; Williams et al., 1992) uses arterial water as a tracer by magnetically inverting the water proton spins continuously using adiabatic fast passage (Dixon et al., 1986). To measure rCBF two brain images are necessary: a labeled image with the inversion plane centered over the carotid arteries and a control image with the inversion plane centered symmetrically opposite to the original inversion plane. The latter positioning of the inversion plane controls for off-resonance saturation of tissue water owing to cross-relaxation with macromolecules (Zhang et al., 1992). Spin-echo rCBF images were acquired with the following parameters: repetition time = 2 seconds, echo time = 6.4 msec, number of averages = 2, field of view = 3.0 cm, and matrix size = 256 × 130. In the first two rats, there was a 9-minute interval per rCBF pairing. Subsequently, a rapid acquisition with relaxation enhancement factor of two was used to reduce scan times by a corresponding factor. However, to accommodate the full dataset all rCBF data were binned into 9-minute intervals.
All images were motion-corrected using AIR3.0 (Woods et al., 1992) before analysis. Control and labeled images were collected in an alternating sequence. For every control-labeled and labeled-control pairing, rCBF was calculated for each pixel using the following equation:
where λ is the blood-brain partition coefficient for water, 0.9 mL/g (Herscovitch and Raichle, 1985); MC is the magnetization intensity of the control image; ML is the magnetization intensity of the labeled image; α is the efficiency of labeling, 0.8 (Zhang et al., 1993); and T1obs is the in vivo spin-lattice relaxation time for tissue water, 1.6 seconds (Detre et al., 1992).
Analysis of rCBF versus distance profile
Because the arterial spin-labeling procedure also labeled fluid flowing through the probe, the probe tip was brightly lit in the baseline rCBF maps. The brightest point was considered the probe tip center. We recorded the rCBF value for each within-brain voxel at each time point for each rat. Voxels greater than 3 mm from the probe tip center were excluded from further analysis. Four baseline rCBF maps were discarded owing to a software error. There was at least one good baseline rCBF image from each rat. To determine whether the obtained rCBF profiles were consistent with the known binding properties of picrotoxinin and the diffusive kinetics of microdialysis, we used data from Dykstra et al. (1992) to generate the expected normalized concentration profile around the probe as a function of time. This was converted into an expected picrotoxinin concentration profile by multiplying by the concentration of picrotoxinin in the dialysate (500 μmol/L) and an assumed 20% transfer coefficient for picrotoxinin across the dialysis membrane. The transfer coefficient estimate is based on the molecular weight of picrotoxinin (MW, 292) (Kendrick, 1989). Assuming a simple rectangular hyperbolic relationship between picrotoxinin concentration and rCBF of the form
we estimated the values of maximal rCBF and Kdapp picrotoxinin and compared the latter with the known value.
Glutamate analysis
During microdialysis, outflow samples (averaging 20 min/sample) were collected on ice and then frozen in liquid nitrogen and stored at −80°C. Glutamate levels were measured with an amino acid analyzer equipped to detect o-phthalaldehyde-derivatized amino acids fluorometrically (Model 6300, Beckman Instruments, Palo Alto, CA, U.S.A.). Aliquots of dialysate were combined with an internal standard, glucosaminic acid and sulfosalicylic acid (Sigma), vortexed, and then centrifuged at 16,000g for 10 minutes. Supernatants were filtered using 0.45-μm Micro-filterfuge tubes (Rainin Instruments, Woburn, MA, U.S.A.) to remove particulates before injection into the analyzer. Amino acid peaks were identified and integrated using an HP3365 Series II Chemstation (Hewlett Packard Corp., Wilmington, DE, U.S.A.). Glutamate concentrations in the samples were calculated correcting for recovery of the internal standard.
RESULTS
Nonmetallic microdialysis probes were stereotactically implanted in the parietal cortex of four male Sprague-Dawley rats. Brain rCBF was measured by fMRI using spin-labeling of arterial water (Detre et al., 1992; Williams et al., 1992; Edelman et al., 1994; Kim, 1995; Silva et al., 1995). We performed several temporal sequences of infusion of picrotoxinin. For all infusion protocols baseline rCBF maps with ACSF running through the probe were obtained before switching on the picrotoxinin. In the first two rats, we infused picrotoxinin for 60 minutes. As shown in Fig. 1, a large increase in rCBF was readily detected in a radially symmetric manner around the probe tip. In the third rat, to monitor stability of rCBF response, we infused picrotoxinin for 110 minutes. Finally, in the fourth rat (to test repeatability), we ran an Off-On-Off-On sequence that had picrotoxinin on for 30 minutes, off for 50 minutes, and back on for 60 minutes. These results are shown in Fig. 2, demonstrating that rCBF returns to baseline after cessation of picrotoxinin infusion and that activation recurs on repeat stimulation. The length of time picrotoxinin was infused did not affect hemodynamic responses.
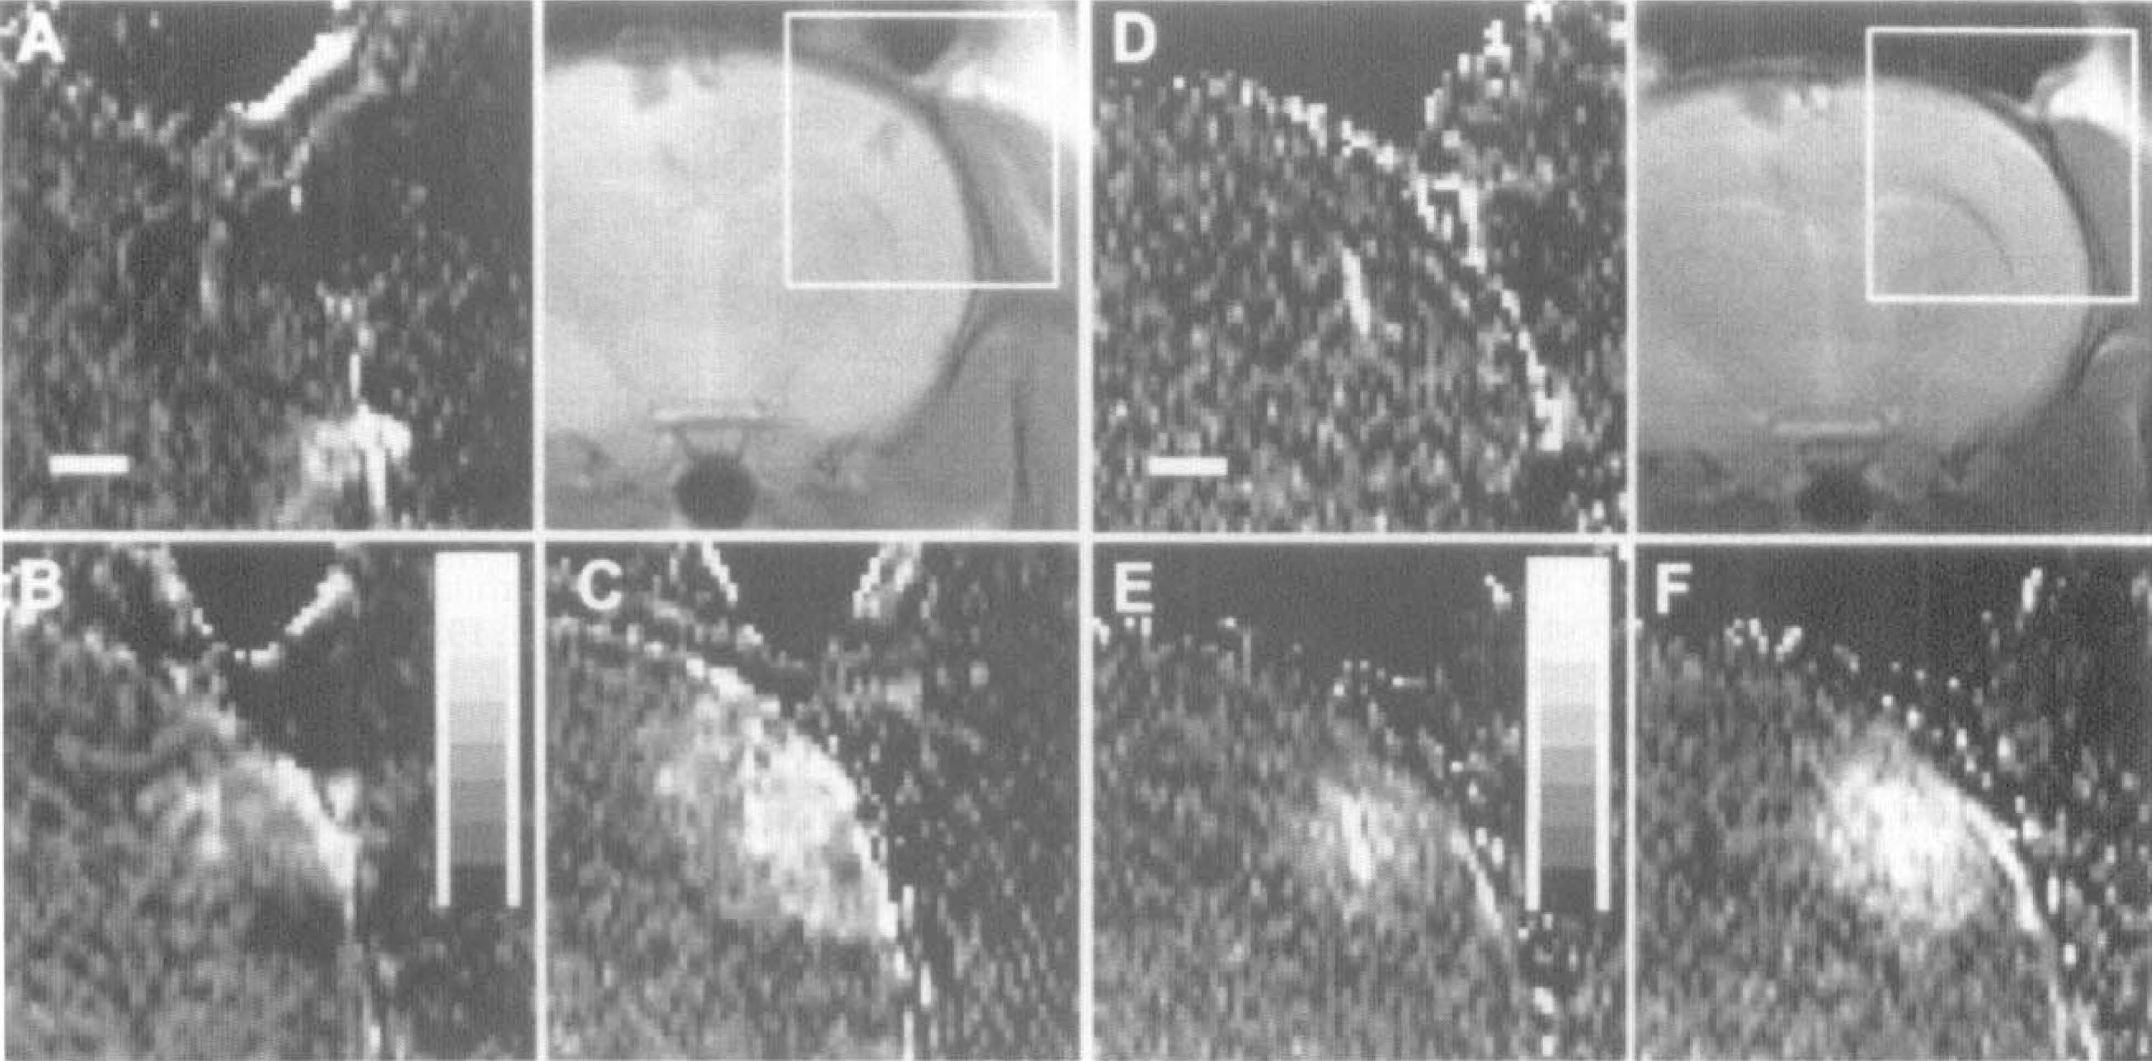
Time course of local regional cerebral blood flow (rCBF) increases after local γ-aminobutyric acid (GABA) inhibition. Panels
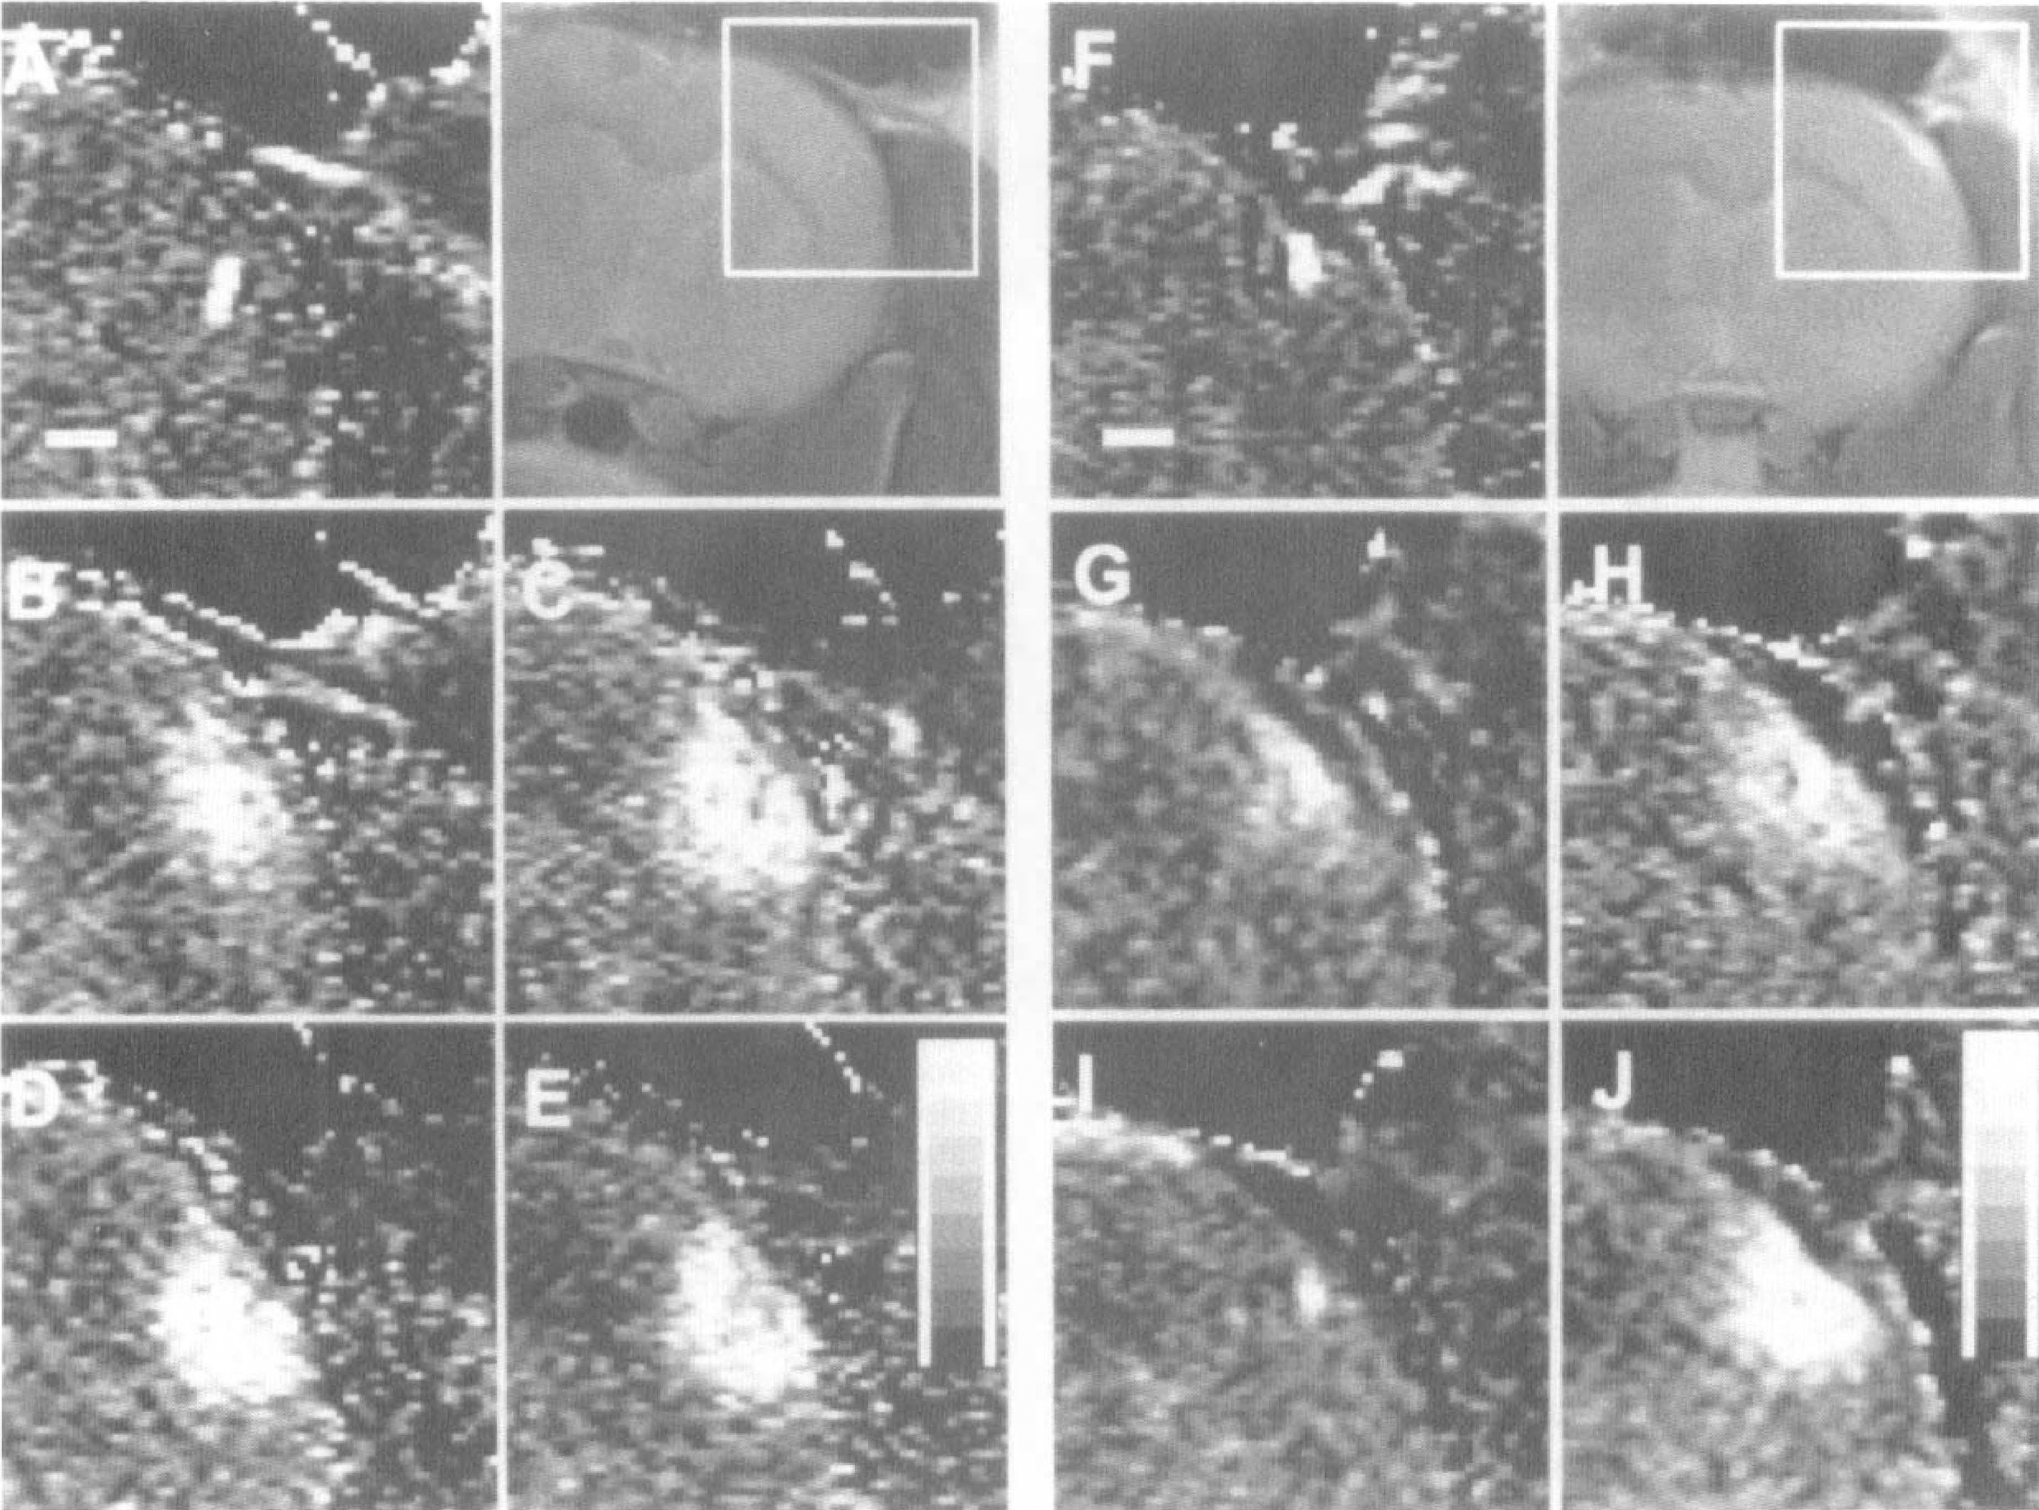
Time course of local rCBF follows temporal profile of GABAergic inhibition. Panels
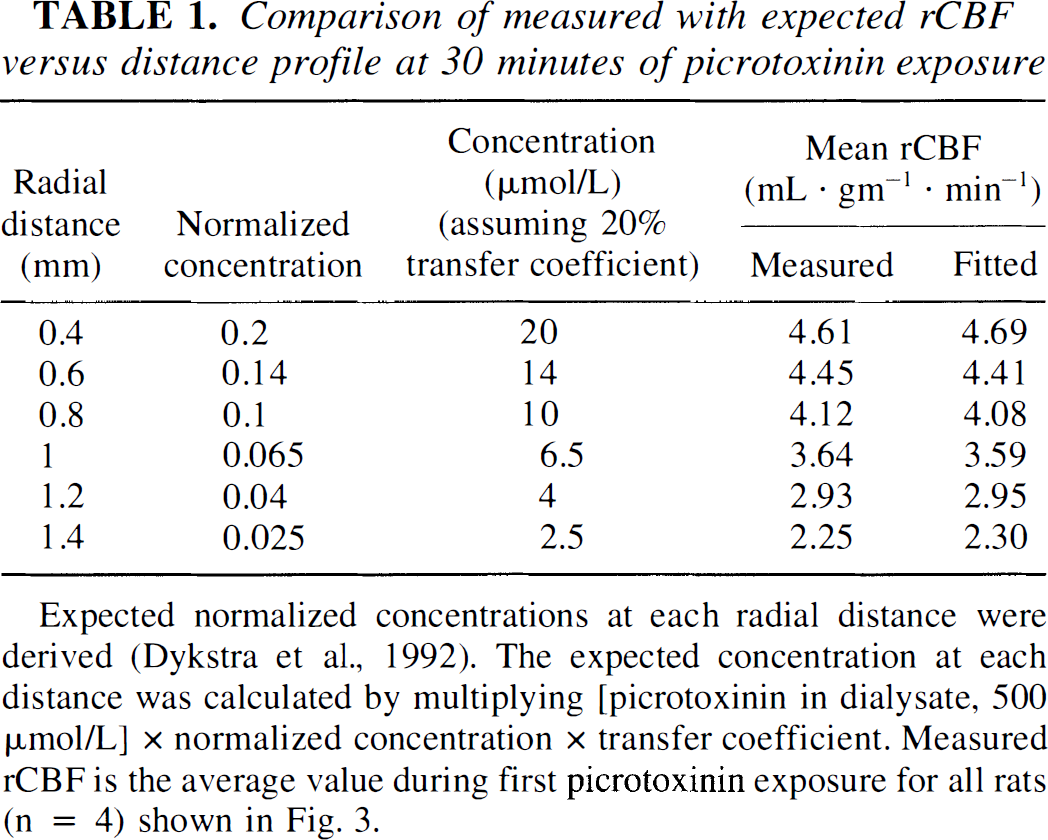
Fig. 3 shows that, as expected, rCBF declines with radial distance from the probe tip. By 54 minutes after switching to picrotoxinin-ACSF (or approximately 30 minutes after arrival of picrotoxinin at the probe tip), increases in rCBF are measurable at least 1.5 mm radially from the probe tip. Table 1 presents the derived picrotoxinin concentration versus distance profile (Dykstra et al., 1992) and a comparison of the experimentally measured mean rCBF versus distance data and the mean rCBF that was fitted using parameter estimates for maximal rCBF (5.5 ± 1.4 mL·g−1·min−1) and the Kdapp picrotoxinin (3.5 ± 2.9 μmol/L). There is close agreement between the measured and the fitted mean rCBF data. The derived Kdapp obtained from the model agrees well with the direct membrane-binding techniques used by Ticku et al. (1978) that measured the Kd for picrotoxinin as 1 to 2 μmol/L.
Comparison of measured with expected rCBF versus distance profile at 30 minutes of picrotoxinin exposure
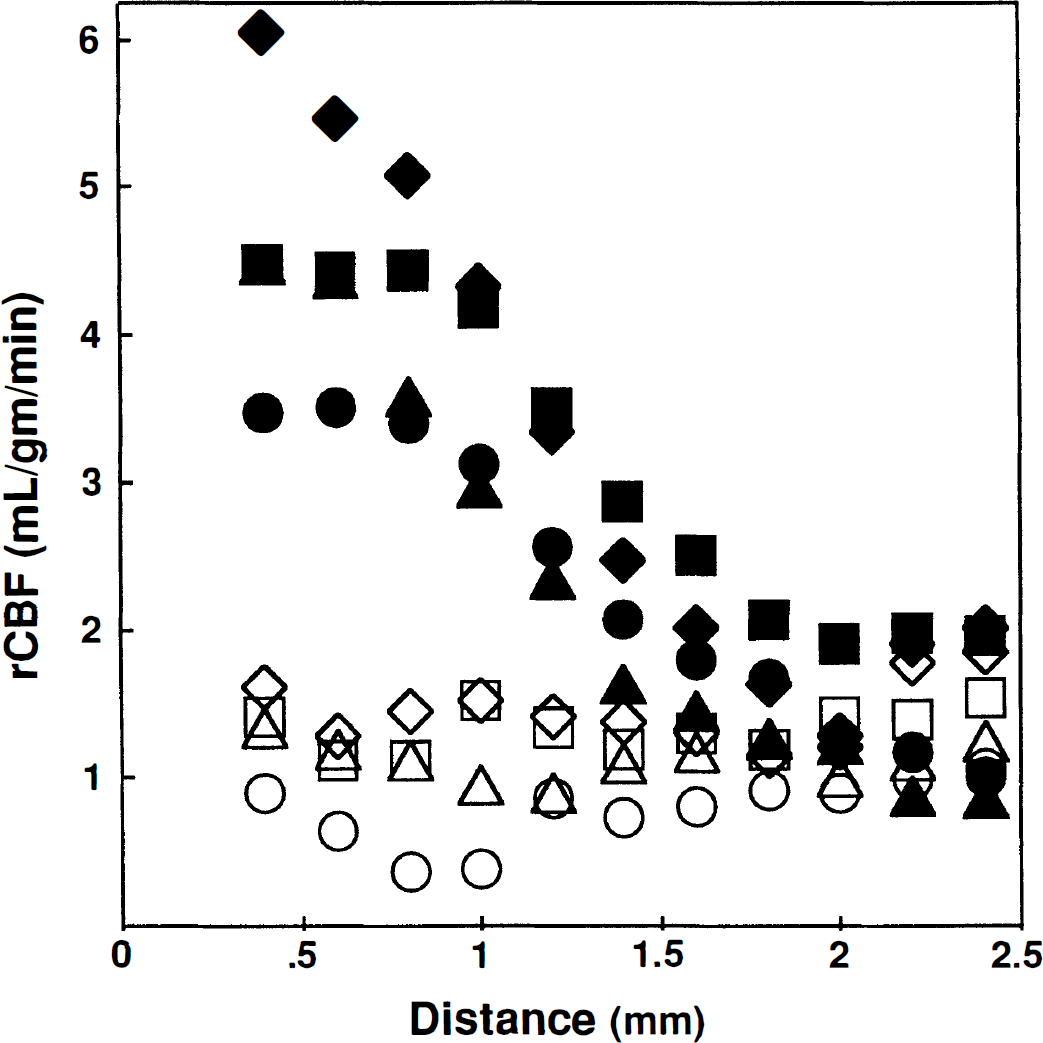
Profile of rCBF versus distance. Open symbols indicate baseline values and closed symbols show values at 54 minutes after picrotoxinin infusion. Symbols are circle, Rat 1; triangle, Rat 2; square, Rat 3; diamond, Rat 4. Measurements of rCBF at distances less than 0.35 mm from probe tip are excluded because of partial volume effects with the probe tip.
Fig. 4 shows a plot of glutamate concentration in the microdialysate versus the rCBF measured at the corresponding time. The Pearson product-moment correlation between rCBF and interstitial glutamate concentration was 0.83 (n = 12, P < 0.001) for time points with 30 minutes or less exposure to picrotoxinin (dark circles in Fig. 4). For picrotoxinin exposures longer than 30 minutes there was a correlation of 0.54 (n = 9, P < 0.14). The slopes of the linear regressions are quite similar, suggesting that the relationship between glutamate release and rCBF is consistent throughout the experiment, although prolonged picrotoxinin exposure does appear to alter the zero glutamate versus rCBF intercept.
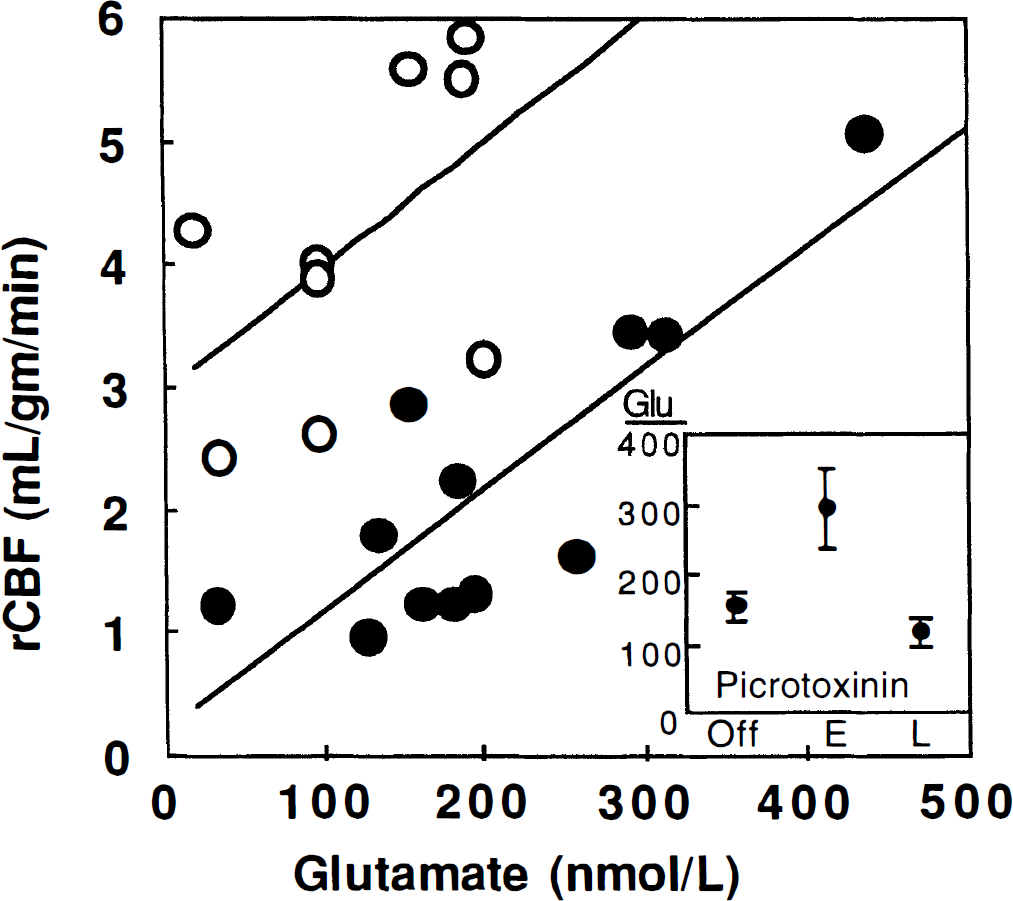
Correlation of brain rCBF with glutamate release. Closed circles represent all points measured after less than 30 minutes' exposure to picrotoxinin. Open circles represent longer exposures. The lines represent respective linear least squares regressions. Each point represents the average rCBF in the region surrounding the probe tip (from 0.35 to 1.0 mm, radial distance). Inset shows mean (± SE) levels of glutamate release for samples with no (Off), less than 30 minutes (E), and more than 30 minutes (L) of picrotoxinin exposure. Glutamate levels in dialysate are uncorrected for recovery.
DISCUSSION
The present work makes three important contributions. First, we have demonstrated that combined microdialysis and fMRI enables detection of functional response to a locally applied neurochemical stimulus. These results open the possibility of detailed mapping of rCBF response to a wide range of neurochemical and pharmacologic agents. Our finding of a robust rCBF increase in response to picrotoxinin supports a major local role for neural inhibitory influences on cerebral blood flow as has previously been seen with systemic application of other GABA antagonists such as bicuculline (Williams et al., 1993). In contrast, Akgören et al. (1996) reported that picrotoxinin did not modify the rCBF increase induced by direct, electrical stimulation of brain matter. Whether this difference reflects the different sites of activation employed (parietal versus cerebellar cortex) (Akgören et al., 1996), the type of stimulus applied (drug versus electricity), or some other difference between the studies is presently unknown.
Second, we have shown the value of high-resolution, spatial measures of rCBF using fMRI. Based on a simple model relating picrotoxinin concentration to rCBF, the quantitative relationship between rCBF as a function of distance from the microdialysis probe allows an excellent estimate of the Kdapp for picrotoxinin binding to receptor. It should be noted that the accuracy of Kdapp estimates is dependent on the accuracy of the transfer coefficient determination. Because we had no assay for picrotoxinin concentration, we were unable to determine the transfer coefficient directly. The 20% transfer coefficient used in our calculation was an upper limit estimate based on published molecular weight versus transfer coefficient data (Kendrick, 1989) and interpolating to picrotoxinin's molecular weight. We did however directly determine the transfer coefficient for glutamate in our microdialysis system (e.g., 16%). Given that glutamate has a slightly lower molecular weight than picrotoxinin, it would be expected to have a slightly larger transfer coefficient. Using a transfer coefficient estimate of 15% leads to a Kdapp estimate for picrotoxinin binding of 2.8 μmol/L (in even closer agreement to published values). Thus, this procedure may be useful for determining Kdapp with other compounds.
We also attempted to use spatial rCBF information to determine whether nitric oxide (NO) production could be involved in the rCBF response in this system (as has been suggested in other work using local application of bicuculline; Pereira de Vasconcelos et al., 1995). Models of diffusional spread suggest that NO should spread rapidly (< 10 seconds) for distances up to 0.5 mm from its source (Wood and Garthwaite, 1994) whereas the diffusional propagation of picrotoxinin would be expected to be much slower. Thus, if NO were contributing to the blood flow response then we could potentially detect blood flow changes at distances farther from the probe than would be expected by simple diffusion of picrotoxinin. We did not detect any discrepancy between the extent of rCBF changes and the expected diffusion for picrotoxinin. However, with the 5 minutes (per scan interval) of temporal resolution in this experiment, an early discrepancy might not be detected. Future experiments including earlier measures, as well as NO synthesis inducers and inhibitors, should clarify these issues.
Finally, quantitative comparison of rCBF changes and glutamate levels was made to begin to determine the relationship between fMRI responses and neurotransmitter levels. The results indicate that this relationship is complex. During the early phase of the rCBF response to picrotoxinin, rCBF and glutamate release are both highly correlated and indicate an extrapolated rCBF of zero at zero glutamate levels. These data suggest that the picrotoxinin-induced rCBF increase is tightly coupled to increased neural activity as reflected by increased extracellular glutamate levels. After a longer period of picrotoxinin infusion, the relation between rCBF and glutamate level changes such that the y-intercept of the line relating rCBF to extracellular glutamate increases, whereas the slope is unmodified (i.e., rCBF, but not extracellular glutamate, remains elevated on prolonged exposure of the tissue to the drug; see Fig. 4). It should be emphasized that our separation of data into short and long picrotoxinin exposure times was made post hoc, and definitive inferences must await further experiments. However, our data for longer exposures, in which high rCBF is maintained in the face of declining glutamate levels, suggests that multiple factors modulate the relation between neural excitatory activity and rCBF. We rule out time per se as a factor by noting that after cessation of picrotoxinin stimulation, rCBF returns to baseline regardless of duration of exposure. Possibly the uncoupling indicates that the releasable pool of glutamate in local neurons is becoming depleted, the affected glutamate neurons have become refractory to the pharmacologic stimulus, or later in the picrotoxinin exposure period, the increase in rCBF is being driven by other endogenous stimuli. Some support for the last possibility is provided by the recent observation that picrotoxinin-induced seizures can occur in the absence of increased glutamate release (Obrenovitch et al., 1996). Future studies will hopefully allow us to distinguish among these and other possibilities.
Combining microdialysis with fMRI is a significant advance compared with either autoradiographic techniques that allow measurement of rCBF at only one time point and require killing the animal, or optical techniques that are limited to the outer 0.5 mm of exposed brain. Although not used here, multislice or three-dimensional rCBF fMRI at high spatial and temporal resolution can be performed (Silva et al., 1995) and will enable the global effects of regional stimulation to be examined. This should allow identification of distributed systems of brain activity through temporal correlations in their patterns of activity (Friston et al., 1993). One caveat applicable to this method is that when the input stimuli are not local (i.e., either cognitive, sensory, or systemic pharmacologic challenge), then the resulting correlations may merely reflect multiple sites of input rather than inter-connectivity. Combining fMRI with microdialysis should avoid this limitation by localizing the neurochemical stimulus. Thus, combined microdialysis and fMRI is an important addition to the methods available for functional brain mapping and understanding underlying mechanisms of brain function.
Footnotes
Acknowledgements
The authors thank Maryann Butowicz, Alan Sved, Daniel van Kammen, Alan Palmer, Mark Austin, Sharon Silk, and Don Williams for advice and assistance.