
Abstract
Optical intrinsic signal imaging(OIS) was used to investigate physiologic interactions between spatially and functionally distinct cortical somatosensory systems. The OIS response magnitude was evaluated after simultaneous stimulation of single whiskers and forelimb digits. Whisker C1 was deflected at a frequency of 10 Hz for 2 seconds while low- or high-intensity vibratory stimuli were applied to forelimb digits. The OIS responses to simultaneous whisker and forelimb stimulation were compared with lone whisker stimulated controls. Overall, addition of a second stimulus caused decreases in barrel cortex response magnitude. Three different response patterns were detected within individual trial sets. Modulation of barrel cortex evoked potentials provided evidence that changes in OIS responses observed here may be partially influenced by vascular responses to changes in neuronal activity. However, OIS responses in the barrel region during lone forelimb stimulation that were unaccompanied by evoked potentials suggested the possibility of independent vascular dynamic influences on response modulation. This study demonstrates that cortical responses at the level of primary sensory processing may be significantly influenced by activity in adjacent regions. Furthermore, it reveals that vascular and neuronal characteristics of interregional modulation do not co-localize and may produce responses in which one component increases while the other decreases.
Perception of a stimulus often is influenced not only by individual stimulus parameters but also by the context in which the stimulus is presented. The brain may produce this effect by modulating cortical input. Vascular response modulation has been demonstrated in cortical sensory systems of several species. For example, optical intrinsic signal imaging (OIS) has been used to demonstrate modulation of vascular and metabolic response magnitude in somatosensory cortex (SI) of rodents by varying the number of whisker deflections (Blood et al., 1995), whereas vascular responses (positron emission tomography) in humans have been modulated by attentional state during somatosensory stimulation (Roland, 1981; Drevets et al., 1995). However, the exact relation between vascular modulation and the underlying neuronal activity is not well understood. Although other studies in the rat and monkey demonstrate modulation of neuronal activity (Simons, 1978; MacGillis et al., 1983; Simons, 1983; Simons, 1985; Sato, 1989; Miller et al., 1993), it is not known to what extent modulation of vascular activity indicates similar modulation of neuronal activity. Characterizing this relation is critical for interpretation of data from techniques such as positron emission tomography and functional magnetic resonance imaging.
Uncoupling between vascular and metabolic activity has been previously demonstrated (Fox and Raichle, 1986). Vascular and electrophysiologic activity also may be uncoupled. Vascular “overspill” is a potential mechanism for this uncoupling (Cannestra et al., 1996). Overspill describes the spreading of a physiologic response beyond a given spatial or functional region, which in this case is the spreading of vascular responses outside of the spatial boundaries of neuronal activity. In the current study, we use OIS to demonstrate that vascular overspill may occur between functional regions as well as locally.
Optical intrinsic signal imaging is a technique that can be used for functional mapping of cerebral cortex by allowing concurrent imaging of broad cortical regions with high spatial and temporal resolution. Experiments suggest that intrinsic signals are produced by a combination of changes in hemoglobin levels, oxidation of chromophores such as cytochrome oxidase, and light scattering caused by altered blood volume, blood flow, vascular morphologic features, or cell swelling in response to neural activity (Frostig et al., 1990; Grinvald, 1992; Haglund et al., 1994; Narayan et al., 1994; Malonek and Grinvald, 1995; Narayan et al., 1995; Holthoff and Witte, 1996).
Filtering OIS images at different wavelengths emphasizes detection of signals associated with different physiologic processes (Frostig et al., 1990; Grinvald, 1992; Haglund et al., 1994; Narayan et al., 1994; Malonek and Grinvald., 1995; Narayan et al., 1995; Holthoff and Witte, 1996). The current study uses an 850-nm filter, which detects intrinsic signals primarily from light scattering. Although cell swelling may contribute to responses at this wavelength, the signal is presumed to be largely vascular, since light scattering is caused primarily by vascular dynamics and because a large portion of the OIS signal is located over vessels. The time course of OIS responses also is similar to other measurements of vascular activity, such as blood volume as measured by vascular dyes (Narayan et al., 1995). Reflectance changes at 850 nm are unlikely to result from changes in oxyhemoglobin or deoxyhemoglobin concentrations or oxidation of chromophores, since these processes are detected in the 600-nm, not the 800-nm, range.
The experimental models used in this study are rodent barrel and forelimb primary SI. Electrophysiologic properties of rodent SI neurons have been well studied (Simons, 1978), making this an appropriate system for investigating more complex functional cortical mechanisms. Neuroanatomical tracer studies show that indirect connections exist between barrel and forelimb cortex (Chapin et al., 1987), providing potential mechanisms for neuronal interactions between functional regions.
The architecture of rodent SI vasculature suggests a substrate for interregional vascular modulation distinct from neuronal modulation. Rodent SI is perfused by branches of the middle cerebral artery (MCA), which arise from a single parent vessel located in the most lateral portion of SI (Cox et al., 1993). Somatotopic representation of the rat's 25 primary vibrissae coincides with a posterolateral branch of the MCA in a region of SI referred to as barrel cortex, whereas SI representation of rodent forelimb is located at an anteromedial branch of the MCA. Thus, barrel and forelimb SI regions are perfused by connected vessels, potentially promoting vascular interactions between regions.
Previous studies have explored the effects of vascular or neuronal modulation primarily within discrete visual or somatosensory regions (e.g., area V4, barrel cortex). The current study uses OIS and electrophysiologic methods to investigate whether simultaneous stimulation of whisker and forelimb produces vascular and neuronal interactions between two distinct somatosensory regions: barrel and forelimb SI. The OIS and electrophysiologic measurements are compared within subjects. Results provide evidence for both neuronal and vascular modulation in response to simultaneous stimulation, but modulation of these two physiologic measurements differs substantially. Preliminary results from these experiments have been presented previously (Blood and Toga, 1995).
MATERIALS AND METHODS
Animal preparation
Fifteen adult male Sprague-Dawley rats(Charles River Laboratories, San Diego, CA, U.S.A.) weighing between 200 and 350 g were used for optical imaging experiments. Subjects were initially anesthetized with halothane and the right femoral vein cannulated with PE-50 tubing for urethane anesthesia administration. Subjects then were placed in a stereotaxic frame, a midline scalp incision was made, and the right temporalis muscle was retracted, exposing the region of skull overlying the SI. The skull was thinned over this region to approximately 250 μm so that branches of the MCA and the superior cerebral vein were visible. Silicone oil was applied to increase translucency of the bone over the SI. Subjects were constantly monitored for anesthetic state during both surgery and imaging; appropriate amounts of urethane were administered to maintain anesthesia but still allow withdrawal from toe pinch. Urethane dosage was 150 mg/kg for the initial administration, plus an average additional 500 mg/kg over the remainder of the experiment. There was some variation in the additional dosage caused by differences in anesthetic sensitivity between subjects. Animal and experimental protocols were approved by the Animal Research Committee of the University of California, Los Angeles.
Imaging procedure and experimental protocol
Imaging procedures were similar to previously performed experiments (Narayan et al., 1994; Blood et al., 1995). Anesthetized rats were placed, still in the stereotaxic frame, under a charge-coupled device camera (Princeton Instruments, Trenton, NJ, U.S.A.) and secured in place so that cortical vessels were visible through the skull on a computer screen display of the camera's field of view. The cortex was illuminated with voltage-stabilized white light, and images were filtered at 850 nm. Images were collected and digitized on a personal computer and analyzed on personal and Macintosh computers. Camera exposure time for each image was 200 milliseconds. Camera spatial resolution was 36 μm per pixel.
Stimuli consisted of single whisker deflections, forelimb digit vibration, or both. Left whisker C1 was mechanically deflected at a 30° angle(approximately 7.5-mm displacement) in an anterior-to-posterior direction, using a 3.81-cm tall motorized whisker nudger. Each deflection lasted 70 milliseconds. Forelimb was stimulated by placing the entire ventral surface of left forelimb digits 3 through 5 on the flat surface of a 2.54 × 1.27 cm vibrating piezoelectric device (see displacement later). Frequency, voltage, duration, and other stimulus parameters were controlled with a Grass stimulator (Model 888, Quincy, MA, U.S.A.). Within trials, whiskers and forelimbs were stimulated at a constant intensity. Whisker C1 was always deflected for 2 seconds at a frequency of 10 Hz with the whisker nudger driven at 8 V. The duration of forelimb digit vibration also was always 2 seconds; however, between trials, two different forelimb stimulus intensities were used to examine whether simultaneous stimulation intensity influenced response interactions. The piezoelectric device was driven at one of two frequency-voltage combinations:(1) 40 Hz, 50 V (low intensity forelimb stimulus), or (2) 80 Hz, 150 V (high intensity forelimb stimulus). The vertical displacement of the piezoelectric device was 0.022 mm during 40 Hz/50 V stimulation and 0.09 mm during 80 Hz/150 V stimulation. Notice that voltage indicates the relative intensity at which whisker and forelimb stimulus motors were driven, rather than an actual stimulus voltage delivered to subjects. Whisker and forelimb stimuli were innocuous and of physiologic strength, similar to that which subjects might encounter in their natural environment.
During simultaneous stimulation trials, whisker and forelimb were stimulated simultaneously. Stimulated control trials were obtained in response to lone whisker or forelimb stimulation. Control whisker trials were obtained using 2-second, 10-Hz stimulation. Control forelimb trials were obtained using 2-second, high-intensity forelimb stimulus parameters(80 Hz, 150 V). Unstimulated control images were obtained before stimulus onset in each subtrial.
Data were collected in groups of six subtrials which, when averaged across time epochs (to increase signal-to-noise ratio), comprised one trial. During each subtrial, images were collected at 750-millisecond intervals before, during, and after stimulus presentation. There were 30-second intervals between all subtrials to allow cortical activity to return to baseline. Trials were acquired in groups of four, comprising one trial set: (1) whisker stimulation alone; (2) simultaneous whisker and low-intensity forelimb stimulation (low intensity simultaneous stimulation);(3) simultaneous whisker and high-intensity forelimb stimulation (high-intensity simultaneous stimulation); and (4) high-intensity forelimb stimulation). Trials were collected within a time period less than 1 hour to minimize variations in anesthetic level. Presentation order within a trial set was randomized to ensure that there were no ordering effects.
In three additional subjects, lone forelimb stimulation only was applied to examine whether there were any “conditioning” effects of simultaneous whisker and forelimb stimulation on barrel cortex responses.
Data analysis
Data analysis was performed using methods similar to those previously described (Narayan et al., 1994; Blood et al., 1995). Ratio images were calculated by subtracting averaged unstimulated control images from averaged stimulated images and dividing the difference image by averaged unstimulated control images. Magnitude of OIS responses was determined within regions of interest (ROI). In the current study, there were two spatially distinct responses during simultaneous stimulation trials: one in barrel cortex, and one in forelimb cortex. In the current study, only barrel cortex responses were analyzed. To identify barrel cortex ROI independently of forelimb responses, images were divided between anteromedial and posterolateral branches of the MCA, which overlie forelimb SI and barrel cortex, respectively. This division also clearly separates barrel and forelimb somatosensory regions, as defined by stereotaxic coordinates (Chapin and Lin, 1984). Divisions were identified on raw images for each subject, and ROI were defined for the barrel region in each analyzed image. The same division was used for all trials, including controls, in a given subject.
Peak barrel cortex response magnitude was determined for each trial. The ROI were generated for the ratio images within a trial that had the greatest mean pixel value within the barrel region (details in Blood et al., 1995). Data were smoothed using a Gaussian filter; a threshold then was reached at 1 SD above mean value of the entire region, generating a ROI. Magnitude was defined as average pixel intensity of ratio image data within the ROI.
Minimum magnitude required within a given region of interest to qualify as a “response” was defined as a 1.0 × 10⁻³ or greater reflectance decrease from unstimulated controls. This value was determined in relation to background noise levels. Barrel cortex response magnitude in the lone whisker stimulus condition was required to be above this minimum magnitude for a given trial set to be included in the study.
Response magnitude in barrel cortex was compared between the following three paradigms: lone whisker stimulation, low-intensity simultaneous stimulation, and high-intensity simultaneous stimulation. All individual data points from each stimulus paradigm were included in an overall data analysis. An analysis of variance (ANOVA) test was used to compare significance of interactions between all three whisker stimulation paradigms. Paired, two-tailed Student's t-tests were used to compare response magnitude between lone whisker versus low-intensity and lone whisker versus high-intensity simultaneous stimulation. Data points within each trial set were paired in this analysis for normalization of data between subjects. An unpaired, two-tailed t-test also was used to compare lone whisker stimulation with combined low- and high-intensity simultaneous stimulation conditions to examine the general effects of addition of a second stimulus.
After overall data analysis, barrel cortex response patterns were examined within individual trial sets of each subject. Individual data points were compared for significant differences between stimulus conditions, using paired, two-tailed Student's t-tests. Average response magnitude was calculated for each stimulus condition corresponding to a given type of response. Magnitude ratios then were computed between simultaneous stimulation and lone whisker control averages to normalize data within and between subjects.
Evoked potentials
Evoked potentials (EP) were measured in five OIS subjects during whisker C1 stimulation with or without simultaneous low- or high-intensity forelimb stimulation. The EP were chosen as the most appropriate comparative measurement of electrophysiologic activity in this study because both OIS and EP measure net cortical responses over broad regions rather than activity of individual neurons.
Portions of skull were removed over SI after optical imaging. Recordings were made from just below the surface of SI using SNEX-200 bipolar electrodes with 100-μm tip diameter (Rhodes Medical, Roanoke, VA, U.S.A.). Because bipolar electrodes measure the potential difference between the two electrodes, the spatial resolution of each EP measurement was 100μm. Electrodes were placed in stereotaxically defined coordinates corresponding to barrel C1 (Chapin and Lin, 1984). Additional measurements were made in a 3 × 3 grid at 1-mm intervals around the C1 barrel. This distance between measurements was chosen according to the dimensions of OIS responses (2 to 4 mm), since comparisons were made between OIS and EP responses.
Evoked potentials were measured with a model 7D polygraph (Grass Instruments). Trial sets were run as explained earlier, averaging 16 traces for each stimulus condition, using a Nicolet model 527 signal averager (Nicolet Instrument Corporation, Madison, WI, U.S.A.), and synchronizing trace acquisition with every second whisker stimulation (5 traces/second). This rate of trace acquisition also was used during lone forelimb stimulation. Each trace had a duration of 100 milliseconds within the temporal dimensions of neuronal activity, resulting in measurements over a 3.2-second time period, similar to the temporal dimensions of the OIS signal. These temporal dimensions also allowed detection of any delayed neuronal or glial activity. The EP response amplitude was compared between simultaneous stimulation and control trials, and responses then were compared between EP and OIS techniques.
RESULTS
Overall, OIS response magnitude in barrel cortex decreased significantly when a simultaneous forelimb stimulus was introduced. When relative magnitude changes in barrel cortex were compared within individual trial sets (one trial set = one low-intensity and one high-intensity simultaneous stimulation trial, plus whisker and forelimb control trials), three different types of responses were detected. Magnitude consistently changed in the same direction(increase or decrease) within a given trial set, but magnitude change in a given direction differed with forelimb stimulus intensity. The magnitude and direction of EP responses in barrel C1 also changed when simultaneous forelimb stimulation was added, but these changes differed from OIS response changes. The most significant difference was that OIS responses, but never EP, frequently occurred in the barrel region when only forelimb was stimulated.
Optical intrinsic signal response magnitude
Magnitude of peak OIS responses was measured as mean pixel value(reflectance decrease × 10−3) within statistically defined barrel ROI (see Materials and Methods). All responses were reflectance decreases; hence, an increase in response magnitude denoted a greater decrease in reflectance.
Overall responses. When all data were analyzed together, barrel cortex response magnitude decreased with the addition of a simultaneous forelimb stimulus (Fig. 1). Average response magnitude after lone whisker stimulation was 2.490 × 10⁻³ reflectance decrease from baseline (Table 1). Average OIS response magnitude after whisker stimulation plus low-intensity simultaneous stimulation was 1.799 × 10⁻³ reflectance decrease from baseline. Average response magnitude after whisker stimulation plus high-intensity simultaneous stimulation was 1.951 × 10⁻³ reflectance decrease from baseline. An ANOVA test demonstrated that there were significant interactions between all three response conditions (P < 0.05). Paired, two-tailed t-tests demonstrated significant changes in barrel cortex response magnitude between lone whisker stimulated controls and either low- or high-intensity simultaneous stimulation conditions (P < 0.05). An unpaired, two-tailed t-test demonstrated there was a significant response magnitude change between whisker stimulated controls and combined data from both simultaneous stimulation trials (P< 0.05). Changes were slightly greater with low-intensity than with high-intensity simultaneous stimulation, although this difference was not significant.
Mean percent reflectance change in barrel cortex for each stimulus condition
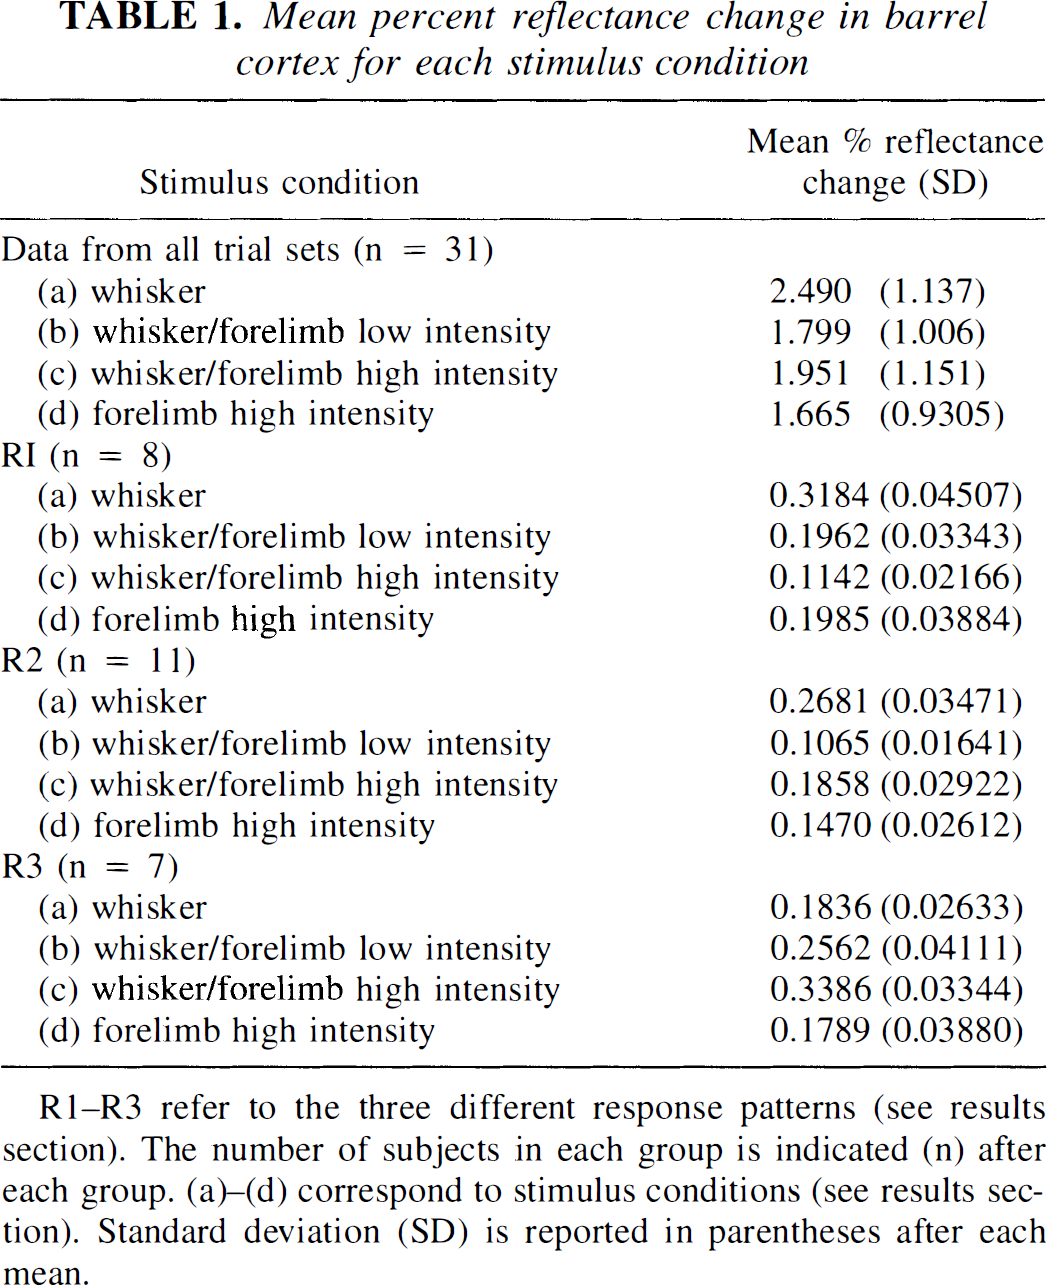
R1–R3 refer to the three different response patterns (see results section). The number of subjects in each group is indicated (n) after each group. (a)–(d) correspond to stimulus conditions (see results section). Standard deviation (SD) is reported in parentheses after each mean.
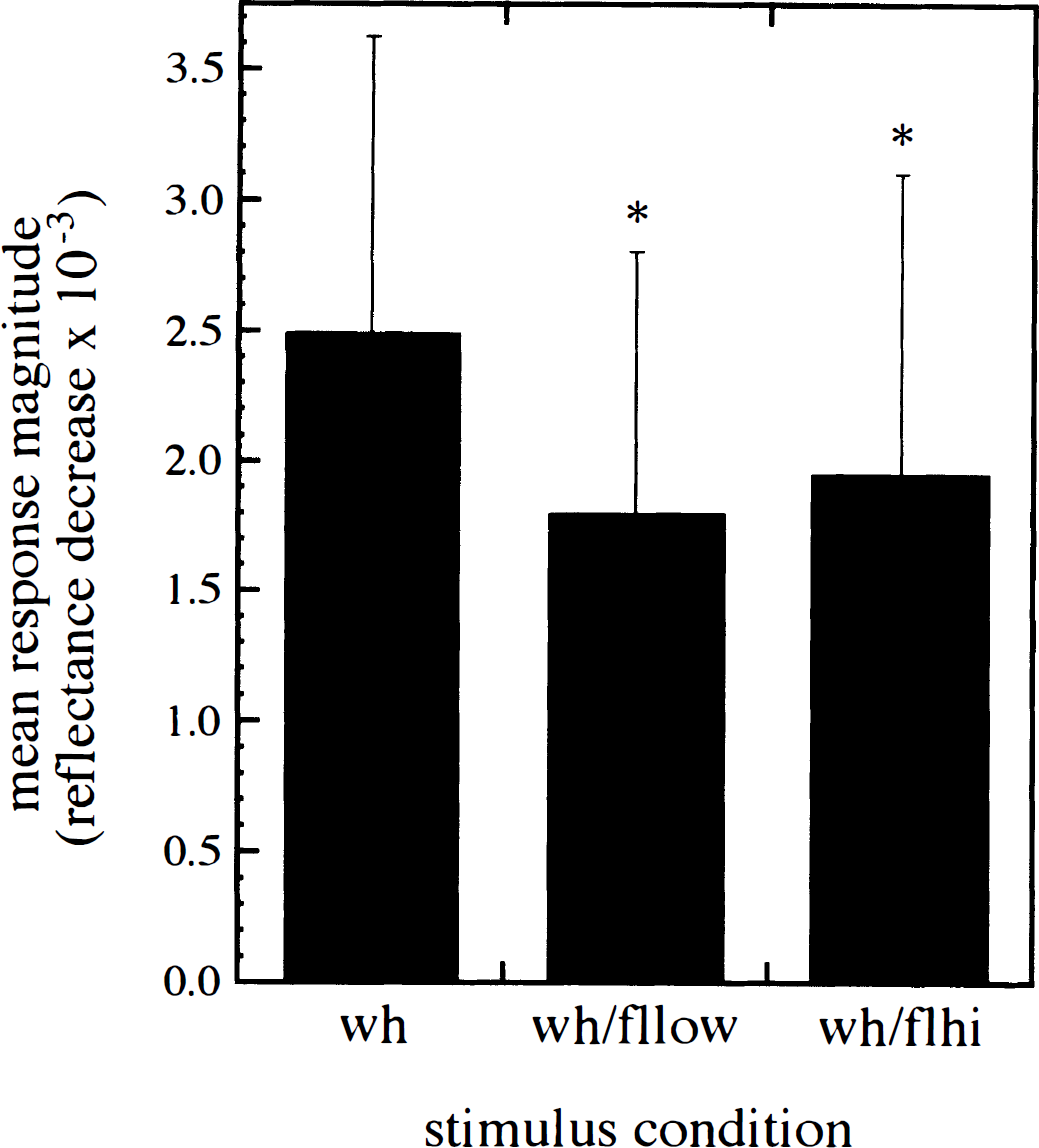
Mean barrel cortex response magnitude for each whisker stimulus condition when all data are analyzed together (n = 31 for each stimulus condition). Response magnitude is indicated by reflectance decrease × 10−3. An asterisk (*) indicates a significant difference in response magnitude from lone whisker stimulated controls (P < 0.05). wh, C1 whisker deflection(10 Hz, 8 V, 2 seconds); flow, low-intensity forelimb vibration (40 Hz, 50 V, 2 seconds); flhi, high-intensity forelimb vibration (80 Hz, 150 V, 2 seconds). Error bars indicate SD of each mean.
In addition to barrel cortex responses in lone whisker or simultaneous stimulation conditions, 71.0% of responses to lone forelimb stimulation also exhibited responses (1.0 × 10⁻³ or greater reflectance decrease) in barrel cortex. These responses were located primarily over and around a single posterolateral branch of the MCA and were more localized than OIS responses during whisker stimulation. To test whether barrel responses occurred because of some form of conditioning from pairing of barrel and forelimb stimulation, only lone forelimb stimulation was performed in three rats. Similar responses were found in barrel cortex during this protocol.
Responses within trial sets. To examine the effects of simultaneous stimulation in greater detail, responses were examined within individual trial sets. Within each trial set, direction (increase or decrease) of barrel cortex magnitude change was determined for each simultaneous stimulation condition relative to the lone whisker stimulus condition.
If response changes were caused solely by random variations in response magnitude, probability would predict that directions of change for low- and high-intensity conditions relative to the lone whisker condition would fall into 1 of 13 equally distributed patterns. This would include patterns resulting from same direction of magnitude change for each intensity, opposite directions of change for each intensity, change with only one intensity, and no change with either intensity. Furthermore, if changes were random, overall magnitude differences between stimulus conditions would not be statistically significant. Thus, trial set responses were categorized assuming a null hypothesis of distribution among these 13 possibilities. After categorization,t-tests were used to determine whether differences between stimulus conditions were significant within a given response pattern.
In 27 of 31 trial sets (87.1%), barrel region responses to low- and high-intensity simultaneous stimulation either both decreased or both increased (Figs. 2 and 3; Table 1) relative to lone whisker stimulation. Of the 13 possible response patterns, 26 of these 27 trial sets (83.9%) exhibited only three of these patterns (individual subjects sometimes exhibited more than one of these patterns):
Barrel response magnitude decreased with both simultaneous forelimb stimulus intensities. Decreases were greater with high-intensity simultaneous stimulation than with low-intensity simultaneous stimulation. Barrel response magnitude decreased with both simultaneous forelimb stimulus intensities. Decreases were greater with low-intensity than with high-intensity simultaneous stimulation. Barrel response magnitude increased with both simultaneous forelimb stimulus intensities. Increases were greater with high- than with low-intensity simultaneous stimulation.
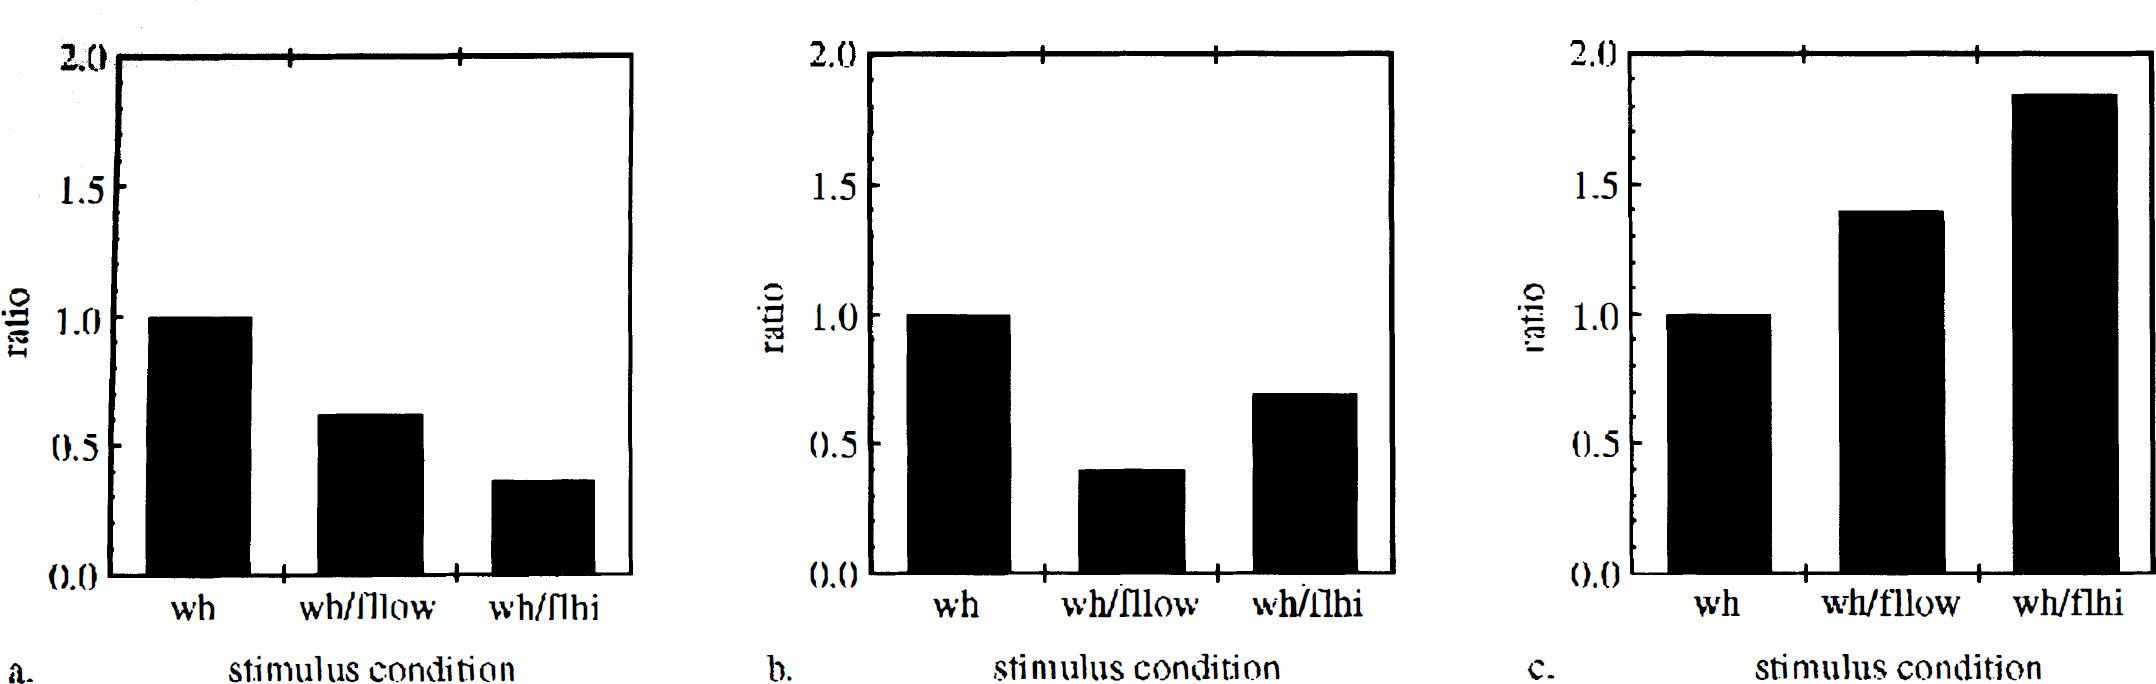
Barrel cortex response patterns to simultaneous stimulation when data were analyzed within trial sets. “Ratio” on the y axis denotes mean response magnitude for each stimulus condition divided by mean response magnitude for lone whisker stimulation.
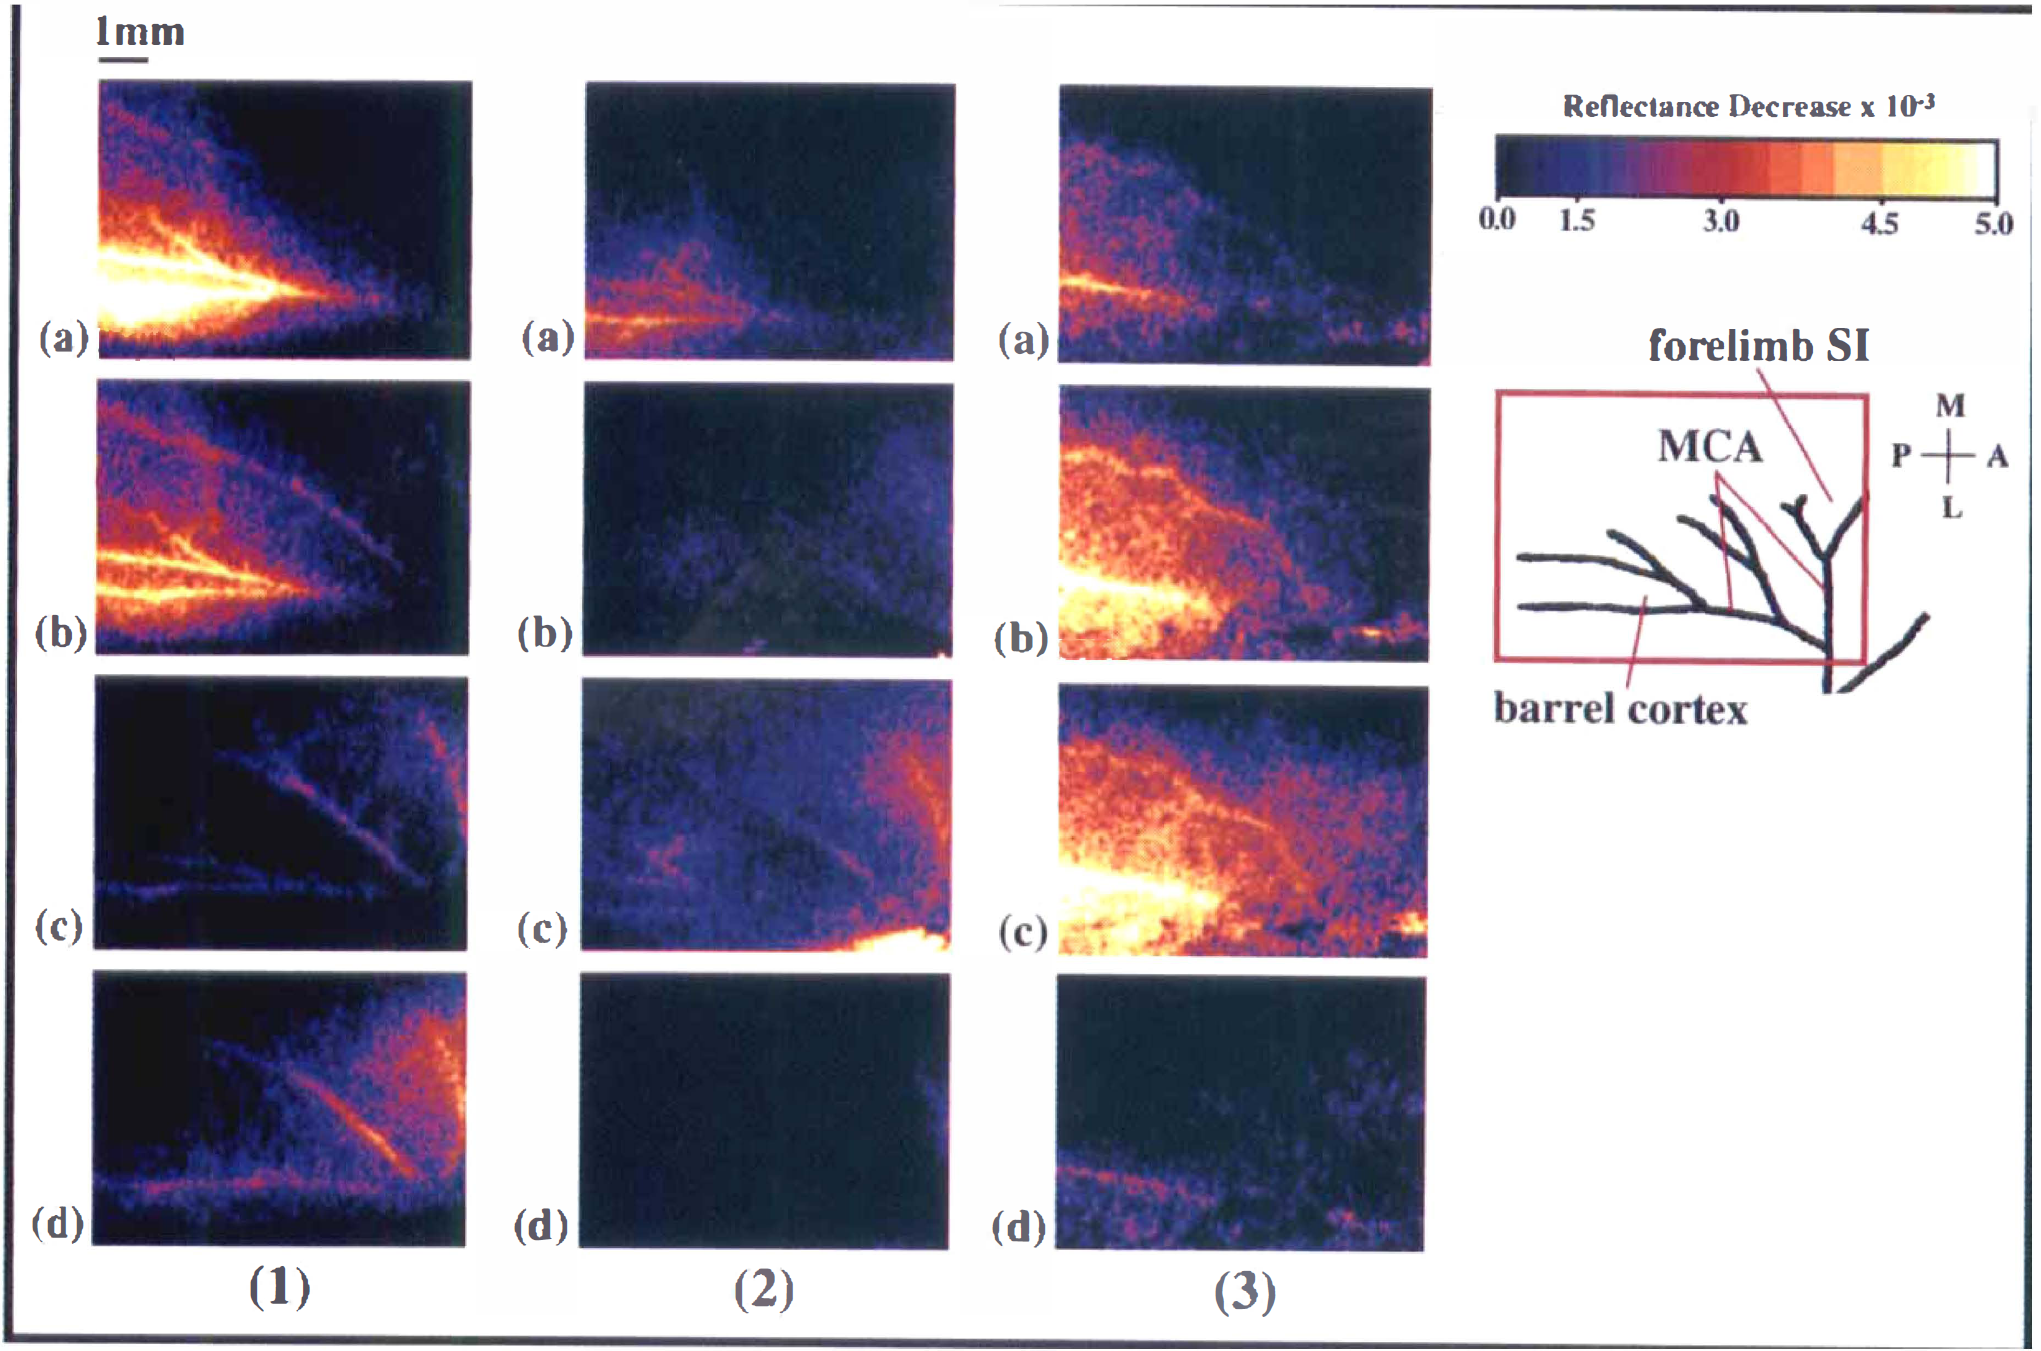
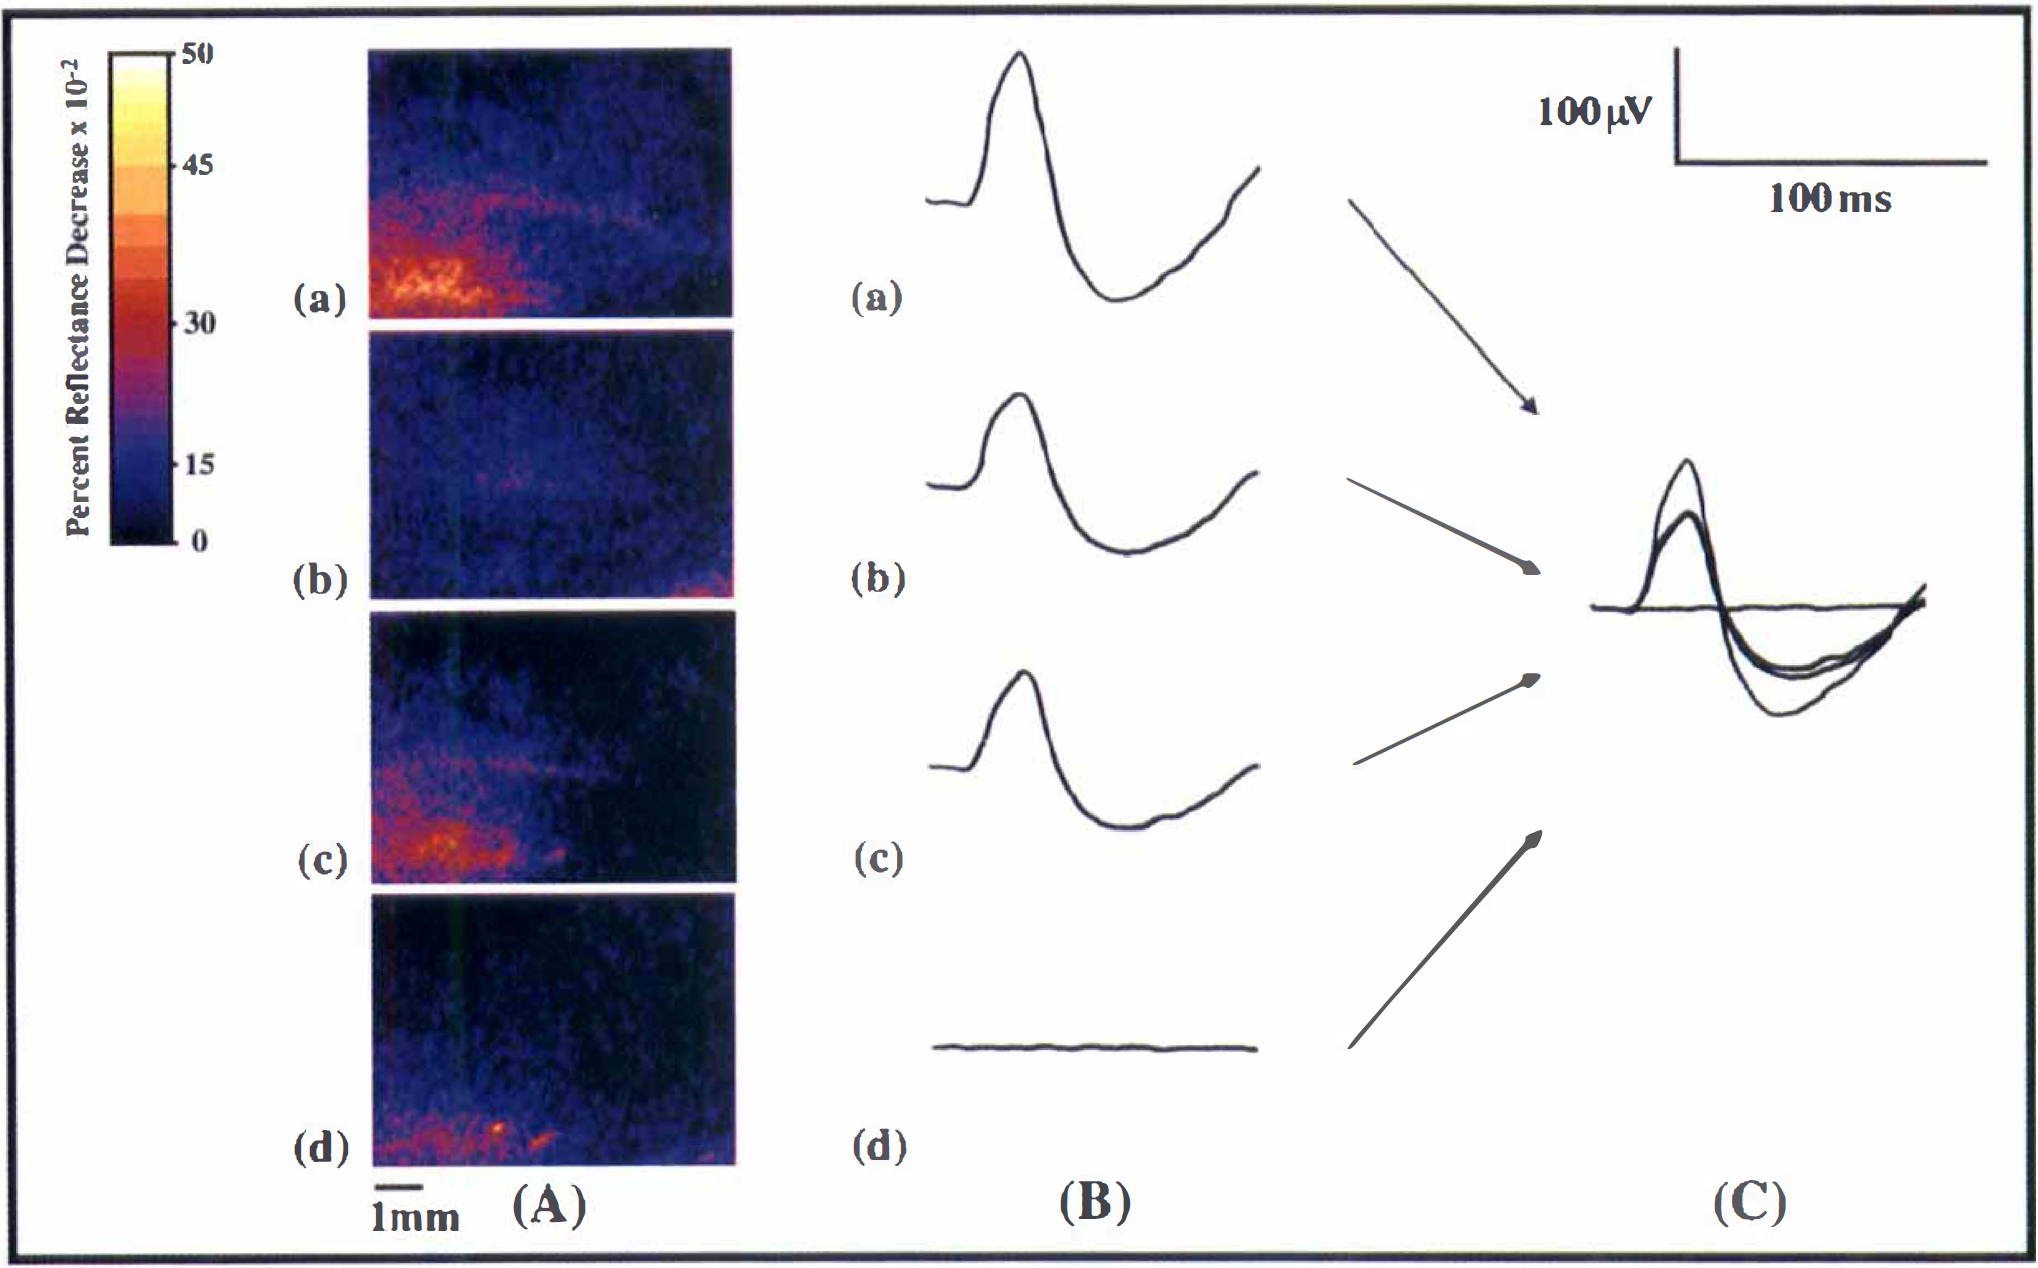
Examples of optical intrinsic signal imaging (OIS) responses in barrel and forelimb SI regions for each of the three response patterns. Each image depicts the peak response for a given trial. Each trial set shown is from a different subject; images for a given response pattern are from a single subject and trial set. (1) Barrel response magnitude decreased to a greater extent with addition of high-qintensity than with low-intensity forelimb stimulation. (2) Barrel response magnitude decreased to a greater extent with addition of low-intensity than with high-intensity forelimb stimulation. (3) Barrel response magnitude increased to a greater extent with addition of high-intensity than with low-intensity forelimb stimulation.
To normalize data within and between subjects, response ratios of simultaneous stimulation versus lone whisker stimulation were used to compare average magnitude between stimulus conditions. However, t-tests and ANOVA tests were computed using raw data values.
In eight cases (25.8% of all cases), barrel cortex responses decreased to a greater extent with high-intensity than with low-intensity simultaneous stimulation (Fig. 2). The response ratio of average low-intensity simultaneous stimulation to average lone whisker stimulation was 0.616. The response ratio of average high-intensity simultaneous stimulation to average lone whisker stimulation was 0.359. There were significant differences in response ratios between (a) whisker and (b) low-intensity(P < 0.05; paired two-tailed t-test), whisker and (c) high-intensity (P < 0.05; paired two-tailed t-test), and low- and high-intensity (P < 0.05; paired two-tailed t-test) stimulus conditions (Table 2).
In 11 cases (35.5% of all cases), barrel cortex responses decreased to a greater extent with low-intensity than with high-intensity simultaneous stimulation (Fig. 2). The response ratio of average low-intensity simultaneous stimulation to average lone whisker stimulation was 0.397. The response ratio of average high-intensity simultaneous stimulation to average lone whisker stimulation was 0.693. There were significant response ratio differences between (a) whisker and (b) low-intensity (P< 0.05; paired two-tailed t-test), whisker and (c) high-intensity(P < 0.05; paired two-tailed t-test), and low- and high-intensity(P < 0.05; paired two-tailed t-test) stimulus conditions (Table 2).
In seven cases (22.6% of all cases), barrel cortex responses increased with simultaneous forelimb stimulation; in all of these cases, increases were greater with high-intensity than with low-intensity simultaneous stimulation (Fig. 2). The response ratio of average low-intensity simultaneous stimulation to average lone whisker stimulation was 1.40. The response ratio of average high-intensity simultaneous stimulation to average lone whisker stimulation was 1.84. There were significant response ratio differences between (a) whisker and (b) low-intensity (P < 0.05; paired one-tailed t-test), whisker and (c) high-intensity (P < 0.05; paired two-tailed t-test), and low- and high-intensity (P < 0.05; paired two-tailed t-test) stimulus conditions (Table 2).
Statistical comparisons between stimulus conditions for barrel cortex OIS responses
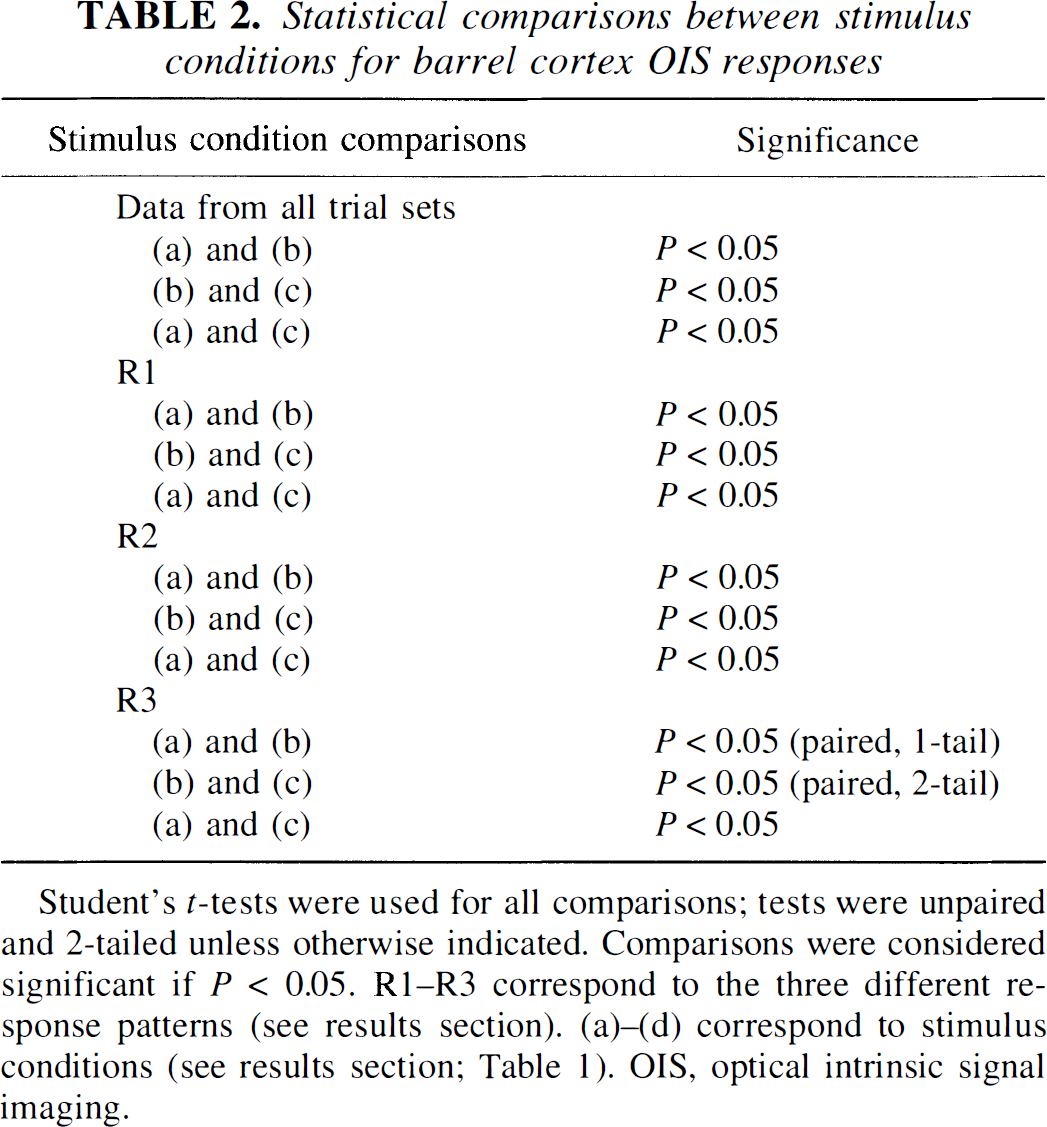
Student's t-tests were used for all comparisons; tests were unpaired and 2-tailed unless otherwise indicated. Comparisons were considered significant if P < 0.05. R1–R3 correspond to the three different response patterns (see results section). (a)–(d) correspond to stimulus conditions (see results section; Table 1). OIS, optical intrinsic signal imaging.
Only 5 of 31 cases (16.1%) displayed response patterns other than the three described earlier; none of the changes seen in these cases were statistically significant.
Electrophysiology
Because OIS measures activity over broad regions rather than individual neurons, EP were chosen as the most appropriate comparative measurement of electrical activity in this study. Similar to OIS responses, EP amplitude in barrel C1 changed with addition of a simultaneous forelimb stimulus (Fig. 3). Four of five subjects displayed decreased EP amplitude with both low- and high-intensity simultaneous stimulation, whereas one subject showed increased EP amplitude with simultaneous stimulation. Response amplitude was in the range of 50 to 150 μV, and the time course of responses was approximately a 100-millisecond duration, with an average latency of approximately 10 milliseconds. There was little EP activity in surrounding 3 × 3 grids; maximal response amplitude was always seen at the middle (C1) recording electrode, and rarely were EP of any significant amplitude seen in the other eight recordings surrounding C1. The EP responses were similar to those seen by Narayan and coworkers (1994). As previously demonstrated, OIS responses in barrel cortex were overlying barrel C1 and the surrounding EP recording locations (Narayan et al., 1994; Blood et al., 1995).
There were four marked differences between EP and OIS modulation. First, OIS responses spatially over-spilled EP activity. Second, EP amplitude change relative to controls did not differ with stimulus intensity of simultaneous forelimb stimulation as it did with OIS responses (Fig. 4C). Third, the direction of EP response change (decrease or increase) did not always match the direction of OIS response change in a given subject. Fourth, there was a complete absence of EP responses both in and around barrel C1 during lone forelimb stimulation, contrasting with the observation of OIS responses in 71.0% of lone forelimb stimulation trials (Figs. 3D and 4D).
Comparison of OIS
DISCUSSION
This study demonstrates vascular interactions between two functionally distinct primary somatosensory regions. Spatial and magnitude properties of interactions differed between OIS and EP responses. These findings are significant both because they demonstrate the ability of activity in one somatosensory region to influence activity in a second region and because of the apparent differences between vascular and neuronal responses. Knowledge of these relations may be important in interpretation of data from other imaging techniques using vascular measures as indicators of neuronal activity.
Overall, barrel cortex OIS responses decreased with addition of a simultaneous forelimb stimulus. Within most individual trial sets, barrel responses changed in the same direction, regardless of simultaneous stimulus intensity. Intensity of the simultaneous stimulus did, however, affect the amount of change in a given direction, producing three different response patterns. The EP in the barrel region also were affected by simultaneous forelimb stimulation, suggesting that changes in neuronal activity may contribute to modulation of OIS responses. However, OIS modulations differed from EP. Most remarkably, OIS responses often were seen in barrel cortex when only forelimb was stimulated. These responses were not accompanied by measurable EP in the barrel region, suggesting there are influences on OIS responses in addition to vascular responses to local neuronal activity. These influences most likely involve vascular dynamics that are distinct from vascular responses to local neuronal activity.
Evidence for vascular modulation between functional regions
Because of correspondence between neuronal and capillary architecture in rodent SI (Cox et al., 1993), changes in the largely vascular OIS response reflect changes in neuronal activity. However, additional factors may influence OIS responses and possibly contribute to discrepancies between EP and OIS responses seen in this study. For example, it is possible that OIS responses were influenced by vascular dynamics that were spatially discrete from neuronal activity (Cannestra et al., 1996). Detection of OIS responses in barrel cortex when only forelimb was stimulated provides direct evidence for discrete vascular dynamics. These dynamics also are consistent with hypotheses regarding mechanisms contributing to OIS response patterns (see later).
There were OIS responses, but a complete absence of EP responses, in the barrel region when only forelimb was stimulated. These responses were located primarily over and around a branch of the MCA, suggesting that these responses were of vascular origin. Even if responses were partially caused by cell swelling of vascular glia, this still would be in relation to vascular rather than electrical activity. It is also unlikely that this effect was caused by neuronal or vascular conditioning effects from pairing whisker and forelimb stimulation, since barrel responses to lone forelimb stimulation also occurred in rats whose whiskers were never stimulated in an experimental condition. These responses are consistent with a previous demonstration of MCA diameter changes in both barrel and hindlimb cortex after peripheral activation of only hindlimb cortex (Ngai et al., 1988). A breakdown of neurovascular co-localization raises the possibility that certain vascular dynamics can produce or alter OIS responses in a remote region without spatially underlying neuronal activity.
Vascular responses may be affected by vascular anatomical properties (Cannestra et al., 1996). Although portions of the vascular response co-localize with regions of neuronal activity (Cox et al., 1993; Narayan et al., 1994), the architecture and signaling of the vascular system may result in blood delivery to cortical regions, which are spatially distinct from areas of neuronal activity. Specifically, in addition to perfusion of local capillaries (Cox et al., 1993), blood delivered by upstream vessels may consequently increase flow to all subsequent downstream branches, including branches distant from the neuronally active region, resulting in an overspill of vascular activity to neuronally inactive regions. The term overspill is used to describe the spreading of activity beyond a given spatial or functional region. Notice that overspill does not refer simply to an increase or decrease in the OIS signal. Rather, it refers to a physiologic process, in this case, the spatial location of the vascular response relative to the location of the neuronal response. Overspill is consistent with both increased and electrophysiologically uncoupled OIS responses in barrel cortex. As a result of overspill, vascular responses originating within forelimb SI cortex (after lone forelimb stimulation) conceivably might have generated an OIS response over electrophysiologically inactive barrel cortex. Similarly, we hypothesize that overspill from the forelimb region may have increased an already existing OIS response over electrophysiologically active barrel cortex as seen, for example, when OIS responses increased with simultaneous addition of forelimb stimulation.
“Luxury perfusion,” the concept that blood is recruited to active cortical regions in excess of that needed for metabolic purposes (Fox and Raichle, 1986; Cold and Felding, 1993; Cannestra et al., 1996), also may promote vascular overspill and consequent OIS changes. The amount of overspill from a given region also may be influenced by the demand level of the active neurons in that region, since this may affect the amount of available luxury perfusion; greater vascular demand of neurons in a given region may result in less luxury perfusion available for overspill to another region. Conversely, a great enough neuronal vascular demand may actually increase luxury perfusion, thus increasing blood volume available for overspill.
Evidence for neuronal modulation between functional regions
Neuroanatomical tracer studies have shown that indirect connections exist between barrel and forelimb cortex (Chapin et al., 1987), suggesting a possible mechanism for changes in neuronal activity in response to simultaneous stimulation. Consistent with this, barrel cortex EP responses in this study were affected by addition of a simultaneous forelimb stimulus. However, in contrast to the varying OIS responses (both increases and decreases), in all but one case EP response amplitude decreased. Decreases in neuronal activity suggest a potential mechanism for decreases in the vascular, and thus the OIS response.
It is also possible that small contributions were made to the OIS response by cell swelling (Haglund et al., 1994; Holthoff and Witte, 1996) or diffuse signaling of neurovascular coupling substances such as nitric oxide (Dirnagl et al., 1993). However, because of the anatomy and temporal characteristics of OIS responses, we believe that most of the signal corresponds to vascular activity (Blood et al., 1995; Narayan et al., 1995; Cannestra et al., 1996).
Combined neuronal and vascular responses
This study provides evidence for both local vascular responses to neuronal activity and overspill vascular mechanisms of OIS response modulation. However, it appears that certain properties of local versus overspill vascular activity differ such that, for example, overspill may increase while local responses decrease. Furthermore, the three predominant response patterns seen in individual trial sets suggest that there may be variation in the relative contributions of different mechanisms. This may occur because different physiologic responses, such as local vascular responses to neuronal activity or vascular overspill, predominate at different times. Relative contributions to the OIS response may be influenced by stimulus intensity, subtle physiologic or cerebral vascular anatomical differences between subjects, or anesthetic state within or between subjects (see later).
As suggested by the discrepancies between OIS and EP responses, the vascular demands of neuronal activity versus vascular overspill may potentially have antagonistic effects on the total vascular response, resulting in changing OIS response patterns. For example, decreased neuronal activity in barrel cortex may decrease demand for blood flow/volume, whereas vascular overspill from the forelimb region concurrently increases flow/volume to the barrel region. The net result of this may be either increased or decreased total blood flow/volume, depending on the relative contributions of the neuronal and overspill vascular components.
This hypothesis is consistent with both overall OIS response decreases and individual response patterns. Overall responses to both forelimb stimulus intensities decreased, slightly more with low- than high-intensity simultaneous stimulation. Of the individual trial sets, 35.5% demonstrated this same response pattern. In these cases, although decreased neuronal responses may have caused overall decreases in OIS responses to both forelimb stimulus intensities, vascular overspill may have been greater with the higher intensity, causing slight increases in OIS response magnitude relative to the lower intensity.
When OIS responses decreased with increasing forelimb stimulus intensity, the predominating component influencing vascular activity changes may have been decreased neuronal activity in barrel cortex, with negligible overspill contributions. Conversely, vascular overspill may have been the predominating component when OIS responses increased with simultaneous forelimb stimulation.
Consistency of response patterns
There is substantial evidence that OIS response changes are not simply artifacts of anesthetic or other physiologic variations within or between subjects. First, simultaneous forelimb stimulus intensity affected the degree of OIS modulation within trial sets such that only three different response patterns were observed consistently. These constituted only a small portion of the possible response patterns predicted by chance (see Results). Second, magnitude changes between stimulus conditions were statistically significant, both as a whole and within each response pattern. Third, within response patterns, magnitude always changed in the same direction relative to lone whisker stimulation (either decreases or increases, but not both). If changes had been random, a significant proportion of trial sets would have responded with magnitude changes in both directions. The EP responses also consistently changed in the same direction within trial sets.
The differences that did occur in OIS response patterns may have been partially caused by subtle vascular anatomic or physiologic variation between subjects. Differences in MCA anatomy may have affected response location and morphologic features, whereas differences in vessel diameter may have affected response magnitude by influencing vessel resistance and thus, volume of overspill. Since variation in vascular anatomy is likely to be even greater in species such as monkey and human, it will be important to consider vessel location and morphologic features when interpreting OIS responses or other vascular measurements in these species. Overall physiologic differences between subjects also may contribute to response variation.
Anesthetic level also may have caused small amounts of variation in both the relative contributions of different response components and the absolute magnitude of responses within and between subjects (Simons, 1992). However, a relatively consistent anesthetic level was maintained across all subjects, and anesthetic effects were minimized further by acquiring each trial set within short periods of time (1 hour).
CONCLUSION
Modulation of OIS and EP responses in barrel cortex after simultaneous stimulation of whisker and forelimb has revealed complex interactions between spatially and functionally distinct cortical somatosensory systems and has allowed identification of potential distinctions between vascular and neuronal dynamics. The OIS barrel cortex responses in the absence of EP (lone forelimb condition) and increased OIS responses with simultaneous stimulation both are consistent with vascular overspill influences on OIS response modulation. The EP modulation in barrel cortex during simultaneous forelimb stimulation suggests that OIS responses also were influenced by changes in neuronal activity. These results indicate that OIS responses to distinct vascular and neuronal dynamics are not necessarily equal in direction or magnitude, nor are they precisely spatially co-localized.
Footnotes
Acknowledgements
The authors thank everyone in the Laboratory of Neuro Imaging for their assistance, especially John S. Burton for his help in designing and maintaining our equipment, Andrew F. Cannestra for editorial comments, Paul M. Thompson for his statistical expertise, and Andrew A. Lee for assistance with figures.