
Abstract
Three-dimensional (3D) positron emission tomography (PET) is attractive for [18F]fluoro-DOPA studies, since the sensitivity improvement is maximal for radioactive sources located in central planes, which is usually the case for the human striata. However, the image quantitation in that mode must be assessed because of the nearly threefold increase in scattered coincidences. We report the results of [18F]fluoro-DOPA studies performed on six normal volunteers. Each one was scanned in the 3D and two-dimensional(2D) modes on the same tomograph. The quantitation in the 3D and 2D modes was compared for a Patlak graphical analysis with the occipital counts as the input function (Ki) and a striatooccipital ratio analysis. We find that, in 3D PET, a scatter correction is required to preserve the same quantitation as in 2D PET. When the 3D data sets are corrected for scatter, the quantitation of the [18F]fluoro-DOPA uptake, using the Patlak analysis, is similar in the 2D and 3D acquisition modes. Conversely, analysis of the striatooccipital ratio leads to higher values in 3D PET because of a better in-plane resolution. Finally, using the 3D mode, the dose injected to the subjects can be reduced by a factor greater than 1.5 without any loss in accuracy compared to the 2D mode.
Keywords
Three-dimensional (3D) positron emission tomography (PET), without interplane septa (Townsend et al., 1989), is a promising feature for [18F]fluoro-DOPA studies. Compared with two-dimensional (2D) acquisitions, a threefold to fivefold increase of the tomograph sensitivity can be obtained in average over the field of view, depending on the injected dose. This sensitivity improvement is not uniform over the axial field of view and can be more than 10-fold in central planes (Cherry et al., 1991) where the striata are most often placed. Consequently, the use of the 3D mode allows a marked reduction of the injected dose. This point is of particular interest for the subjects involved in longitudinal PET protocols. Such longitudinal studies using [18F]fluoro-DOPA are ongoing in several PET centers to assess the graft of mesencephalic fetal cells (Sawle and Myers, 1993; Remy et al., 1995b) of the rate of progression of the disease (Vingerhoets et al., 1994; Morrish et al., 1996) in parkinsonian patients. In addition, the high sensitivity in 3D PET allows the use of sharper reconstruction filters, which provides a practical image resolution closer to the tomograph optimal resolution and improves the quantitative measurements in the striata.
In 3D PET, the contribution of the scattered radiation is more significant than in 2D PET (Cherry et al., 1991; Spinks et al., 1992), and a large proportion of such events originates from activity sources located out of the plane and out of the field of view. A preliminary work suggests that 3D [18F]fluoro-DOPA acquisitions could be quantified without scatter correction (Liow et al., 1996). However, it is well known that the quantitation loss in PET is more pronounced in small objects because of scattered radiation (Bendriem et al., 1991). Our first results in two healthy subjects showed that the 3D mode without scatter correction was not as quantitative as the 2D mode (Trébossen et al., 1996). In addition, we found that in the 3D mode with a scatter correction, the tracer uptake constants fall in the range of the 2D values measured on the same tomograph (Trébossen et al., 1996). Another comparison between 2D and 3D PET for [18F]fluoro-DOPA studies, conducted on two different scanners and including a scatter correction in both modes, indicated an increase of the uptake constants in 3D PET (Rakshi et al., 1996). These apparently contradictory findings lead to the need of the following: (1) assessing the quantitation of such kinetics in 3D PET, in particular with regard to the amount and the distribution of the scattered radiation; and (2) comparing the quantitation of the [18F]fluoro-DOPA uptake in the 2D and 3D modes. The latter point could be crucial if different acquisition modes on the same tomograph are used in longitudinal studies.
We thus compared the 2D and 3D acquisition modes on the same tomograph for the quantitation of the [18F]fluoro-DOPA uptake in six healthy subjects. We also investigated if a scatter correction is a requisite for the quantitation of such studies in the 3D mode using the estimation of true method (ETM) for scatter correction (Bendriem et al., 1994).
MATERIALS AND METHODS
Subjects
Six healthy male volunteers (aged 19 to 28 years) were scanned on the same tomograph in both the 2D and 3D modes. All subjects were part of ongoing protocols in our center that were approved by local Ethical Committees and gave their written informed consent. Four subjects had magnetic resonance imaging with a 0.5 T imager (MRMAX, General Electric, Milwaukee, TN, U.S.A.) and two with a 1.5 T imager (Signa, General Electric) to check the absence of silent brain abnormalities. T1-weighted contiguous axial slices, 3 mm-thick on the 0.5 T imager and 1 mm-thick on the 1.5 T imager, parallel to the bicommissural line(anteroposterior commissures), were obtained throughout the entire brain. These images then were used for individual coregistration with PET images (see later).
Data acquisition and reconstruction
The PET data were acquired on the ECAT 953B/31 tomograph (Bendriem et al., 1992; Spinks et al., 1992). A head holder molded to each subject was used to maintain a good head position and to allow further repositioning. In each acquisition mode, a dynamic scan using nine time frames was acquired over 90 minutes. For the 2D acquisitions, the injected dose ranged from 98.8 to 234.6 MBq (mean ± SD = 168 ± 46 MBq; 4.54 ± 1.24 mCi). For the 3D acquisition, the volunteers received a dose of [18F]fluoro-DOPA ranging from 44 to 133 MBq (91.8 ± 33.7 MBq; 2.48 ± 0.91 mCi). The dose ratio between 2D and 3D acquisitions was, respectively, 1.51, 1.53, 1.57, 1.68, 1.76, and 4.25 for the six subjects. The 2D and the 3D scans were acquired 7 weeks apart for one subject and within 1 week for the others.
In 2D PET, the images were reconstructed using a ramp filter with a 0.5 cycles/pixel cutoff frequency and a Hanning apodizing window. The use of these parameters yields a practical image resolution of 9 mm. In addition for this analysis, the 2D data sets were corrected for scatter using the classic 1-D deconvolution (Bergström et al., 1983). In clinical routine, such a scatter correction usually is not applied. The parameters of the 1-D deconvolution were derived from measurements of a line source placed at 0, 4, and 8 cm from the center of a 20-cm water-filled cylinder. A 14% scatter fraction and a 0.032-mm−2 slope were obtained in average for the three source locations over the 31 slices (Karp et al., 1991).
In 3D PET, the images were reconstructed using the filtered back-projection with reprojection algorithm (PROMIS from the Geneva package; Townsend et al., 1991). A Colsher filter and a Hamming apodizing window were used, yielding a 6-mm image resolution. Data were corrected for dead time, normalization, and attenuation. The normalization factors were calculated from a blank scan of the rotating rod sources acquired on the direct planes with the septa extended (Defrise et al., 1991). Three-dimensional attenuation correction factors were computed from a transmission scan acquired in the 2D mode with the septa extended (Townsend et al., 1991). The images were corrected for scatter using the ETM (Bendriem et al., 1994). This scatter correction is based on a dual energy window acquisition: a sinogram of true unscattered coincidences is acquired in a high-energy window (e.g., 550 and 650 keV energy settings) in addition to the standard sinogram acquired with regular energy settings (250 and 650 keV). An estimate of the true unscattered counts acquired in the standard large energy window is computed from the high-energy window sinogram. This estimate is subtracted from the total sinogram to produce a sinogram of scattered counts in the large window, which is smoothed and then subtracted from the sinogram acquired in the standard window.
Data analysis
For each subject, the magnetic resonance imaging was coregistered to each of the PET acquisitions using a method previously described (Mangin et al., 1994; Remy et al., 1995b). The magnetic resonance imaging was resampled in the PET image coordinates and was used to check the position of the head between 2D and 3D scans and to monitor definition of the regions of interest (ROI). This method avoids the resampling of PET images characterized by a different image resolution. Indeed, for structures affected by partial volume effect such as the striata, a further degradation of the apparent activity concentration could result from the resampling of slices 3.375 mm apart. Four adjacent planes, on which the striata appear, were selected on the images obtained after summing the PET data collected from 30 to 90 minutes after the injection. Ten-millimeter diameter circular ROI were defined on the striata by visual inspection with reference to the magnetic resonance imaging: one for the caudate, and three for the putamen (Remy et al., 1995a, 1995b). The ROI then were reported on the corresponding PET image sequence. The ROI counts were averaged over the four planes, thus providing an average of 4 ROI for each caudate and 12 ROI for each putamen.
The quantitation of the [18F]fluoro-DOPA uptake was assessed using two methods: a Patlak analysis with the occipital counts as the tissue input function (Patlak et al., 1983, 1985; Brooks et al., 1990; Hoshi et al., 1993; Remy et al., 1995a, 1995b); and a striatal-to-occipital ratio (SOR) analysis between 60 and 90 minutes (Hoshi et al., 1993) and between 80 and 90 minutes (Leenders et al., 1986; Martin et al., 1986; Hoshi et al., 1993; Takikawa et al., 1994). The activity concentration in the occipital cortex was averaged from four 25-mm diameter ROI defined on the same slices as the striatal ROI. The [18F]fluoro-DOPA uptake (Ki) in the striata was determined as the slope of the linear regression onto the SOR values against the integral time derived from the occipital activity concentration (Patlak et al., 1983, 1985). Only data collected between 30 and 90 minutes after injection were used to calculate Ki (Brooks et al., 1990). The activity concentration collected between 60 and 90 minutes in the occipital region and in the striata was averaged, yielding one SOR value between 60 and 90 minutes. We also analyzed the variation of the SOR as a function of time[SOR(t)]. When there was no statistically significant difference, the values for the left and right caudate and for the left and right putamen were pooled, yielding two different values per data set for each structure. In 3D mode, we compared the scatter fraction subtracted from the occipital region and from the striata as a function of time. This fraction was computed as the relative difference in activity concentration between the 3D mode without scatter correction and with the ETM correction. For this analysis, the values for the left and right caudate and putamen were averaged to obtained one value for the striata per time frame and per subject.
Statistical analysis
The uptake constants Ki and the SOR between 60 and 90 minutes and between 80 and 90 minutes measured in the 2D and 3D modes in the caudate and in the putamen were compared using a repeated measure analysis of variance (ANOVA) with the acquisition and scatter correction method and the type of structure as intrasubject variables. Contrasts were defined for the six following comparisons:
Two-dimensional and 3D without scatter correction Three-dimensional with and without the ETM for scatter correction Two-dimensional with scatter correction and 3D with the ETM correction Two-dimensional without scatter correction and 3D with the ETM correction Two-dimensional with and without scatter correction Two-dimensional with scatter correction and 3D.
Analysis of the SOR(t) was performed using a repeated measure ANOVA with the acquisition and scatter correction method, the time frame, and the structure type as intrasubject variables. Contrasts were defined for the interaction of the four data acquisition and correction modalities with the time frame. For this analysis, there were two values of SOR for the caudate and the putamen per time frame and per data set. In 3D mode, the amount of scatter subtracted at each time from the occipital region and from the striata was compared using a repeated measure ANOVA with the structure type and the time frame as intrasubject variables.
The integral time values versus time obtained in the four modes of acquisition and correction were analyzed using an ANOVA with the time and the acquisition mode as intrasubject variables.
RESULTS
Fig. 1 presents some typical images of the distribution of the [18F]-labeled compounds between 30 and 90 minutes after an injection of [18F]fluoro-DOPA. The 2D and 3D acquisitions were performed in the same volunteer within 1 week. The subject received 234.6 MBq of [18F]fluoro-DOPA for the 2D scan and 133 MBq for the 3D acquisition. Compared with the images acquired in the 3D and 2D modes without scatter correction, the images acquired in 3D and corrected for scatter using the ETM technique show a greater contrast between the striata and the surrounding regions, especially with the ventricles. Furthermore, the delineation between the caudate and the putamen seems better in the images acquired in 3D than in those acquired in 2D mode. Fig. 2 shows the Patlak curves calculated in the putamen (top) and in the caudate (bottom) in the 2D and 3D modes for this subject.
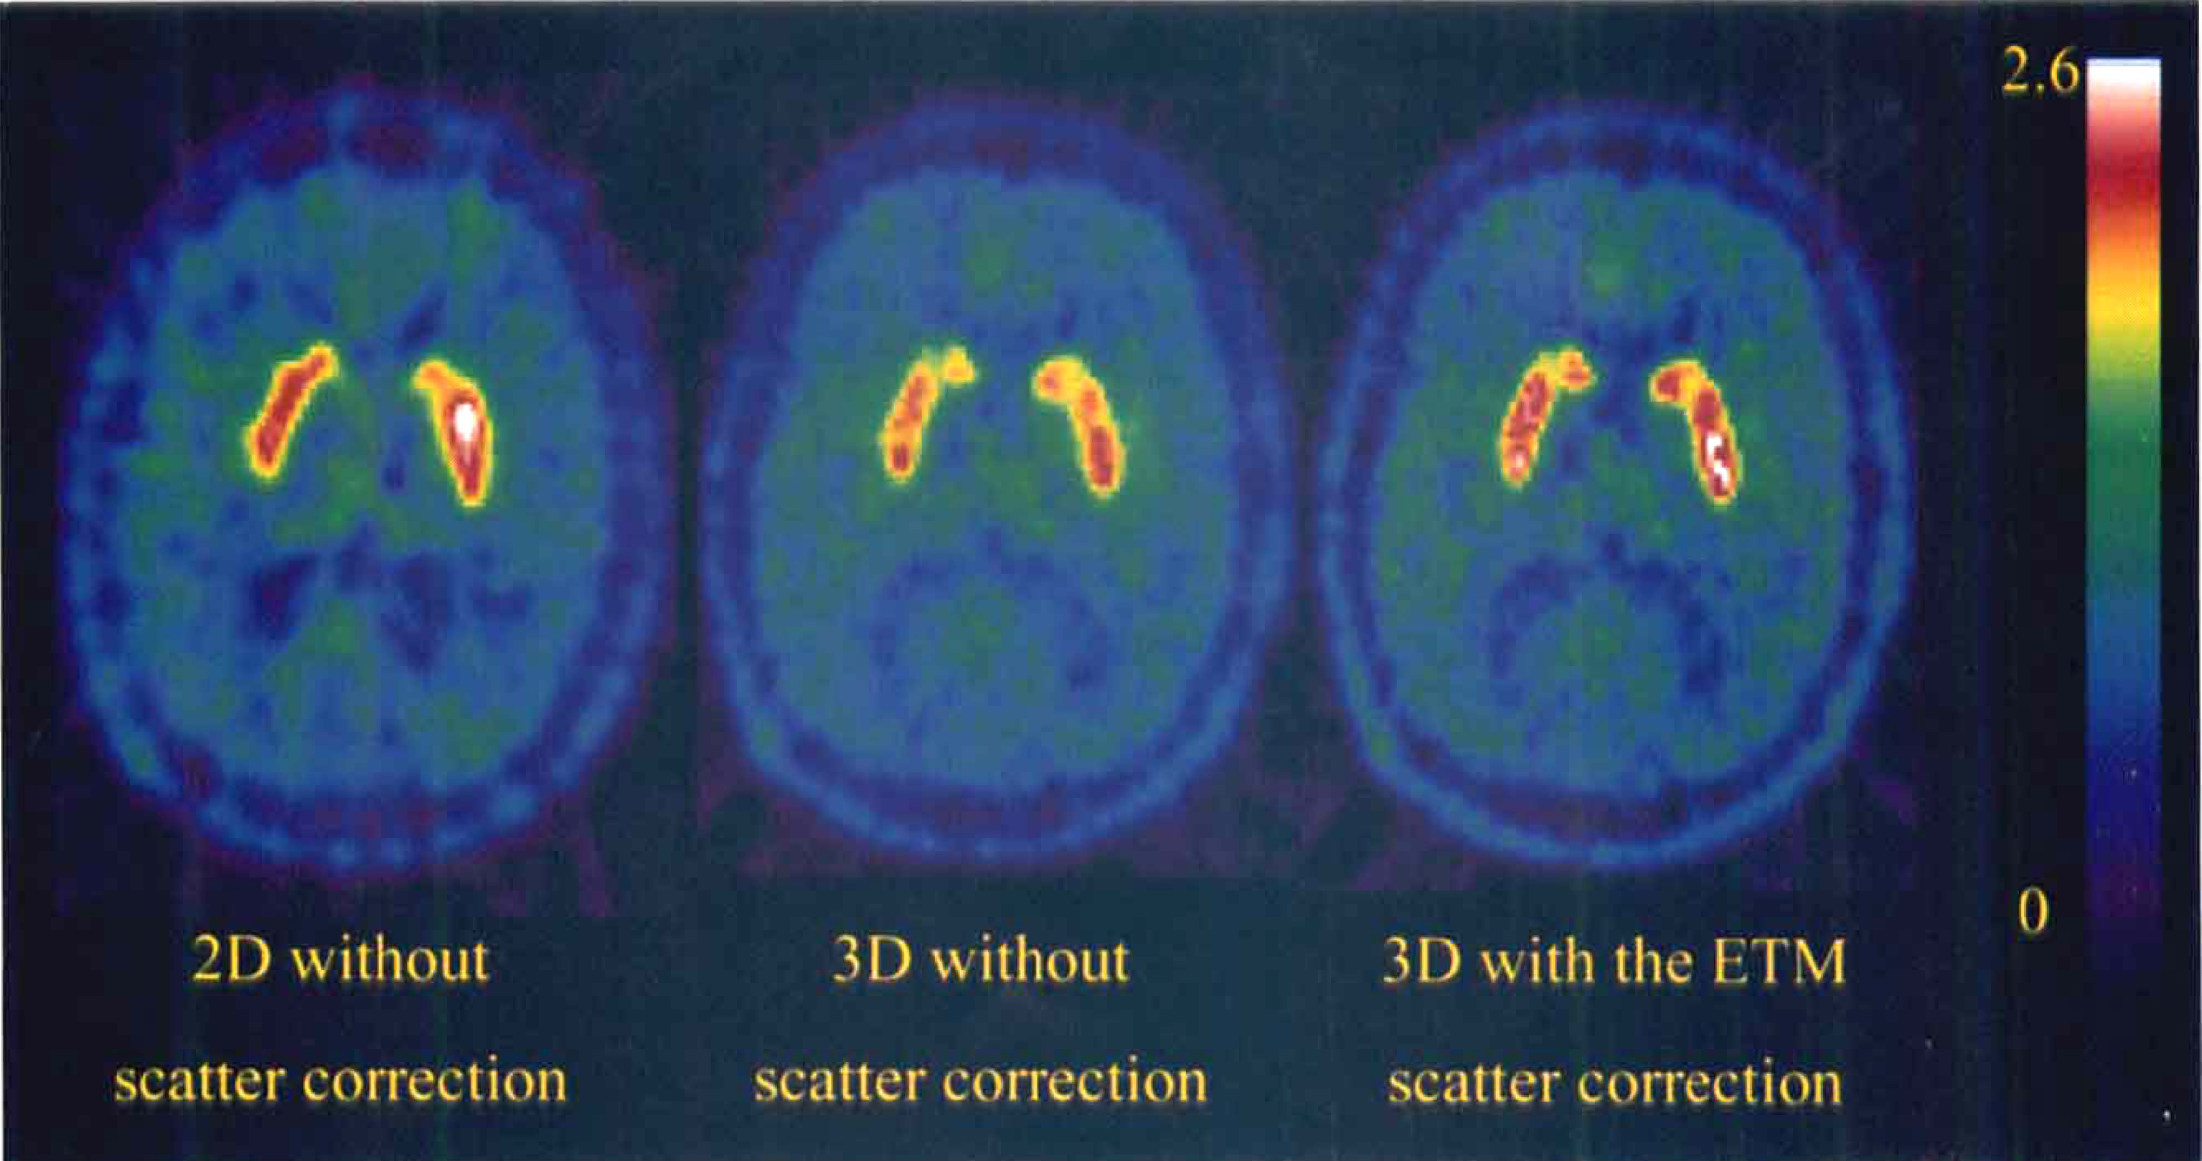
Images of the distribution of the [18F]-labeled compounds measured between 30 and 90 minutes using the two-dimensional (2D) mode(left), the three-dimensional (3D) mode without scatter correction (middle) and with the estimation of true method (ETM) for scatter correction (right) at the same level, in the same volunteer. The injected dose of [18F]fluoro-DOPA was 234.6 and 133 MBq, respectively, in the 2D and 3D modes.
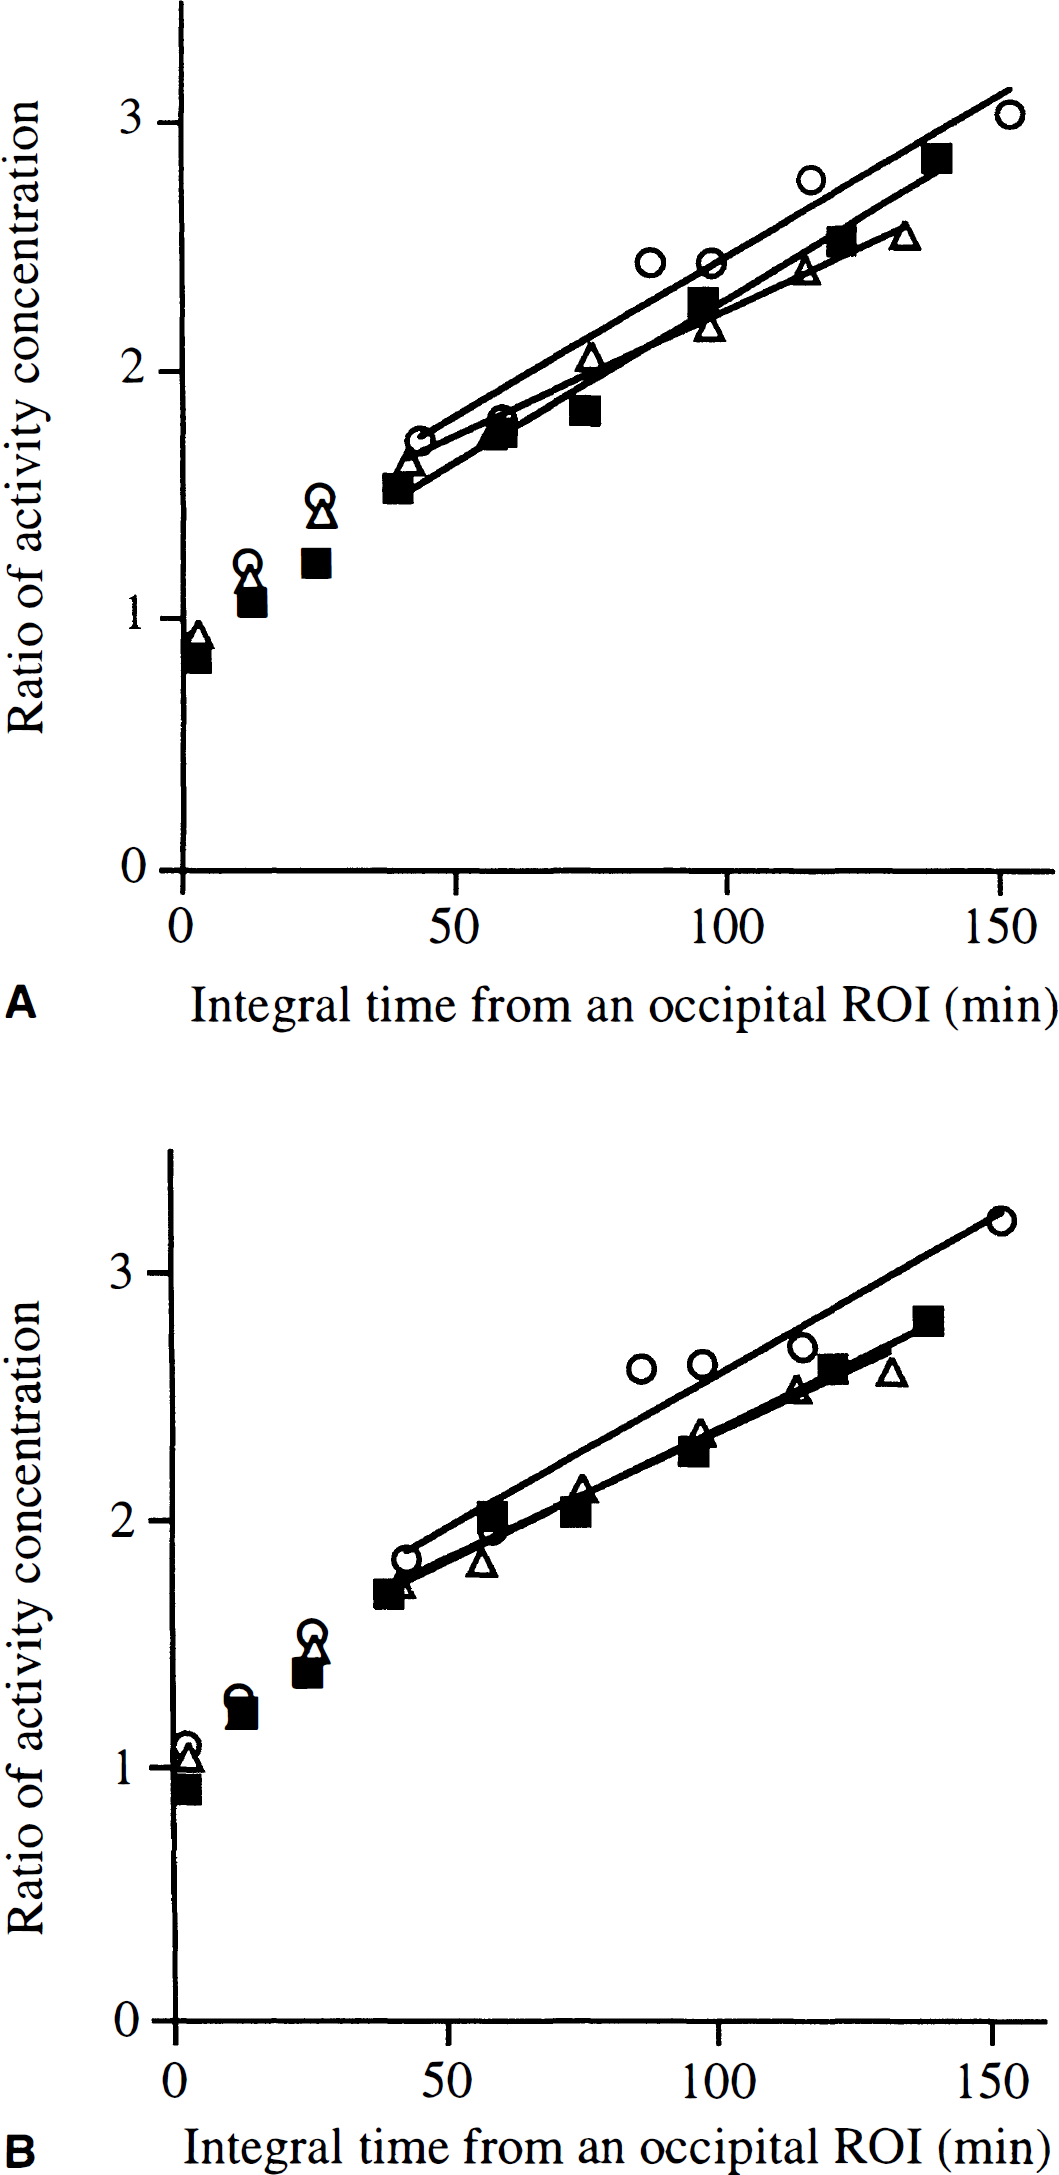
Patlak analysis of the [18F]fluoro-DOPA uptake after an injection of 234.6 and 133 MBq, respectively, in 2D and in 3D modes in the same normal volunteer.
Analysis of the uptake constants measured in the two- and three-dimensional modes
The Ki constants were significantly higher in the caudate(mean ± SD = 0.0102 ± 0.0022 min−1) than in the putamen(0.0086 ± 0.0016 min−1) in the four combinations of data acquisition and correction (F = 16.2, df = 1, P < 0.01). However, since the interaction between the type of structure and the mode of data acquisition and scatter correction was not significant, we reported the Ki values and the results for the overall striata (Fig. 3).
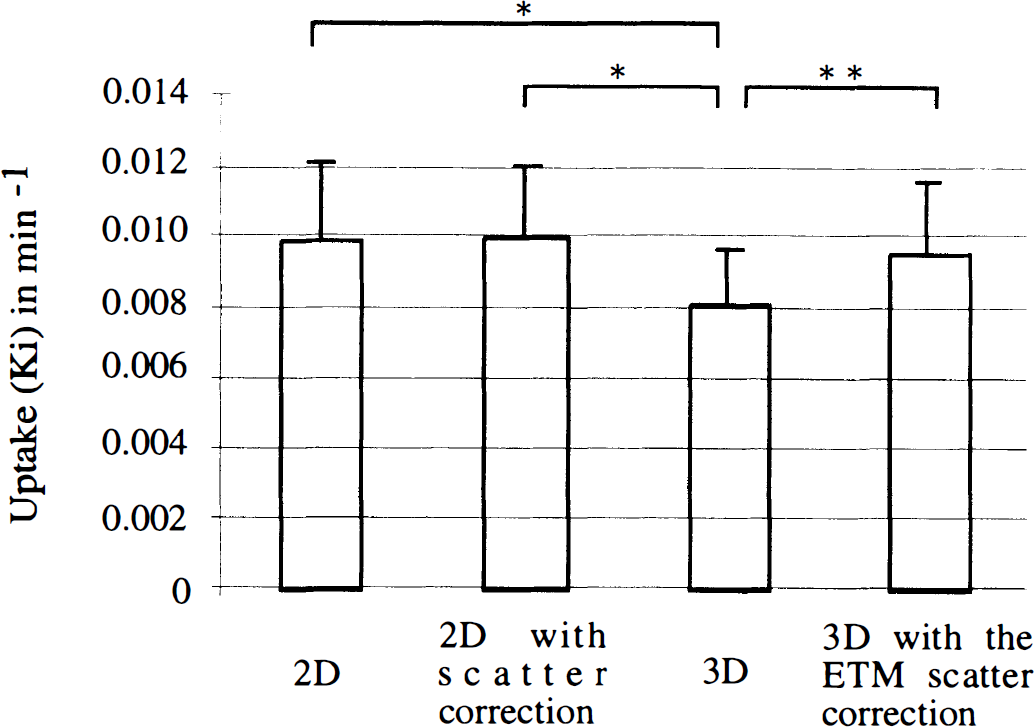
Mean values (± 1 SD) of the [18F]fluoro-DOPA uptake (Ki) in the striata obtained in the 2D and 3D modes in the same six healthy subjects (the values for the left and right caudate and putamen were pooled). Without indication, the differences between modes were not significant; *P = 0.0001, **P < 0.005.
The method of data acquisition and scatter correction significantly affected the uptake values in the striata (F = 9.1, df= 3, P < 0.005). The striatal Ki values measured in 3D mode without scatter correction (mean ± SD = 0.0082 ± 0.0015 min−1) were lower than the values calculated in that mode with the ETM scatter correction(0.0096 ± 0.0020 min−1; F = 12.5, P < 0.005), in the 2D mode without scatter correction (0.0099 ± 0.0021 min−1; F = 19.3, P < 0.005), and with the one-dimensional (1D) deconvolution for scatter correction (0.010 ± 0.0021 min−1, F = 20.9, P< 0.005).
Conversely, the Ki values in the 3D mode corrected for scatter using the ETM were in the range of the Ki values obtained in 2D mode (either corrected or uncorrected for scatter).
In 3D mode, the mean error (average over the six subjects) on the estimation of Ki relative to Ki was 0.122 ± 0.1 without scatter correction and 0.198 ± 0.12 with the ETM correction. In 2D mode, this ratio equaled 0.197 ± 0.1 without scatter correction and 0.185 ± 0.08 with scatter correction. The dispersion of Ki about the mean, expressed as the coefficient of variation, was 18.7% in 3D mode without scatter correction and 20.7% with the ETM correction. This coefficient equaled 21.5% in 2D mode without scatter correction and 20.6% with the 1D deconvolution.
Analysis of the striatooccipital ratio measured in the two- and three-dimensional modes
The SOR values calculated in the caudate and in the putamen were not significantly different, regardless of the mode of data acquisition and correction used. The interaction between the structure and the scheme of data acquisition and scatter correction also was not significant. In addition, all comparisons gave similar statistical results for both the SOR values between 80 and 90 minutes and the SOR values averaged between 60 and 90 minutes after injection. Thus, in the following, we reported the values for the striata averaged between 60 and 90 minutes (Fig. 4), but the comments concern indifferently both 60- to 90- and 80- to 90-minute calculations.
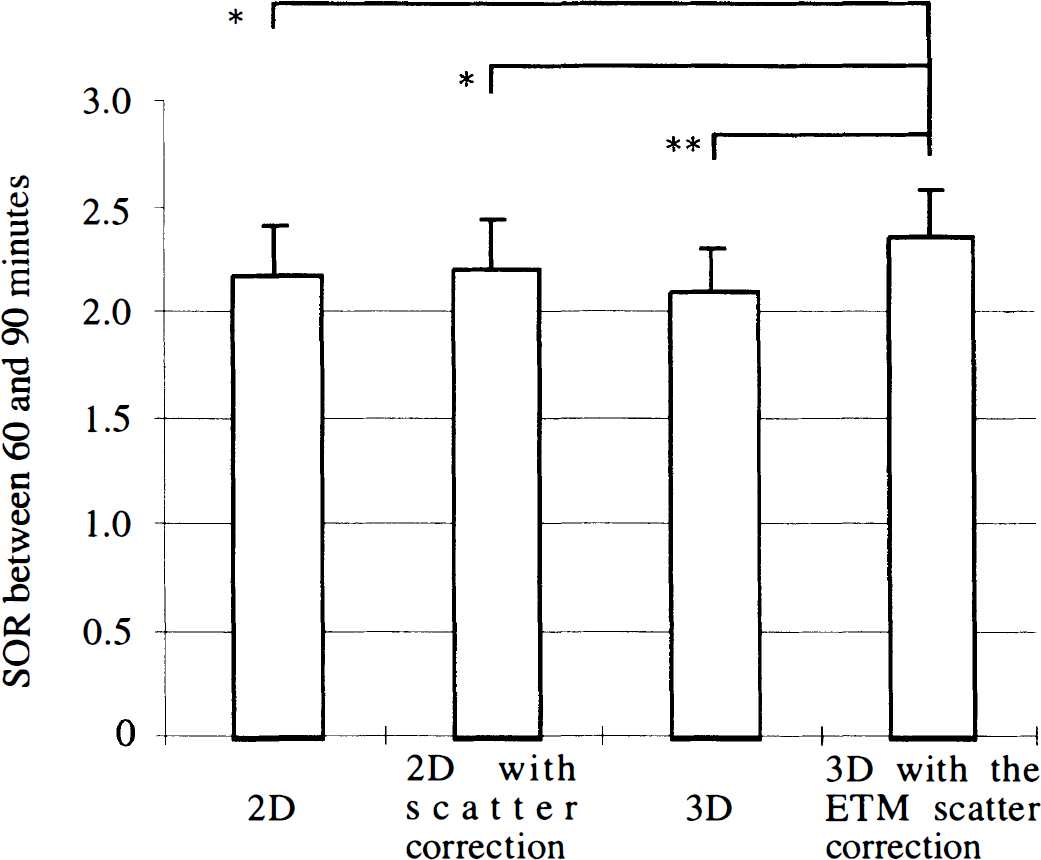
Striatal-to-occipital ratio (SOR) between 60 and 90 minutes scanning time (mean ± SD) measured in the 2D and 3D modes in the same six healthy subjects (the values for the left and right caudate and putamen were pooled). Without indication, the differences between modes were not significant; *P< 0.05, **P < 0.005.
The repeated measure ANOVA gave significant results, depending on the method of data acquisition and scatter correction(F = 6.3, df = 3, P < 0.005).
The SOR measured in the 3D mode without scatter correction (mean ± SD = 2.11 ± 0.20) was not significantly different from that measured in 2D mode without scatter correction(2.18 ± 0.23) and with the 1D deconvolution for scatter correction (2.22 ± 0.23). Using the ETM scatter correction in 3D mode, the SOR (2.36 ± 0.22) was significantly higher than in 3D mode without such correction (P < 0.005), in 2D mode without scatter correction (P < 0.05), and with the 1D deconvolution for scatter correction (P < 0.05).
For the six subjects, the SOR dispersion about the mean was, respectively, 9.5% in 3D mode, 9.3% in 3D mode with the ETM correction, 10.6% in 2D mode without scatter correction, and 10.4% with the 1D deconvolution.
Analysis of the variations of the striatooccipital ratio and the time integral as a function of time
The repeated measure ANOVA performed for the comparison of the time-dependent changes in SOR(t) in the 2D and 3D modes demonstrated that the SOR global value over the acquisition duration was not significantly different in the caudate and in the putamen, and we thus report the results for the overall striatum (Fig. 5).
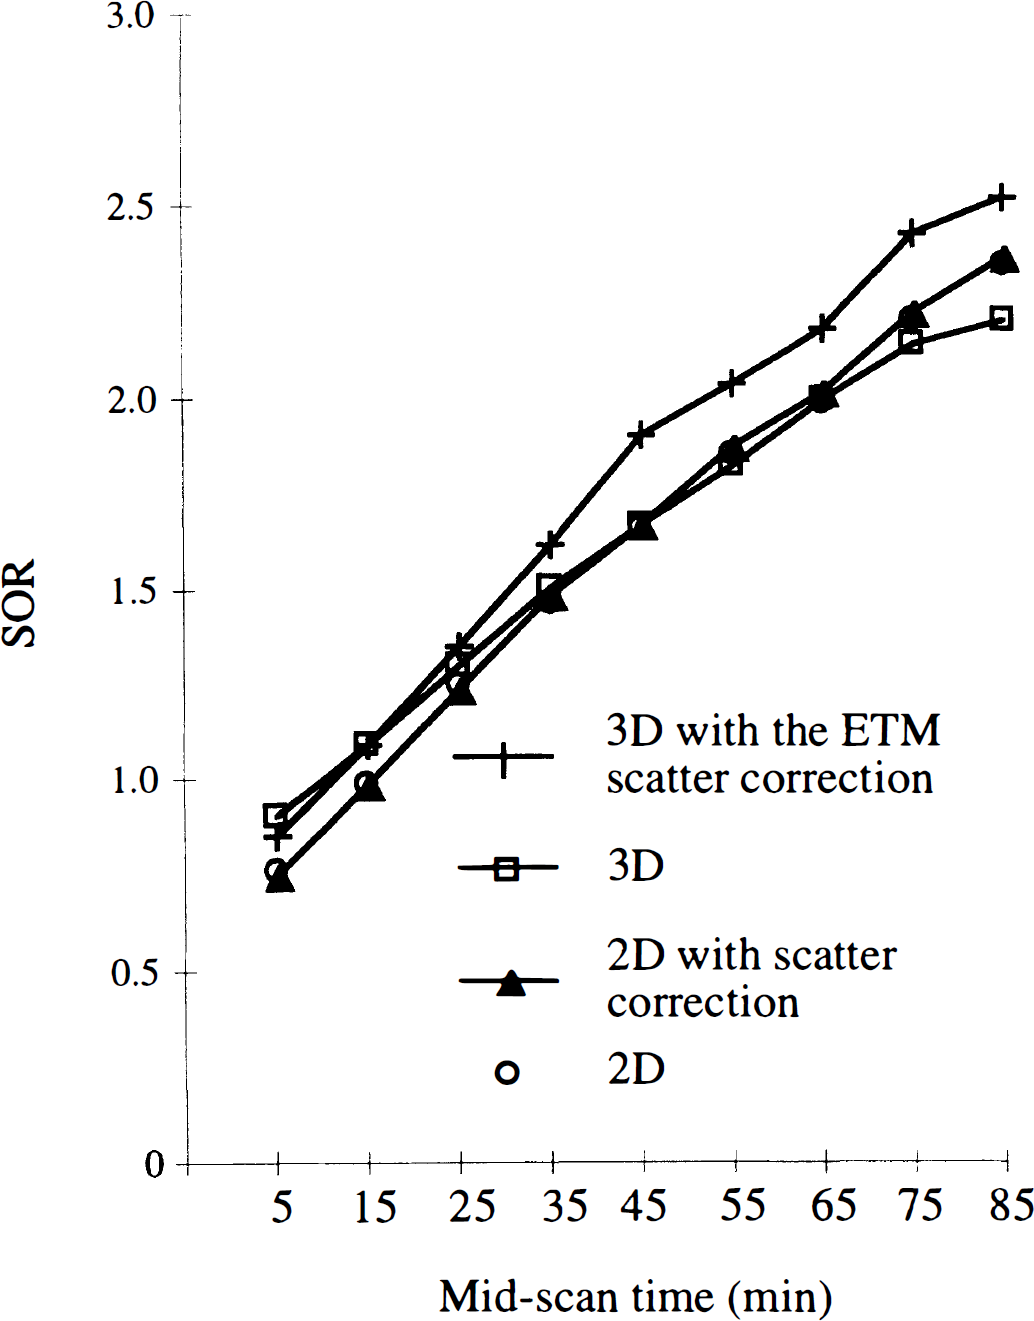
Time-dependent changes of the SOR averaged over six healthy subjects in the 2D and 3D modes (the lines connect the points). Values for the left and right caudate and putamen were pooled.
The ANOVA indicates a significant interaction between time course of the tracer and data acquisition and correction method (F = 6.0, df = 24, P < 0.001). The interaction seemed to be caused by different variations with time of SOR(t) in 3D mode without scatter correction and in 2D mode, and also in 3D mode with and without scatter correction (Fig. 5). The time-dependent changes of SOR(t) in 2D mode with and without scatter correction were similar. Thus, the comparison with the curves obtained in the 3D mode gave the same results whether or not the 1D deconvolution was used.
The SOR(t) values were significantly higher in the 3D mode without scatter correction than in 2D mode between 0 and 20 minutes after the tracer injection (P < 0.005); then the difference between both modes decreased, reaching less than 5% (not significant between 20 and 90 minutes after injection except between 80 and 90 minutes, P < 0.005). When comparing the 3D mode without and with the ETM scatter correction, the difference was evident only between 30 and 90 minutes after injection (> 10%, P< 0.005). Fig. 6 illustrates the time-dependent changes of the relative amount of scatter subtracted from the occipital region and from the striata in 3D mode. Above 30 minutes after injection, the relative amount of scatter subtracted from the occipital region was significantly larger than that subtracted from the striata (F > 13.4, df = 1, P < 0.001). Conversely, in the first 20 minutes after injection, the amount of scattered counts removed from the occipital region was smaller than that removed from the striata (F = 11.9, df = 1, P < 0.005). The SOR measured in the 3D mode with the ETM scatter correction increased by a 1.1 factor on average compared with the values measured in 2D mode (Fig. 5). The difference between both modes was significant, with a small level of significance between 0 and 20 minutes(P < 0.05) and with a large one between 20 and 90 minutes after the tracer injection (P < 0.001).
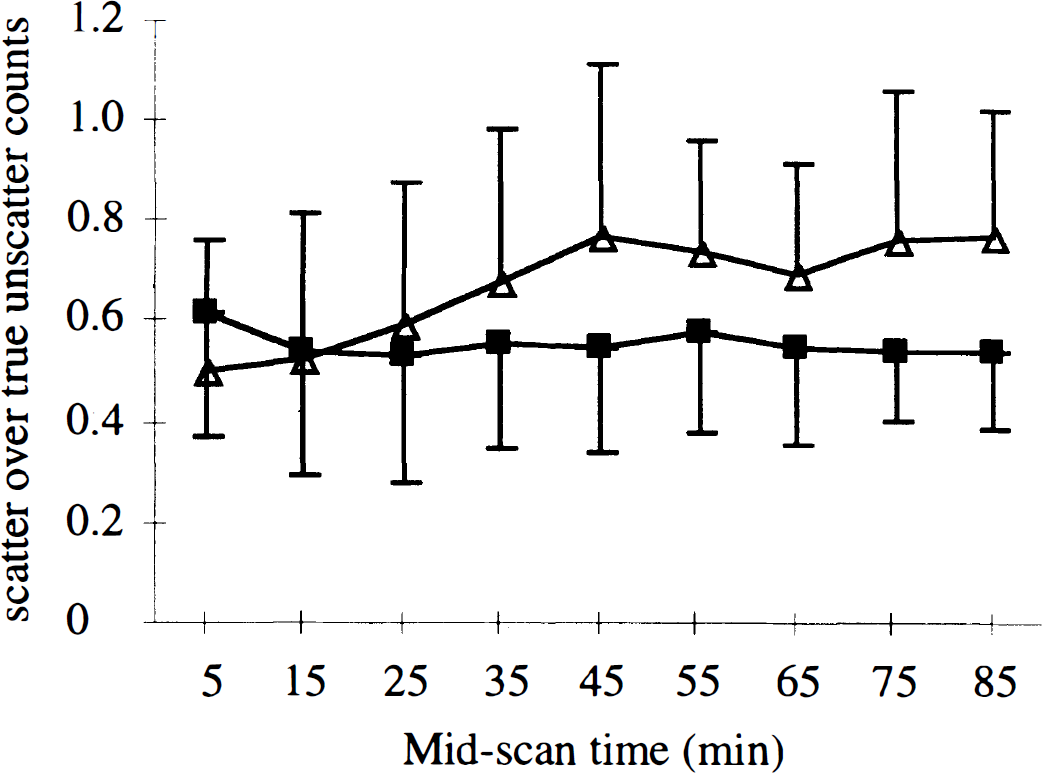
Time-dependent variation of the scatter component in 3D over six healthy subjects(the lines connect the points). (▪) Average value over the left and right caudate and putamen. (▵) Occipital region.
The ANOVA of the time integral values versus time obtained in the four modes of acquisition and correction showed no significant effect of the acquisition modality (F = 4.0, df = 3) and no interaction between the time and the acquisition mode (F = 1.1, df= 21). However, the contrasts defined to compare the time integral between 0 and 90 minutes showed that the value of the 3D mode with the ETM correction was significantly higher than that of the three other acquisition modes (F > 24.0, df= 1, P < 0.0001). Although higher time integral values were obtained at each time frame using the 3D mode with the ETM correction compared with the 2D mode without and with scatter correction (Table 1), the difference was significant only between 70 and 80 minutes and between 80 and 90 minutes (F > 7.0, df = 1).
Mean ± SD of the time integral values measured in 2D and 3D modes with scatter correction in six healthy subjects
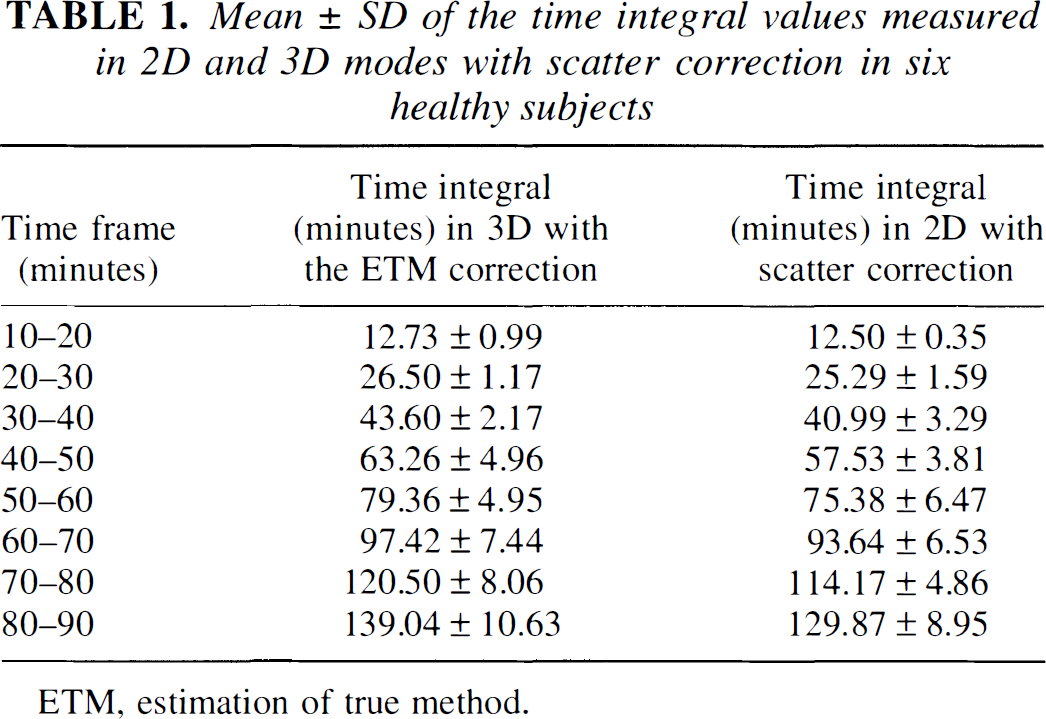
ETM, estimation of true method.
DISCUSSION
In this study, we compared in the same subjects the quantitation of the striatal [18F]fluoro-DOPA uptake in the 2D and 3D acquisition modes available on the same tomograph. Our goal was to investigate the influence of the acquisition mode and the need for a scatter correction in the 3D mode for the quantitation of [18F]fluoro-DOPA studies. Since the ANOVA accounted for the intrasubject variability, we have been able to analyze and demonstrate a significant influence of the modality of data acquisition and correction on the [18F]fluoro-DOPA uptake measure. Different results were obtained, depending on the method used to estimate the tracer uptake. Using a Patlak analysis, the Ki values measured in 3D mode without scatter correction were underestimated. However, when applying the ETM correction for scatter, they were not different from the values obtained in 2D mode. Conversely, the SOR calculated either between 60 and 90 minutes or between 80 and 90 minutes after injection significantly increased in 3D mode with scatter correction compared with all other acquisition and correction modalities. Finally, we found that a scatter correction induced a significant change only on the quantitative values measured in the 3D mode. These results were confirmed by comparing the parameters Ki, SOR, and SOR(t) obtained in the 3D mode with and without scatter correction in six subjects with the values measured in 2D mode in a group of 18 controls (including these six volunteers).
The differences between the four modes of data acquisition and correction can be explained mostly by the variations of SOR(t) with time. In 3D acquisitions corrected for scatter, the SOR values were increased by 10% in average with some fluctuations, and the time integral values were significantly higher in the last 20 minutes compared with the 2D mode. We observed that the SOR increase did not affect the Ki values, likely because the rate of changes of SOR(t) over time was close to that of the time integral. Another group compared the 2D and 3D modes of acquisition and reported a 20% increase of Ki in 3D mode (Rakshi et al., 1996). In that study, the Ki parameters were calculated following the same graphical analysis, and both the 2D and the 3D acquisitions were corrected for scatter. However, the 3D scans were acquired on an ECAT 953B and the 2D scans on a tomograph with a larger detector size and thus with larger axial sampling and intrinsic resolution. In the current study, we used the same tomograph for the 2D and 3D acquisitions, and the measurements in the striata were thus affected by the same partial volume effect for a given activity distribution in both modes. The analysis of SOR(t) illustrates that the spill-over effect of the radioactivity distribution in the striata from the surrounding tissues was identical in 2D and 3D modes as a function of time. Indeed, there was no significant interaction between type of structure, time, and mode of data acquisition and correction for SOR(t). On the contrary, in the study of Rakshi and coworkers (1996), the partial volume effect should be more pronounced in 2D than in 3D scans because of the larger detector size of the scanner used for the 2D acquisitions. In the current work, the image resolution in the 3D mode is closer to the tomograph intrinsic resolution equal to 5.8 mm (Bendriem et al., 1992) than in the 2D mode. This in-plane resolution improvement in the 3D mode, resulting from the use of a sharp filter, yields an improvement of SOR(t) in 3D mode with the ETM scatter correction. The effect of an improvement of the resolution in the 3D mode without scatter correction also is evident in the first 10 minutes after the injection. During the early minutes after the injection of [18F]fluoro-DOPA, the contrast between the striata and the other brain regions is small (Kubarawa et al., 1993), and scatter thus equally affects the measurements in those structures (Fig. 6). The most important effect degrading the quantitation in the striata, then, should be the partial volume effect. As a consequence of the better image resolution, the SOR values were higher in 3D than in 2D mode, resulting from the more accurate measurements of the activity concentration in the striata (Fig. 5). The SOR coefficient of variation about the mean was similar in the 3D and 2D modes (11.6% in 3D mode without scatter correction, and 11.8% in 2D mode between 0 and 10 minutes), indicating that data can be reconstructed in the 3D mode with a practical resolution as close as possible to the optimal resolution without noise increase. This is another benefit of the 3D acquisition mode and a way to fully exploit the sensitivity improvement in such mode.
With reference to the 2D mode, the Ki values in the striata were smaller in the 3D mode without a correction for scatter, whereas the SOR in late images was stable. The Ki reflects the time-dependent changes of the SOR. From 10 minutes after injection of [18F]fluoro-DOPA, the contrast in activity concentration between the striata and typical brain regions increases (Kubarawa et al., 1993). The comparison of the SOR(t) curves in the 2D and 3D without-scatter-correction modes indicates an underestimation of the SOR in 3D mode without scatter correction that is enhanced with time. The quantitation loss in 3D mode likely is caused by the increase in scatter fraction. The scatter does not similarly affect small and large structures (Fig. 6) (Trébossen and Bendriem, 1995). This effect is well known in 2D PET (Bendriem et al., 1991). However, Liow and others recently reported that a scatter correction is not required in 3D mode, since the SOR calculated from small ROI are unaffected by the scattered radiation (Liow et al., 1996). The difference with our results may partly come from the use of a larger ROI on the occipital region than on the striata in the current study and partly from the scatter correction scheme. Indeed, the Gaussian filtering used by Liow and colleagues mostly removes the high-frequency components of the image, which also include some of the higher frequencies of the scatter component. The ETM scatter correction method uses two scans acquired simultaneously: one acquired in a high-energy window mainly composed of true unscattered counts, and one acquired in the standard energy window. The true unscattered component in both windows thus reflects the distribution of the [18F] labeled compounds at each time frame. Using the ETM correction in 3D mode, the ratio of the SOR(t) values measured without and with scatter correction increases as a function of time, indicating that this scatter correction takes into account the variation with time of the scatter distribution in such studies. This also is illustrated by the plot of the scattered counts removed from the striata and the occipital region (Fig. 6). In the occipital region, the relative amount of scatter increased as a function of time up to 40 minutes after injection and then remained stable between 70% and 80% of the unscattered counts. This fraction is close to the 70% fraction expected from measurements of a line source inserted in a 20-cm uniform cylinder. In the striata, the relative amount of scattered counts first decreased for 20 minutes after injection and then remained in a plateau between 50% and 60% of the unscattered counts. The amount of scattered counts removed from the striata was 10% higher than that removed from the occipital region in the first 10 minutes after injection. This may result from a quicker influx of the tracer in cortical regions than in the striata (Kubarawa et al., 1993). Above 40 minutes after injection, the amount of scatter removed with the ETM correction is significantly greater in the occipital region than in the striata, leading to a significant increase of both the SOR and Ki.
One drawback of the ETM correction, especially in 3D mode, is that the amount of data acquired is doubled. The variations of the SOR as a function of time in 3D mode without scatter correction and in 2D mode with scatter correction tend to indicate that the distribution of scattered counts changes more slowly between 40 and 90 minutes after the tracer injection than below 40 minutes. Thus, the scan acquired in the high-energy window between 40 and 50 minutes after the injection, scaled with appropriate decay correction factors, could be used to correct the scans acquired in the standard window between 40 and 90 minutes. This process would reduce by 1:4 the size of the data acquired to perform the ETM correction.
Finally, the analysis of SOR(t) brought some elements to address the issue of the most quantitative mode of data acquisition and correction. The 3D mode with a sharp filter improved the quantitation in small structures. Such an improvement is attenuated by the contribution of scatter, depending on the contrast in the object. The ETM scatter correction accounts for most of this variable contribution and leads to equal Ki values as in the 2D mode.
Interestingly, the dose of[18F]fluoro-DOPA delivered to the subjects was at least 1.5 times lower for the 3D examinations than for the 2D acquisitions. In 3D mode, the dispersion of the points in the linear fits slightly increased when the ETM correction is applied(Fig. 2). The noise in the reference region was slightly degraded when using the 3D mode with the ETM scatter correction compared with the 2D mode(Table 1). Such noise increase could be partly reduced by further smoothing in the correction scheme. However, using such a dose ratio between 2D and 3D modes, the calculated errors in Ki relative to Ki were close in 2D and in 3D modes with the ETM correction. Furthermore, we found that the subject dispersion of Ki about the mean was similar in 3D and in 2D modes, whereas the SOR values showed slightly less variations about the mean in 3D than in 2D mode. The variation about the mean of both Ki and SOR reflects an improvement of the signal-to-noise ratio in 3D mode with regard to the injected activity.
CONCLUSION
Our results confirm that the 3D mode is attractive for [18F]fluoro-DOPA studies. Indeed, the 3D acquisition mode allows a reduction of the injected dose of tracer by a factor greater than 1.5 without any degradation of the signal-to-noise ratio compared with the 2D mode. In addition, images can be reconstructed with a practical resolution closer to the optimal resolution than in 2D mode, allowing recovery of close values of the SOR without scatter correction despite the quantitation loss but higher values with a scatter correction. On the other hand, the 3D mode needs a scatter correction to keep the Ki values in the range of the 2D values. Accordingly, using the same tomograph, the 3D mode of data acquisition can be substituted to the 2D conventional mode for ongoing [18F]fluoro-DOPA protocols based on the estimation of Ki. Furthermore, with regard to the reduction of the dose, the 3D mode appears particularly well suited for longitudinal studies, which involve multiple injections of tracer to the same subject, such as the follow-up of parkinsonian patients.
Footnotes
Acknowledgements
The authors thank B. Martins and H. de la Caffinière for their technical assistance during the PET scans, C. Crouzel and the chemical staff for the synthesis of the [18F]fluoro-DOPA, and V. Brulon and P. Merceron for the management of the PET machine.