
Abstract
The hypothesis was tested that hypoperfused brain regions, such as the ischemic penumbra, are detectable by reductions in absolute transverse relaxation time constant (T2) using magnetic resonance imaging (MRI). To accomplish this, temporal evolution of T2 was measured in several models of hypoperfusion and focal cerebral ischemia in the rat at 9.4 T. Occurrence of acute ischemia was determined through the absolute diffusion constant Dav = 1/3Trace [double overline] D, while perfusion was assessed by dynamic contrast imaging. Three types of regions at risk of infarction could be distinguished: (1) areas with reduced T2 (4% to 15%, all figures relative to contralateral hemisphere) and normal Dav, corresponding to hypoperfusion without ischemia; (2) areas with both reduced T2 (4% to 12%) and Dav (22% to 49%), corresponding to early hypoperfusion with ischemia; (3) areas with increased T2 (2% to 9%) and reduced Dav (28% to 45%), corresponding to irreversible ischemia. In the first two groups, perfusion-deficient regions detected by bolus tracking were similar to those with initially reduced T2. In the third group, bolus tracking showed barely detectable arrival of the tracer in the region where Dav was reduced. We conclude that T2 reduction in acute ischemia can unambiguously identify regions at risk and potentially discriminate between reversible and irreversible hypoperfusion and ischemia.
Keywords
To facilitate the clinical management of acute stroke patients, it is essential to develop imaging modalities that can rapidly and noninvasively identify brain regions at risk of infarction and to differentiate these from areas that are already irreversibly damaged. Animal studies have shown that diffusion-weighted magnetic resonance imaging (MRI) can identify early ischemic changes (Moseley et al., 1990; Moonen et al., 1991; Busza et al., 1992; Minematsu et al., 1992; Knight et al., 1994; Davis et al., 1994; van Bruggen et al., 1994; Hossmann et al., 1994) and that these changes are potentially reversible depending on the length of the ischemic period (Davis et al., 1994; Miyabe et al., 1996; Pierpaoli et al., 1996). However, recent results in the clinical setting (Fisher et al., 1995; Welch et al., 1995; Warach et al., 1996; Sorensen et al., 1996; Marks et al., 1996; Ulug et al., 1997) indicate that areas of reduced diffusion generally progress to infarction, probably owing to the duration of the occlusion before the initiation of clinical management. It is therefore possible that the potentially salvageable ischemic penumbra is restricted to areas of reduced flow. These hypoperfused areas can in principle be assessed by dynamic contrast MRI (Hamberg et al., 1993; Kucharczyk et al., 1993; Guckel et al., 1994; Muller et al., 1995; Rother et al., 1996), but this approach is somewhat invasive and also insensitive because of limitations in image time resolution.
Several groups have reported reductions in signal intensities in T2*- and T2-weighted MR images at the onset of ischemia (de Crespigny et al., 1992; Ida et al., 1994; van der Toorn et al., 1994; Roussel et al., 1995). These phenomena is of opposite sign to the well-known signal increase with irreversible ischemia (Bose et al., 1988) and has been tentatively explained in terms of the socalled blood-oxygenation-level-dependent (BOLD) effect (Ogawa et al., 1990). The BOLD effect is caused by changes in hemoglobin oxygenation, which, in turn, changes the MRI relaxation rates (Thulborn et al., 1982; Fabry and San George, 1983). We recently (van Zijl et al., 1998) derived quantitative expressions for the sensitivity of BOLD-MRI spin echo signals to changes in cerebral blood flow (CBF), blood volume (CBV), and oxygen metabolism (CMRO2). The equations show that the fraction of deoxygenated hemoglobin (xdeoxy) in the microvasculature increases with reducing arterial oxygenation fraction (Ya) or increasing oxygen extraction fraction (OER):

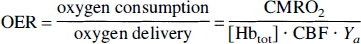
in which [Hbtot] is the total hemoglobin concentration in blood (proportional to the hematocrit) and mi = 0, 0.5, and 1 for arterioles (a), capillaries (c) and venules (v), respectively (van Zijl et al., 1998). These equations indicate that areas of reduced CBF, but normal Ya, CMRO2, and hematocrit, should give an average increase in deoxyhemoglobin concentration, leading to a reduction in absolute T2 and T2*. Therefore our hypothesis in this study was that areas of hypoperfusion should be detectable by small reductions in absolute T2, even before changes in diffusion become apparent. To test this hypothesis, we evaluated several models of focal ischemia, with different levels of perfusion and ischemic injury, and quantified the early reductions in T2 with respect to the contralateral brain regions. Occurrence of acute ischemia was determined through the absolute diffusion constant Dav = 1/3Trace [double overline] D, while perfusion changes were assessed by dynamic contrast imaging. The results show that decreased absolute T2 can indeed serve as an additional inherent indicator for areas of impaired perfusion and, in combination with diffusion imaging, can better define regions at risk of infarction in acute stroke.
METHODS
Animals
Male Wistar rats (180 to 200 g) were anesthetized with 1.5% halothane in 70%/30% N2O/O2 for surgery, after which the anesthetic was switched to α-chloralose (slow bolus of 80 mg/kg intravenously followed by hourly injections of 40 mg/kg). Arterial blood gases and pH were analyzed (ABL-5, Radiometer Inc., Copenhagen, Denmark) before and during focal ischemia, as well as during recovery. Body temperature was monitored on-line during surgery and MRI and maintained close to 37°C by a feedback-controlled heating blanket or by blowing warm air.
Different models of focal ischemia were used to produce different levels of perfusion defect. The physiologic variables for these groups are indicated in Table 1. To induce mild cortical hypoperfusion, the middle cerebral artery (MCA) of spontaneously breathing rats was permanently electrocoagulated between the corticostriate artery and the main branch of the MCA using open craniotomy (n = 6). Unlike the approach of Chen and coworkers (1986), the common carotid arteries (CCA) were not occluded to keep collateral flow above the threshold level of irreversible brain injury in large areas of cerebral cortex, thus deliberately avoiding large cortical infarcts. Two animals underwent the same procedure but instead of the MCA a small arteriole branching from the MCA was occluded, and these rats served as a sham-operated group for the hypoperfusion studies. To induce more severe hypoperfusion and focal ischemia, the MCA was transiently occluded as described by Longa et al. (1989). Briefly, either the left or right CCA was exposed through a midline cervical incision under halothane anesthesia. A nylon thread (∅ 0.22 mm) was inserted into one CCA until it reached the opening of the anterior communicans artery, and occlusion was maintained for 90 minutes. Both spontaneously breathing (n = 6) and ventilated (n = 6) animals were used to achieve two different levels of ischemia. A Harvard Instruments (Boston, MA, U.S.A.) small animal ventilator was used with a stroke volume of 1.8 mL and 70 to 80 strokes/minute through an open tracheostomy without muscle paralysis. These procedures were chosen to control PaCO2, which regulates CBF (Kety and Schmidt, 1948; Reivich, 1964). The animals from the spontaneously breathing group were allowed to recover for 24 hours to quantify infarct volume by MRI.
Physiologic variables at different time points during experiments
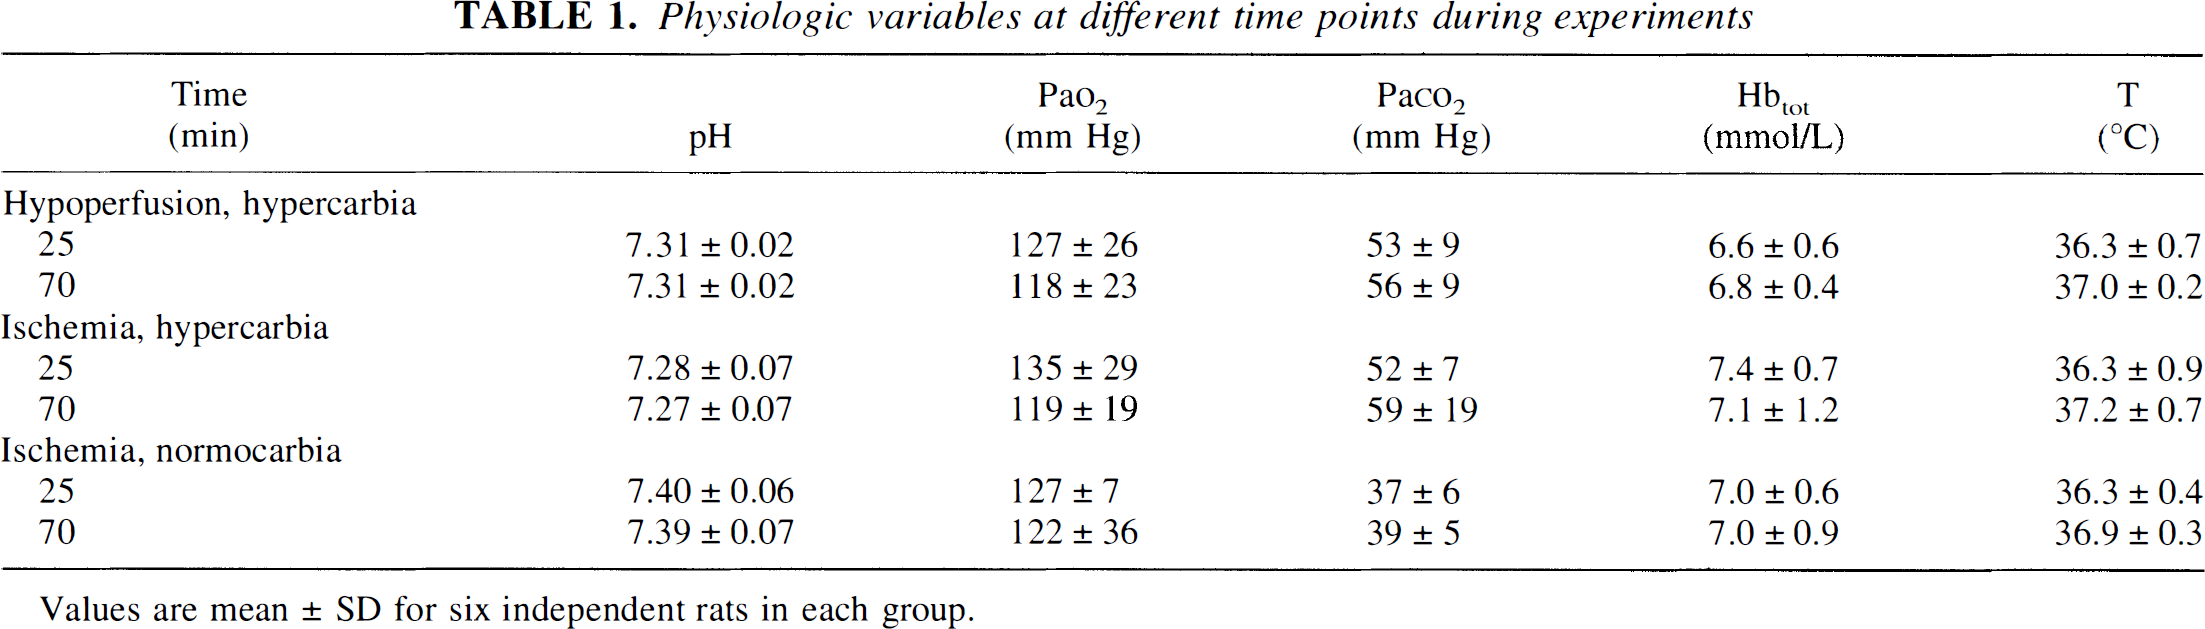
Values are mean ± SD for six independent rats in each group.
Magnetic resonance imaging
Magnetic resonance imaging experiments were performed using a 9.4 T vertical magnet and bore size of 89 mm (Oxford Instruments, Oxford, U.K.), equipped with actively shielded field gradients (Magnex Scientific Ltd, Abdington, U.K.) interfaced to an SMIS console (Surrey Medical Imaging Ltd, Guildford, U.K.). A single loop surface coil (diameter 28 mm) was used for signal transmission and reception.
Measurement of absolute T2
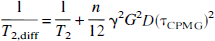
The measurement of absolute T2 values is not straightforward, and there are many different approaches that may give very different results. To optimize the experiment for the effects to be measured, it is therefore necessary to first provide some general background about this relaxation parameter when measured for protons in water. In a multicompartment system, such as in vivo in which there are many structures, including intracellular and extracellular spaces, as well many macromolecular structures (proteins, membranes, etc.), the measured T2 is an average over all sites seen by the protons during the time of the nuclear magnetic resonance (NMR) measurement. For a Carr-Purcell-Meiboom-Gill (CPMG) multiple spin echo sequence under the conditions of fast exchange, the relaxation rate measured in the volume of interest is (Luz and Meiboom, 1963; Allerhand and Gutowski, 1964):
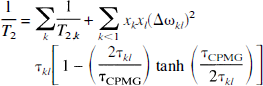
in which τkl is the life time between exchanges and xk denotes the fraction of water space occupied by site k. The summation is over all sites (compartments, structures) that the water proton experiences and the term on the right-hand side describes the field-dependent contribution of proton exchange to the transverse relaxation, in which the quadratic field dependence comes from the susceptibility shift difference between the different sites (Δω). This phenomenon has been well described (Rabenstein, 1984; Winkler and Michael, 1985) and causes a strong reduction in T2 on going to higher field when using a Hahn spin echo sequence. The time τCPMG is the time for a single echo refocusing in a CPMG experiment, where echo time (TE) = nτCPMG, and n is the number of echoes (or 180° pulses). When n becomes large and τCPMG very small, the exchange contribution becomes negligible. When using a single spin echo (generally referred to as a Hahn echo), the effect is maximized and TE = τCPMG. In addition to Equation 3, there may be an effective reduction of T2 caused by diffusion of water protons through local magnetic field gradients, with some also caused by local susceptibility differences. The apparent T2 measured are then given by (Hahn, 1950; Carr and Purcell, 1954):
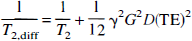
for a single spin echo
for a multiecho experiment.
In a multiecho sequence this effect therefore reduces, but not as much as the exchange effect. As far as the BOLD effect is concerned, several explanations have been forwarded. Using simulations and only the field gradient theory (Kennan et al., 1994; Weisskoff et al., 1994), it was concluded that the spinecho BOLD effect is mainly intravascular. However, the assumption of attributing the spin-echo BOLD effect to local field gradients has been shown to be invalid in pure blood by Bryant et al. (1990), who measured the TE-dependence of T2 and found that Equation 3 describes the majority of the effect at 1.5 T. Data by other groups at fields as high as 4.3 (Thulborn et al., 1982) and 4.7 T (Gilles et al., 1995) are also in agreement with this, and using only the exchange contribution we recently successfully quantified the spin-echo BOLD effect (van Zijl et al., 1998), which is the basis for the experiments described in this article.
It is important to realize the different possible measures of a “true T2” using multiecho or single-echo sequences based on Equation 3. In addition (see Equation 4 and Equation 5), the apparent reduction of T2 measured by spin echo sequences caused by diffusion through field gradients is an incoherent effect leading to signal reduction (termed as T2,diff), which should not be confused with T2* (the effective T2), which includes T2,diff and the contributions of coherent dephasing caused by the presence of local field inhomogeneities and susceptibility differences.
To obtain the maximum spin-echo BOLD effects (Thulborn et al., 1982; van Zijl et al., 1998), we therefore acquired absolute T2 maps by combining Hahn spin-echo data (repetition time TR = 1500 milliseconds) obtained at multiple echo times (TE), namely 20, 40, 60, 80, and 100 milliseconds. We used four dummy scans, a field of view (FOV) of 35 mm, matrix size of 128 × 64, slice thickness of 1.5 mm, and an adiabatic BIR-4 refocusing pulse (Garwood and Ke, 1991). Diffusion losses caused by the imaging gradients were minimized by placing the slice-rephase and readout-dephase gradients directly next to the initial slice selection and readout gradients, respectively, and by positioning the phase encode gradients directly before the readout.
Measurement of diffusion constants
Absolute diffusion images were obtained using a spin-echo sequence (TR = 1800 milliseconds, TE = 70 milliseconds, FOV = 35 mm, matrix size of 128 × 64, slice thickness of 1.5 mm) with eight bipolar gradient pairs in each direction. This achieves weighting by the trace of diffusion tensor (Dav = 1/3Trace [double overline] D) in a single acquisition (Mori and van Zijl, 1995), which is independent of orientation (van Gelderen et al., 1994; Basser et al., 1994; Miyabe et al., 1996) and thus removes anisotropic effects that may cause reproducibility problems between different animals or different laboratories. Data from four acquisitions with different diffusion weighting (b values ranging from 0 to 1280 seconds/mm2) were used to calculate the absolute Dav maps.
Perfusion imaging
Perfusion imaging was performed using bolus tracking with a gradient-recalled-echo (GRE) method (TR = 22 milliseconds, TE = 11 milliseconds, FOV = 35 mm, matrix size of 256 × 64, slice thickness of 1 mm) with a temporal resolution of 1.4 seconds/image. Gadodiamide (Omniscan, Nycomed, Oslo, Norway), 0.20 mmol/kg, was rapidly injected into a femoral vein during uninterrupted data acquisition of 35 seconds.
Quantification of infarct volumes by magnetic resonance imaging
The T2-weighted multislice (12 to 14 continuous slices) spin echo imaging for determining ischemic lesion size in spontaneously breathing animals at 24 hours after occlusion was acquired using TR = 2000 milliseconds, TE = 55 milliseconds, matrix size of 128 × 128, FOV of 30 mm, two averages, and a slice thickness of 1 mm.
Data analysis
Absolute T2 and Dav maps were calculated on a pixel-by-pixel basis by fitting the MRI data to a single exponential as a function of TE or as a function of b value, respectively, using a Matlab routine (Mathworks, Natlick, MA, U.S.A.) Regions of interest were analyzed from two different areas of cerebral cortex and one area of caudate putamen both on the ipsilateral and contralateral sides (see Fig. 1).
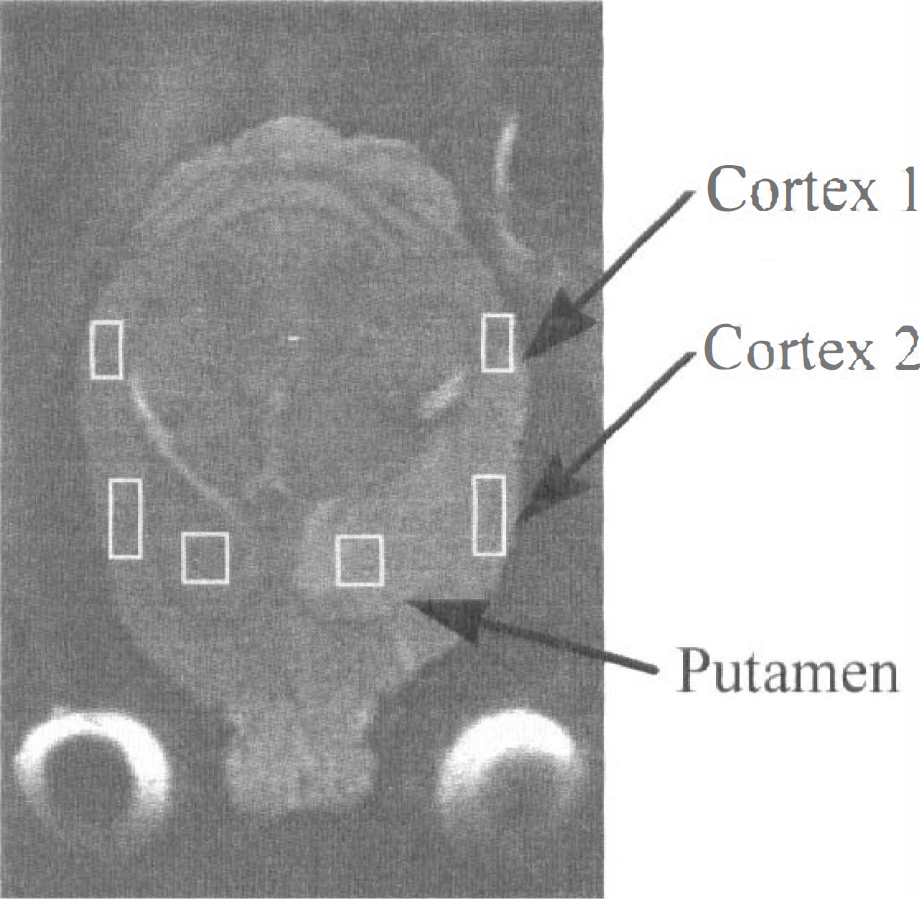
A T2-weighted image 24 hours after induction of transient ischemia indicating brain areas analyzed for T2, Dav, and perfusion.
Signal intensity variations during transit of contrast agent bolus were obtained from regions of interest and transformed into plots of apparent ΔR2* = −ln(S0/S)/TE as a function of time. Numerical fitting of the ΔR2* curve into a gamma variate function (Thompson et al., 1964; Haraldseth et al., 1996) was performed to reduce effects of recirculation and to obtain numerical estimates for hemodynamic parameters. The calculated numerical results should be considered as semiquantitative because rapid tracer recirculation in rats and moderate temporal resolution (1.4 seconds/image) make it difficult to distinguish between delayed first passage and recirculation of the tracer. Therefore, only the peak concentration and bolus arrival of the tracer with respect to the contralateral region are used as the most robust indicators of perfusion.
Stroke volume was calculated by manually delineating hyperintense areas from the T2-weighted multislice data set.
Statistical analysis were performed using Student's t-test with a Bonferroni correction when multiple comparisons were made. All results are mean ± standard deviation.
RESULTS
Hypoperfusion
Using permanent occlusion of a distal part of the MCA in spontaneously breathing rats, we were able to achieve small to negligible alterations of perfusion in the caudate putamen and higher deficits in the cortex. This is clear from Fig. 2A–C, showing a broadening and increasing delay of the ΔR2* curve going from the putamen to cortex 1 and 2. The contralateral Dav values were (0.86 ± 0.05) × 10−3, (0.84 ± 0.04) × 10−3, and (0.86 ± 0.08) × 10−3 mm2/seconds in putamen, cortex 1, and cortex 2, respectively. Dav remained normal in the putamen and cortex 1, but it was reduced in cortex 2 (Fig. 3A). We attribute this to partial spatial overlap of cortex 2 with the permanent occlusion site. This occlusion site developed a cortical lesion of 6.6 ± 0.7 mm3 by 24 hours (Fig. 4A). The contralateral T2 values were 36.1 ± 1.3, 35.9 ± 0.8, and 35.9 ± 0.4 milliseconds in putamen, cortex 1, and cortex 2, respectively. Interestingly, in these rats MCA occlusion resulted in an early T2 shortening by about 3.5 milliseconds in both cortex 1 and 2 areas from the first time point onward, which, by far, extended the size of the lesion at the occlusion site (Fig. 4A). The cortical region with persistently low T2 was very similar to that with a perfusion defect indicated by the dynamic Gd image (see Fig. 4A).
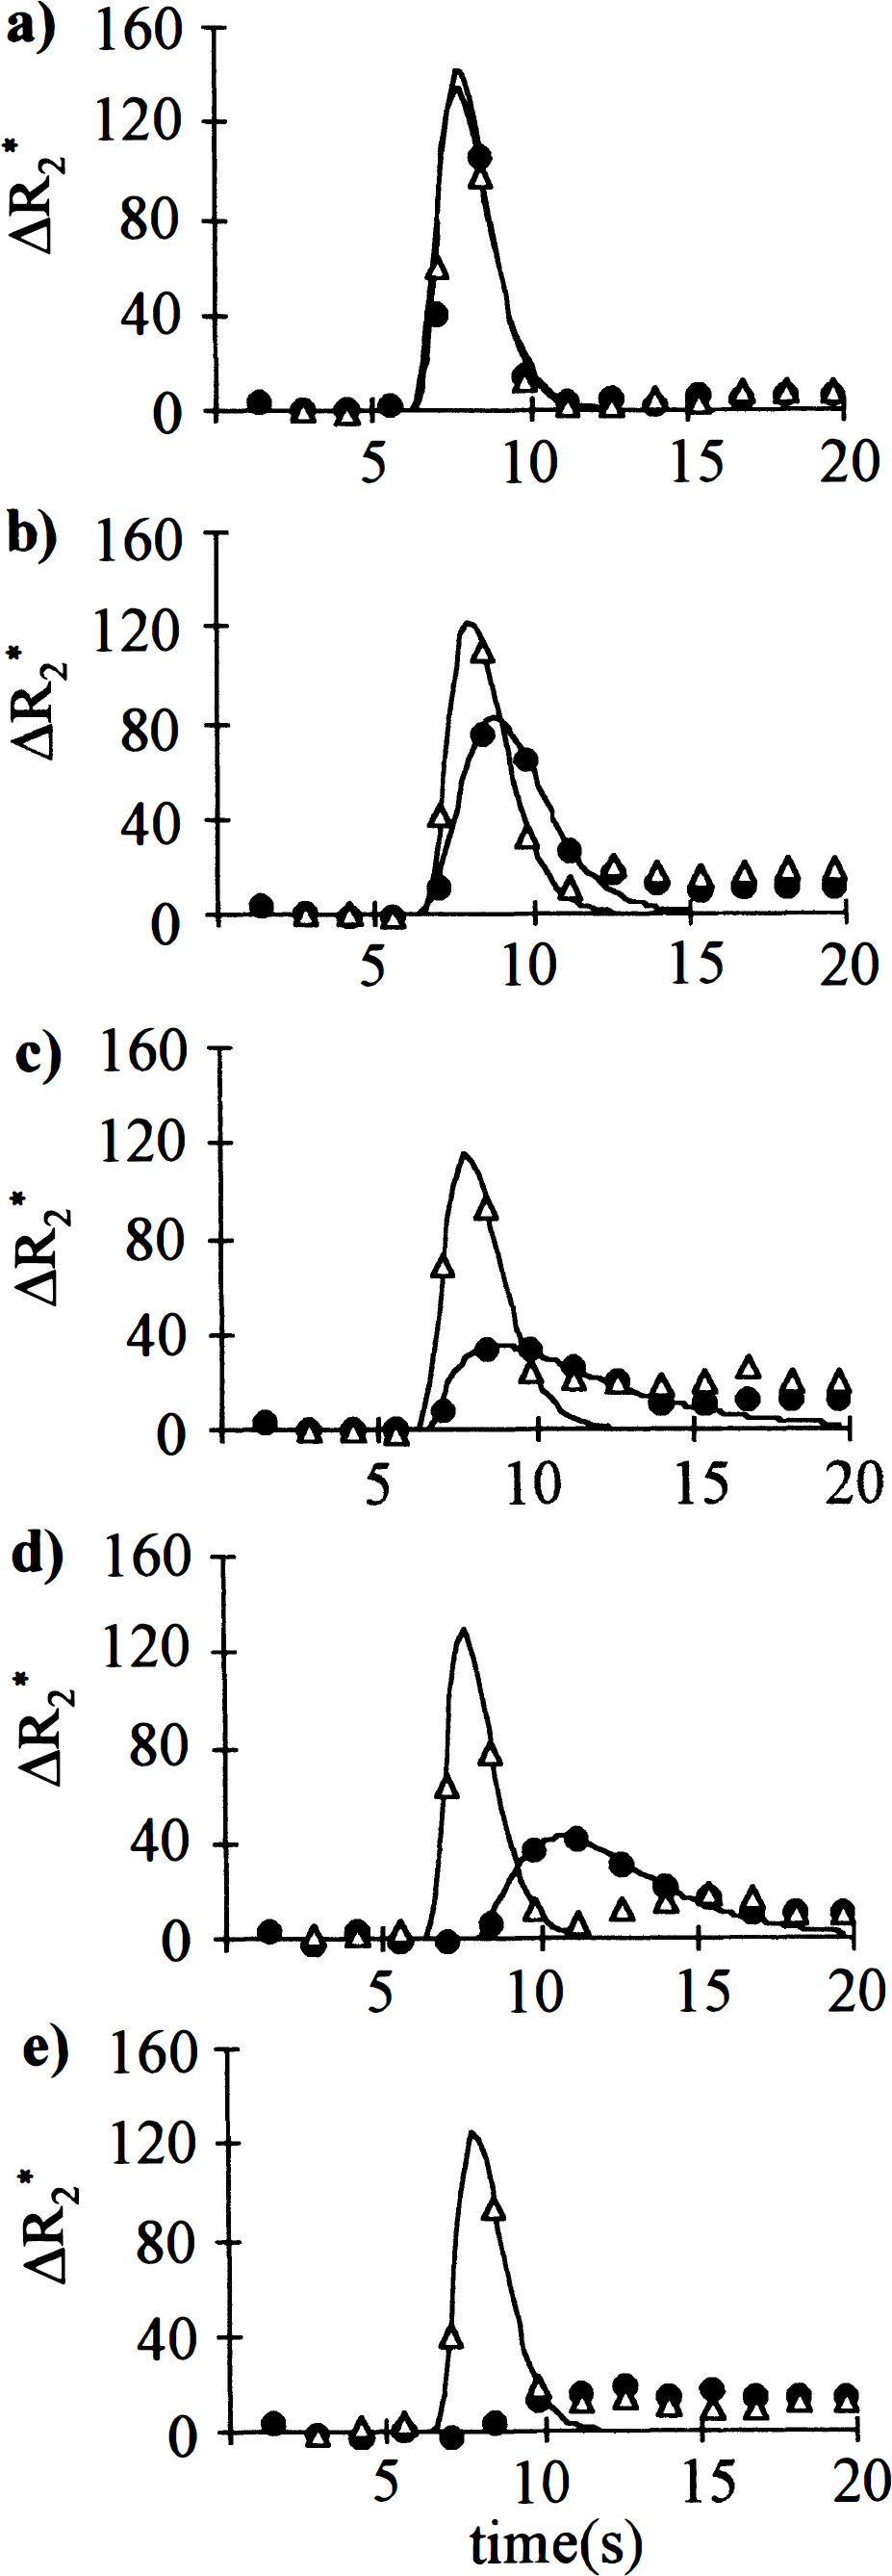
ΔR2*-time curves after injection of gadodiamide. Perfusion imaging was performed with a GRE method, and gadodiamide injected and data processed as described in the methods section.
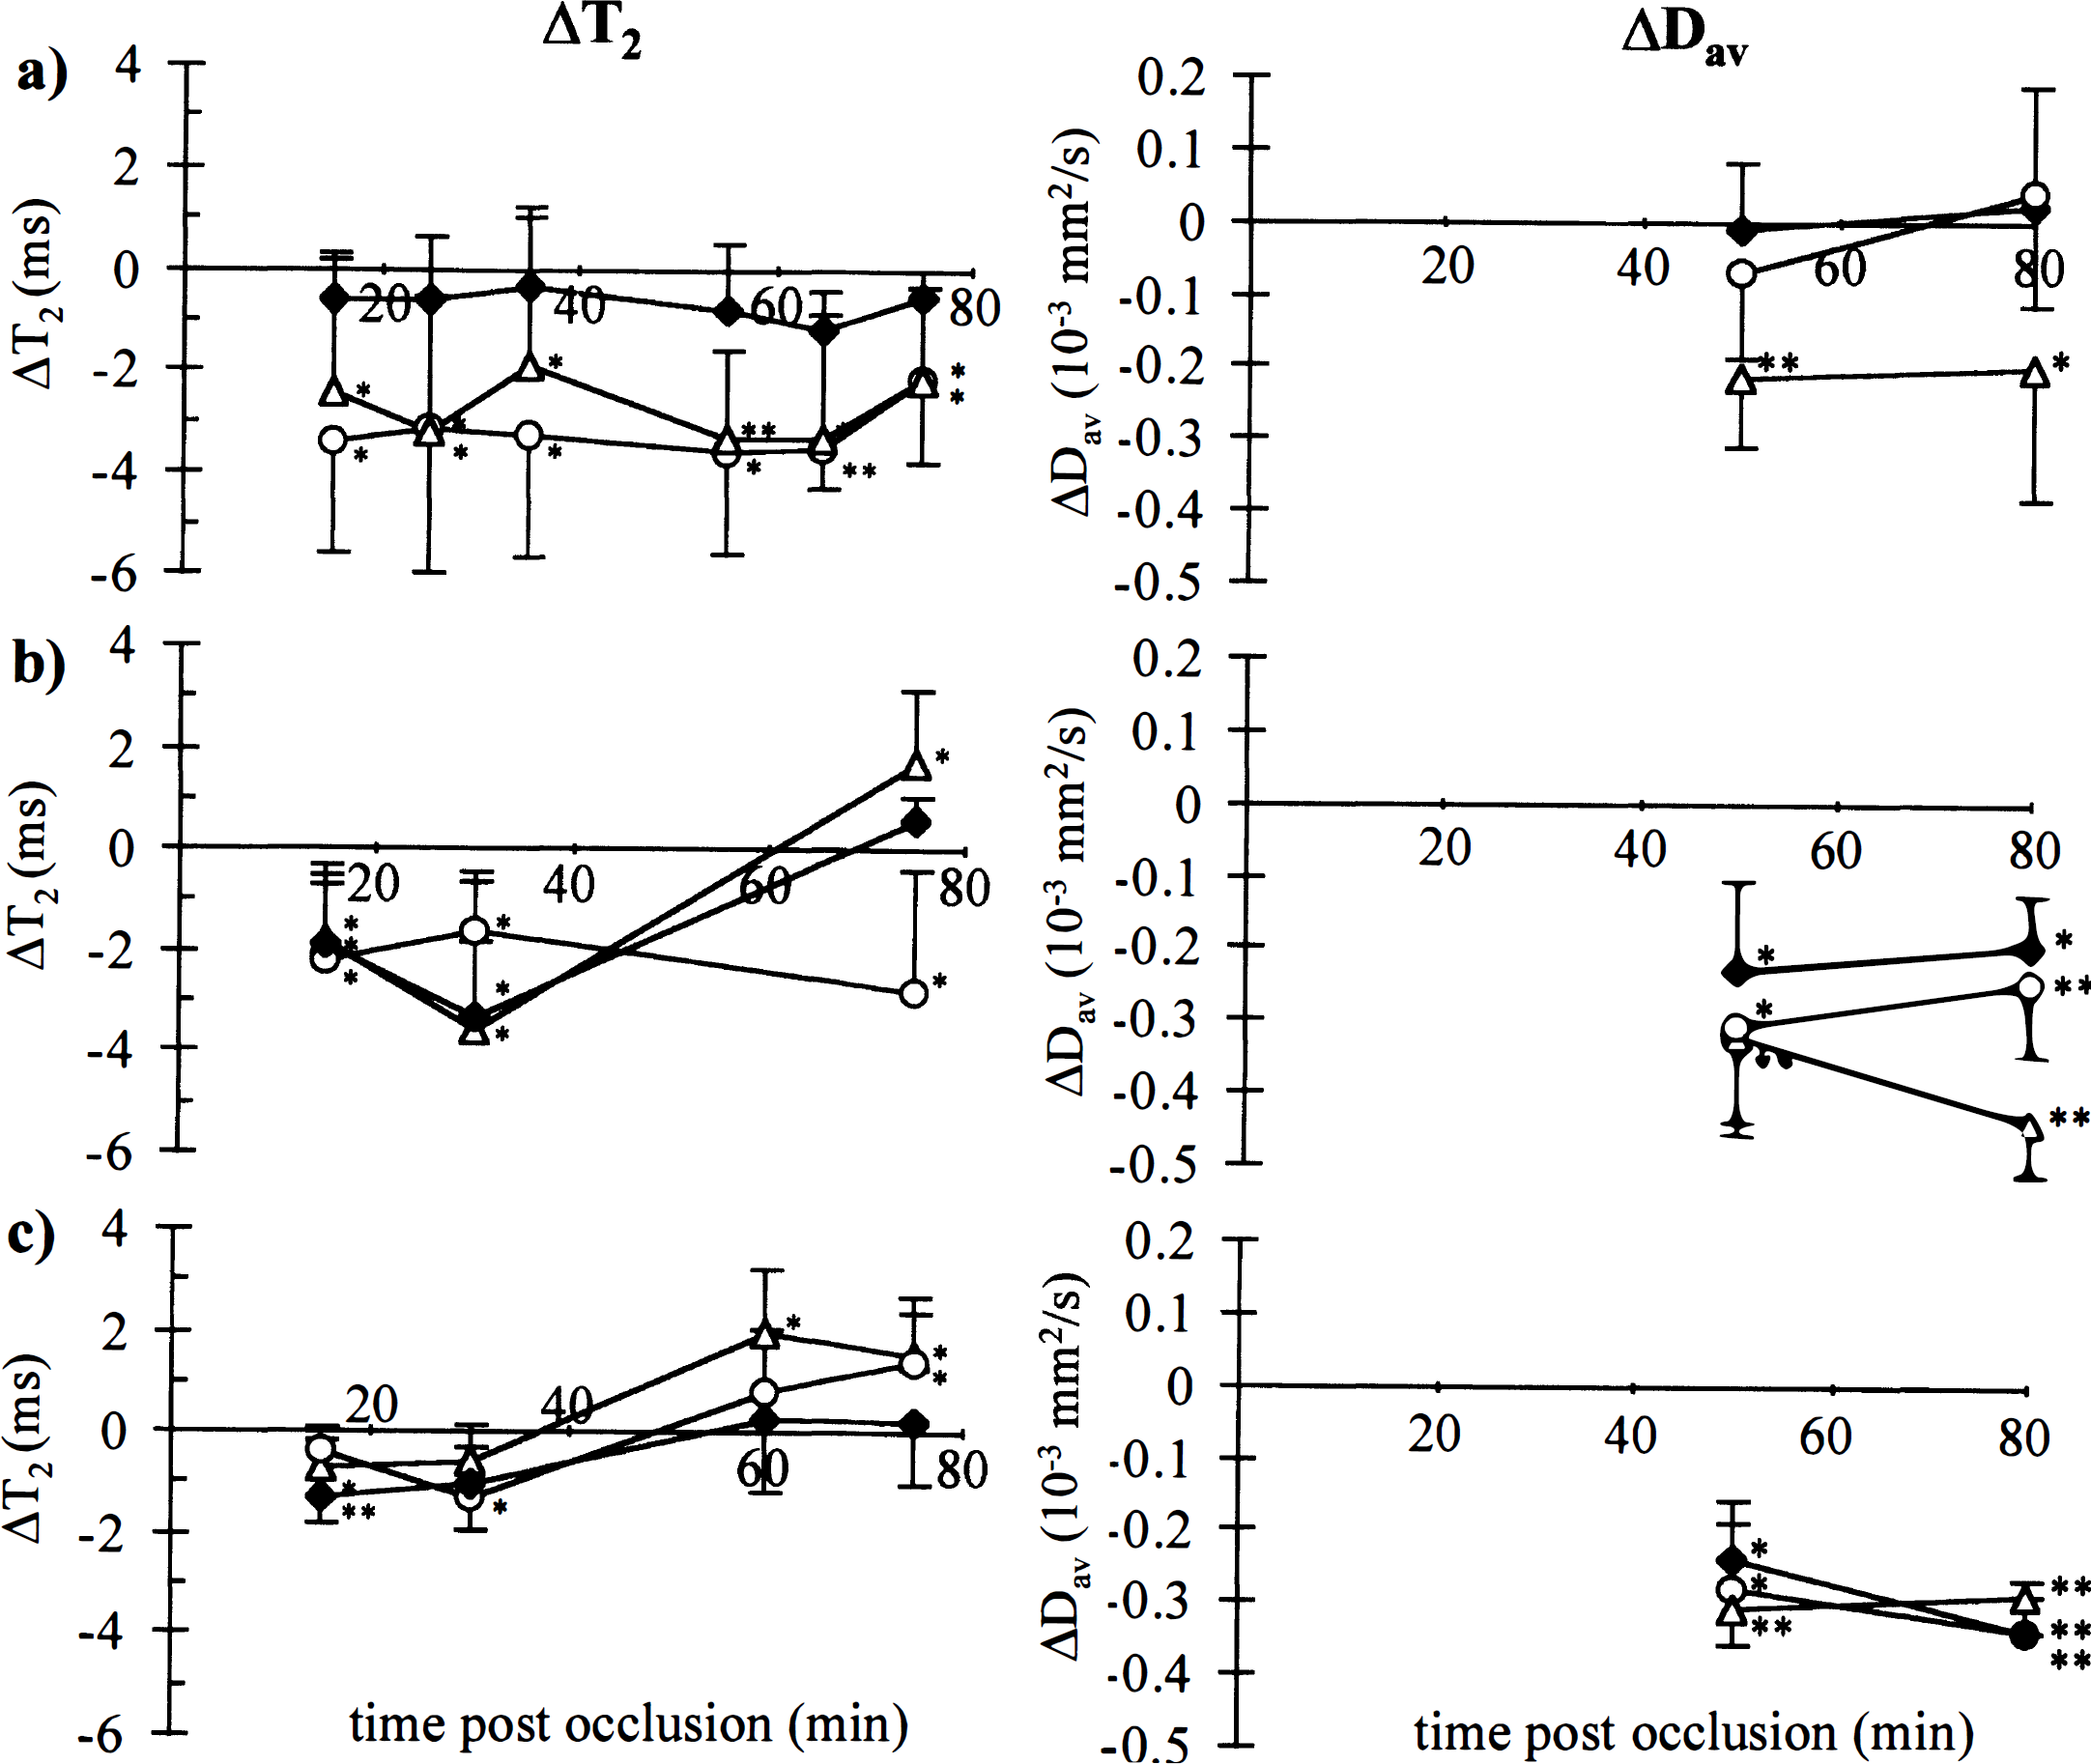
ΔT2 and ΔDav in the rat brain. ΔT2 (left panel) and ΔDav (right panel) after
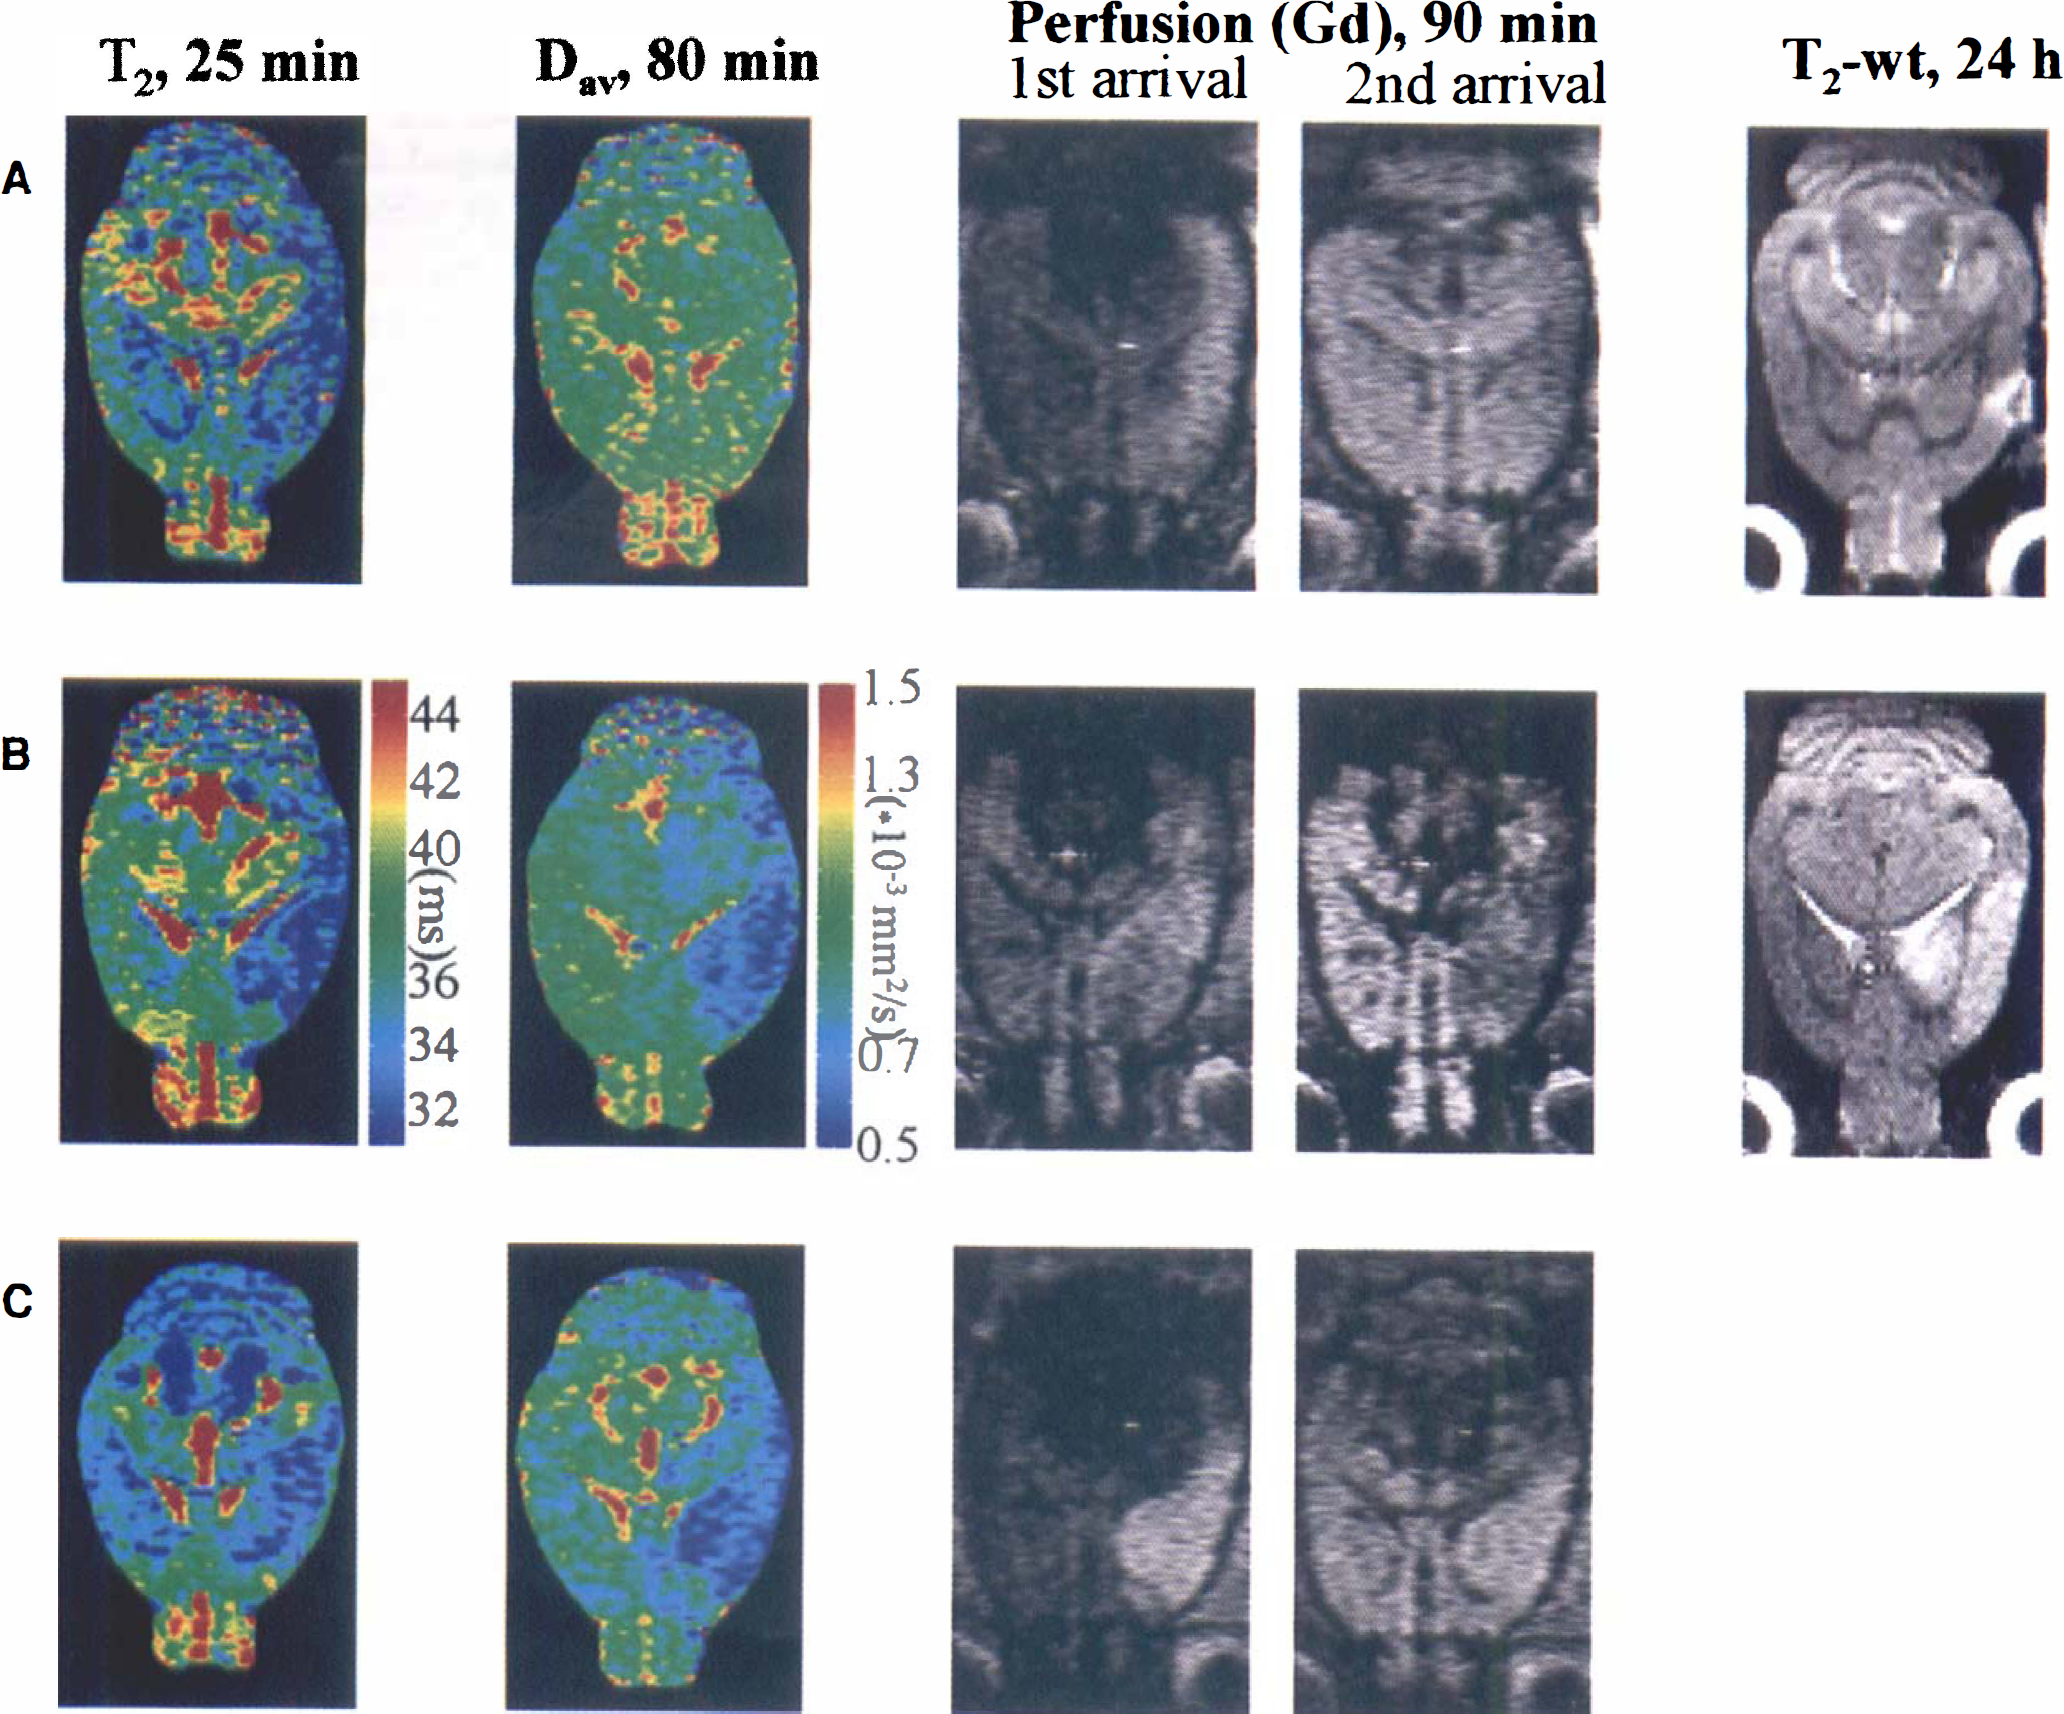
Representative T2 and Dav maps, perfusion, and T2-weighted (T2-wt) images from rat brain. Parametric maps are acquired at time points shown, and calculated as described in the methods. Perfusion images are selected to illustrate arrival of Gd bolus to contralateral (1st arrival) and ipsilateral (2nd arrival) side. T2-weighted (TE = 55 milliseconds) images show the stroke lesion 24 hours later. Groups are as follows:
In the sham-operated animals, no differences in T2, Dav, or perfusion were detected between ipsilateral and contralateral sides, except for a small area (<3 mm3) at the site of occlusion. In these animals an area of T2 hyperintensity appeared at 24 hours, similar to the occlusion site in the permanent ischemia animals. We attribute this to mechanical and thermal damage caused by craniotomy and electrocoagulation, respectively.
Transient focal ischemia
To achieve different levels of hypoperfusion and ischemia, we used two groups, namely spontaneously breathing and ventilated animals. During MCA occlusion, PaCO2 increased to 52–59 mm Hg in the spontaneously breathing animals (Table 1), leading to slight acidification. Because hypercarbia increases CBF (see Traystman, 1997) different results are expected than in mechanically ventilated animals, in which blood gases and pH remained at physiologic levels during ischemia (Table 1). All other physiologic parameters were similar between the two groups.
Ischemia and hypercarbia. In the spontaneously breathing animals perfusion was clearly impaired in all analyzed areas of the brain during occlusion. Arrival of the bolus was delayed and ipsilateral to contralateral ratios of the maximum concentration of contrast agent (Cpeak) were well below unity (Table 2, Fig. 2D). The contralateral Dav values were (0.91 ± 0.07) × 10−3, (0.86 ± 0.09) × 10−3, and (0.86 ± 0.11) × 10−3 mm2/seconds in putamen, cortex 1, and cortex 2, respectively. Ipsilaterally, Dav was reduced in all the regions by 0.20 to 0.44 × 10⁻³ mm2/seconds (Fig. 3B) both at 50 and 80 minutes of occlusion. Stroke volume determined at 24 hours of reperfusion from T2-weighted images was 149 ± 17 mm3. The contralateral T2 values in putamen and cortices 1 and 2 were 36.2 ± 0.5, 35.9 ± 0.7, and 35.9 ± 0.7 milliseconds, respectively. Relative to these values, T2 in the ipsilateral cortex and putamen changed in a different manner with time (Fig. 3B). Cortex 2 and putamen both showed reduced T2 by 1.5 to 3.5 milliseconds for the first 40 to 50 minutes followed by a return to levels that were similar or greater than determined in the contralateral hemisphere (Fig. 3B). In cortex 1, T2 stayed lowered throughout the 80 minutes of ischemia. Similar to the hypoperfusion case, the cortical region with persistently low T2 resembled that with a perfusion defect indicated in the dynamic Gd-image (Fig. 4B). This region appeared to be larger than the region with reduced Dav, which was larger than or similar in size to the final stroke volume determined 24 hours later (Fig. 4B).
Brain hemodynamic parameters from perfusion imaging
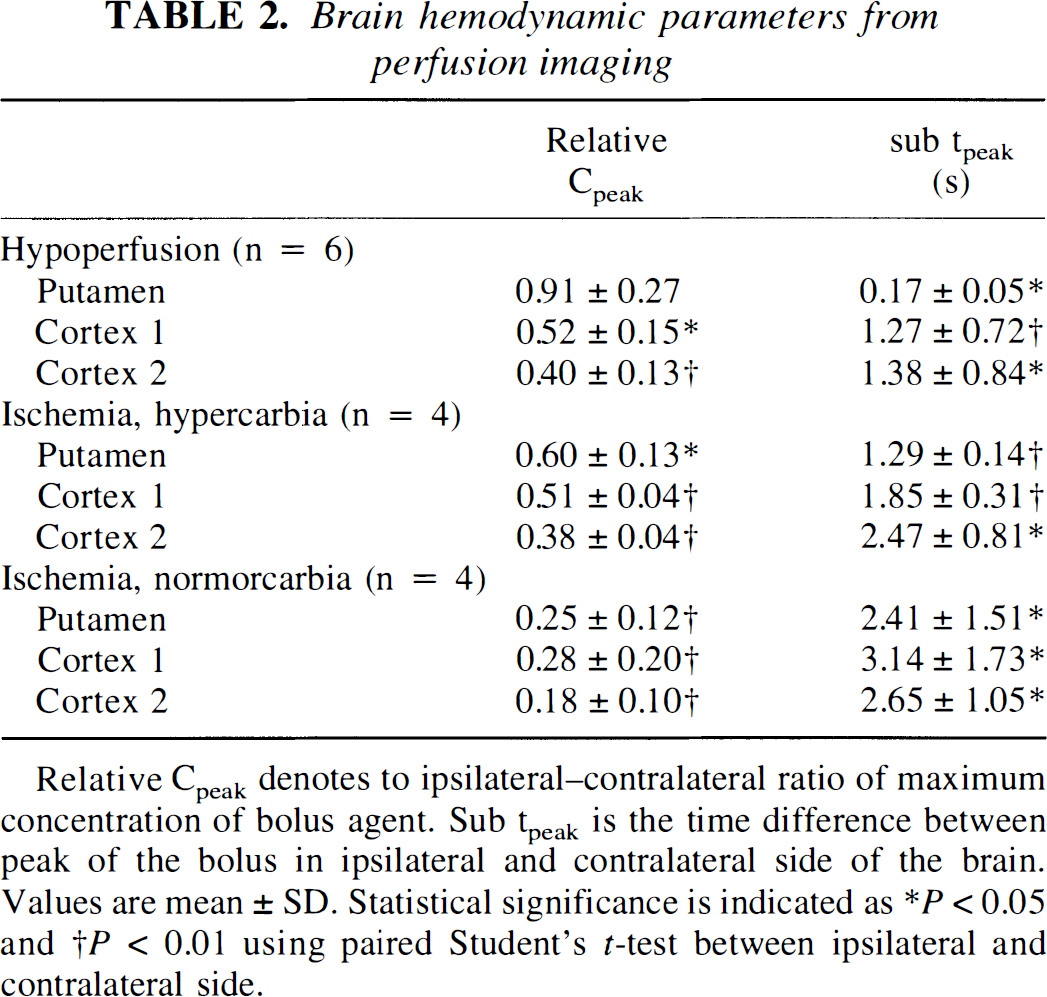
Relative Cpeak denotes to ipsilateral—contralateral ratio of maximum concentration of bolus agent. Sub tpeak is the time difference between peak of the bolus in ipsilateral and contralateral side of the brain.
Values are mean ± SD. Statistical significance is indicated as ∗ P < 0.05 and † P < 0.01 using paired Student's t-test between ipsilateral and contralateral side.
Ischemia and normocarbia. In the ventilated rats, the perfusion defect induced by MCA occlusion was more severe than in spontaneously breathing animals (Fig. 2E, Table 2). The contralateral Dav values were (0.80 ± 0.07) × 10−3, (0.81 ± 0.03) × 10−3, and (0.81 ± 0.10) × 10−3 mm2/seconds in putamen, cortex 1, and cortex 2, respectively. At the 50-minute time point, the ipsilateral Dav values in these ventilated animals were ischemic and comparable in magnitude with those in the spontaneously breathing rats (Fig. 3C), and remained reduced at the 80-minute time point. The contralateral T2 values in putamen and cortices 1 and 2 were 34.8 ± 0.5, 34.3 ± 1.1, and 34.3 ± 0.9 milliseconds, respectively. These are significantly shorter than in spontaneously breathing animals and are supportive to our hypothesis of reduced T2 in areas with reduced perfusion. Within the group of ventilated animals, an ipsilateral reduction of T2 by 0.4 to 1.3 milliseconds compared with contralateral was observed during the first 35 minutes of ischemia in all three brain regions (Fig. 3C). A subsequent increase in T2 similar to that of spontaneously breathing rats was evident, indicating progression to irreversible damage. Perfusion imaging highlighted an area that appeared to be similar to the region displaying decreased T2 and Dav (Fig. 4C).
DISCUSSION
The present results demonstrate that T2 is reduced during hypoperfusion and during the initial period of ischemia (Figs. 3 and 4). The latter is apparently at variance with the current concept of stroke imaging, in which this relaxation parameter is used to determine infarct volumes (Bose et al., 1988; van Bruggen et al., 1994). It is generally accepted that T2 remains unchanged for the first hours of ischemia before increasing irreversibly on infarction. We attribute this apparent contradiction to two facts. First, and importantly, clinical imaging uses T2-weighted imaging, which might not be sensitive enough to detect small changes on the order of a few percent in T2. Although the T2 changes reported here at 9.4 T are as high as 10%, they were not obvious in the T2-weighted images and thus, may not be detectable in such images at low fields (1 to 2 T). However, reports describing reduced signal intensity in T2-weighted MRI in subacute stroke patients have been published (Asato et al., 1991; Scuotto et al., 1997). Second, many investigators use multiecho sequences to measure T2, which will reduce the BOLD effect (Equations 3, Equation 4 and Equation 5). Experimental support for our results comes from recent works showing that BOLD-type T2*-weighted MRI can also reveal areas of low signal intensity in animal models of stroke (de Crespigny et al., 1992; Roussel et al., 1995; Ono et al., 1997). Roussel and coworkers (1995) showed that these areas of low signal intensity extend beyond the area of lowered diffusion, in agreement with our results on reduced T2. Although T2 effects are generally smaller than T2* effects in BOLD imaging (Bandettini et al., 1994), T2 imaging has several advantages over T2*-weighted MRI, including insensitivity to static field inhomogeneity and local susceptibility variations in the tissue, thus simplifying contralateral comparisons.
As noted in the introduction, we attribute the drop in T2 during hypoperfusion to a BOLD-type effect, in which the concentration of deoxyhemoglobin increases in areas of reduced flow (Equation 1 and Equation 2). There are several pieces of supporting evidence for this effect. When comparing the normocarbic and hypercarbic T2 values in the contralateral hemisphere, a clear increase in T2 in hypercarbia is found (as much as 1.7 milliseconds). Substantial increases in T2* with hypercarbia have also been demonstrated in humans (Rostrup et al., 1994) and animals (Ono et al., 1997). CO2 is a well-characterized regulator of CBF (Kety and Schmidt, 1948; Reivich, 1964; Traystman, 1997), and the increase in T2 is expected to be caused by higher CBF and a concomitant decrease in deoxyhemoglobin fraction (Equation 1) in the hypercarbic animals (van Zijl et al., 1998). Second, the areas of reduced T2 in the three models appear to be similar to the regions of reduced perfusion in the Gdbolus-tracking images (Fig. 2). Finally, the validity of Equation 1 has recently been demonstrated for hypoxic hypoxia (van Zijl et al., 1998), in which the OER remains constant, but a reduction in oxygen saturation (Ya) leads to an increase in deoxyhemoglobin. Hypoxia's effects on T2* are well-known to occur both in animals (Ogawa and Lee, 1990) and humans (Rostrup et al., 1995).
It is important to point out, however, that this principle only applies in situations in which basic hemodynamic flow-volume relationships still apply, such as in mild hypoperfusion. Exact quantitative interrelationships of CBF, CBV, and OER in hypoperfusion are not known, but there appears to a phase when the oxidative metabolism is unaffected, yet dependency between CBF and CBV breaks down (Powers, 1991). As perfusion further decays and energy failure develops, it is unclear what the exact pathologic meaning of T2 would be. Therefore the importance of the measurement of a reduction in T2 is that it provides a signature of hypoperfusion or very acute ischemia, thereby extending the detection limit beyond that provided by diffusion imaging. From our results, the following order of hemodynamic and MRI events can be ascribed in an ischemic insult. Cerebral blood flow reduction owing to vascular blockage causes an OER increase (Equation 2), leading to elevated deoxyhemoglobin (Equation 1) and the BOLD effect. These hemodynamic conditions prevail in the cerebral cortex of the “hypoperfusion” model, in which the residual CBF and elevated OER are sufficient to maintain oxygen supply, and consequently, energy status and the tissue is expected to be salvageable. On further reduction of flow, energy failure results and regions of low Dav develop within the area of reduced T2. Although this phase is initially reversible (Davis et al., 1994; Pierpaoli et al., 1996), the area is at great risk and the reversibility reduces as time goes on (Miyabe et al., 1996; Pierpaoli et al., 1996). Because infarction leads to an increase in T2, areas of irreversible damage can be assigned by combining T2 and Dav imaging (Knight et al., 1994; Welch et al., 1995; Warach et al., 1995). Presently, MRI stroke diagnosis therefore has two signatures, namely irreversible, i.e., increased T2 and decreased or normal Dav, and potentially-reversible, i.e., normal T2 and reduced Dav. Our experiments show that the signatures can be made more specific by careful measurements of pure T2 values in the acute phase of the insult. Using this knowledge, the following three signatures should be used: (1) reduced T2 and unchanged Dav, indicating hypoperfusion and thus risk of infarction; (2) reduced T2 and reduced Dav, indicating acute ischemia and great risk of infarction; and (3) normal or elevated T2 and reduced Dav, indicating progression to infarction.
These three stages are clear from the different ischemia models used in our study (Fig. 3). In the permanent MCA occlusion model, an effective hypoperfusion is produced covering almost the entire MCA territory. This hypoperfused region is apparently similar to the area of low T2 for the complete observation period. In this “hypoperfusion” model, a decrease in Dav does not extend outside a small core, and stroke develops only to the area with initially low Dav. This cortical region with low T2 and perfusion, yet unchanged Dav, is comparable to a “reversible penumbra,” in which oxygen and glucose supply are sufficient to maintain energy metabolism above the threshold of ionic failure (see Busza et al., 1992; Hara et al., 1993; van Bruggen et al., 1994; Hossmann and Hoehn-Berlage, 1995). The second combination (“signature”) of T2 and Dav is detected in the brain regions surrounding the core in the transient stroke model, in which energy failure has reduced Dav (Moseley et al., 1990; Busza et al., 1992; Miyabe et al., 1996), but the residual flow (probably on the order of 10 to 15 mL · 100 g−1 · minute−1 [see Hossmann and Hoehn-Berlage, 1995]) can partially supply oxygen and other substrates for the tissue. The chance of reversing this ischemia lessens with prolonged duration of the insult (Memezawa et al., 1992; Miyabe et al., 1996; Pierpaoli et al., 1996). This notion is supported by a previous study of interrelationships between CBF, DC potential, apparent diffusion constant, and lactate (Gyngell et al., 1995). This second signature of T2 and Dav, once found in the brain, would imply that a certain time window exists for therapeutic interventions. The third signature, i.e., normal or elevated T2 and reduced Dav, was already encountered early in our normocarbic model of ischemia, in which the Gd imaging showed negligible perfusion of the relevant areas of the ipsilateral cortex. We conclude that the small reduction of T2 in this model is genuine and initial increase of T2 after the maximum reduction, which should have occurred during the first minutes of induced ischemia when we were not yet able to perform NMR measurements is a sign of BOLD effect.
In conclusion, we have extended the specificity of T2 and Dav imaging to better identify the type of tissue (low risk, high risk, and irreversibly damaged) in acute focal ischemia models of rat. To fully quantify these interrelations, direct correlations of CBF, CBV, and OER to the absolute values of T2 during hypoperfusion and in the early phase of ischemia are required, e.g., using the physiologic relationships recently demonstrated to apply to hypoxia and functional MRI (van Zijl et al., 1998).
Footnotes
Acknowledgements
The authors thank Dr. Erkki Koski for advice in animal anesthesia and Ms. Nanna Huuskonen for expert technical assistance.