
Abstract
Diffusion in the extracellular space (ECS) is important in physiologic and pathologic brain processes but remains poorly understood. To learn more about factors influencing tissue diffusion and the role of diffusion in solute-tissue interactions, particularly during cerebral ischemia, we have studied the kinetics of several radiotracers in control and hypoxic 450-μm hippocampal slices and in 1,050-μm thick slices that model the ischemic penumbra. Kinetics were analyzed by nonlinear least squares methods using models that combine extracellular diffusion with tissue compartments in series or in parallel. Studies with 14C-polyethylene glycol confirmed prior measurements of extracellular volume and that ECS shrinks during ischemia. Separating diffusion from transport also revealed large amounts of 45Ca that bind to or enter brain as well as demonstrating a small, irreversibly bound compartment during ischemia. The rapidity of 3H2O entry into cells made it impossible for us to distinguish intracellular from extracellular diffusion. The diffusion-compartment analysis of 3-O-methylglucose data appears to indicate that 5 mmol/L glucose is inadequate to support glycolysis fully in thick slices. Unexpectedly, the diffusion coefficient for all four tracers rose in thick slices compared with thin slices, suggesting that ECS becomes less tortuous in the penumbra.
Diffusion through the extracellular space (ECS) plays an important role in many physiologic and pathologic processes of the CNS. Despite this, there are still relatively few methods available to study ECS diffusion in brain and spinal cord (Nicholson, 1993), and a great deal remains to be learned about ECS dynamics and about how ECS volume and diffusion rates are affected by disease. Early studies, using electrical impedance measurements, electron microscopy, or ventricular, cisternal, or subarachnoid perfusion of ionic radiotracers such as 131I and 35S-labeled sulfate or thiosulfate, were complicated by a variety of artifacts (see Van Harreveld, 1972). Subsequent studies, using more sophisticated geometric models and more accurate measures of membrane resistance in CNS (Fenstermacher et al., 1970) and the introduction of the freeze-substitution method (Van Harreveld, 1972), as well as the use of 14C-labeled compounds such as inulin and sucrose (Rall et al., 1962; Bourke et al., 1965; Fenstermacher et al., 1975), provided better estimates. More recently, use of ion-selective microelectrodes (ISM) to follow diffusion of K+ or exogenous ions has provided consistent measurements under a variety of conditions (Nicholson, 1993). As a result of these several advances, it is now generally accepted that the ECS volume of brain is between 12% and 20%.
The goal of the present studies was to develop brain-slice tracer kinetic models that explicitly include ECS diffusion as well as tissue transport and binding, and then to apply the models to control and ischemic brain slices with a variety of radiotracers. All of our previous kinetic studies in brain slices (Newman et al., 1990, 1995a, 1996) have been performed using strictly compartmental analyses, which neglect the important role of diffusion through the ECS. The system may be more appropriately described by a combination of diffusion through an extracellular space in series with one or more compartments, especially because the time scale for diffusion in brain slices may be of the same order of magnitude as cellular transport (Lund-Andersen and Kjeldsen, 1976). By separating out the effects of diffusion, the initial rate constants (k1 and k2) are more likely to accurately reflect transport across the plasma membrane. Not only does the original compartmental approach lead to values for K1 and k2 that are without physical meaning, it also makes it impossible to distinguish changes in ECS dynamics from changes in transport processes, yet the distinction may be important for understanding the consequences of ischemia.
Diffusion of a substance through any three-dimensional body can be described (Fick, 1855) as
where C is concentration, t is time, the Di are the principal diffusion coefficients, and ξ, χ, and ζ are the three principal rectangular axes of diffusion. Assuming that most substances enter brain slices primarily through the cut surface planes rather than through the pial edges, the brain slice may be described as a slab (Appendix 1) so that diffusion measurements are made perpendicular to the slice surface. Diffusion in the plane of the slice surface does contribute to measurements, however, by increasing ECS volume, α, and by reducing the apparent diffusion coefficient (Appendix 2).
The present studies demonstrate the feasibility of measuring ECS volume and rates of diffusion in brain slices for such diverse radiotracers as 14C-polyethylene glycol (3,300 Da; PEG), 3H2O, 45Ca, and 14C-3-O-methylglucose (3OMG). The kinetic models and tracers are used to study ECS dynamics and solute—tissue interactions in 1,050-μm thick hippocampal slices, which provide a model of the ischemic penumbra (Newman et al., 1988), as well as in control and hypoxic 450-μm slices. The results with control 450-μm slices confirm earlier ECS diffusion results but also extend those results by providing a detailed analysis combining diffusion with tissue transport for 45Ca and 14C-3OMG. It was not possible to distinguish intracellular from extracellular diffusion of 3H2O. Results with ischemic thick slices are consistent with some aspects of earlier studies of ECS dynamics in ischemia but also provide several new tracer-specific observations of related intracellular phenomena. Thick slices also show an unexpected increase in the extracellular diffusion coefficient for all tracers with implications for ECS structure and changes in the ischemic penumbra.
METHODS
Materials
All buffers and inorganic salts were obtained from Sigma Chemical, Inc. (St. Louis, MO, U.S.A.) and were cell culture grade. A single lot of dextran was used throughout these experiments (Sigma #D3759, Lot #14H0433, mean molecular weight of 74,000 Da). Agarose was electrophoresis grade (Gibco Laboratories, Chagrin Falls, OH, U.S.A.). The 95% O2–5% CO2 and 5% CO2-air mixtures and liquid N2 were purchased from Matheson (East Rutherford, NJ, U.S.A.). 14C-Polyethylene glycol (3,300 Da mean molecular weight; 14C-PEG; specific activity 15 mCi/g) and 14C-3-O-methylglucose (14C-3OMG; specific activity >154 mCi/mmole) were from Amersham (Arlington Heights, IL, U.S.A.), and tritiated water (3H2O; specific activity 50 mCi/mL) was from American Radiolabelled Chemicals, Inc. (St. Louis, MO, U.S.A.). Scintillation cocktail was obtained from National Diagnostics (Manville, NJ, U.S.A.). AG1-X8 (formate form) was obtained from Bio-Rad (Melville, NY, U.S.A.). Fluorescein-labeled, anionic, lysine-fixable dextran was purchased from Molecular Probes, Inc. (molecular weight 3,000 Da, #D3306, Eugene, OR, U.S.A.). Water was deionized and purified to a resistance of 17 MΩ with a Barnstead NANOpure system (Boston, MA, U.S.A.).
Brain slice preparation, isotope incubations, and analysis
Each incubation day, four male Sprague-Dawley rats (225 to 275 g) were lightly anesthetized with 3% halothane in 50% N2O–50% O2 and maintained with 2% halothane in 50% N2O-50% O2. A rectal temperature probe was inserted and the rat was immersed in a bed of crushed ice until the probe read 30°C (Newman et al., 1992; Español et al., 1994). The rat was decapitated, and the brain was rapidly removed and chilled briefly in ice-cold preparation buffer (see below). Both hippocampi were dissected free and chopped perpendicular to the long axis at 450 μm or 1,050 μm using a Smith-Farquhar tissue chopper (Sorvall, Dupont, Wilmington, DE, U.S.A.), with up to 10 slices per animal chosen from the central portions of the hippocampi. The slices were separated from the chopped hippocampi while submerged in preparation buffer using tools made from fire-polished drawn glass pipets. All slices were then transferred with a 7-mm inner diameter polyethylene pipet to incubation chambers within 6 minutes of decapitation.
All brain slices from each animal were incubated as a group in a chamber designed specifically for biochemistry and histology, with the slices submerged by about 1 mm (Newman et al., 1995b). Slices were incubated resting on nylon mesh suspended across glass rings (28 mm inner diameter) at 22°C for 45 minutes and then the buffer temperature was raised during 20 minutes to 37°C for the remainder of the experiment. Buffer, already preequilibrated with humidified 95% O2–5% CO2, flowing at 1 mL/minute, entered the chamber together with humidified 95% O2–5% CO2, flowing at 85 mL/minute, through a glass frit, creating a constant light foam. Slices were incubated in a modified Krebs-Ringer–3.1% dextran buffer (control buffer) with (in mmol/L): NaCl, 122; KCl, 3.0; NaHCO3, 21.0; KH2PO4, 1.2; CaCl2, 1.5; MgSO4, 1.3; and glucose, 5; at pH 7.38 ± 0.02 with an osmolarity of 278 ± 1 mOsm measured by vapor pressure osmometry (Wescor, Logan, UT, U.S.A.). Dextran is included to reduce tissue slice water gain and improve histologic preservation (Banay-Schwartz et al., 1974; Newman et al., 1995b). Preparation buffer, which used phosphate to avoid pH changes caused by variation in temperature or the partial pressure of CO2, had a basic composition of (in mmol/L): NaCl, 121; KCl, 4.2; NaHCO3, 31; sodium phosphate, 8 (added as a mixture of mono- and di-basic salts to achieve pH 7.4 at 4°C); CaCl2, 1.5; MgSO4, 1.3; and glucose, 10. Preparation buffer also contained 3.1% dextran. The pH was adjusted, if necessary, to 7.38 with 0.154 mol/L NaHCO3. Preparation buffer was also equilibrated with 95% O2–5% CO2. For experiments with hypoxia, 450-μm slices were exposed to buffer equilibrated with 5% CO2–air for 15 minutes after rewarming, but before radioisotope exposure, and then maintained at this gas exposure for the remainder of the experiment.
For slices incubated with radioisotope for 60 minutes or less, the incubation chamber was modified so that buffer recirculated with a total volume of 15.4 mL at a flow rate of 2.0 mL/minute. Buffer was exposed to gas on chamber reentry as described above. Slices incubated with radioisotope for more than 60 minutes were incubated with the usual flow-through chamber configuration at 0.5 mL/minute to avoid potential accumulation of slice metabolic products. Isotope incubation buffers were identical to Krebs-Ringer–3.1% dextran as described above except that they also contained either 14C-PEG (final buffer activity of 0.1 μCi/mL), 3H2O (7.7 μCi/mL), or 14C-3OMG (0.28 μC/mL). Radiotracer incubations were begun by lifting the rings with all 10 slices from the preincubation chamber and gently pipetting 1 mL of radioactive buffer over the slices, thus avoiding dilution of radiolabel in the incubation chamber. The time was noted and the rings were immediately transferred to the isotope incubation chamber. Half of the slices from each animal were used for measuring radiotracer influx and half were used to measure tracer efflux. Influx slices were removed individually from the chamber at times varying from 15 seconds to 224 minutes with a wide-bore pipet and transferred to a slice-handling tool fashioned from 0.018″ stainless steel wire bent into the shape of a spoon (8 mm × 6 mm), with bridal veil (tulle) sewn to the frame with ultrafine (1-lb test) nylon monofilament. Influx isotope incubations with 14C-PEG and 14C-3OMG were ended by dipping the slice in 5 mL of oxygenated nonradioactive incubation buffer, transferring it with a fine paintbrush to a tared glass slide for weighing and then to a microfuge tube, which was closed and immersed in liquid N2. Influx incubations with 3H2O were terminated in 3 or 4 seconds by pouring 5 mL of buffer over the slice while on the slice-handling tool and “flicking” the slice directly into a wide-mouthed Dewar flask of liquid N2. The frozen slice was then transferred with cooled steel forceps to a cooled microfuge tube. For efflux slices, after incubations of 30 minutes for 3H2O or 60 minutes for 14C-PEG or 14C-3OMG, the remaining half of the slices were removed, still in the ring, and rinsed by pouring 20 mL of nonradioactive buffer over the slices in less than 5 seconds, ending the incubation. The ring was then transferred to a flow-through chamber for efflux measurements. After times varying from 15 seconds to 120 minutes, slices for 14C-PEG or 14C-3OMG incubations were removed from the rinse chambers with the brush and transferred directly to a tared glass slide for weighing, while slices for 3H2O experiments were transferred to the slice-handling tool with the wide-bore pipet and “flicked” into liquid N2.
The frozen tissue was sonicated (Misonix, Farmingdale, NY, U.S.A.) in a microfuge tube with 500 μL of ice-cold 0.3 mol/L perchloric acid and stored on ice. A protein pellet was obtained by centrifuging at 12,000g for 20 minutes at 4°C. The entire supernatant was mixed with scintillation cocktail and counted in an LKB Model 1214 liquid scintillation counter (Wallac, Gaithersburg, MD, U.S.A.). The protein pellet was digested in 500 μL of 1 N NaOH overnight in an oven at 60°C and neutralized with 500 μL of 1 N HCl. Aliquots were assayed by scintillation counting and protein determination (Lowry et al., 1951). Perifusate radioactivity was taken as the average of preincubation and postincubation measurements because the radioactivity declines by 2% to 3% during the course of the incubation. For all radiotracers, the tissue volume of distribution (Vd*) was expressed in mL/g tissue wet weight based on the equation
where tissue radioactivity was the sum of radioactivity in the extraction supernatant and protein pellet, wet weight was either measured directly, for slices exposed to 14C-PEG and 14C-3OMG, or calculated from the measured slice protein, for 3H2O slices, using the mean values of 12.2 mg tissue/mg protein for 450-μm slices and 14.2 mg tissue/mg protein for 1,050-μm slices, based on the measured wet weights and proteins of all slices used for 14C-PEG and 14C-3OMG experiments (see below).
45Ca data for control 450-μm and 1,050-μm slices was the same as that previously published and analyzed with a two-compartment model (Newman et al., 1995a). 45Ca data for hypoxic 450-μm slices has not been published previously. The techniques employed in that series of experiments were identical to those of the present studies with the same incubation buffer except that the CaCl2 included 45CaCl2 (0.65 μCi/mL, final specific activity 0.2 mCi/mole; Amersham).
Agar disc preparation and incubation
Agar discs were prepared using 450-μm and 1,050-μm thick Teflon templates punched with holes 4.6 mm in diameter and scored to facilitate runoff of excess agar during casting. A 2% solution of agar in control buffer was poured into the holes of the Teflon template at 60°C and tightly “sandwiched” between two pairs of Teflon sheets and outer rigid plexiglass blocks using bolts passing through the apparatus. After cooling to room temperature, the apparatus was disassembled, the agar discs were removed gently with a spatula and then equilibrated with Krebs-Ringer–3.1% dextran buffer for least 30 minutes before use. Agar discs for influx points were incubated in the usual 14C-PEG incubation buffer for up to 98 minutes and rinsed briefly or, for efflux points, incubated for 30 minutes and rinsed for up to 60 minutes. Unlike brain slices, however, agar discs were transferred directly from the slice-handling tool to scintillation vials without freezing. Because weights were not obtained for individual agar discs, the mean mass of separate agar discs prepared the same day was measured after equilibration with buffer. The mean values were 9.2 ± 0.3 mg for 450-μm agar discs and 17.4 ± 1.5 mg for 1,050-μm agar discs. A value for Vd* was calculated for each agar disc incubated with isotope using these mean weights.
Kinetic analyses and calculations
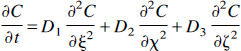
Each data point for kinetic analysis consisted of the calculated Vd* with the incubation and rinse times recorded to within 1 second. The kinetic models are discussed in detail in Appendix 1. All of the models used for analysis of tissue slice kinetics include diffusion into the slice from the chopped surface planes and through the ECS. The models for analysis of slice experiments differ with regard to the arrangement of tissue compartments and include one compartment in series with ECS (Fig. 1A), two compartments in parallel (Fig. 1B), two compartments in series (Fig. 1C), or three compartments, two in series and a third in parallel with the other two (Fig. 1D). Also presented in Appendix 1 are the equations for diffusion through the plane surfaces into ECS without any compartments that were used for analysis of 3H2O slice (Fig. 1E). Nonlinear least squares analyses and calculations were performed by minimization of the sum of the squares of the errors. All analyses were performed without weighting except for 45Ca, which was analyzed using 1/C½ weighting because of a consistently poor visual fit when the data were analyzed without weighting. For all tracers, the number of compartments used was chosen such that any further increase in the number of compartments improved the sum of squares by less than 5%. For the least squares analyses involving 3H2O, 45Ca, and 14C-3OMG, ECS volume was fixed on the basis of the best fit of the 14C-PEG data for the same slice condition to reduce the number of parameters fit by the least squares routine and improve the accuracy of the remaining variables. Only one other constraint was used for these analyses. Because the rate of efflux from the second tissue compartment for 45Ca was extremely slow in hypoxic and thick slices, it was necessary to fix the value of k4 or k2′ for the serial or parallel compartment model (Fig. 1B and C), respectively, at a finite level to avoid obtaining an infinite value. The value was fixed arbitrarily at 0.00001. In the final analyses, the tissue compartment is called bound for 14C-PEG, and the serial compartments for 14C-3OMG and 45Ca are called cell and bound. Graphics were generated with Axum (Trimetrix, Seattle, WA, U.S.A.) using actual data and model data generated by the analytical programs.
Diagrams of kinetic models described in Appendix 1 and used in this study. (
The three models used for analysis of agar disc kinetics (Appendix 1) consider either diffusion through the facial planes of the disc only (Fig. 1F), diffusion through the planes and side walls of the disc (Fig. 1G), or diffusion directly through the walls and through an unstirred layer in series with the cylinder planes (Fig. 1H). Because initial least squares analyses produced a slight difference in the PEG volume of distribution for the two disc thicknesses (0.83 ± 0.02 mL/g for 450-μm discs and 0.89 ± 0.02 mL/g for 1,050-μm discs), even though the discs were prepared in the same session from the same agarose solution in all cases, a single volume of distribution for PEG in agar discs was chosen by minimizing the combined sum of the squares of the curves for the two thicknesses. This single value of 0.86 mL/g was used for all subsequent analyses of both thicknesses. Also, because the diffusion coefficient of PEG in agar has been measured previously (J. Fenstermacher, personal communication), we were able to determine the effects of including an unstirred layer on agar disc kinetics by varying the thickness of the unstirred layer for each slice thickness until the least squares analysis produced the measured value of 1.7 × 10⁻⁶ cm2/second. Note that no standard error of the estimate for the unstirred layer thickness is available with this approach. All diffusion coefficients are reported at 37°C without correction for salt content of the medium.
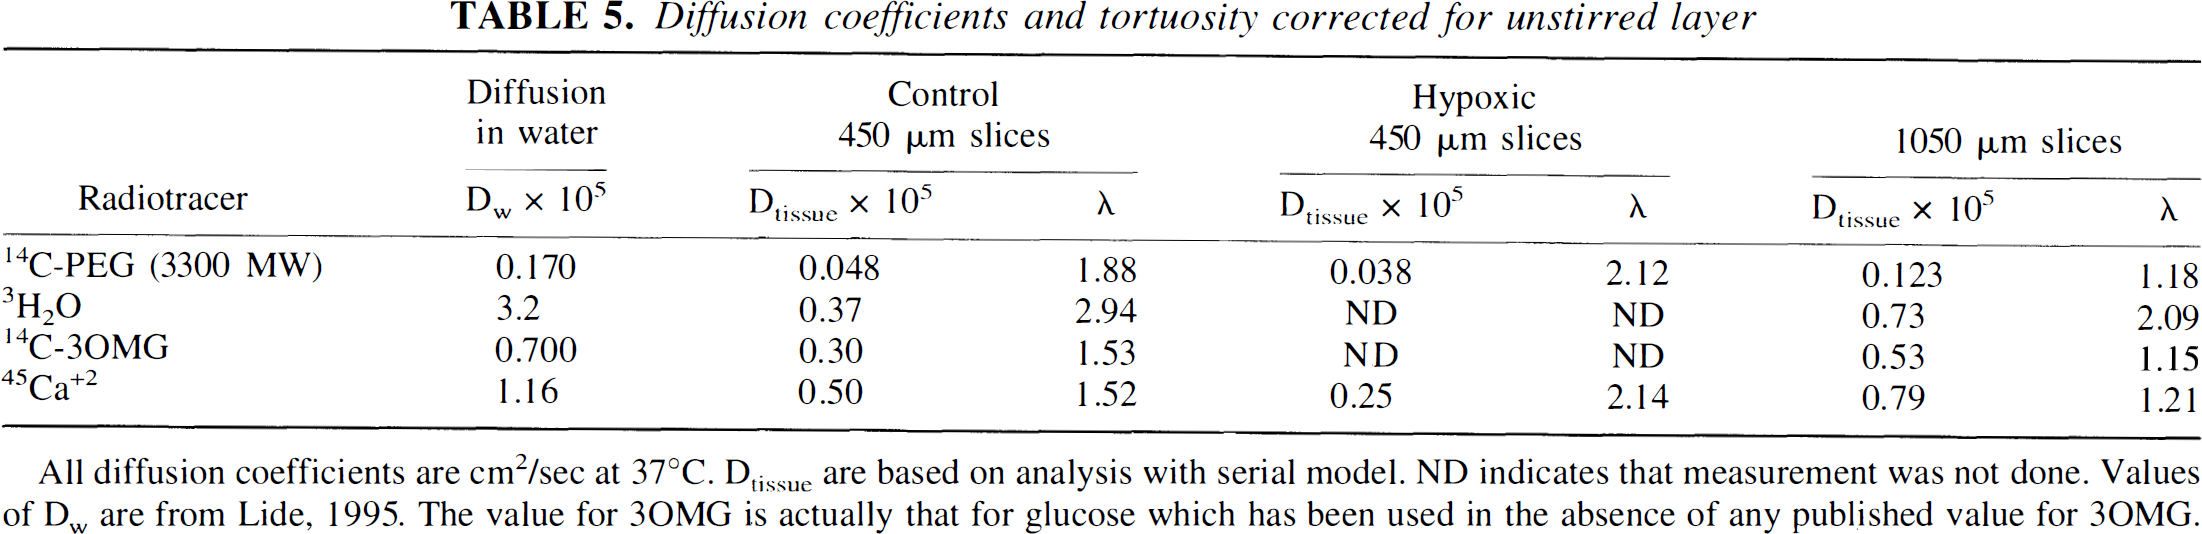
Finally, the unstirred layer model was used to determine the effect of including an unstirred layer on the calculated apparent diffusion coefficient in tissue slices. Because of the complex geometry of a tissue slice, the slice was represented, for these purposes, by a disc 3 mm in radius to provide a surface area similar to that of a typical hippocampal slice, which is more closely represented by a 4- × 7-mm rectangle. Using the thickness of unstirred layer determined for agar discs, a corrected “internal” diffusion coefficient, Dtissue, could be estimated for each slice condition and tracer from the known diffusion coefficient of PEG in agar, the experimental ECS volume, and the diffusion coefficient determined by least squares analyses. Tortuosity was calculated as (Dagar/Dtissue)½, assuming that Dagar was a good approximation of Dw (Nicholson and Tao, 1993). Results are reported without the unstirred layer correction in all Tables except Table 5, which summarizes results of all diffusion coefficients with correction for an unstirred layer.
To estimate the accuracy and robustness of the parameters determined by the least squares analyses, given the noise of the measurements, data for 45Ca in control slices were reanalyzed as follows. The data were fit by least squares analysis as above using a model with extracellular diffusion and two compartments in parallel and weighting as 1/C½. The derived kinetic parameters were then used to calculate a set of idealized data points, one value of Vd* at each experimental time point. This idealized data set was then refit using the same kinetic model to establish that the kinetic parameters would be the same and with little or no standard error. Once this was established, error was introduced into the idealized data curve by generating random error around each point using the equation

where A is an arbitrary positive constant and B is a random number generated from a normal Gaussian distribution with a mean of 0 and a variance of 1. Varying the arbitrary constant A thus permits any degree of error to be introduced into the curve. This process was repeated many times for every value of A studied to generate new data curves with random noise. These new curves with random noise were then fitted with the same least squares analysis used for the experimental data.
Histologic analysis and adenylate assays
An additional group of rats was used to prepare slices for histology and adenylate assays. Slices were prepared as for kinetics, incubated in separate flow-through chambers for histology and adenylates, and then removed from the chambers after 4 hours in vitro and fixed or frozen in their rings.
Slices for histology were fixed at 37°C for 1 hour in Bouin's fixative, dehydrated, paraffin-embedded, sectioned at 7 μm, and stained with hematoxylin and eosin. All slices were encoded and read by a single observer in a blinded manner (Newman et al., 1992). After identifying the central section of each slice and confirming that it was representative of the central 300 μm of the slice, individual grades were assigned to the CA1, CA2, CA3, and CA4 regions and the inner blade of dentate gyrus based predominantly on the appearance of the pyramidal or granule cells, although appearance of the neuropil was also considered. This subjective grading system is the same as one used for assessing in vivo ischemia of hippocampus (Halsey et al., 1991). Histologic standards were prepared with brains fixed in situ (Newman et al., 1995b) from rats that were deeply anesthetized with intramuscular ketamine and subjected to thoracotomy, aortic clamping, and perfusion with phosphate-buffered saline followed by Bouin's solution. Brains were removed and fixed overnight in Bouin's at 4°C. The hippocampi were removed, chopped in the same plane as for brain slice preparation and processed for histology as above. In all slice regions, the scale used was as follows: grade 1—virtually all neurons appear normal (defined in reference to the in vivo standards); grade 2—nearly all neurons remain and most neurons appear normal but as many as 20% show minor differences from in vivo; grade 3—significant changes were seen in up to 50% of neurons and some neurons could be lost; grade 4—more than 80% appear abnormal with up to 20% lost; and grade 5—no remaining normal appearing neurons and more than 20% of the neurons missing. Occasionally, if the histology of a region was heterogeneous, with more than one grade observed within the region, an intermediate grade, such as 2.5, was assigned. Results of 450-μm and 1,050-μm slices were compared statistically by multivariate analysis of variance and with the univariate analyses for each region using SPSS/PC+ 5.0.2 for DOS (SPSS, Inc, Chicago, IL, U.S.A.).
Slices for adenylates were rapidly frozen in the incubation rings by immersion in liquid N2 without prior weighing. Frozen slices were extracted with 150 μL of perchloric acid and neutralized with 15 μL of 3.0 mol/L KHCO3 after centrifugation and removal of the protein pellet as above. Tissue adenylates were measured by high-pressure liquid chromatography (Teerlink et al., 1993). A 50-μL sample of the neutralized extract was injected by autosampler onto a Microspher C18 reverse phase 3-μm column (Chrompack, Raritan, NJ, U.S.A.). Compounds were eluted by gradient of buffer A (0.15 mol/L KH2PO4) and buffer B (H2O:methanol:acetonitrile, 50:25:25), with the gradient of buffer B run as follows: 0% for 1 minute, a ramp to 15% at 5.4 minutes, a ramp to 40% at 6.4 minutes, holding at 40% to 7.4 minutes, then return to 0% at 7.9 minutes for column reequilibration by 12 minutes. Protein was determined by the method of Lowry et al. (1951). As for histology, adenylate results for the two slice thicknesses were compared for ATP, ADP, AMP, total adenylates, and adenylate energy charge by univariate analysis after multivariate analysis of variance.
Slices of both thicknesses were prepared from two rats and incubated with fluorescein-labeled 3,000-Da molecular weight dextran to confirm that a molecule of this size could penetrate to the center of thick slices and to obtain a qualitative estimate of the time necessary to reach steady state. Slices were prepared and preincubated as usual and then exposed to fluorescein-labeled, sulfated, lysine-fixable dextran with a mean molecular weight of 3,000 Da for times varying from 5 to 60 minutes and then processed by modifications of previously described methods (Schmued et al., 1990; Nance and Burns, 1990). At the end of the exposure, slices were removed in their rings and fixed in 4% paraformaldehyde (pH 7.3) at 37°C for 1 hour and then transferred to the refrigerator for an additional 24 hours in fixative. The fixed slices were placed in progressively more concentrated glucose until 30% was achieved or the slices sank, at which point the slices were frozen and sectioned with a cryostat at 20-μm thickness either en face through the slice to generate a profile of sections or at a right angle to the plane of the slice to generate a section of the thickness profile. The resulting sections were mounted and heat-fixed onto microscope slides, covered with several drops of Fluoromount-G, a nonphotobleaching medium (Southern Biotechnology, Birmingham, AL, U.S.A.), and observed under a Nikon Diaphot epifluorescence microscope (Garden City, NY, U.S.A.).
All results are presented as means with standard deviations except the results of the values from the least squares analyses of variance, which are presented with standard errors.
RESULTS
Histology
Thin hippocampal brain slices, incubated by minimally submerging in Krebs-Ringer with dextran at 37°C, show excellent preservation after 4 hours in vitro in CA1 and very good preservation in every other region (Fig. 2A-E; Table 1). The basal and apical neuropil are uniformly tightly packed with few open tissue spaces apparent anywhere. Most dendritic profiles closely resemble those of control tissue fixed by perfusion of the brain in situ. Because our incubation conditions have been chosen to optimize the histologic appearance of CA1 (Newman et al., 1995b), it is not surprising that the best histology is observed in that region. Thick brain slices incubated under the same conditions show significantly worse histology than thin slices in every region except CA3 (Fig. 2F-J; Table 1). The apical dendrites of CA1, CA2, and dentate are narrower and more dense than in 450-μm slices, with a tendency toward vacuolization in the surrounding neuropil that causes the neuropil to appear more lightly stained overall. Neuropil of CA3 and CA4, however, is virtually identical to that in thin slices. The severity of injury to hypoxic slices is similar in microscopic appearance and histologic scores to that of 1,050-μm slices (Fig. 2K; Table 1), although it is slightly less severe and there are some subtle differences in the appearance of CA1 pyramidal cells that are less pyknotic than in thick slices.
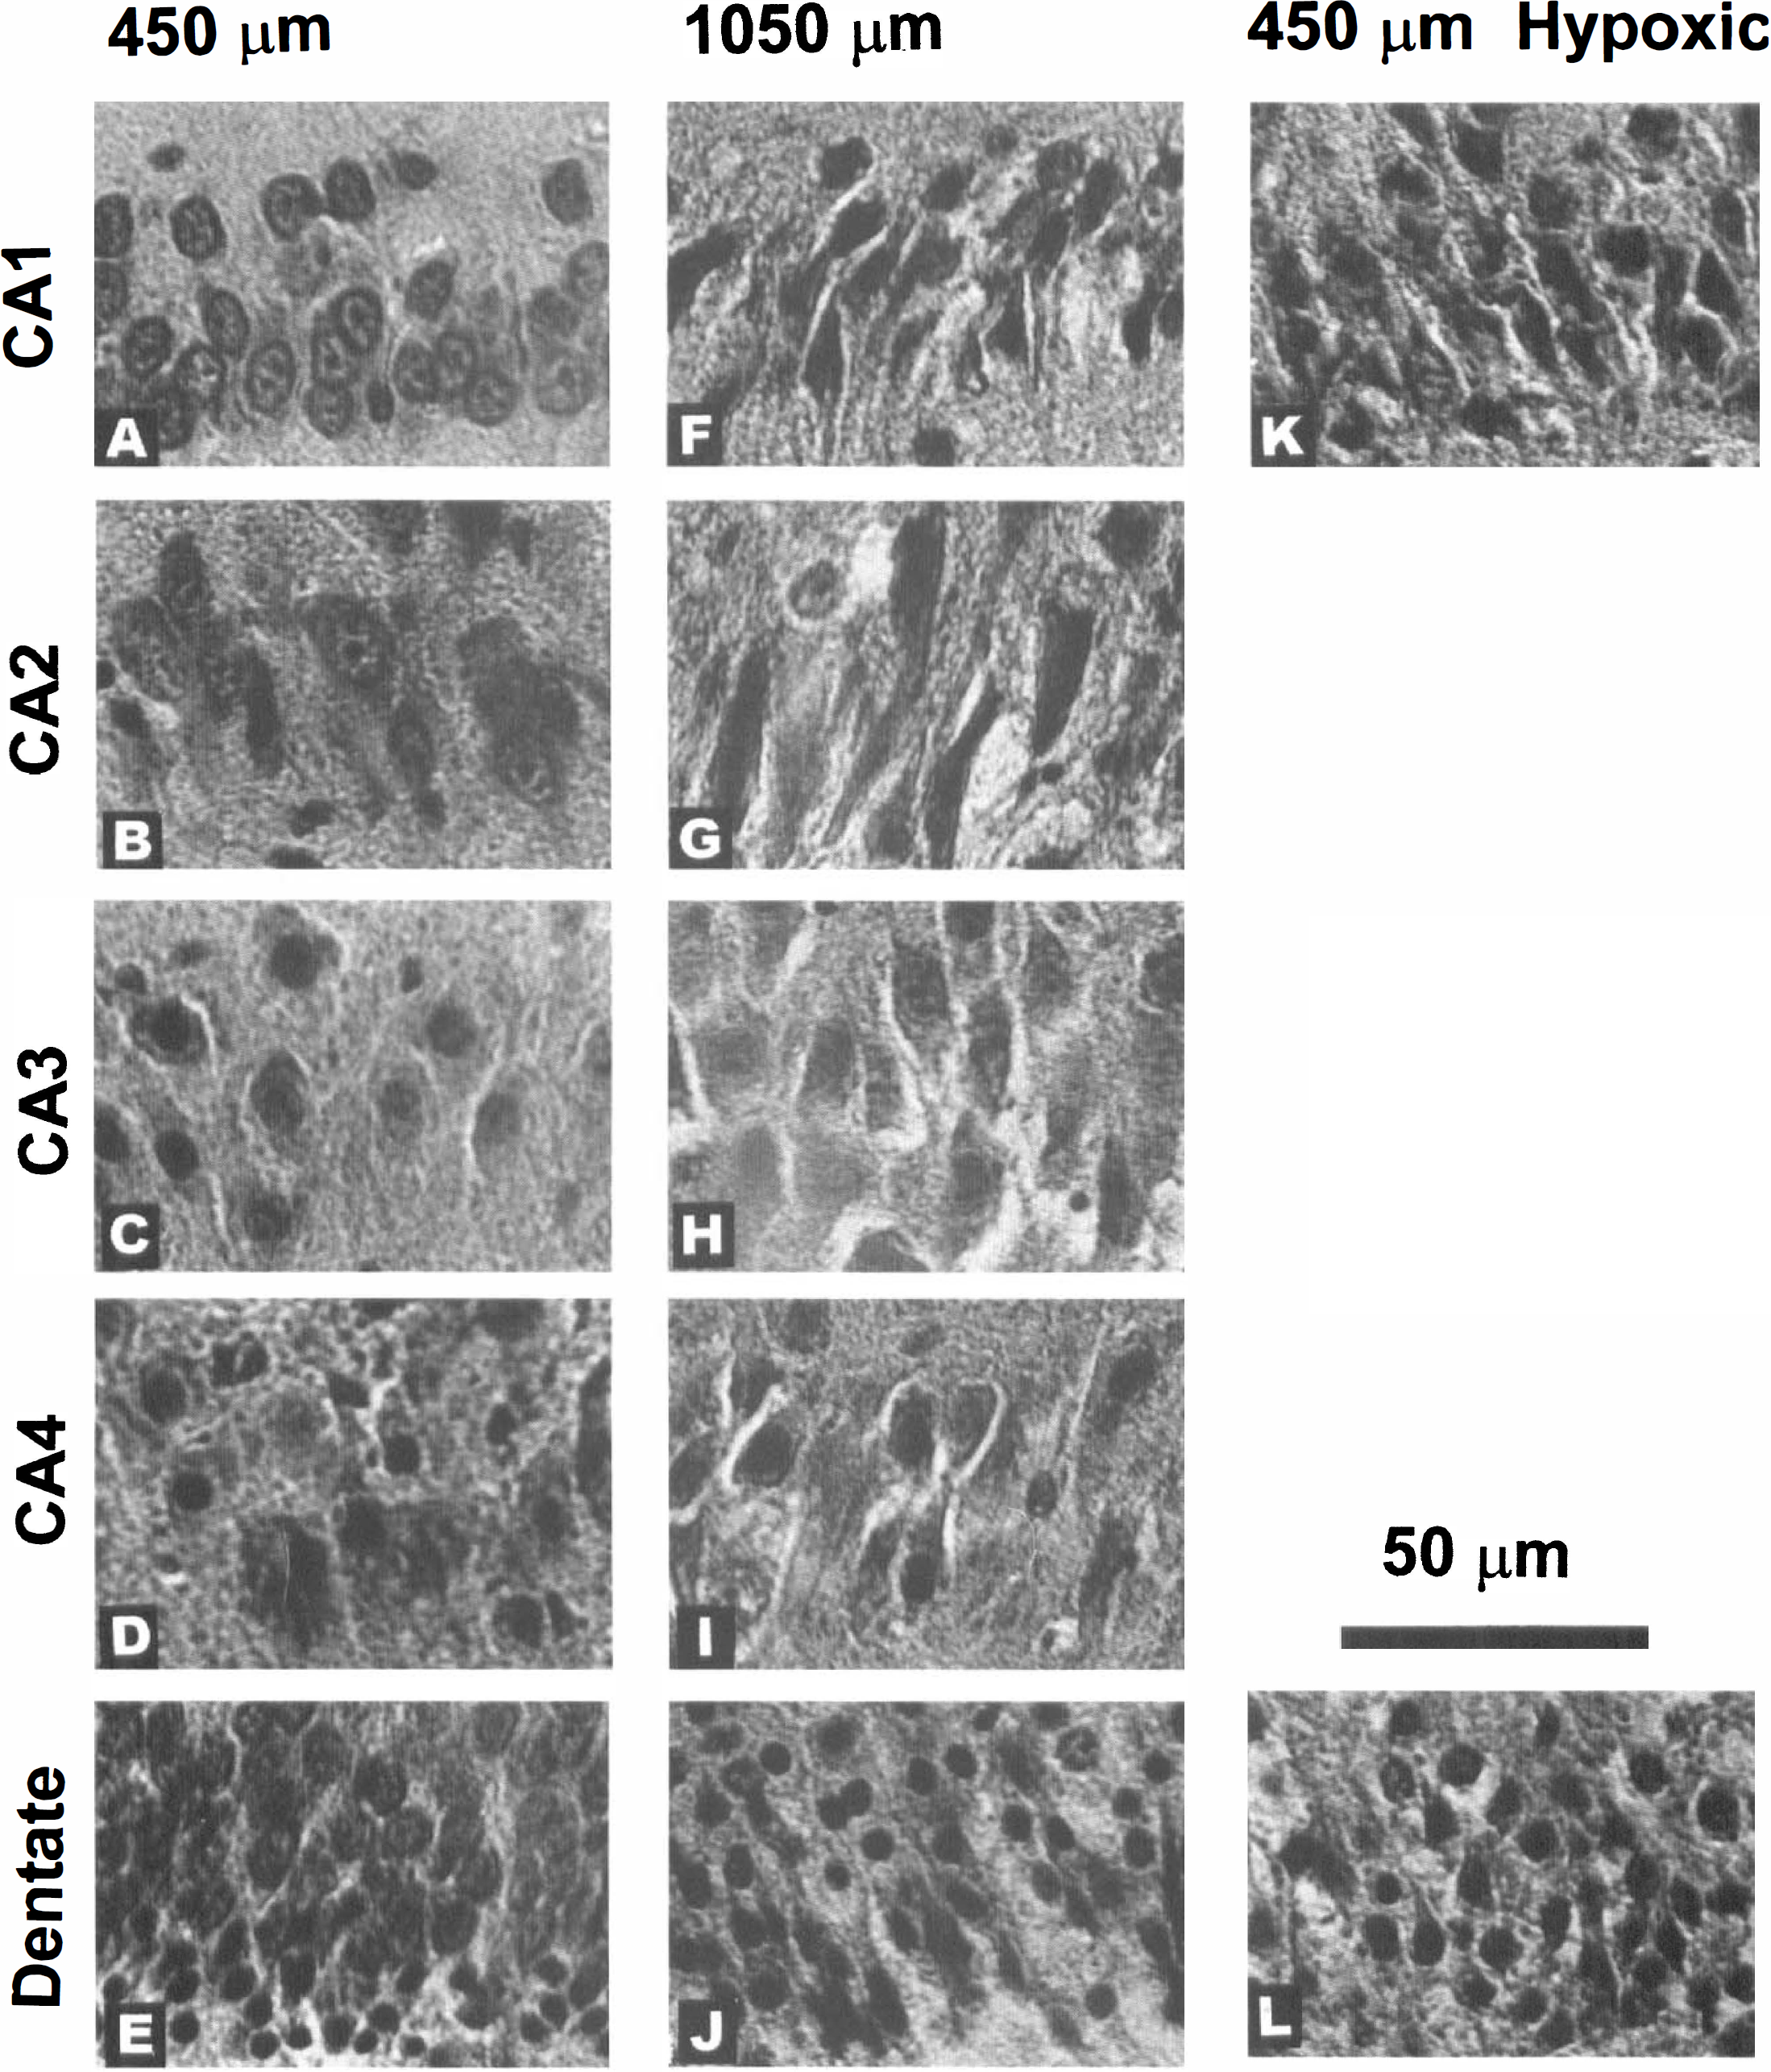
Light micrographs of control 450-μm (
Effects of slice thickness on histology
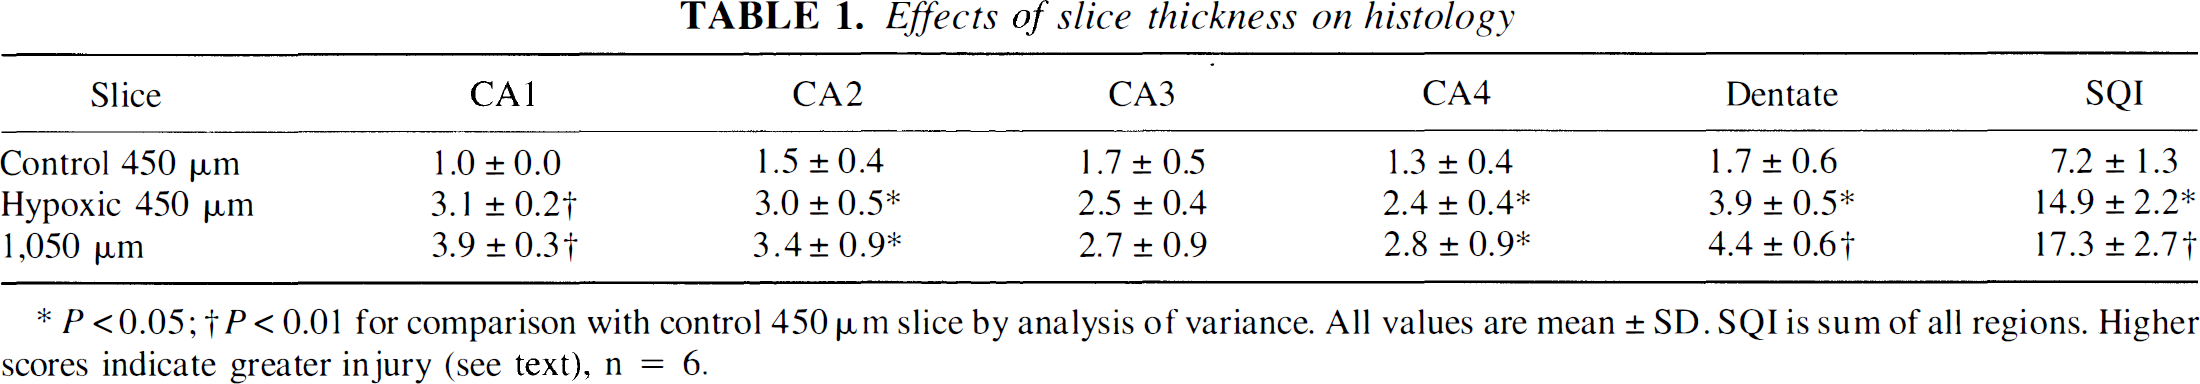
P < 0.05
P < 0.01 for comparison with control 450 μm slice by analysis of variance. All values are mean ± SD. SQI is sum of all regions. Higher scores indicate greater injury (see text), n = 6.
Adenylates and wet weight/protein
Tissue adenylates differ substantially among the three slice conditions (Table 2). Thin slice total adenylates are approximately half of what is expected from in vivo measurements (Folbergrova et al., 1972), and the energy charge is below that of healthy in vivo tissue. There is a significant decrease in ATP and increase in AMP in 1,050-μm slices compared with control 450-μm slices, whereas ADP is unchanged. As a result, the energy charge is significantly reduced. There is an insignificant reduction in total adenylates of thick slices. Hypoxic slices have ATP levels similar to those found in thick slices but AMP does not increase. As a result, the energy charge falls to a lesser extent than in the thick slices, but total adenylates fall to a substantially lower level.
Effects of slice thickness on adenylates
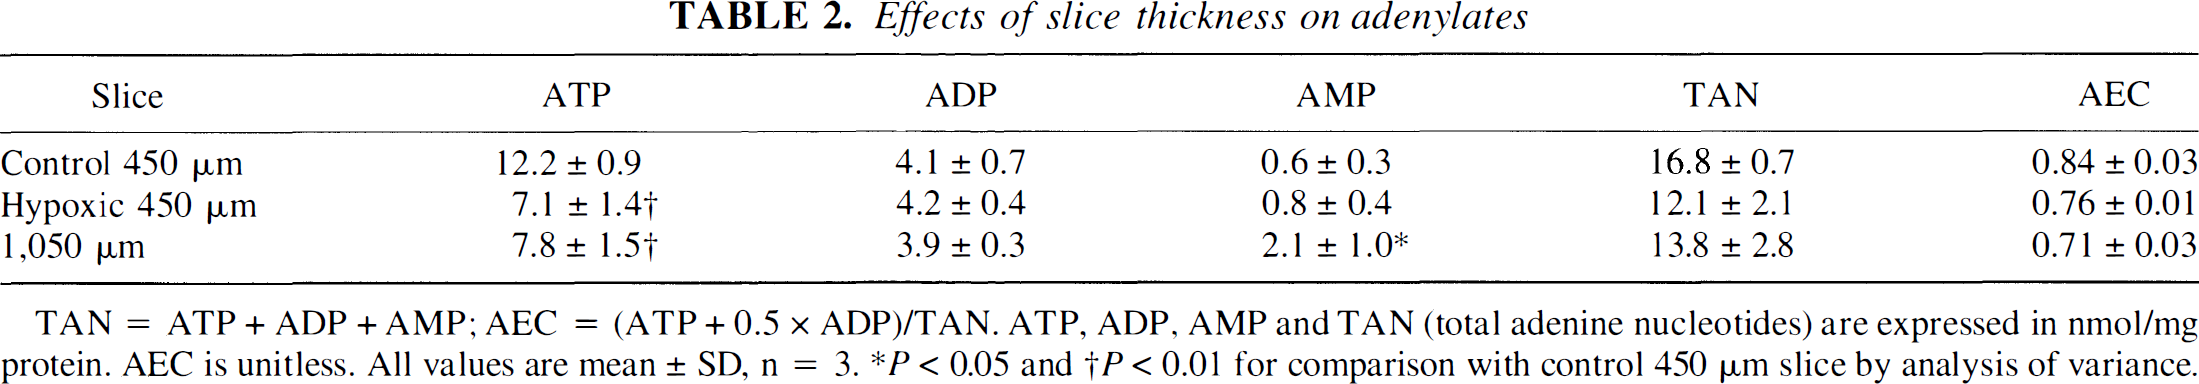
TAN = ATP + ADP + AMP; AEC = (ATP + 0.5 × ADP)/TAN. ATP, ADP, AMP and TAN (total adenine nucleotides) are expressed in nmol/mg protein. AEC is unitless. All values are mean ± SD, n = 3.
P < 0.05 and
P < 0.01 for comparison with control 450 μm slice by analysis of variance.
The mean wet weight/protein ratios of all control 450-μm slices used for the 14C-PEG and 14C-3OMG experiments was 12.2 ± 2.4 mg tissue/mg protein whereas the equivalent value for 1,050-μm slices was 14.2 ± 2.3 mg tissue/mg protein and for hypoxic 450-μm slices was 14.6 ± 0.4. Thus thick slices gain 16.4% and hypoxic 450-μm slices gain 19.7% more water than control thin slices. Most of the water gain occurs during the 75-minute preincubation period so that slice weights change little during the isotope incubations (data not shown).
Polyethylene glycol kinetics
The data for 14C-PEG kinetics with the best least squares fits are shown in Fig. 3A-C; the quantitative results are given in Table 3. Visual inspection of the PEG washout portion of the curve reveals that the tracer fails to wash out completely, suggesting tissue binding of PEG. Least squares analysis confirms the need to include a bound compartment with essentially equivalent k1 and k2 and a bound space of around 0.2 mL/g, where bound space = (k1 × ECS)/k2. All three slice conditions, control 450 μm, hypoxic 450 μm, and control 1,050 μm, have virtually identical k1, k2, and bound space, suggesting that the interaction of PEG with tissue is independent of energy state. Including this space in the analysis produces an excellent correlation between data and least squares calculations. Attempts to add a second compartment in parallel or series with the first yields only an infinitely small second space. Once binding is taken into account, the least squares analyses reveal major differences between thin and thick slices (Table 3). The ECS volume of control thin slices is 0.250 ± 0.024 mL/g, with a PEG diffusion coefficient that is considerably less than the apparent diffusion coefficient of PEG in agar (1.7 × 10⁻⁶ cm2/second). In thick slices, ECS volume shrinks to 0.168 ± 0.043 mL/g, and the diffusion coefficient is considerably higher than in thin slices, although still somewhat less than in agar. The ECS volume of hypoxic slices is 0.245 ± 0.094 mL/g, similar to that of control 450-μm slices and the diffusion coefficient falls slightly compared with control slices. The time-dependent entry of PEG into ECS and the bound compartment predicted by the least squares models are illustrated in Fig. 3D-F. The similarity of bound space for the three slices and the difference in thick slice ECS volume are readily apparent.
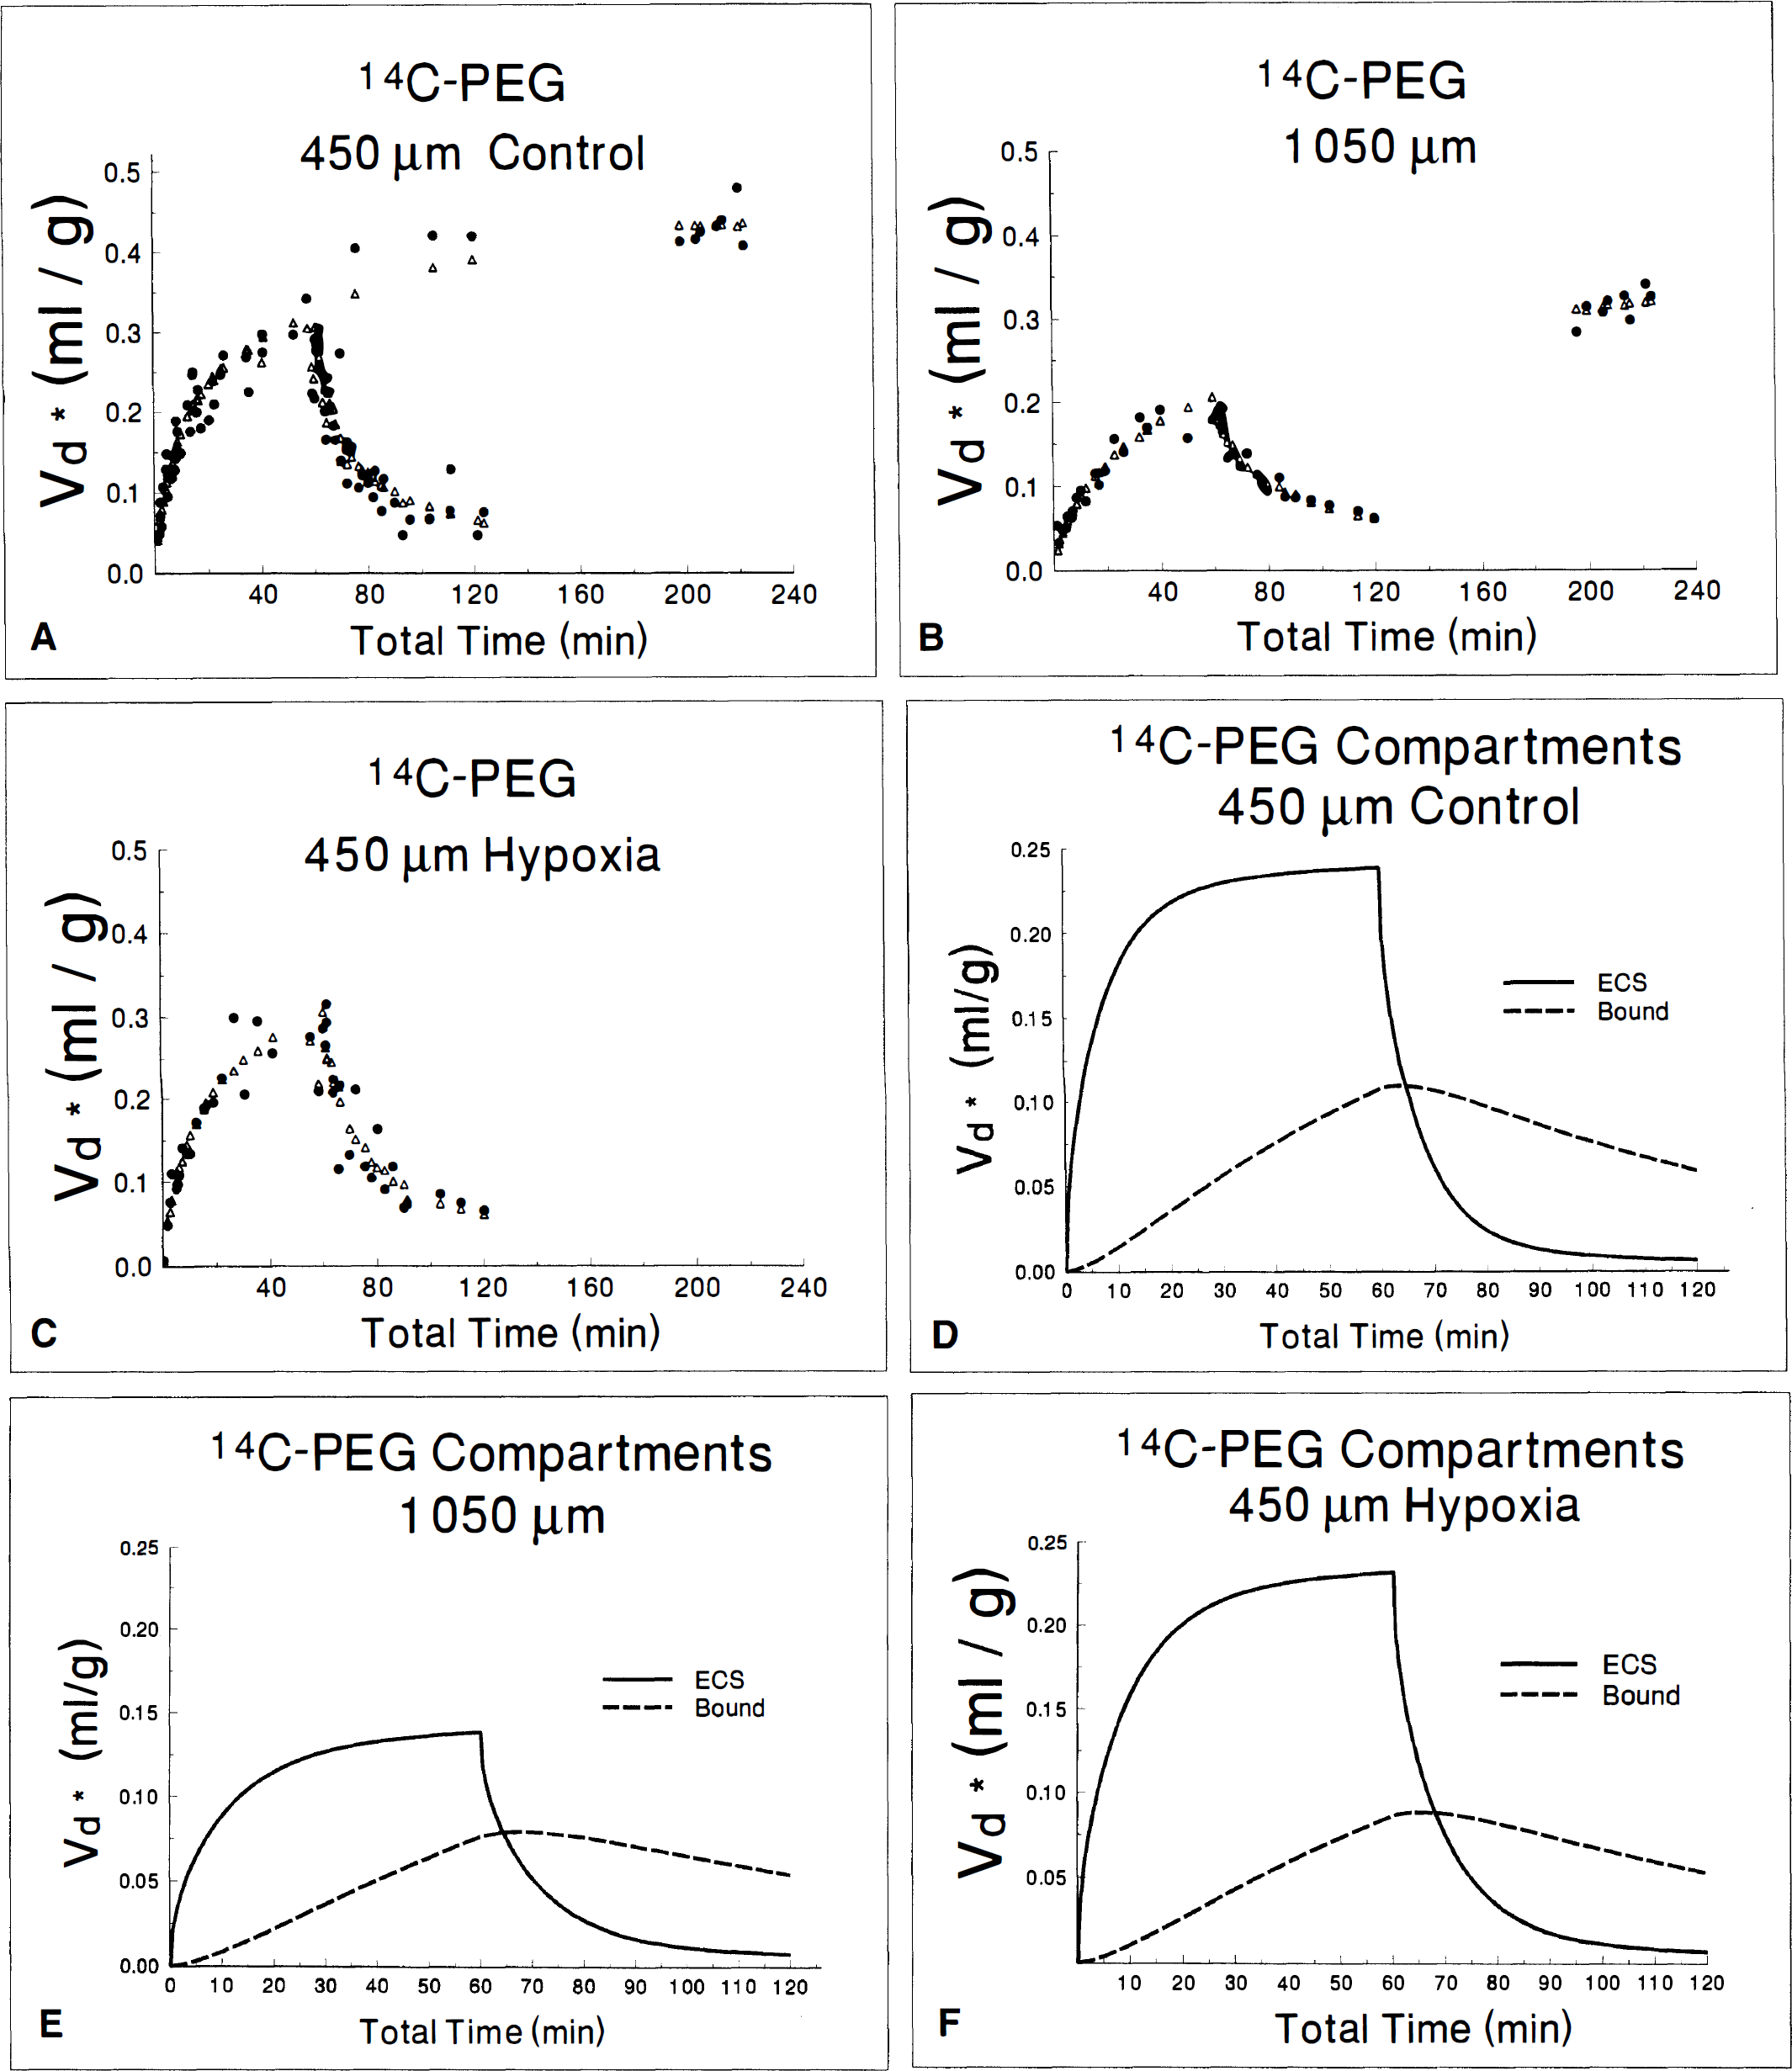
Data (•) and best least squares fit (Δ) of 14C-PEG diffusion in control 450-μm slices (
Diffusion of 14C-PEG in ECS
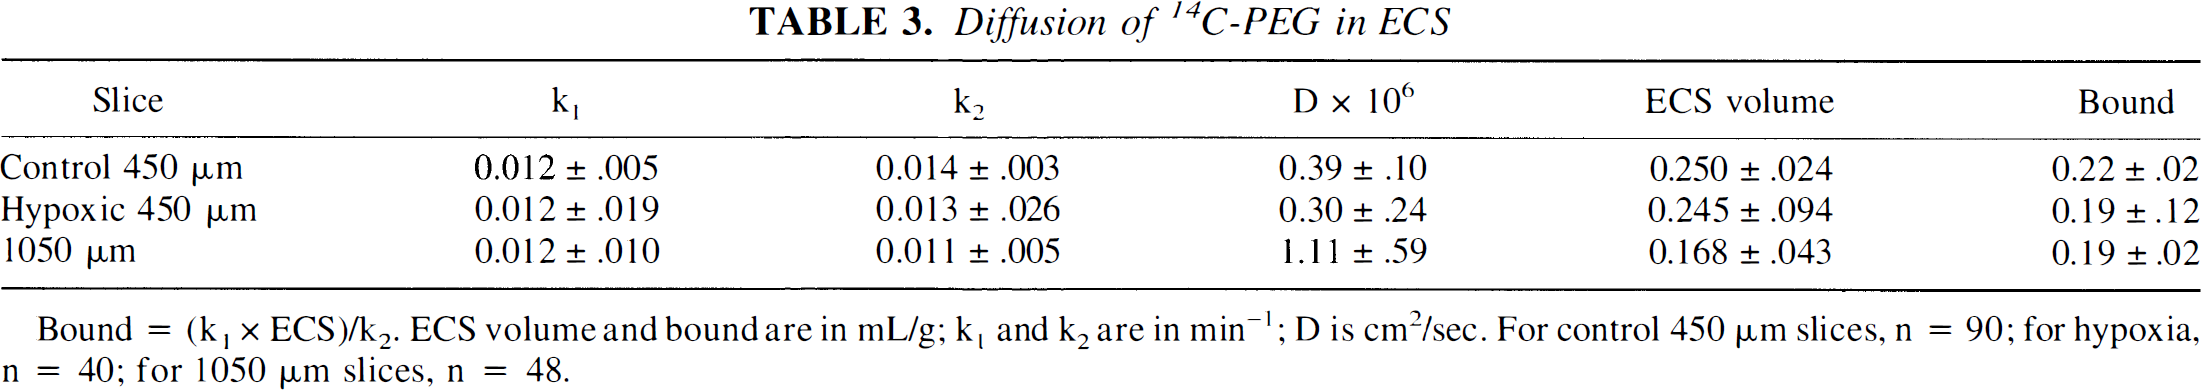
Bound = (k1 × ECS)/k2. ECS volume and boundare in mL/g; k1 and k2 are in min−1; D is cm2/sec. For control 450 μm slices, n = 90; for hypoxia, n = 40; for 1050 μm slices, n = 48.
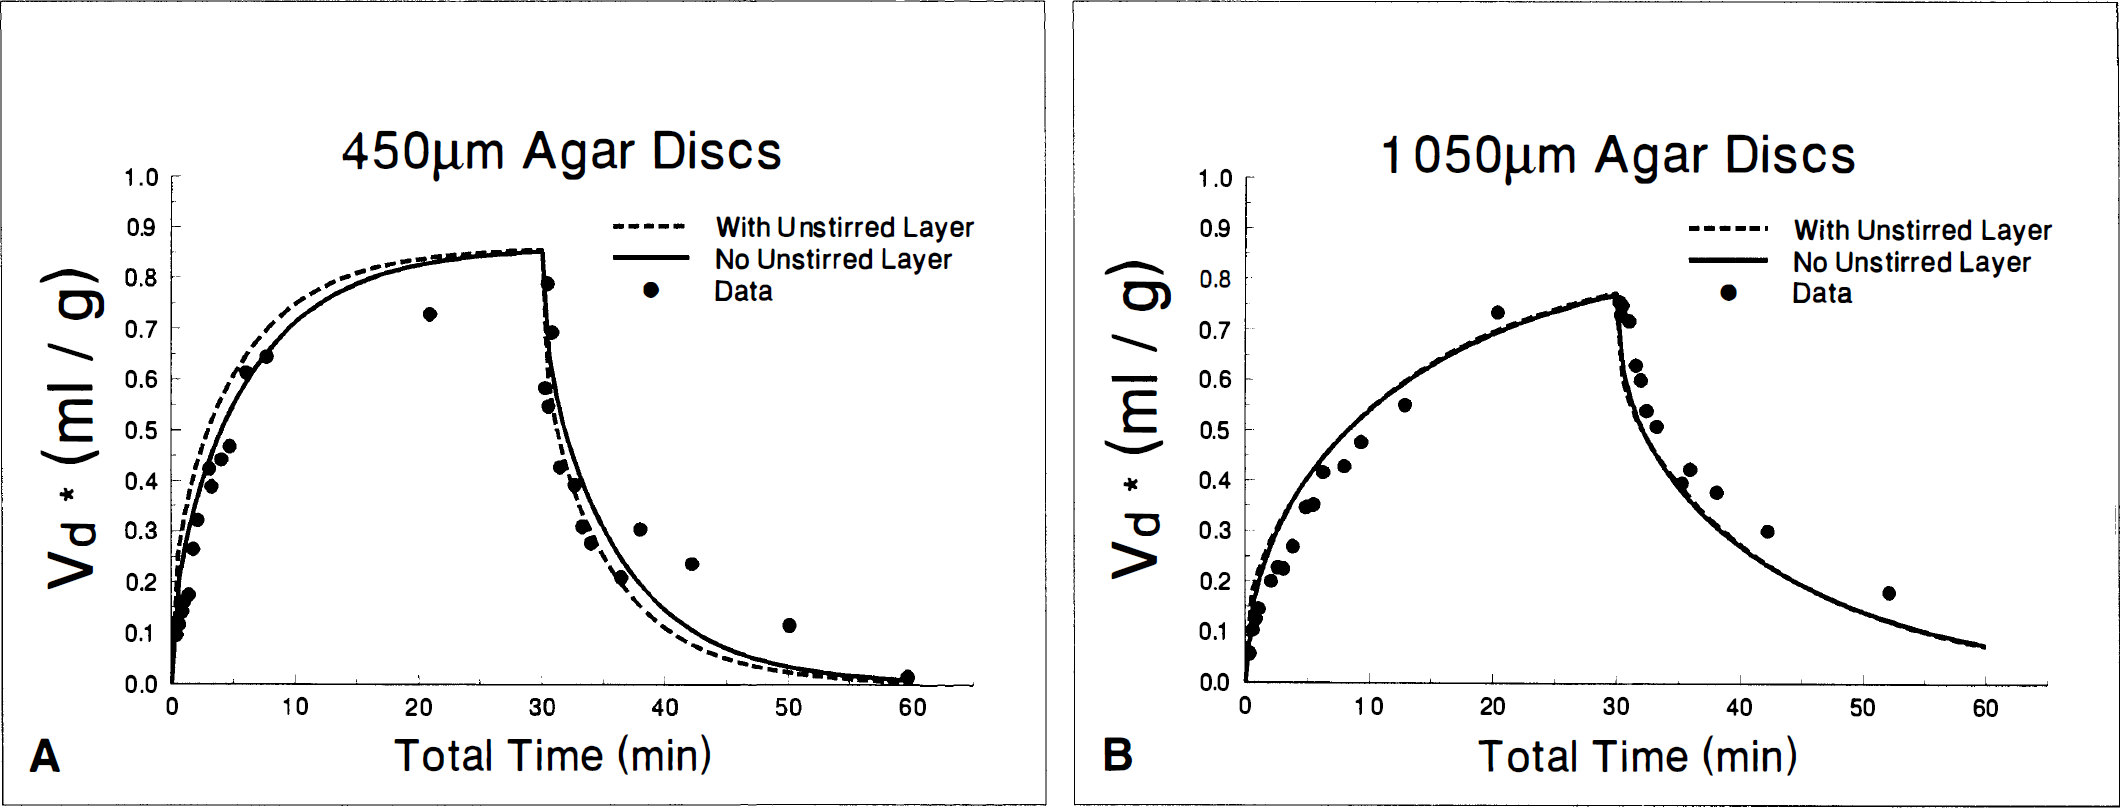
Diffusion kinetics of 14C-PEG in agar discs are illustrated in Fig. 4 and summarized in Table 4. Diffusion was analyzed both for the case of entry of tracer from the disc surfaces only and for the case with entry from both the surfaces and sides of the cylinders (Table 4). The ECS volume that minimized the sum of the squares of the curves for both thicknesses simultaneously was 0.86 mL/g and this value was used as the ECS volume in all analyses of agar experiments. This value is consistent with prior measurements of the volume of distribution of PEG (3,400 Da) in agar (J. Fenstermacher, personal communication). When diffusion from the disc surfaces without diffusion through the sides was considered, the diffusion coefficient was well below the previously measured value of 1.7 × 10⁻⁶ for diffusion of 3,300-Da PEG in long agar cylinders (J. Fenstermacher, personal communication). Considering diffusion through the sides of the discs as well as from the surfaces increased the apparent discrepancy, as expected. In addition, diffusion still appeared to proceed more rapidly in 1,050-μm discs than in 450-μm discs. Because no artifact of method or analysis that could explain these anomalies was found after exhaustive review, the possibility of an unstirred layer or combination of unstirred layer with dead space in our chamber incubation system was considered to be likely. Therefore the theory used for analysis was modified to include the presence of an unstirred layer, and with the ECS volume kept at 0.86 mL/g, the layer thickness was adjusted for each agar disc thickness until the apparent diffusion coefficient in the disc reached the previously measured value of 1.7 × 10⁻⁶ cm2/second. The resulting unstirred layer was 265 μm in both 450-μm and 1,050-μm discs, in precise agreement with each other and suggesting that inclusion of an effective dead space, or unstirred layer, of 265 μm is necessary to obtain an accurate value for the diffusion coefficient with our methods. The dashed lines in Fig. 4, A and B, represent the best least squares fit for diffusion into the agar discs, assuming the presence of a 265-μm unstirred layer and a diffusion coefficient of 1.7 × 10⁻⁶ cm2/second in both the unstirred layer and the agar. The effects of including this unstirred layer in slice experiments can be observed by comparing the calculated values of the diffusion coefficient for each tracer with the corrected values in Table 5. For example, the diffusion coefficient of PEG would change from 0.39 × 10⁻⁶ to 0.48 × 10⁻⁶ cm2/second in control thin slices, from 0.30 × 10⁻⁶ to 0.38 × 10⁻⁶ cm2/second in hypoxic 450-μm slices, and from 1.11 × 10⁻⁶ to 1.23 × 10⁻⁶ cm2/second in thick slices (Tables 3 and 5). All conclusions and discussions are based on the values of diffusion coefficients that were corrected for an unstirred layer—dead space.
Diffusion of 14C-PEG into 450-μm (
Kinetics of 14C-PEG in Agar Discs
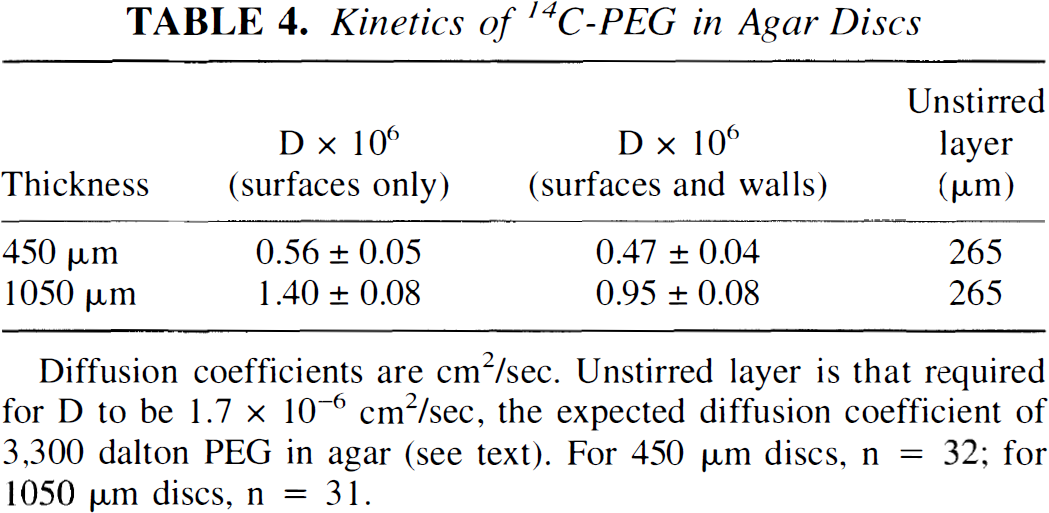
Diffusion coefficients are cm2/sec. Unstirred layer is that required for D to be 1.7 × 10⁻⁶ cm2/sec, the expected diffusion coefficient of 3,300 dalton PEG in agar (see text). For 450 μm discs, n = 32; for 1050 μm discs, n = 31.
Diffusion coefficients and tortuosity corrected for unstirred layer
All diffusion coefficients are cm2/sec at 37°C. Dtissue are based on analysis with serial model. ND indicates that measurement was not done. Values of Dw are from Lide, 1995. The value for 3OMG is actually that for glucose which has been used in the absence of any published value for 3OMG.
Although we have not quantified the results of slices incubated with fluorescein-labeled 3,000-Da dextran, two results are apparent from inspection of the data. First, fluorescent material is visible in the central sections of thick slices within 5 minutes, and there is a substantial amount of fluorescence in the central sections within 10 minutes. Second, by 30 minutes the fluorescence of the central sections of thick slices is nearly as high as that of sections near the slice surface. Thus these preliminary, qualitative results are consistent with the quantitative results shown for 3,300-Da PEG in Fig. 3A and B.
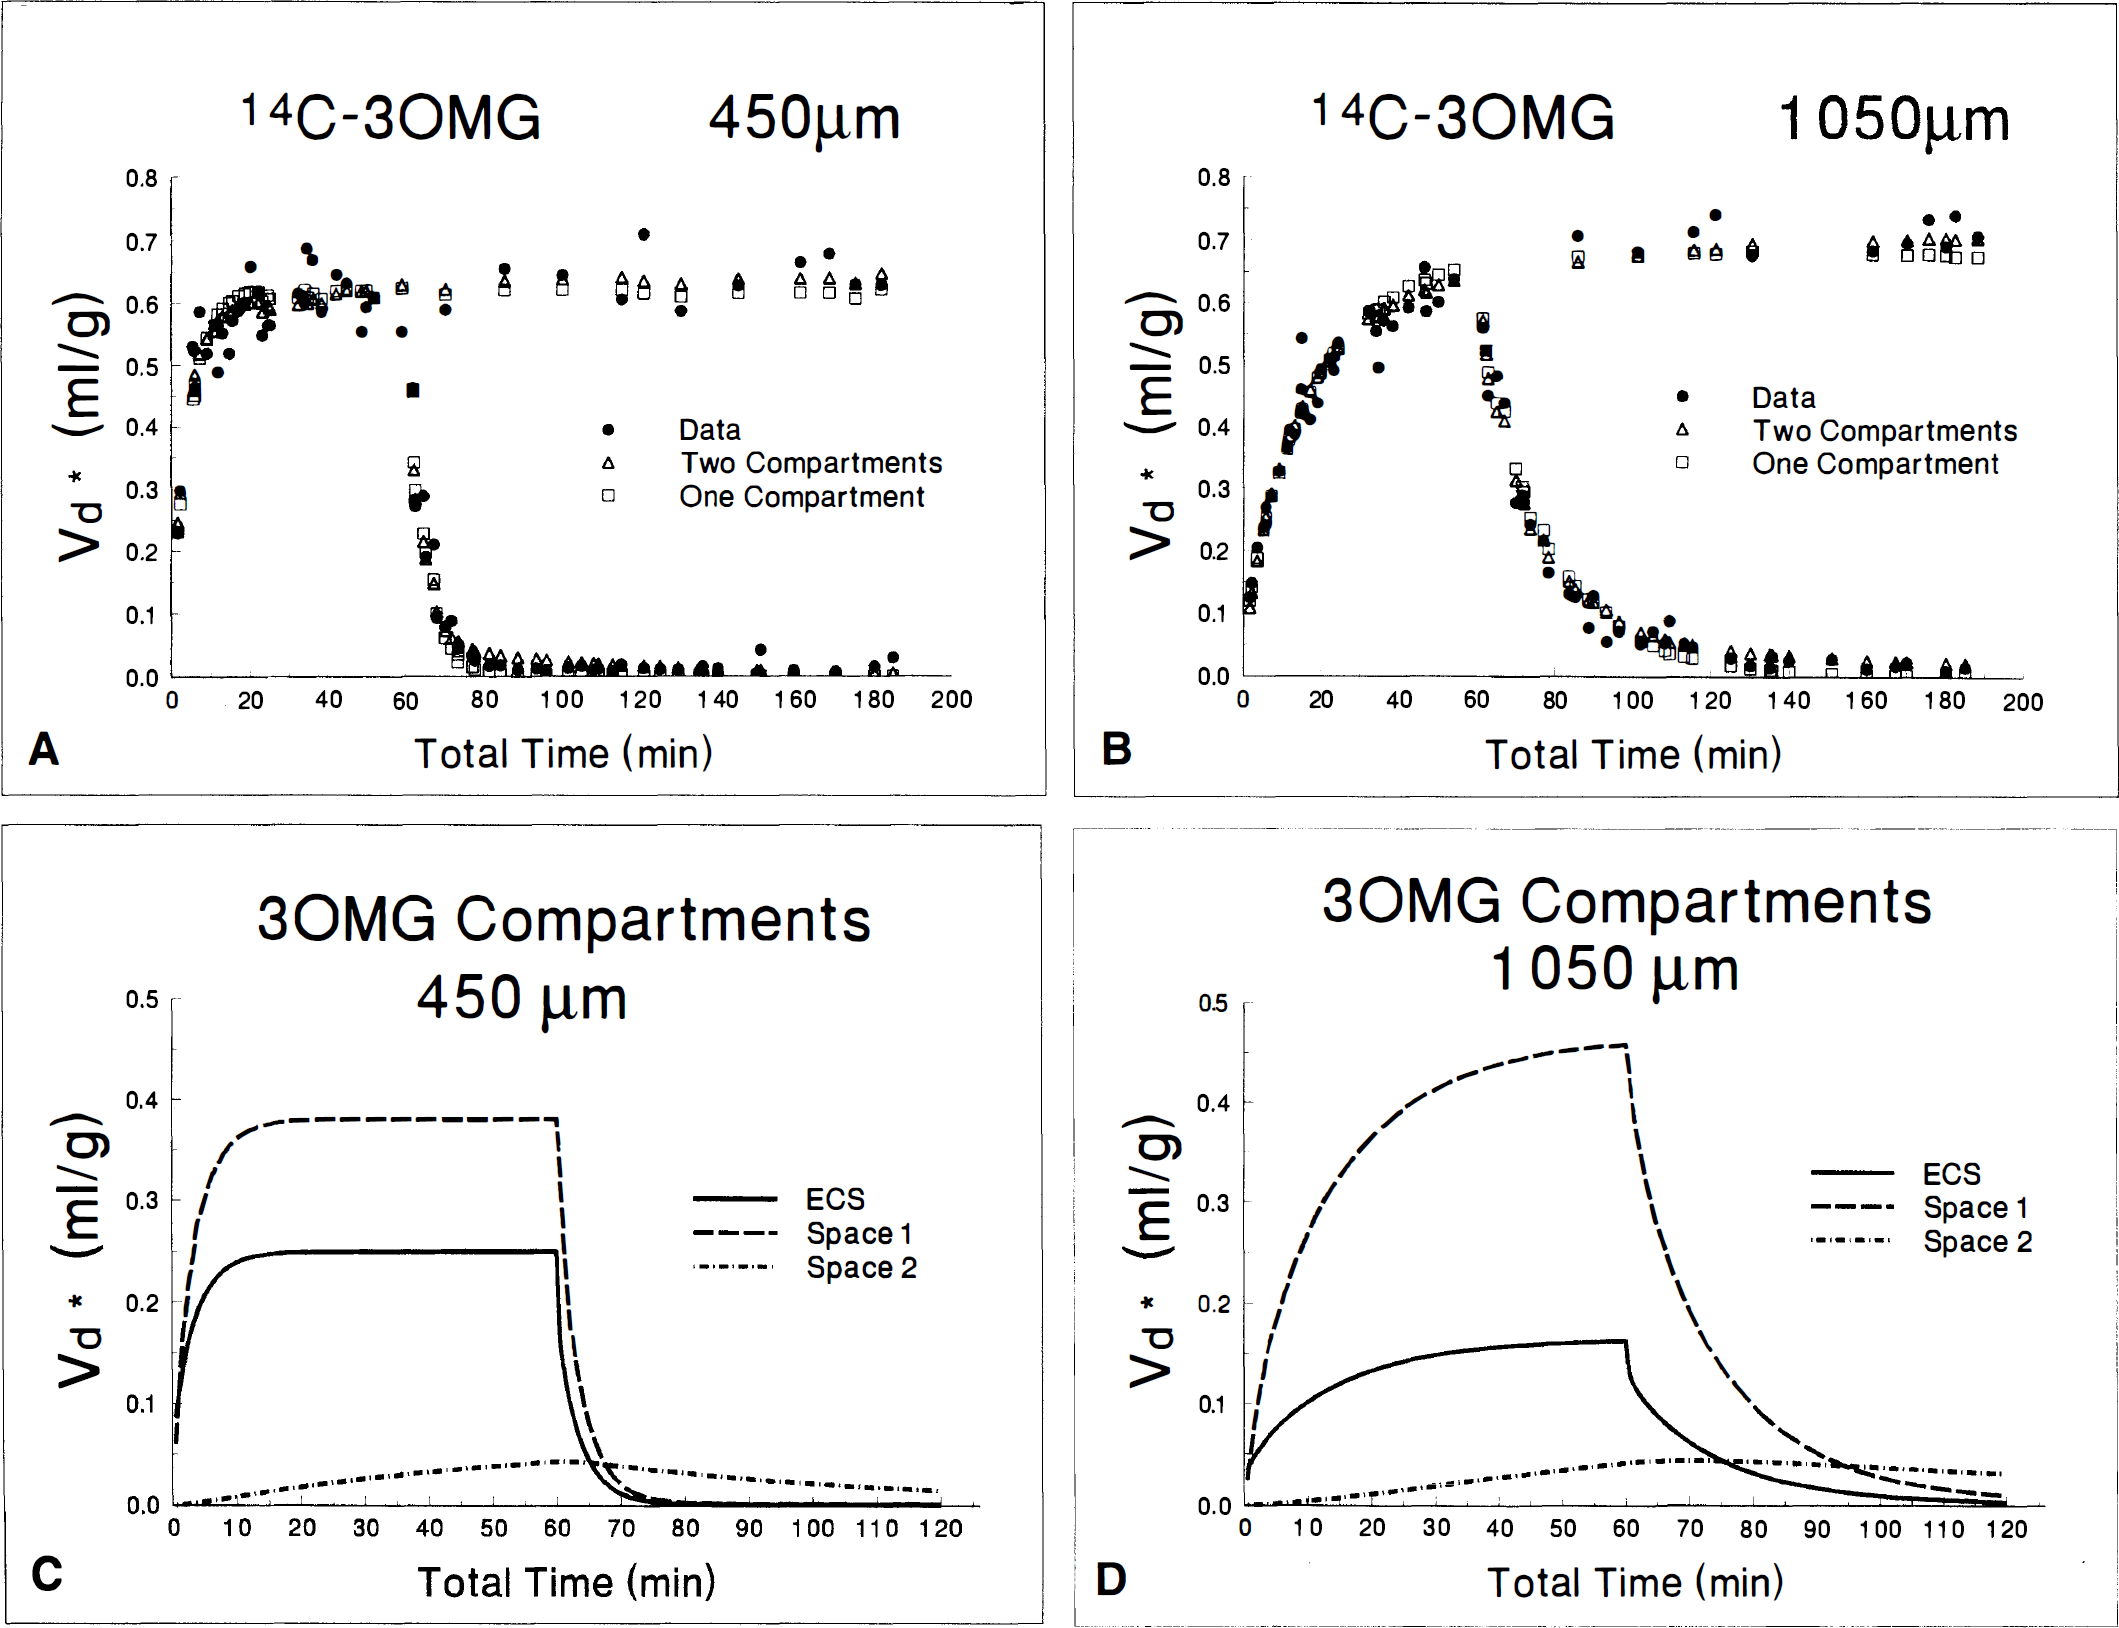
Kinetics of 3H2O
Kinetics of 3H2O appear different from those of PEG because diffusion and cellular exchange are much faster and because they promptly return to baseline during washout, showing none of the nonspecific binding apparent with PEG (Fig. 5). Because any reasonable description of water movement in tissue requires both intracellular and extracellular diffusion, we did not analyze the 3H2O data with a compartmental model but used only models based on diffusion alone. The model presented assumes that cell membranes pose no effective barrier to rapid diffusion of water so that all tissue compartments are in equilibrium and only a single apparent diffusion constant can be observed (Table 6; Appendix 2). Attempts to analyze the 3H2O data with a model incorporating two parallel diffusion paths in rapid equilibrium with each other (representing intracellular and extracellular pathways) was not successful because the permeability of water is too great to permit resolution of two pathways given the temporal limitations and scatter of our data. However, calculated tortuosity is much greater for 3H2O than for the other tracers in both thin and thick slices (Table 5), apparently reflecting the mixture of ECS diffusion with more restricted intracellular diffusion. Moreover, the total 3H2O space appears to be significantly larger in thin slices than in thick slices. Finally, when the effects of the chamber dead space and unstirred layer are taken into account, the overall diffusion in thick slices is nearly twice as fast as in thin slices.
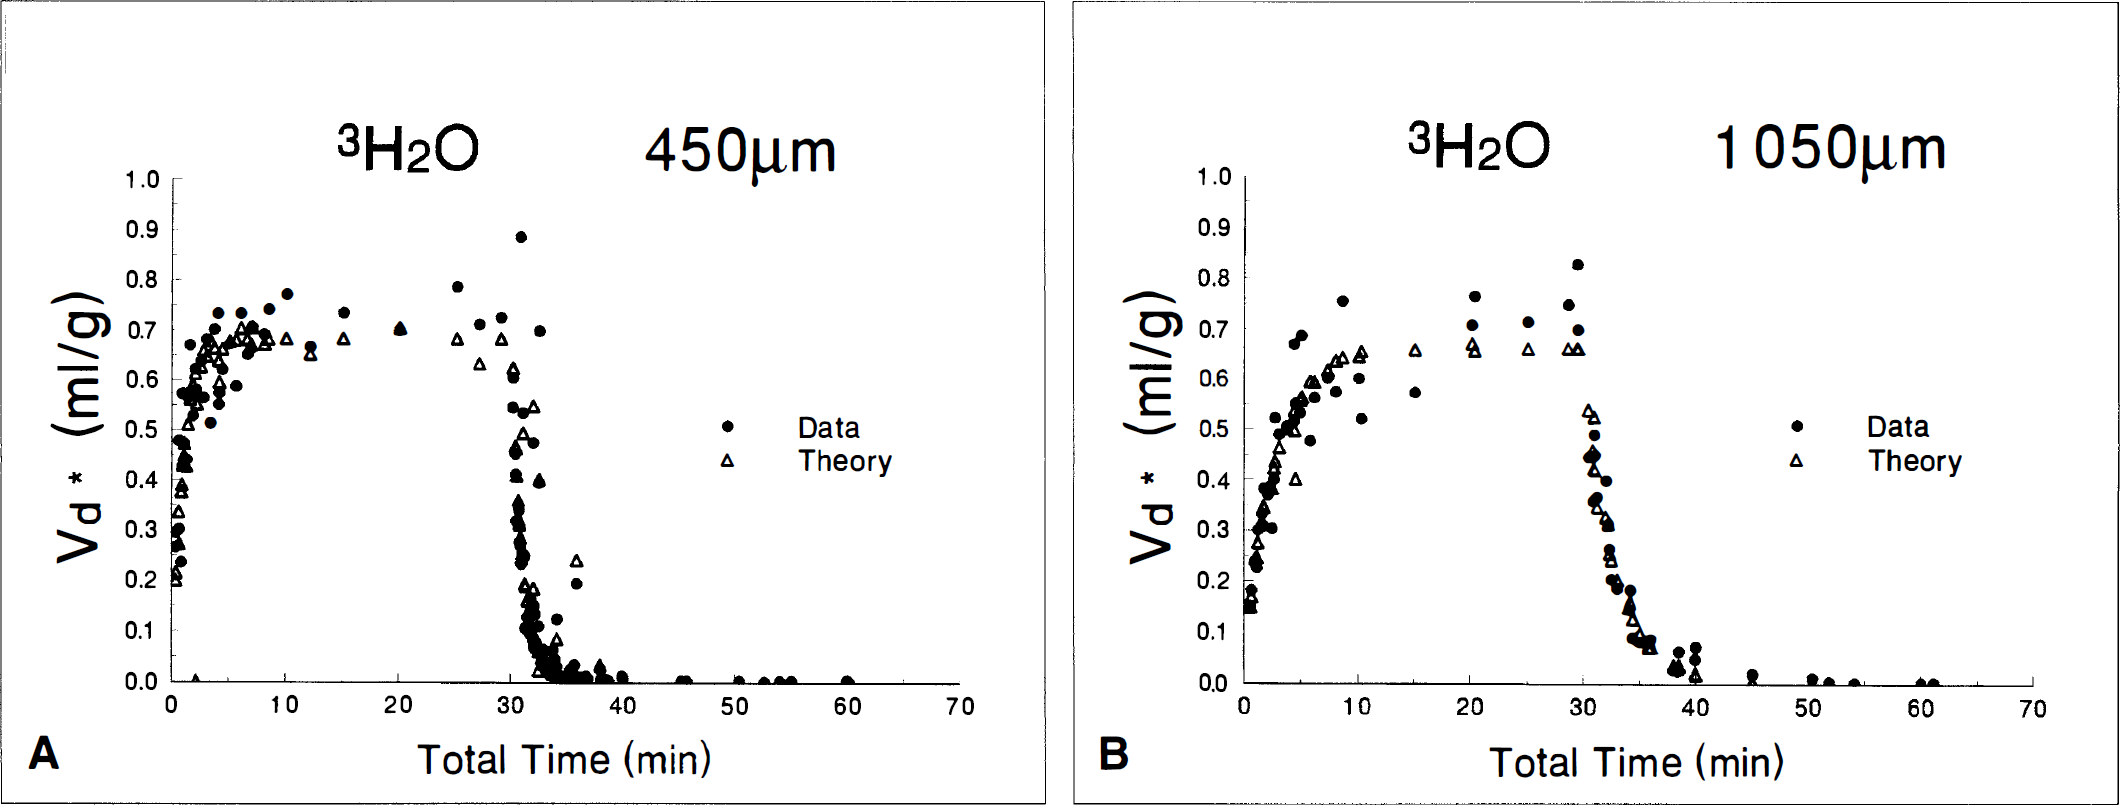
Data (•) and best least squares fit (Δ) of 3H2O diffusion in 450-μm (
Diffusion of 3H2O
Total volume is in mL/g; D is cm2/sec and is uncorrected for unstirred layer. For 450 μm slices, n = 119; for 1050 μm slices, n = 60.
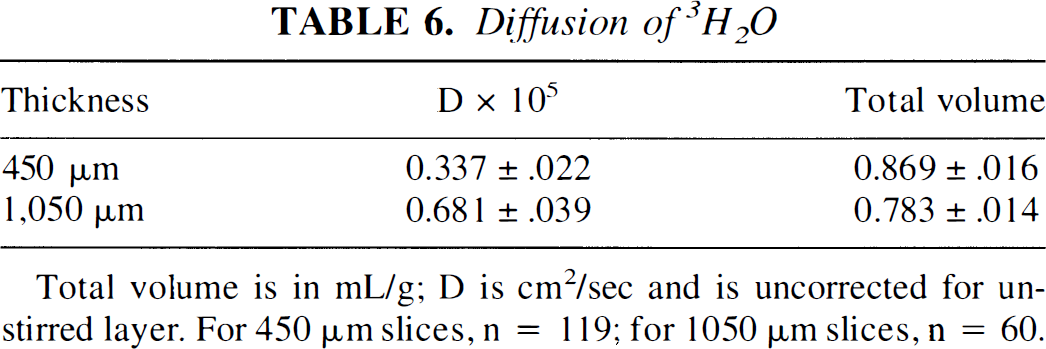
14C-3-O-Methylglucose
Analysis of 14C-3OMG data in thin or thick slices requires a more complex kinetic model than that used for 14C-PEG or 3H2O. This is evident from visual analysis, which reveals that the fit with a one-compartment model is less satisfactory than the fit with two compartments (Fig. 6A and B), and because adding a second compartment reduces the sum of the squares of the best fits by 50%. Results of the kinetic analyses for the two slice thicknesses (Table 7) are virtually the same whether a serial or parallel model is used. The standard errors of the rate constants k1 and k2 are large, nearly twice the size of the value of the constant The errors of k3 and k4 or k1′ and k2′ are smaller but still of the same size as the rate constants themselves. The compartment volumes, however, can be determined with much greater accuracy than the rate constants. There is virtually no difference in compartment volumes whether the serial or parallel model is used. The results for the diffusion coefficients are consistent with the results of 14C-PEG (Table 5). The diffusion coefficient in the thick slice is nearly twice that in the thin slice and more closely approaches the expected diffusion coefficient of 3OMG in water. The total cell volumes are very similar to the values that we have previously determined for thin and thick hippocampal brain slices in earlier experiments (Newman et al., 1990, 1996). Both intracellular 3OMG spaces in thick slices appear larger than those of thin slices (Fig. 6C and D).
Data (•) and best least squares fit with one (□) or two (Δ) compartments for 14C-3-O-methylglucose kinetics in 450-μm (
Kinetics of 14C-3OMG
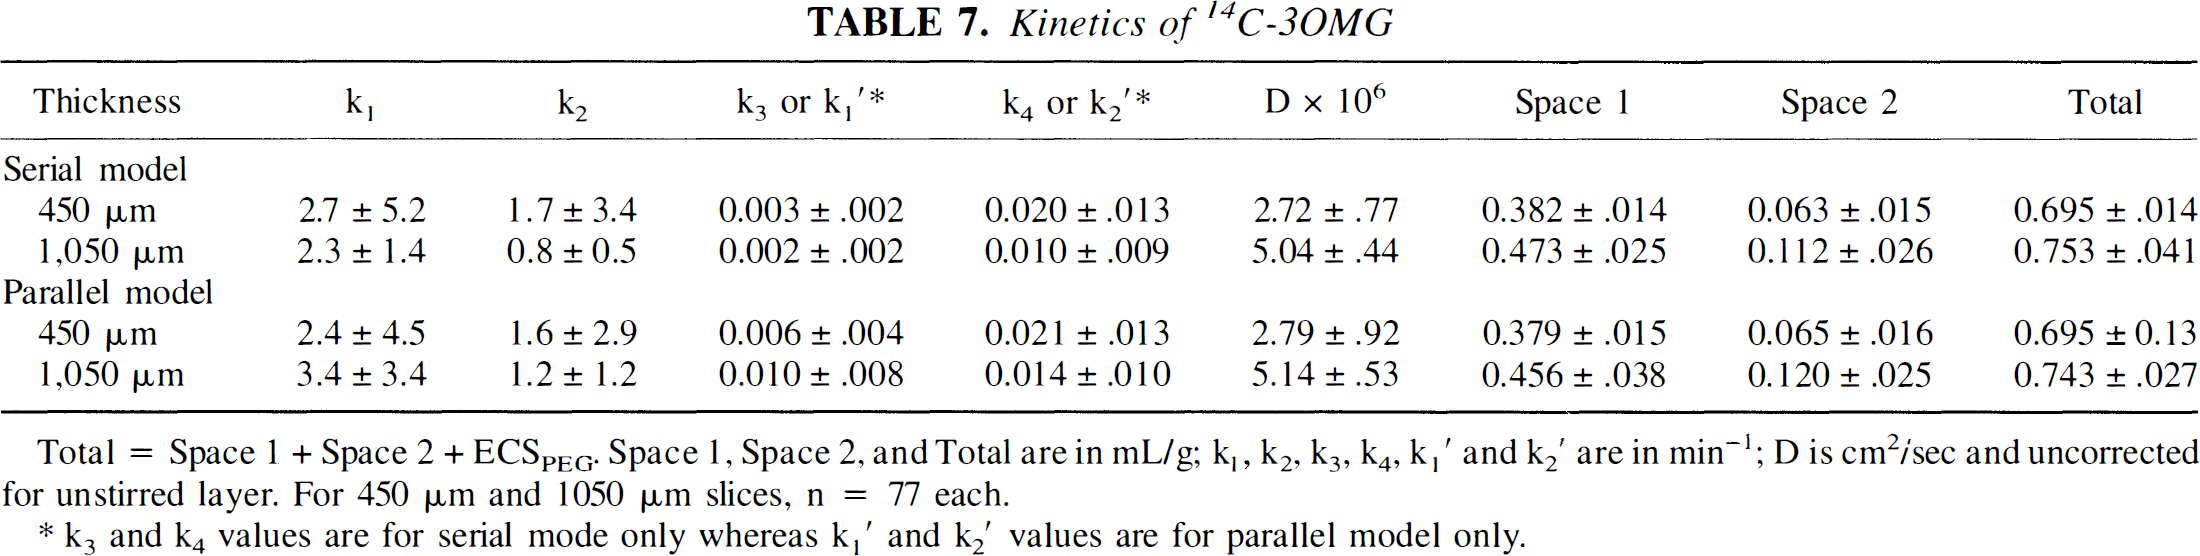
Total = Space 1 + Space 2 + ECSPEG. Space 1, Space 2, and Total are in mL/g; k1, k2, k3, k4, k1′ and k2′ are in min−1; D is cm2/sec and uncorrected for unstirred layer. For 450 μm and 1050 μm slices, n = 77 each.
k3 and k4 values are for serial mode only whereas k1′ and k2′ values are for parallel model only.
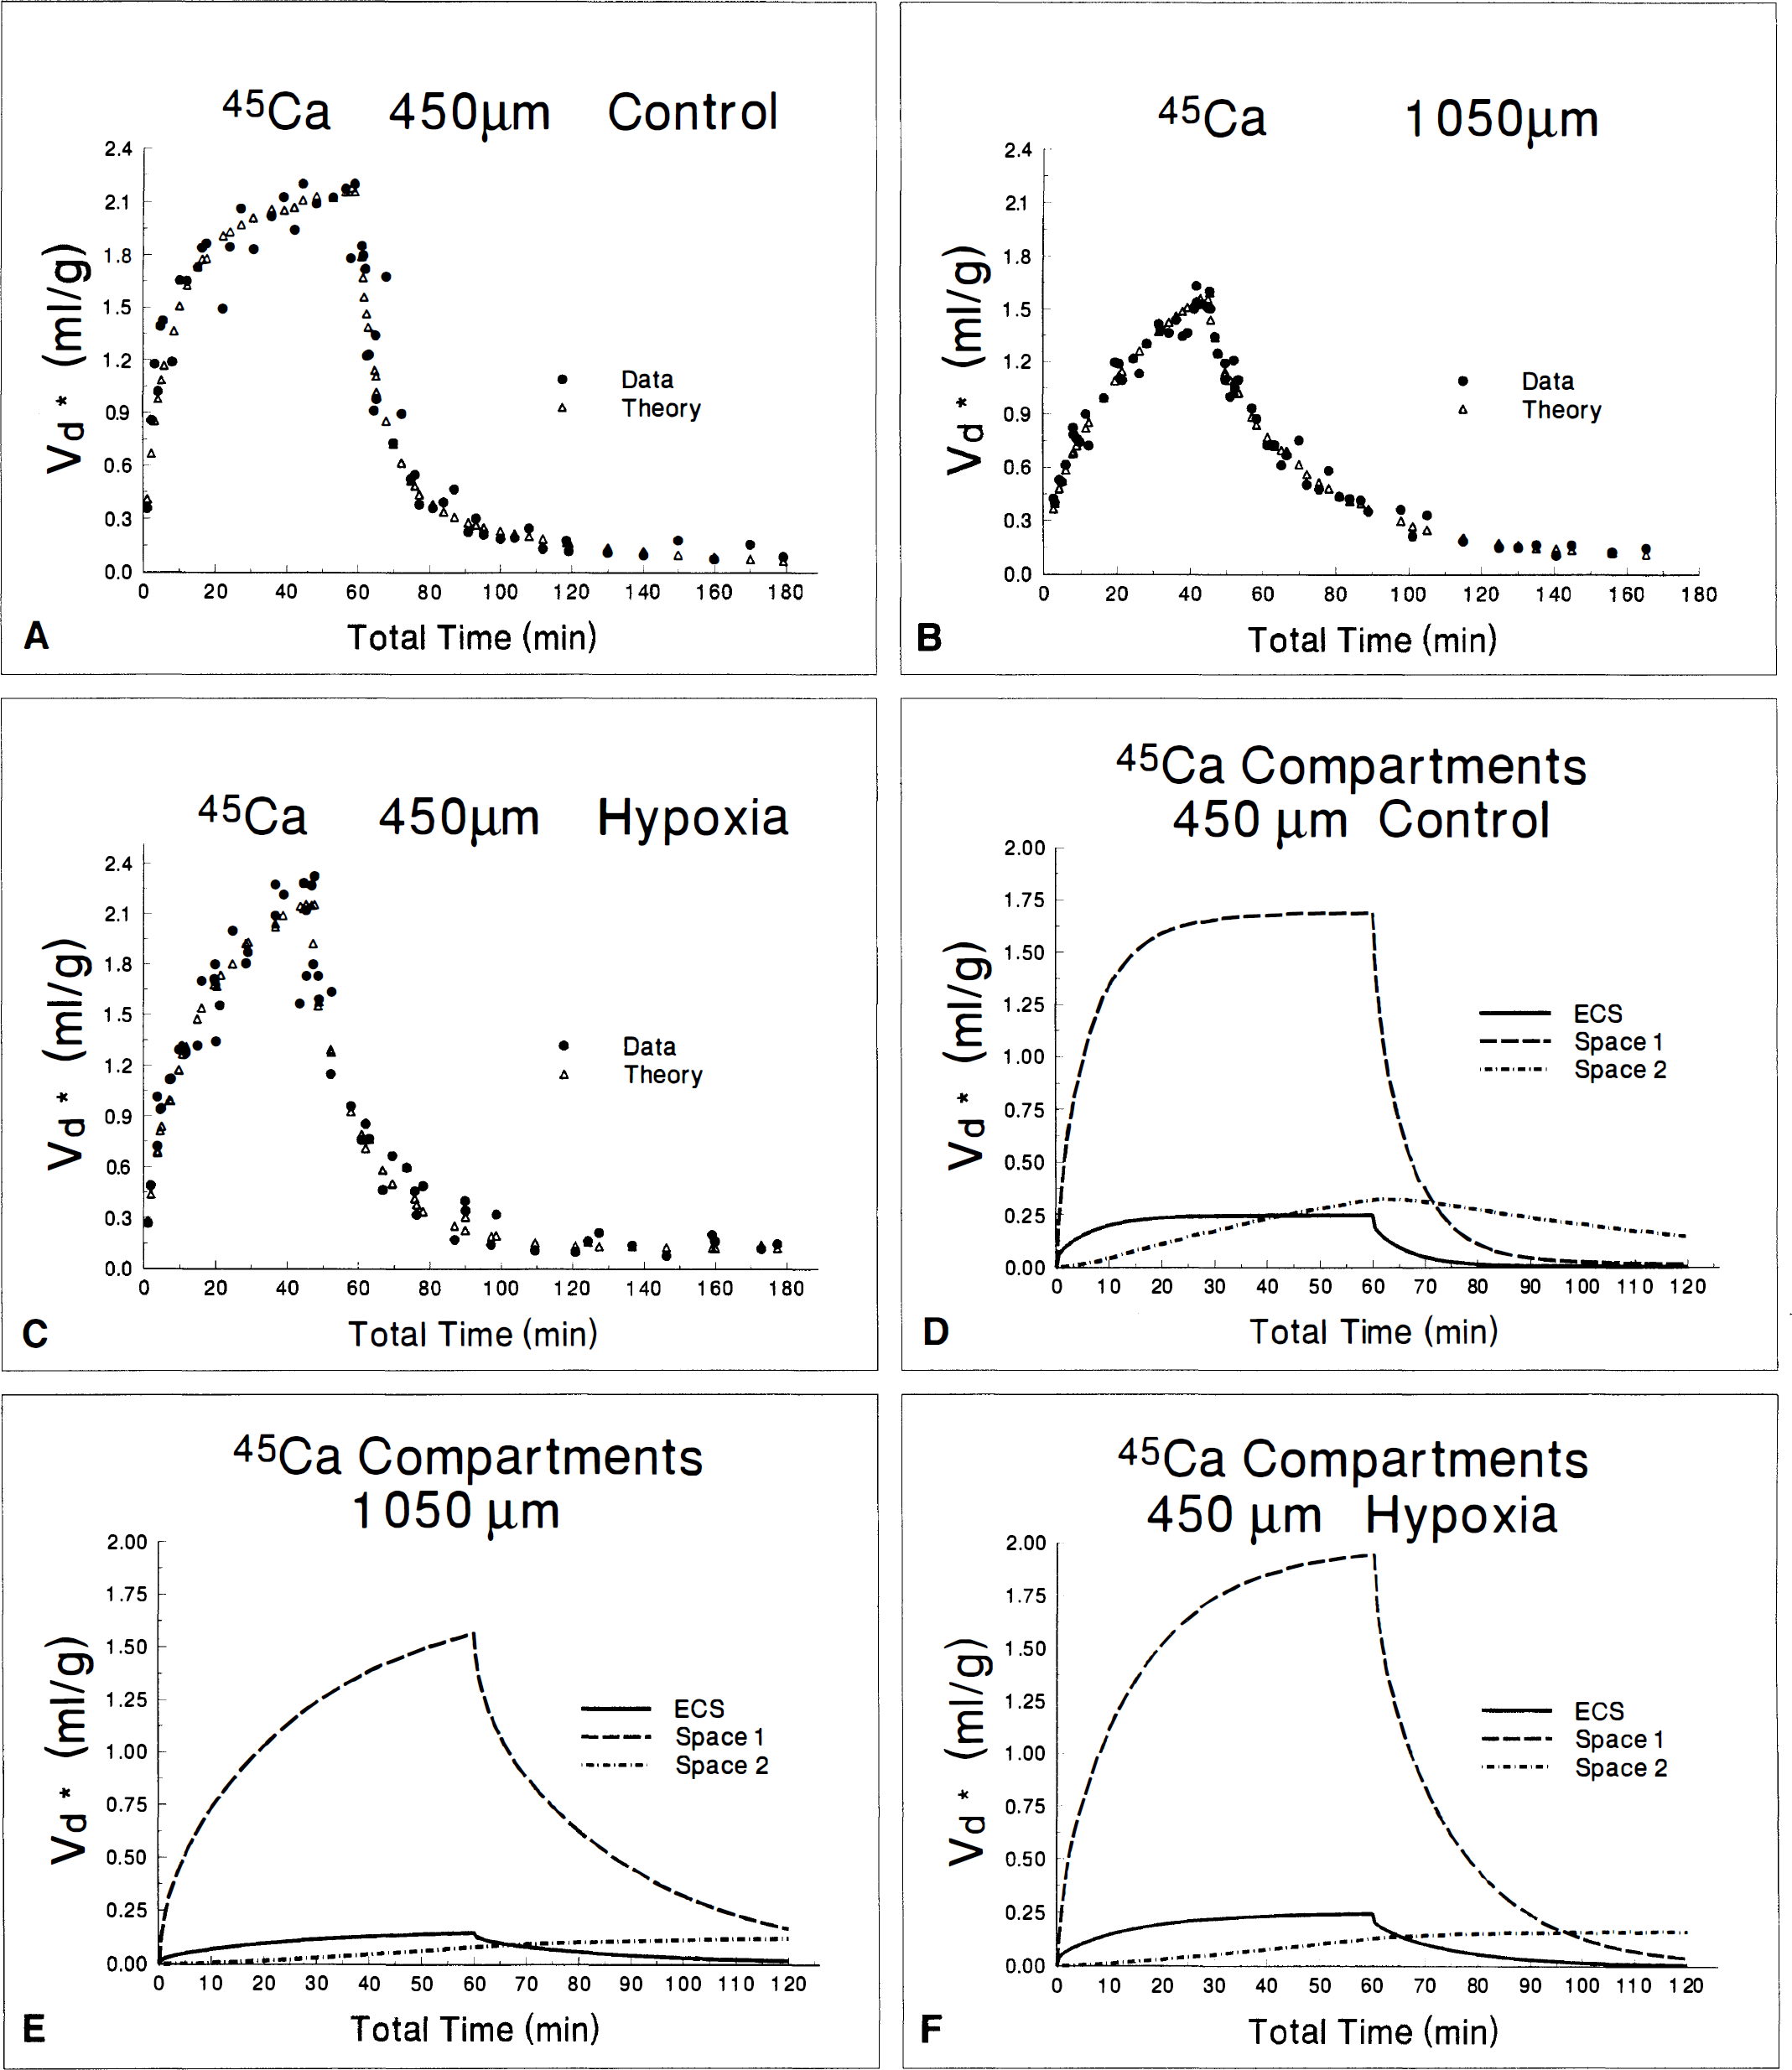
45Ca kinetics
Reanalysis of our previously published 45Ca data with the diffusion model also required the use of two compartments (Fig. 7A-C; Table 8). Attempts to use a three-compartment model produced no further reduction in the sum of squares, and the rate constant errors became unacceptably large. As with the other tracers, the extracellular diffusion coefficient is substantially less than that in water in thin slices and nearly doubles in thick slices (Table 5). The diffusion coefficient of hypoxic slices is decreased relative to control thin slices, however, just as with 14C-PEG. The initial rate constants for cellular uptake are all extremely fast, perhaps slightly faster in the thick slice but the large standard errors make this uncertain. In all three conditions, the amount of Ca+2 in the first, rapidly exchanging cellular compartment is very large relative to the amount in the ECS so that the total amount of tissue Ca+2 that is cellular is an order of magnitude larger than extracellular Ca+2. The rate constants for the second compartment differ among the slice conditions. Exchange in and out of the second compartment is clearly faster in control 450-μm slices than in either hypoxic or ischemic thick slices. Efflux from the second compartment, in particular, is very slow in the hypoxic and thick slices. As a result, the calculated size of the second compartment becomes very large with time, and would actually be much larger if no limit were placed on k4 or k2′. This kinetic behavior is consistent with essentially irreversible binding or sequestration of Ca+2 within an intracellular subcompartment (Fig. 7D-F). Because this is present in thick and hypoxic slices but not in controls, it may represent an important feature of ischemia.
Data (•) and best least squares fit with two (Δ) compartments for 45Ca kinetics in 450-μm (
Kinetics of 45Ca
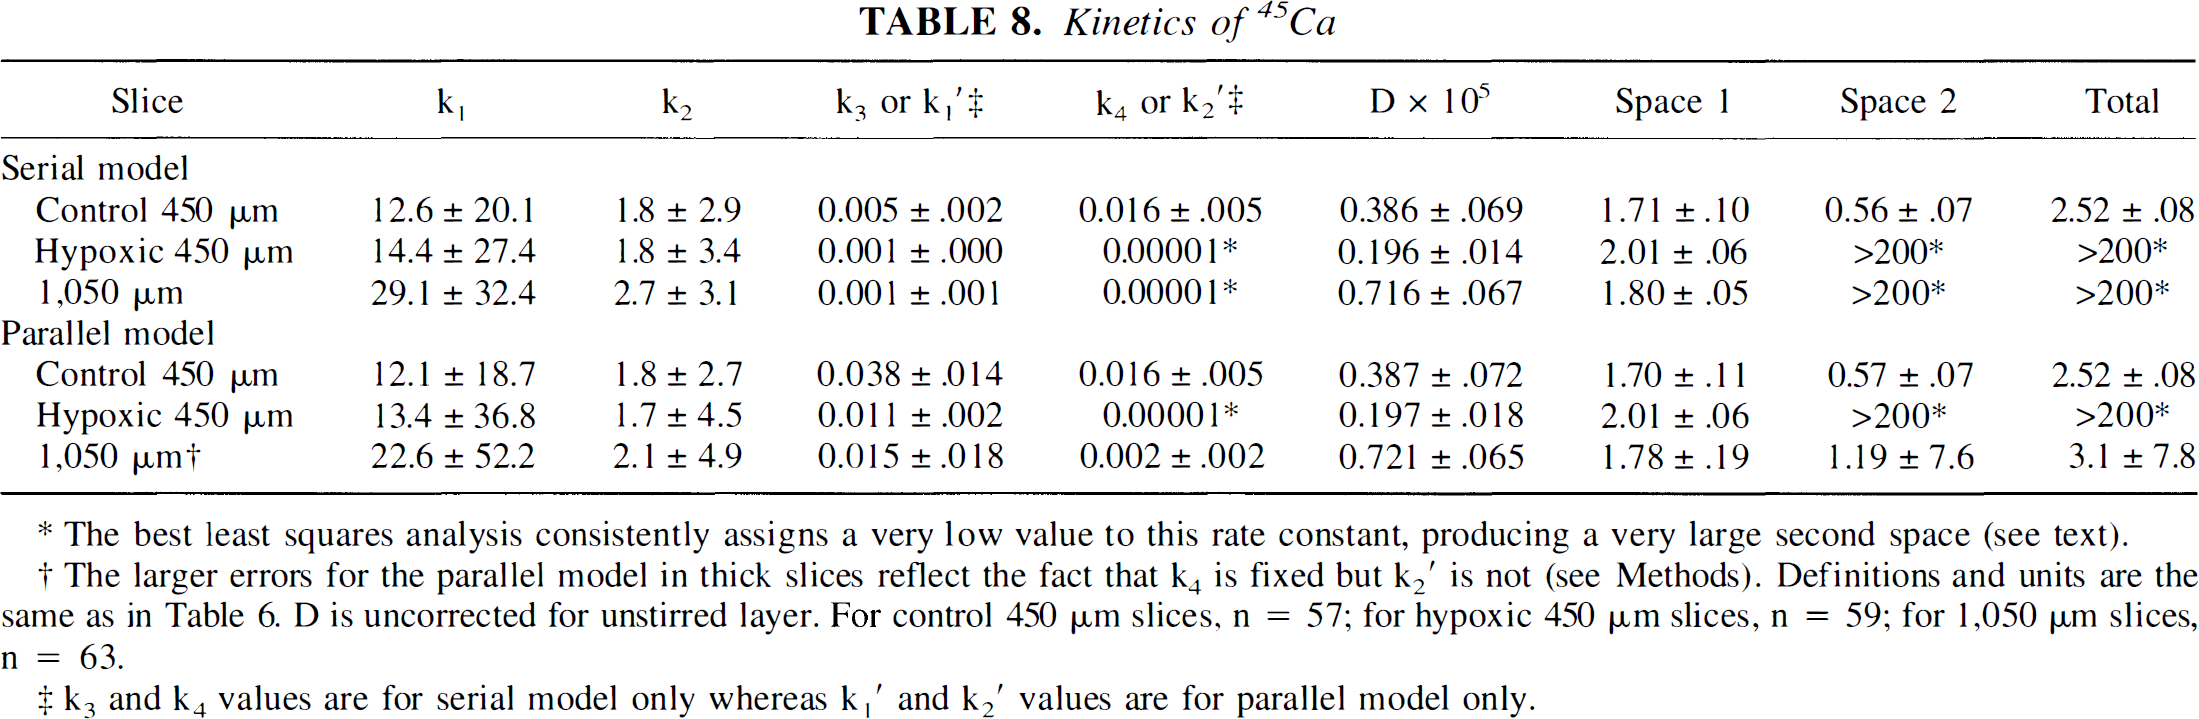
The best least squares analysis consistently assigns a very low value to this rate constant, producing a very large second space (see text).
The larger errors for the parallel model in thick slices reflect the fact that k4 is fixed but k2′ is not (see Methods). Definitions and units are the same as in Table 6. D is uncorrected for unstirred layer. For control 450 μm slices, n = 57; for hypoxic 450 μm slices, n = 59; for 1,050 μm slices, n = 63.
k3 and k4 values are for serial model only whereas k1′ and k2′ values are for parallel model only.
Unstirred layer
The results of incorporating an unstirred layer on the calculated diffusion coefficient have been presented for each individual tracer (Table 5). To summarize these results, the diffusion coefficients for thin slices increase by an average of 18% when the unstirred layer is taken into account, whereas the relative effect is smaller in thick slices such that the diffusion coefficients in thick slices increase by only about 8%. The results with 3H2O differ substantially from those of the other tracers, as would be expected, because the diffusion coefficient for 3H2O is the only one that includes intracellular diffusion. Finally, even when the unstirred layer is included in the calculation, the tracer diffusion coefficients are much faster in thick slices than in thin slices.
Error analysis
Error analysis of the 45Ca control data revealed that letting A in equation. 3 equal to 0.1 produced a sum of squares very similar to that found with the experimental data. Doubling A tripled the experimental sum of squares. With A = 0.1, repeated fitting procedures generated values and standard errors of k1 and k2 that were generally similar to the values from the best fit of the experimental data but could be much smaller, by almost an order of magnitude. Values of k1′ and k2′ were generally close to the parameters based on experimental data, differing in most cases by less than 20%. Even better correlations were found for D and the ratios k1/k2 and k1′/k2′, which form the basis for estimating the size of the compartments. With A = 0.1, these parameters were consistently within 5% of the experimentally derived parameters, and even with A = 0.2, the mean values from the error analyses were also within 5% for D and k1/k2 and within 14% for k1′/k2′. Thus this error analysis suggests that these equations yield robust estimates for D, k1/k2, and k1′/k2′ from data with the degree of noise present in these experiments.
DISCUSSION
The kinetic models that we have presented consider diffusion of solutes in the ECS together with bound or intracellular tissue compartments connected in series and in parallel but do not include the effects of bulk flow or blood—brain barrier transport, which are not present in tissue slices. The models have been used to study control and hypoxic 450-μm hippocampal brain slices and ischemic 1,050-μm slices with a variety of radiotracers chosen to address specific issues regarding diffusion and tissue transport. Most of the results are consistent with or extend earlier observations, but the effect of slice thickness on extracellular tortuosity is entirely unexpected, raising important questions about the structure of the ECS and its response to ischemia if these results are subsequently confirmed.
The value of α, the ECS volume fraction in brain, has been measured at about 0.21 using ISM in tissue slices and in vivo, with a reported range between 0.18 and 0.29 (Nicholson and Phillips, 1981; Rice and Nicholson, 1991; Lundbæk and Hansen, 1992; Lipinski and Bingmann, 1987; Syková et al., 1994). Ion-selective microelectrode measurements of hippocampal brain slices demonstrate that α varies among subregions, from 0.12 in CA1 to 0.18 in CA3 stratum pyramidale (McBain et al., 1990; Pérez-Pinzón et al., 1995). Our value of 0.25 ± 0.02 for 450-μm control hippocampal slices, obtained from least squares analysis of 14C-PEG data, is consistent with the ISM results because whole-slice radioisotope methods include the injury space at the cut slice surface. This space has been estimated by analysis of serial electron micrographs (Newman, 1991). For 450-μm slices, the space is about 5% of the total slice volume; for 1,050-μm slices, the surface injury would be 2.4% of the total slice volume. With correction for surface injury, the 14C-PEG spaces become 0.21 for 450-μm slices and 0.15 for 1,050-μm slices. Our results in thin slices are also consistent with prior estimates of λ, the tortuosity of the ECS, where λ2 = Dw/Dtissue, Dw is the diffusion coefficient of a tracer in bulk water (or agar) and Dtissue is the measured diffusion coefficient in tissue. Analyses of extracellular radiotracer kinetics in thin slices yielded λ values of 1.53 for 3OMG and 1.52 for 45Ca (Table 5), in excellent agreement with prior estimates in normal brain tissue in vivo and in brain slices measured using other methods (Nicholson and Phillips, 1981; Lipinski and Bingmann, 1987; McBain et al., 1990; Rice and Nicholson, 1991; Lundbæk and Hansen, 1992). Note that the slightly larger value of 1.88 for λ with PEG suggests possible restriction of movement, even for this 3,300-Da molecule, in ECS compared with the smaller radiotracers. These results with 14C-PEG required subtraction of a nonspecific binding component through use of a one-compartment model. The exact nature of this interaction between the tissue and PEG is unknown, but the fact that the bound space is not affected by hypoxia or slice thickness suggests that it is not related to the volume or tortuosity of ECS or the energy state of the tissue. A similar subtraction must also be made for tetramethylammonium, the most commonly used ionic tracer of the ISM method (Rice and Nicholson, 1991).
Diffusion-weighted magnetic resonance imaging (MRI) makes possible the measurement of an apparent diffusion coefficient (ADC) for water in human brains. Typical values of the ADC range between 0.64 and 1.1 × 10⁻⁵ cm2/second (Le Bihan, 1991; Zhong et al., 1993; Niendorf et al., 1994; Hoehn-Berlage et al., 1995; Miyabe et al., 1996), compared with the self-diffusion of water, which is variably estimated to be between 2.2 and 3.2 × 10⁻⁵ cm2/second (Harris and Woolf, 1980). The factors that contribute to the ADC are still a matter of controversy but certainly include extracellular and intracellular diffusion (Pierpaoli et al., 1993; Knight et al., 1994; Miyabe et al., 1996). The ADC also may be influenced by bulk flow of interstitial fluid (Rosenberg et al., 1980; Cserr et al., 1981), but contributions from blood flow are usually suppressed. Our plan was to use 3H2O as a tracer to distinguish intracellular and extracellular diffusion in a setting lacking tissue pulsation and perfusion. Unfortunately, the very fast diffusion coefficient of 3H2O exceeds the technical limits of our slice-handling methodology. The relatively wide scatter and poor fit of our data reflect the difficulty of avoiding carryover of radioactivity from the bath while simultaneously avoiding washout of tracer from the tissue. Because water can diffuse through cells as well as in the ECS, a compartmental model would be inappropriate. Attempts to use a model with two parallel diffusion paths in equilibrium (Redwood et al., 1974; Fig. 1H) was not successful because the noise of the data and rapidity of the processes produced large standard errors in the estimates of the diffusion and rate constants. Thus the only choice left was to use a model with a single constant that combined intracellular and extracellular diffusion, similar to that used for MRI data, to obtain the apparent diffusion coefficient. The resulting value for the 3H2O diffusion coefficient of 0.37 ± 0.02 × 10⁻⁵ cm2/second is similar to the value of 0.282 ± 0.006 × 10⁻⁵ cm2/second found in vitro for packed red blood cells (Redwood et al., 1974) and is virtually the same as the estimated ADC for water in cerebral cortex based on pulsed-field-gradient spin echo nuclear magnetic resonance measurements (Latour et al., 1994). Because extracellular and intracellular diffusion in the control 450-μm brain slices should be similar to that occurring in vivo, the larger value of the ADC compared with these theoretical and in vitro values suggests that bulk flow of interstitial fluid may, in fact, contribute substantially to the ADC.
The kinetic models and radiotracer methods used for this study permit calculation of tissue uptake, as a result of binding or transport, in one or more tissue compartments arranged in series, in parallel, or both. The assumptions of this approach have been detailed in Appendix 1 and include uniform distribution of the system parameters throughout the slice, reversible entry into bound or cellular compartments, and the absence of biochemical metabolism. Although the technique lacks the rapidity and efficient sampling associated with ISM diffusion measurements, it complements ISM experiments both by serving as an independent means of confirming results and by providing direct information about the amount of tracer that interacts with the cellular tissue spaces. Results with 45Ca and 14C-3OMG highlight the value of this approach.
One of the central goals of this research was to improve on our prior compartmental kinetic analysis of 45Ca in brain slices (Newman et al., 1995a) so that the kinetic model more accurately reflects the actual biologic system, thus facilitating interpretation. The analysis of 45Ca data successfully separates extracellular diffusion from tissue interactions (Fig. 7; Table 8), with reasonably good estimates of the diffusion coefficient, the size of both tissue spaces, and the rate constants, k3 and k4. The values for the latter constants are virtually identical to those obtained with the two-compartment model. Unfortunately, the standard errors for the first-space rate constants are very large so that only a gross approximation of the size of k1 and k2 could be obtained. The most important result with control slices concerns the amount of Ca+2 present in tissue compared with the amount of Ca+2 present in ECS (Table 8; Fig. 7D). It is clear that the two tissue compartments together have nearly 10 times the amount of Ca+2 present in ECS. This result is not apparent from studies using intracellular fluorescent Ca+2 dyes, which demonstrate very low levels of free intracellular Ca+2 but do not reflect Ca+2 bound or sequestered in cells (Carafoli, 1987). These results are consistent, however, with earlier whole-tissue studies in vivo, which place the range of whole brain between 1.5 and 4 mmol/kg wet weight (Massie et al., 1989; Shapira et al., 1989; Mehta et al., 1990), indicating concentration of Ca+2 greater than the ECS level. Relatively few studies have addressed the issue of extracellular diffusion of Ca+2 in the nervous system. Nicholson and Rice (1987) reviewed earlier studies and added measurements of their own using pressure injections of Ca+2 into cerebral cortex of rat. Measurements by pressure injection and ISM detection suggested a diffusion coefficient of 4.42 × 10⁻⁶ cm2/second, yielding a tortuosity of 1.77. Based on the similarity of this tortuosity with that for tetramethylammonium, they suggested that geometric factors could account for most of the retardation of tissue diffusion and concluded that Ca+2 must have little interaction with tissue as it diffuses through the ECS. It is apparent from Table 5 that our value of 5.0 × 10⁻⁶ cm2/second, which yields a value of λ = 1.5, for Ca+2 diffusion in thin control slices agrees reasonably well with their measurements. However, as discussed above, the complete kinetic curve for 45Ca (Fig. 7A and D) indicates substantial interactions of Ca+2 with tissue. How is it possible for the two results to agree this well even though the conclusions about tissue interactions differ? With radiotracer methods, the interactions are sufficiently slow to permit identification of the tissue compartments so that the calculated apparent diffusion coefficient reflects primarily movement in ECS. With ISM measurements, the brief time course of the experiment permits the simplifying assumption of unidirectional tracer influx for Ca+2. Thus, for different reasons, both methods yield valid measures of extracellular diffusion despite the extensive interactions that are expected and that are observed with the radiotracer results.
Another specific goal of these studies was to determine whether a kinetic model that includes diffusion with one cellular compartment could provide an adequate description of 3OMG kinetics in brain slices. Prior studies had demonstrated that two compartments are needed to accurately describe brain 3OMG kinetics in vivo and in vitro (Vyska et al., 1985; Brooks et al., 1986; Newman et al., 1990). This is unexpected because 3OMG is not significantly phosphorylated in mammalian brain within the usual experimental time course (Jay et al., 1990; Holden et al., 1991). We have recently confirmed the absence of 3OMG phosphorylation in brain slices incubated in 0.25 mmol/L glucose, a condition that should favor phosphorylation (unpublished observations). The results in Fig. 6A and B, clearly show that two compartments are needed even when diffusion is taken into consideration, because the fit with ECS diffusion and two compartments is much better visually and the sum of the squares is reduced by more than 25% for the 450-μm slices and more than 50% for the 1,050-μm slices when the second tissue compartment is added. Because 3OMG is not phosphorylated, intracellular compartmentalization or tissue heterogeneity are the probable explanations for the need of the second tissue space. Note also that the value of λ is 1.53, virtually the same as for 45Ca (Table 5), consistent with the suggestion that charge has little effect on extracellular tortuosity (Nicholson and Rice, 1987).
The thick slice model of ischemia (Newman et al., 1988) uses long diffusional distances from the interior to the surface to introduce the factor of reduced clearance that is present during cerebral ischemia in vivo. Even when maintained in well-oxygenated buffer with normal glucose, thick slices spontaneously develop a hypoxic core (Bingmann and Kolde, 1982), have increased extracellular K+ (Lipinski and Bingmann, 1986), gain tissue water (Newman et al., 1995b), increase glucose utilization and lactate with substantial differences in 2-deoxyglucose kinetics (Newman et al., 1988, 1990, 1996), and respond differently from thin slices to acidosis and high K+ (Newman et al., 1991). Despite the hypoxic core, histologic changes and glucose utilization are remarkably uniform at all slice depths. The present histology and adenylate values are typical of our earlier and more recent results, demonstrating significant worsening of histology in all hippocampal regions of thick slices except CA3, together with lower ATP, higher AMP, and a much lower adenylate energy charge. From these published results and our present findings, we estimate that the 1,050-μm thick hippocampal slice most closely resembles the ischemic penumbra with cerebral blood flow rate of about 20 mL·100 g−1·minute−1. Results for hypoxic 450-μm hippocampal slices have been included for several measures to assist in interpretation of the kinetic differences between 450-μm and 1,050-μm slices. It is apparent from Tables 1 and 2 that the histologic injury and reduction in adenylates of 450-μm slices incubated continuously for 2.5 hours with air (hypoxia), after 1.5 hours of slice equilibration under control conditions, are similar to or slightly less severe than those in the 1,050-μm slices after 4 hours in vitro.
The value of α, the extracellular volume fraction of 14C-PEG, corrected for surface injury, decreases from 0.21 in thin slices to 0.15 in thick slices, at the upper range of other measurements of α during ischemia. Studies using ISM have demonstrated reductions of α by 50% in exposed cortex of pentobarbital-anesthetized rats made ischemic by inflation of a cuff around the neck or by cardiac arrest (Hansen and Olsen, 1980), from 0.23 to 0.07 in layers V and VI of rat cerebral cortex after global ischemia (Syková et al., 1994), from 0.18 to 0.07 in rat brain cortex (Lundbæk and Hansen, 1992), from 0.14 to 0.05 and 0.20 to 0.1 7 in CA1 and CA3, respectively, of hippocampal brain slices, and from 0.18 to 0.09 in cortical brain slices (Pérez-Pinzón et al., 1995). Similar results were also observed with impedance measurements that demonstrated reductions of α from 0.24 to 0.12 in cortex of adult rats after middle cerebral artery occlusion (Matsuoka and Hossman, 1982). The fact that thick slices show a relatively small reduction in α may be related to the comparatively mild degree of ischemia in our thick slices, because most other studies measured α after anoxic depolarization associated with severe ischemia, but 1,050-μm slices more closely resemble the ischemic penumbra. Observations with ISM and tetramethylammonium in brain slices from neostriatum of adult rats are consistent with this suggestion because α is found to decrease from 0.21 to 0.13 if anoxic depolarization is avoided by maintaining normal glucose when O2 is replaced by N2 (Rice and Nicholson, 1991). Virtually all authors interpret the shrinkage of α during ischemia or hypoxia as reflecting cellular swelling, and our results demonstrating water gain and ECS volume shrinkage under the same conditions are also consistent with this interpretation.
There are several important features of thick slice kinetics worth noting before addressing the complex issue of tortuosity. The first is that despite the fact that slice wet weight is greater for thick slices than thin slices, the volume of distribution for 3H2O is larger in thin slices. The difference is small but apparently significant (Table 6; Fig. 5). This suggests that there is a fraction of water in the thick slices that is not available for rapid exchange with 3H2O and, because water is thought to be freely permeable across all cellular boundaries, that there is a component of water that is “bound” in the ischemic tissue, not available for exchange with the remaining water. This may correlate with the histologic appearance of darkly stained, pyknotic neurons. The second noteworthy change in thick slice kinetics occurs with 45Ca (Table 8; Fig. 7). Whether the serial or parallel model is used, it is clear that the second compartment changes drastically in the thick slice entirely as a result of a very large decrease in k4 or k2′, the rates of efflux from the second compartment in series or parallel, even though the first Ca+2 compartment is the same for the two slice thicknesses. Furthermore, the same effect is observed in hypoxic 450-μm slices, suggesting that this is a common response of hippocampal tissue to progressively declining energy and redox states. In other words, during hypoxia or ischemia, Ca+2 appears to accumulate in a slowly exchanging tissue compartment, possibly an intracellular organelle, because of tight binding or failure of an extrusion mechanism. The third change in slice kinetics with slice thickness is the slightly larger volume of distribution for 14C-3OMG in the 1,050-μm slice, apparently involving both tissue spaces. This seems surprising at first but suggests that glucose is becoming limiting for metabolism in thick slices. It has been demonstrated in vivo that the volume of distribution for 3OMG rises under conditions of hypoglycemia or when glucose is limiting for other reasons (Gjedde, 1982; Buschiazzo et al., 1970; Dienel et al., 1991). Measurements of adenylate compounds in 450-μm hippocampal brain slices demonstrate a decline in the adenylate energy charge when slices are exposed to buffers with glucose less than 1 mmol/L (unpublished observations).
A surprising result of this series of experiments is that the apparent diffusion coefficient in the extracellular space appear to increase in thick slices. For all four radiotracers, the calculated diffusion coefficients for thick slices are significantly larger than for thin slices so that the values of λ are consistently smaller, suggesting that tortuosity is reduced in thick slices. Most comparisons of diffusion in normal and ischemic brain tissue, made using ISM or diffusion-weighted MRI, demonstrate either an increase in λ during ischemia in vivo (Syková et al., 1994; Lundbæk and Hansen, 1992) or no significant change (Rice and Nicholson, 1991), or that the results depend on the region studied. For example, hippocampal CA1 shows no change but CA3 shows a small increase in λ in vitro during anoxia—aglycemia (Pérez-Pinzón et al., 1995). In related studies, hypernatremia also appears to produce a small increase in λ in cortex of anesthetized rats (Cserr et al., 1991), whereas hyperkalemia produces no change in CA1 but a small increase in CA3 (McBain et al., 1990). In no instance has any of these studies using ISM observed a reduction in λ. Similarly, most measurements by diffusion-weighted MRI have consistently demonstrated a fall in the ADC. One in vivo study has, however, measured an increase in the ADC in regions of mild to moderate ischemia (Pierpaoli et al., 1993). In rats subjected to the rose bengal model of frontoparietal ischemia, diffusion-weighted MRI demonstrated an increase of the ADC by 13% to 16% after 6 hours in the cortical regions adjacent to the ischemic core in which the ADC fell by 20% to 55%. Histologic correlations demonstrated classic ischemic neuronal changes with severe swelling of the neuropil and astrocytic processes surrounding the degenerating neurons in the core regions with reduced ADC. Peripheral regions with increased ADC showed pale, spongy appearance with mildly distorted neurons and milder expansion of perineuronal astrocytes. Although an increase in ADC was also observed in the ischemic core after 24 hours, this correlated with complete liquefactive necrosis and is not relevant to the present discussion. Thus, thick slices and the ischemic rim of the rose bengal model share both a similar histologic appearance and increased rates of diffusion. Some caution should be taken in comparing ADC measurements with measurements of extracellular diffusion in slices, however, because changes in ADC almost certainly reflect changes in distribution of water from extracellular to intracellular spaces as well as direct effects of extracellular diffusion rates (Moseley et al., 1990; Benveniste et al., 1992). Because edema is a prominent feature of the rose bengal model, increased intracellular water may have masked an even larger increase in ECS diffusion than is apparent from the observed increase in ADC.
It is not clear how to reconcile the discrepancy between the results from these radioisotope studies and results obtained by ISM methods. Possibilities include the failure of thick brain slices to provide an adequate model of in vivo ischemia, a problem with our analytical methods, and a systematic difference in how radiotracer and ISM methods sample the extracellular space. Most properties of thick brain slices have been entirely consistent with the present understanding of metabolism in the ischemic penumbra Several features of thick slices, such as the increased lactate (Newman et al., 1991), extracellular K+ (Lipinski and Bingmann, 1986), and AMP (Table 2), more closely resemble the situation during in vivo ischemia than do the corresponding results with thin slices exposed to reduced O2 or glucose. Although most studies reveal that thick brain slices are heterogeneous, with metabolic profiles of O2, K+, 2-deoxyglucose, and 2-deoxyglucose phosphorylation that differ between the slice center and the periphery (Lipinski and Bingmann, 1986; Newman et al., 1988), the experimental profiles can be predicted with simple models that assume no change in ECS as a function of depth from the slice surface. In addition, the fluorescence microscopy provided qualitative evidence against significant differences in ECS as a function of slice depth while eliminating the trivial possibility that tracers are actually excluded from the center of the thick slice so that measurements reflect only diffusion at the slice surface. There were no histologic differences between thick slices and hypoxic slices apparent at the light microscopic level, such as increased vacuolization of the neuropil or dissolution of cellular membranes, that could explain the difference. If the increase in diffusion rate was caused by tissue destruction or permeability of membranes, then the ECS volume should have increased, but thick slices demonstrate the expected decline in ECS volume. Thus, there is no reason to suspect that thick brain slices would fail to model the state of extracellular diffusion that occurs during ischemia in vivo.
It is also unlikely that some form of calculational error can explain this apparent anomaly in thick slices. First, the analyses employed for this study, although complex, are based entirely on standard mathematical theory and methods. Second, radiotracer kinetics in thin slices correlate very well with ISM results. Third, the experiments with agar discs have shown that the analytical methods do give the appropriate results for both thin and thick slabs, although it was found to be necessary to introduce an “unstirred layer” to obtain a value of the diffusion coefficient consistent with prior diffusion measurements of PEG-3,400 in agar. But other investigators also have found it necessary to use an unstirred layer for brain slice kinetic analysis (Lipinski and Bingmann, 1987) so that this is not unreasonable or without precedent The observation that including a 265-μm thick unstirred layer yields the known diffusion coefficient of 3,300-Da PEG in agar simultaneously for both thin and thick agar discs supports the validity of the approach. Note that this rather large 265-μm “unstirred layer” is really a combination of the classic unstirred surface layer with the effective dead space of our chamber system related to chamber geometry and the presence of supporting mesh above and below the slices. Note also that inclusion of this space does little to correct the difference in diffusion coefficients and λ between thin and thick brain slices. The reason for this is apparent from the theoretical slice profiles shown in Fig. 8A-D. Although the high volume fraction for PEG in agar discs causes a continuous gradient to form from the beginning of the unstirred layer to the center of the disc, the much lower value of α in brain slices and the relatively rapid diffusion of molecules across the unstirred layer causes the unstirred layer to behave as if saturated, limiting the correction to diffusion. This is similar to diffusion into tissue from a cavity formed after pressure injection by micropipette (Nicholson, 1985). Finally, the experiments with fluoresceinlabeled, lysine-fixable 3,000-Da dextran provide qualitative but unambiguous confirmation that this size molecule reaches the center of 1,050-μm hippocampal slices in an amount of time similar to that to reach the center of 450-μm slices, indicating a faster rate of diffusion in thick slices. There was only a minimal gradient from slice surface to slice interior in the thick slices after 15 minutes and virtually none by 30 minutes, consistent with a rapid diffusional process as predicted from the 14C-PEG kinetics shown in Fig. 3B. From these results, it is very unlikely that some form of calculational error can explain our results with λ in thick slices.
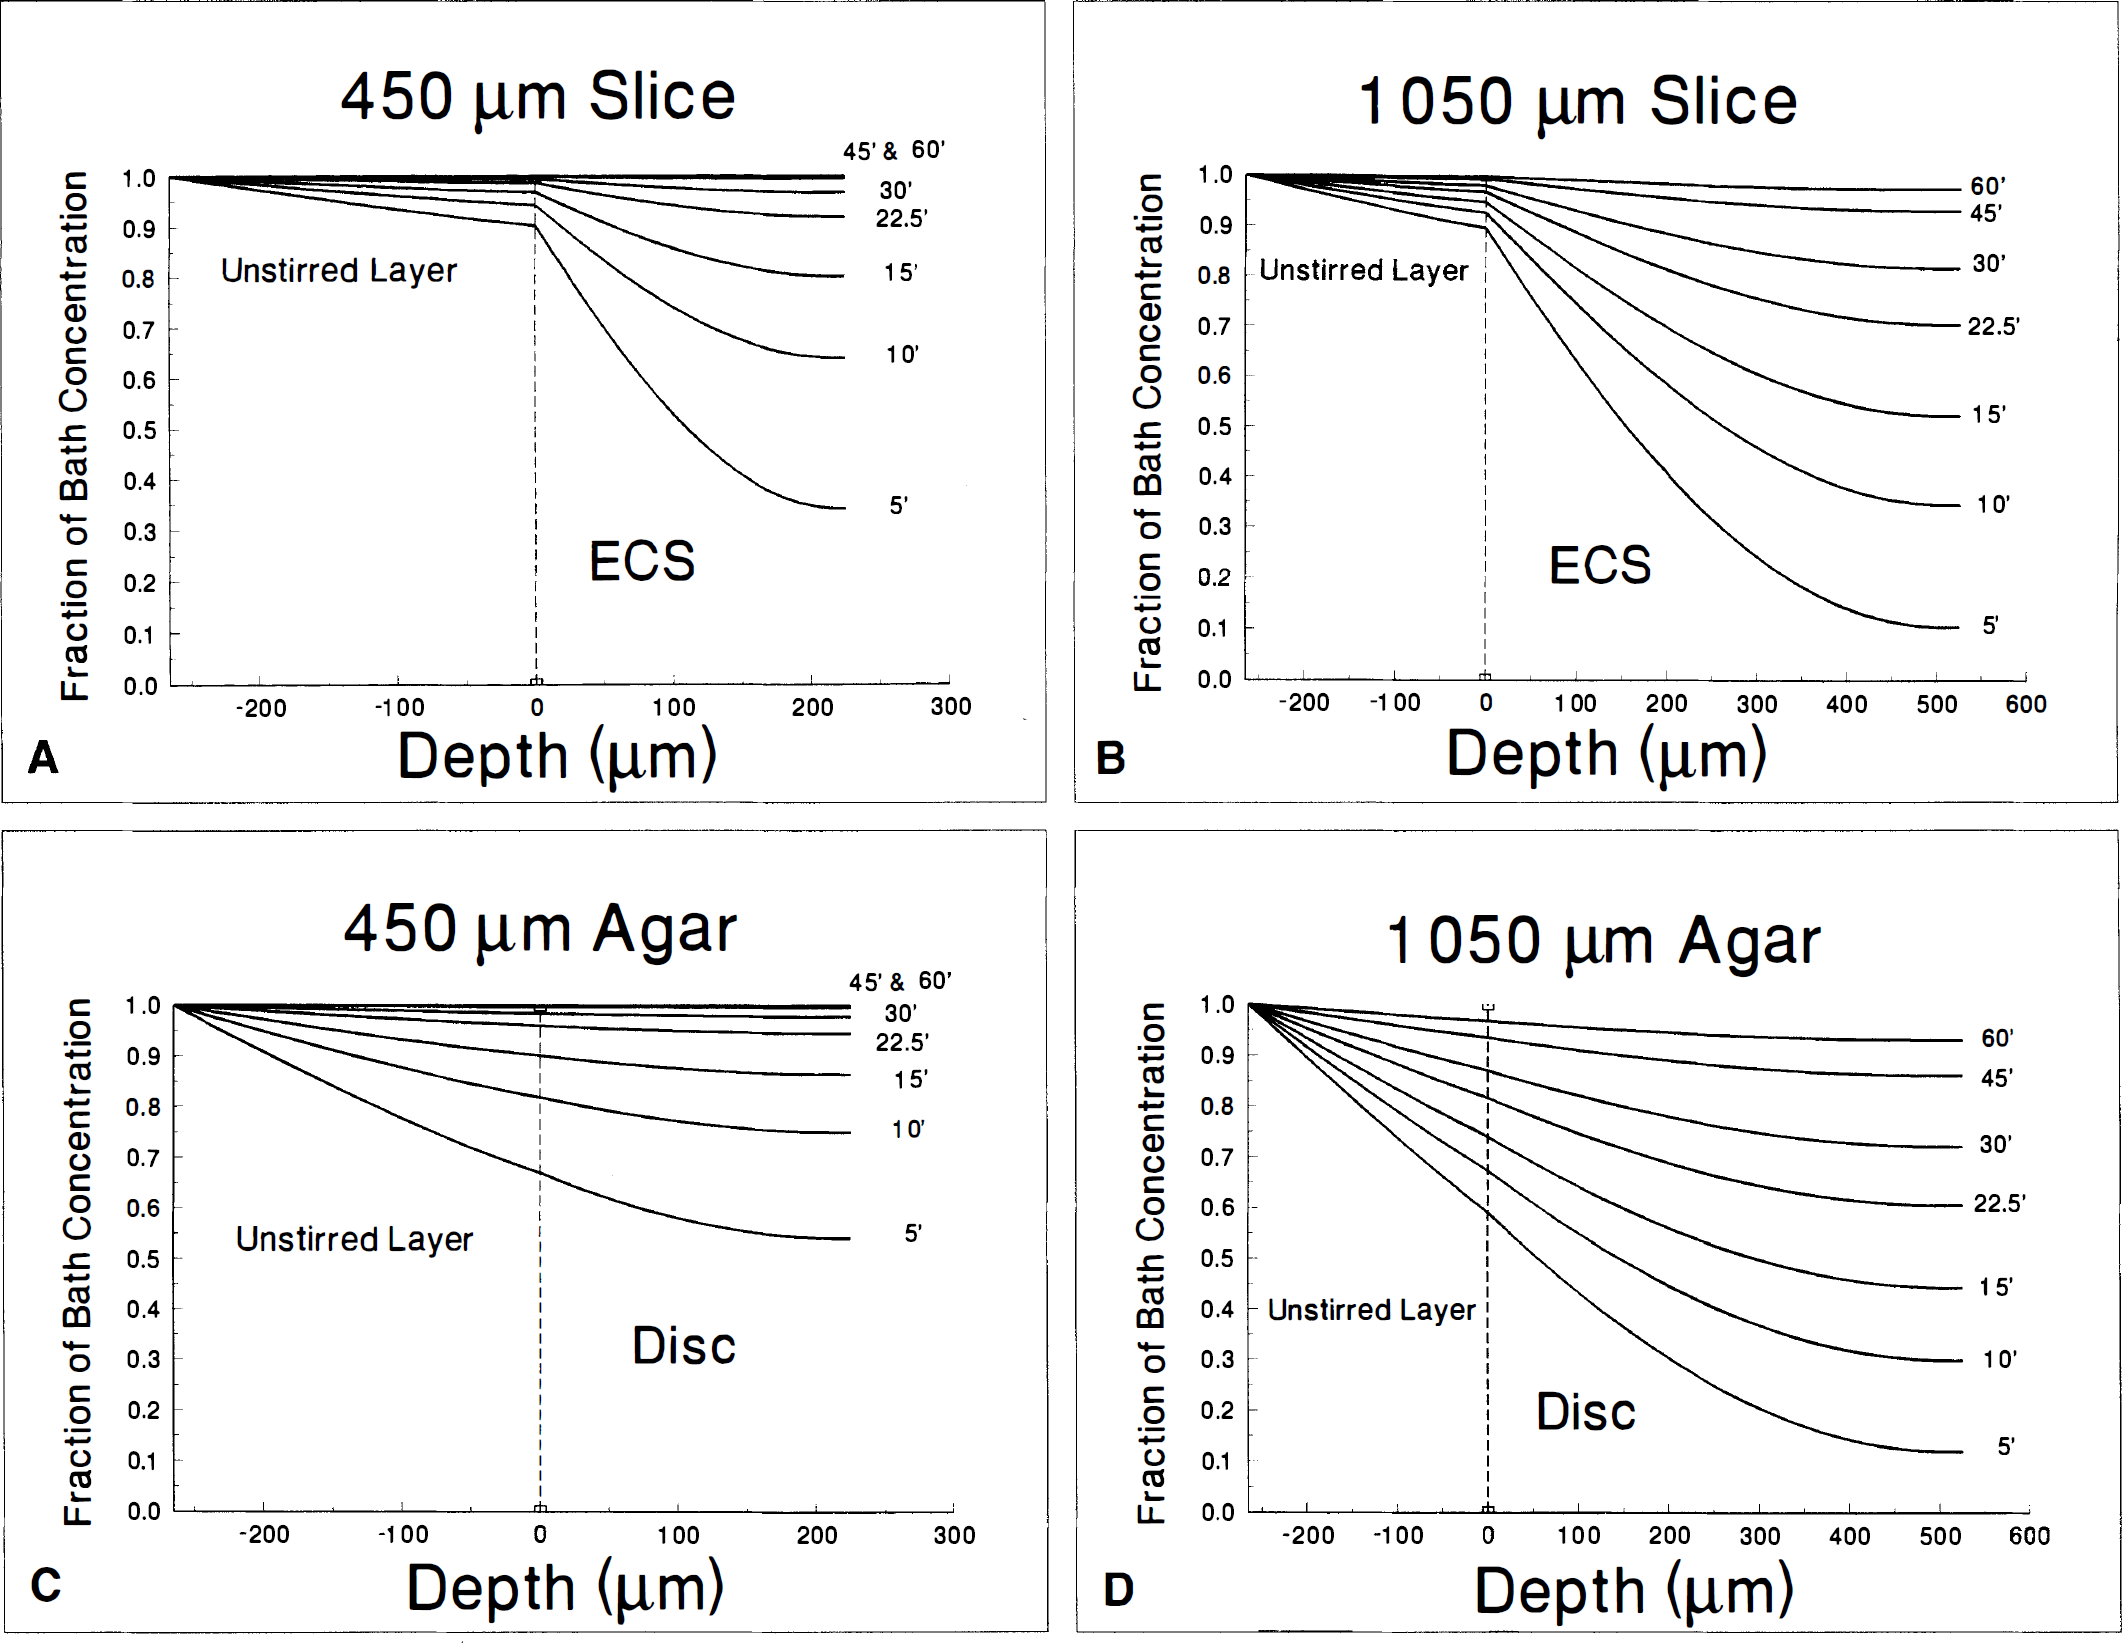
Theoretical curves illustrating the time and concentration dependence of solute diffusing through a 265-μm unstirred layer and into one face of a 450-μm slice (
Diffusion measurements with ISM cited above are highly consistent among laboratories so that it would be necessary to posit some systematic “error” in the ISM method during hypoxia or ischemia to account for the discrepancy with the whole-slice radiotracer results. There is no evidence for any such systematic error. However, one potential source of error with ISM relates to the tissue uptake of the diffusing electrolyte (Nicholson and Phillips, 1981). Tissue uptake of tetramethylammonium during ISM measurements is usually accounted for by assuming a unidirectional uptake with rate constant, k′. Although the assumption of unidirectional flux is probably valid, given the short time course of ISM measurements, the value of k′ is not insignificant, on the order 0.01 seconds−1 or 0.6 minutes−1, which is comparable to the uptake of 3OMG in our system. Thus a large change in k′ during ischemia might obscure the ability to recognize a fall in λ or make it difficult to obtain a consistent fit with the operational ISM equations that describe diffusion after iontophoresis or pressure injection and that are used to calculate α, λ, and k′ (C. Nicholson, personal communication). Although another potential source of systematic error with ISM methods will be considered below, no conclusive proof for such an error will be offered. Thus, at the present time, we are uncertain how to explain the discrepancy between our results and ISM observations.
Tortuosity is defined by the equation λ2 = Dw/Dtissue, where λ is tortuosity, Dw is the diffusion coefficient of a molecule in bulk water, and Dtissue is the apparent diffusion coefficient of the same substance in tissue. Although λ is often interpreted in terms of diffusional pathlength, it is clear from this definition that any factors that change diffusion in comparison with that in free aqueous medium will influence λ. Broadly considered, these factors involve either geometry or chemical interactions. The most obvious geometric factor is a change in diffusion pathlength in tissue, easily conceptualized as diffusion in extracellular pathways around cells instead of along a straight line. Although a crude estimate of this factor can be obtained from the ratio of the perimeter of a semicircle to the diameter of the circle (π/2, equivalent to a value of λ = 1.57), a more realistic calculation is very complex, despite the use of simplifying assumptions that are probably inappropriate for the CNS (Redwood et al., 1974; Latour et al., 1994). Other geometric factors may also contribute. Any monotonic motion other than that parallel to the direction in which diffusion is measured will decrease Dtissue and increase λ (Appendix 2). Diffusion in and out of blind alleys may also slow apparent diffusion. A “blind alley,” in this sense, is a region in equilibrium with ECS but in which diffusion cannot occur along the direction of measurement. Blind alleys can appear in analyses either as tortuosity or as a tissue compartment depending on the time it takes for the mouth and fundus of the alley to equilibrate. Changes in the diffusion coefficient as a result of nonparallel motion or into blind alleys would be indistinguishable mathematically. Although diffusion in two parallel pathways cannot, strictly speaking, be fitted by a single diffusion space, spread of the data may mask the distinction so that a change in the relative volume fractions of two parallel diffusing pathways with different rates of diffusion can also lead to a change in the measured rates of diffusion. Restricted diffusion as a result of interactions with macromolecules in ECS may be considered either as a microscopic form of geometric alteration of diffusion (Nicholson and Tao, 1993) or as a simple chemical interaction. Reversible binding to and transport into cells will be indistinguishable from blind alleys, slowing apparent diffusion if the interactions are fast (k1 and k2 are large) or behaving as a compartment if the interactions are slow (k1 and k2 are small). Irreversible interactions with tissue will be detectable with any analytical model that includes uptake such as the k′ used for ISM calculations or k1 in our model. Finally, an increase in the viscosity of ECS water may also lower the apparent diffusion coefficient and increase tortuosity (Ling, 1970). This may be very relevant to diffusion in brain because the diameter of ECS in cerebral tissue is only 150 to 200 Å (Schmitt and Samson, 1969; Nicholson and Tao, 1993) and water may alter its behavior when confined to spaces of this size (Derjaguin, 1965). Thus, there are a large number of factors that can reduce Dtissue and increase the tortuosity, λ.
How, then, is it possible to explain the apparent increase in ECS diffusion rate and decrease in tortuosity of thick slices even as ECS volume decreases? It is clear that this pair of observations cannot be explained by partial closure of a homogeneous extracellular space, because this would reduce ECS volume but leave the apparent diffusion coefficient unchanged. Therefore, if our observations are valid, there must be significant heterogeneity of diffusion in the ECS, and thick slice ischemia must act differentially on the heterogeneous pathways. From the foregoing discussion of tortuosity and Appendix 2, any of the following could explain the effects of thick slice ischemia. Either (1) ECS is not isotropic and in thick slices there is a preferential closure of pathways that are perpendicular to the direction in which diffusion is measured, or (2) there are pathways with differing rates of diffusion and in thick slices there is preferential closure of the pathways with slower rates of diffusion, or (3) there are extracellular blind pouches in thin slices that close in thick slices, or (4) there are rapidly reversible chemical interactions in ECS that are restricted in thick slices, or (5) the viscosity of ECS water decreases in thick slices as the mean size of ECS channels increases, or (6) some combination of these or other events occurs. Although our kinetic data cannot distinguish among these possibilities, the observation that thick slices gain water suggests that cytotoxic edema may be responsible for the closure of blind alleys or the preferential closure of small diffusing pathways. The net result of either would be a smaller total ECS volume consisting of a simpler network of channels with a larger mean diameter. Within such larger spaces, the apparent diffusion coefficient would approach more closely that of bulk water, primarily because the pathlength is more linear, but there may also be contributions from changes in water structure if viscosity increases in narrow-diameter ECS channels. Our data provide indirect support for this hypothesis. The possibility, from calculation of λ (Table 5), that diffusion of PEG was more restricted than that of 3OMG or Ca+2 in the ECS of 450-μm slices has already been considered above. In 1,050-μm slices, however, there is no difference in λ among the various tracers; that is, there is no evidence that PEG is more restricted than 3OMG or Ca+2. This is consistent with a change in the size distribution of ECS pathways toward fewer small, more restrictive channels. Furthermore, if this type of nonhomogeneous tissue reorganization does occur, then it is possible that the larger spaces could be missed by studies based on ISM because the placement of electrodes relies on tissue characteristics, which may not be present if the electrode were present in a large channel (C. Nicholson, personal communication). In effect, the ISM methods would be sampling the closely packed regions with smaller ECS and highly restricted diffusion but systematically excluding the larger spaces. These large spaces would be detected by whole-slice methods using radiotracers because the entire tissue contributes to the measurements. This suggestion is only speculative, however, and without experimental support. The alternative explanation, based on preferential closure in thick slices of pathways perpendicular to the direction in which diffusion is measured, cannot be excluded, however, because the hippocampal slice is likely to be anisotropic. Hippocampal slices are cut in a transverse plane during preparation so that most of the dendrites and axons of the hippocampal neurons are oriented approximately parallel to the cut surface. In addition, most of the axonal bundles between parasubiculum and dentate, dentate and CA3, and CA3 and CA1 are oriented in the plane of the slice as well. Finally, it is possible that the observations with thick slices are an accurate reflection of events in the ischemic penumbra because at least one in vivo MRI study has observed an increase in the ADC of tissue within the periphery of the ischemic insult (Pierpaoli et al., 1993).
It is interesting to note that, unlike thick slices, hypoxic slices do not show a decrease in ECS volume or an increase in the apparent diffusion coefficient despite the fact that they gain at least as much water during the incubation. Thus, the water gain per se cannot be the sole explanation of these changes. It seems likely that the greater thickness of the thick slice increases the resistance to overall tissue expansion such that the cellular water gain results in compression of the ECS rather than simply increasing the volume of the slice as a whole. This would be more analogous to the situation in vivo because the surrounding brain, meninges, and skull provide considerable resistance against expansion as tissue water increases during edema.
Extracellular space diffusion contributes to a wide range of normal and pathologic phenomena in brain. Many small molecules, including neuropeptides, neurotransmitters, and inorganic ions, are dependent on diffusion for their distribution and clearance (Descarries et al., 1991; Nicholson and Phillips, 1981). Three-dimensional signal diffusion through ECS, referred to as “volume transmission,” may complement electrochemical synaptic transmission for information transfer in CNS (Agnati et al., 1995). There is considerable evidence that neurons and glia interact extensively through the ECS with prolific traffic of intermediary metabolites and precursors for synthesis of amino acids and neurotransmitters (Sonnewald et al., 1991; Badar-Goffer et al., 1992; Tsacopoulos and Magistretti, 1996). Several prevalent diseases of the nervous system are accompanied by major disturbance of ECS volume and diffusion, including stroke, seizures, and osmotic imbalance, as well as spreading depression (Van Harreveld, 1972; Hoehn-Berlage et al., 1995; Cserr et al., 1991; Hasewaga et al., 1995). The importance of ECS diffusion for drug delivery has been fully detailed (Fenstermacher and Kaye, 1988). Understanding diffusion in ECS is also important for interpreting microdialysis (Benveniste et al., 1984) and new imaging techniques such as diffusion-weighted MRI (Le Bihan, 1991).
Extracellular diffusion in the CNS is a complex phenomena that remains difficult to measure accurately. The theories developed for these studies are general and applicable both in vivo and in vitro. The experimental approach involves a variety of radiotracers with ischemic brain slice models and controls. The primary advantage of this approach is that measurements of extracellular diffusion are coupled to transport and intracellular kinetics. In addition, tissue kinetics can be studied in the absence of the blood—brain barrier. The primary limitation of the approach is that the measurements include diffusion through the injured cut surface of the slice. An additional difference is that the mean diffusional distances of slices are greater than mean intercapillary distances in vivo. Studies with control slices are entirely consistent with earlier studies of diffusion and with prior compartmental kinetic studies. Studies with hypoxic slices also are consistent with the expected effects of this mild insult. The most intriguing result is the observation in thick slices that extracellular volume shrinks even as the diffusion coefficients of all of the radiotracers appear to increase, suggesting that extracellular tortuosity decreases during partial ischemia. If this result can be confirmed, it suggests that the ECS is heterogeneous both in its structure and in its responsiveness to major stimuli such as ischemia.
Footnotes
Abbreviations used
Appendix 1
APPENDIX 2
Acknowledgments
The authors thank Shilpa Motwani and Julia Kaplun for technical assistance and help with the adenylate assays and histology. They also thank the Journal reviewers for contributing significantly toward improving the manuscript.