
Abstract
The authors developed and tested a method for the noninvasive quantification of the cerebral metabolic rate for glucose (CMRglc) using positron emission tomography (PET), 18F-fluoro-2-deoxyglucose, the Patlak method, and an image-derived input function. Dynamic PET data acquired 12 to 48 seconds after rapid tracer injection were summed to identify carotid artery regions of interest (ROIs). The input function then was generated from the carotid artery ROIs. To correct spillover, the early summed image was superimposed over the last PET frame, a tissue ROI was drawn around the carotid arteries, and a tissue time activity curve (TAC) was generated. Three venous samples were drawn from the tracer injection site at a later time and used for the spillover and partial volume correction by non-negative least squares method. Twenty-six patient data sets were studied. It was found that the image-derived input function was comparable in shape and magnitude to the one obtained by arterial blood sampling. Moreover, no significant difference was found between CMRglc estimated by the Patlak method using either the arterial blood sampling data or the image-derived input function.
Keywords
In brain dynamic 18F-fluoro-2-deoxyglucose (FDG) positron emission tomography (PET) studies, the plasma time activity curve (TAC) is needed to quantitatively estimate the cerebral metabolic rate for glucose (CMRglc). The plasma TAC is used as the input function for the compartmental model that describes the dynamic behavior of the FDG tracer. Conventionally, the plasma TAC has been measured via arterialized venous or arterial blood sampling (Phelps et al., 1979). Although the arterial blood measurements are considered the most accurate representation of the plasma TAC and arterialized venous samples have been validated (Phelps et al., 1979) as a replacement of arterial samples, there are several concerns regarding their usage. Arterial blood sampling is invasive in nature; it causes discomfort, involves potential risks of arterial thrombosis, arterial sclerosis, and ischemia to the distal extremity. Arterial and venous blood sampling introduces additional radiation exposure to personnel and needs additional laboratory procedures for counting the blood samples and calibrating the equipment. Furthermore, frequent blood sampling cannot be used in PET studies in which minimal subject interference is required (such as the study of normal sleep patterns). In addition to these drawbacks, arterialized venous blood sampling may have limited utility in brain activation studies because the cortical response to hand heating (Phelps et al., 1979) might distort the brain response pattern that is under investigation. Because of the drawbacks associated with the arterial or arterialized blood samples, CMRglc quantification is not always performed in brain FDG PET studies.
We investigated the use of the image-derived TAC from regions of interest (ROIs) defined over the internal carotid arteries as the input function. The proposed method can be characterized as experimental-procedure independent, and data-processing—procedure independent. The complete time course of the input function can be reconstructed using this method.
Several methods have been studied to minimize or even eliminate the invasive blood sampling procedure in PET studies of brain and other organs. These methods can be divided into four categories. First, one can reduce the number of blood samplings by analytically modeling the dynamics of the input function (Phillips et al., 1995). The model can be either a physiologic model, such as the one developed by Feng et al (Feng et al., 1993), or a template calculated from a sample population (Takikawa et al., 1993). With a mathematical model, the input function can be determined by estimating a few model parameters with only a small number of blood samples. However, because the shape of the input function heavily depends on individual physiologic states (e.g., cardiac output) and procedural factors (e.g., the injection rate), the model may not fit well with many types of data sets encountered in daily practice. Second, one can quantify the PET data without measuring the input function (Mejia et al., 1994; Watabe et al., 1995). This approach has been used successfully in quantification of the cerebral blood flow using O-15 water, the dynamics of which is described by a single-compartment model (Mejia et al., 1994; Watabe et al., 1995). However, this method cannot be used for tracers such as FDG, the kinetics of which is more complex than O-15 water. Third, one can adopt a method that is approach dependent. For example, the unidirectional metabolic rates and blood spaces can be calculated by a modified Patlak graphical method (Wong et al., 1994). With this method, as few as three blood samples are needed. Apparently, the reduction in the number of blood samples is only relevant when this method is used. Furthermore, the complete time course of the input function cannot be revealed by this method. Fourth, one can use TAC obtained from an ROI over the PET images as the input function. Until now, techniques in this category are well established only for cardiac PET studies in which the input function is obtained by placing an ROI within the cavity of the left ventricle (Weinberg et al., 1988; Gambhir et al., 1989; Iida et al., 1992). Attempts also have been made to measure the activity from the abdominal aorta in hepatic and renal PET studies (Germano et al., 1991; Chen et al., 1992).
The proposed method is an approach that would fall into the last category. Several challenges must be considered to make good use of the carotid artery TAC as the input function. First, a fast image-acquisition protocol is needed to characterize the time course of the input function, especially in the early phase immediately after the bolus tracer injection; second, it is essential to account for the partial volume effects caused by the small size of the carotid artery; finally, spillover from the surrounding brain regions to the carotid artery areas should be corrected. This tissue-to-blood spillover becomes severe as the tracer begins to accumulate in the surrounding brain regions. As we will discuss, one approach to account for partial volume and tissue-to-blood spillover effects is the use of three venous blood samples. These blood samples can be drawn from the venous catheterization site where the tracer is injected, as described. Therefore, the blood sampling will not be painful. In addition, the blood glucose level can be determined from these blood samples (Phelps et al., 1979). As discussed by Phelps et al. (1979), the use of the venous blood glucose level introduced no significant error to the estimated CMRglc (with less than 5% error on average).
METHODS
Subjects, blood samples, and positron emission tomography image reconstruction procedure
Data from 29 subjects who participated in a previous study (Reiman et al., 1996) were used. Data from 3 of the 29 subjects were used solely in testing the procedures for sampling the venous blood radioactivity. Data from the other 26 subjects were used for the validation of the image-derived input function. After a 4-hour (minimum) fast, subjects were positioned in the PET scanner in a darkened room and were directed to lay quietly with their eyes closed and directed forward. At the start of an intravenous injection of 10 mCi of FDG, the dynamic PET scan was initiated. The time sequence of the acquisition protocol is described in “Acquiring fast image sequence.” A filtered back-projection method was used to reconstruct the PET images with the Hanning filter of 0.40 cycle per pixel. Attenuation was corrected in the reconstruction process using a 20-minute transmission scan acquired before the emission scan. The reconstructed image set consisted of 31 horizontal slices with in-plane resolution of approximately 9.5 mm full width at half maximum (FWHM) and an interslice distance of 3.375 mm. Sequential arterial blood samples were drawn every 5 seconds for the first minute, every 10 seconds for the second minute, every 30 seconds for the next 2 minutes, then at 5, 6, 8, 10, 12, 15, 20, 25, 30, 40, 50, and 60 minutes. Plasma glucose levels were measured at the beginning, middle, and end of the scan.
The venous blood sampling procedure is conducted as follows. The venous angiocatheter was connected to standard intravenous tubing that had two separate access sites so that the administration of the tracer and venous blood draws were done separately. This helped ensure no cross-contamination of the dose into the venous samples. In addition, the line was flushed thoroughly after tracer administration, and “residual” solution was drawn from the line before collecting the venous samples. Venous samples were drawn at the midpoint of the last five frames. The venous blood samples were compared with the arterial data to see whether the arterial samples can be approximated by the venous data.
Acquiring fast image sequence
The PET scanner and the associated computer system (Siemens, Knoxville, TN, U.S.A.) were configured so that images with frame duration as short as 2 seconds could be acquired. Acquisition started at the time of the tracer injection and lasted for a total of 60 minutes. The acquisition protocol was as follows: one frame of 12 seconds, eight frames of 2 seconds each, two frames of 10 seconds each, one 12-second frame, one 30-second frame, two 60-second frames, two 90-second frames, one 3.5-minute frame, two frames of 5 minutes, one frame of 10 minutes, and one frame of 30 minutes. To eliminate the need for acquiring magnetic resonance imaging and subsequent coregistration with PET (Chen et al., 1995), PET images acquired from 12 seconds to 48 seconds were summed and used to identify the carotid artery structure.
Defining regions of interest over the carotid artery
The summed images over the early 36-second period were examined visually. For those slices over which the left and/or right carotid arteries were clearly visible, separate ROIs were defined and separate TACs were generated for each of the two left and/or right arteries.
The carotid artery ROI was defined as a collection of those pixels, within the artery, whose values were greater than or equal to PM where P was the threshold value (0 < P < 1) and M is the highest pixel value over that carotid artery area. The threshold value P might need to be adjusted visually several times to generate a satisfactory ROI. Once the carotid artery ROI was defined, it was copied to all frames. The time activity curve within that artery was generated as the time sequence of the averaged ROI values. To correct for the spillover from the surrounding tissue to the artery, another ROI (tissue ROI) was determined manually close but not adjacent to the previously defined carotid artery ROI. To facilitate the determination of the location, size, and shape of the tissue ROI, the early summed images were superimposed over the last PET frame. Only the last three data points of the tissue ROI-TAC were used in the estimation of the spillover and recovery coefficients.
Correcting partial volume and spillover
At any time t, the measurement

where cp was the true (spillover free) radioactivity in the blood pool and ct was the radioactivity from the surrounding tissue; rc was the recovery coefficient, and the mtb was the spillover coefficient from tissue to the blood vessel. Both rc and mtb were time-independent, non-negative constants less than 1. However, similar to the situation in which the spillover from tissue to blood pool is solely from surrounding tissue, as discussed previously (Gambhir, 1990), the constraint rc + mtb = 1 was not put onto these two parameters. In this study,
Writing equation (1) at the time points where the measurements for all three TACs (
Generating the image-derived input function
In general, there was more than one carotid artery ROI-TAC. The image-derived input function was calculated as the average of all the vascular ROI-TACs, each of which had been corrected individually for spillover and partial volume effect.
Data analysis
First, the input function obtained from the arterial blood samples was compared visually with the image-derived input function. Second, two CMRglc parametric images were generated for each subject. The first parametric image used the arterial blood sampled input function, and the second one used the image-derived input function. The Patlak analysis method (Wienhard et al., 1985; Patlak et al., 1983; Patlak et al., 1985) was adopted for the generation of the parametric images. The last three frame data (assumed at the middle of the frames) were used in the Patlak analysis. The unit of CMRglc was milligram/minute per 100 g.
The two images then were compared on a pixel-by-pixel basis by linearly regressing pixel values from one image to the pixel values on another. The closer the correlation coefficient and the slope of the regression line were to 1 and the closer its intercept was to 0, the more identical the two parametric images are. Nonparametric Wilcoxon's signed rank test was used to test the hypothesis of the unit slope and zero intercept. The whole-brain metabolic rate for glucose (the mean of the pixel values that are greater than 40% of the image-wide maximum) obtained using the two input functions were compared with the paired Student's t test.
RESULTS
Figure 1A shows the carotid artery structures superimposed over the last PET frame for one brain level of one subject. Figure 1B represents another subject. The vascular structures are visible on several brain levels of the lower brain part. Depending on the subject, up to four or five slices could be chosen for the generation of the image-derived input function. It was found that size and shape of the carotid artery ROI changed from slice to slice and even from left to right in the same slice.
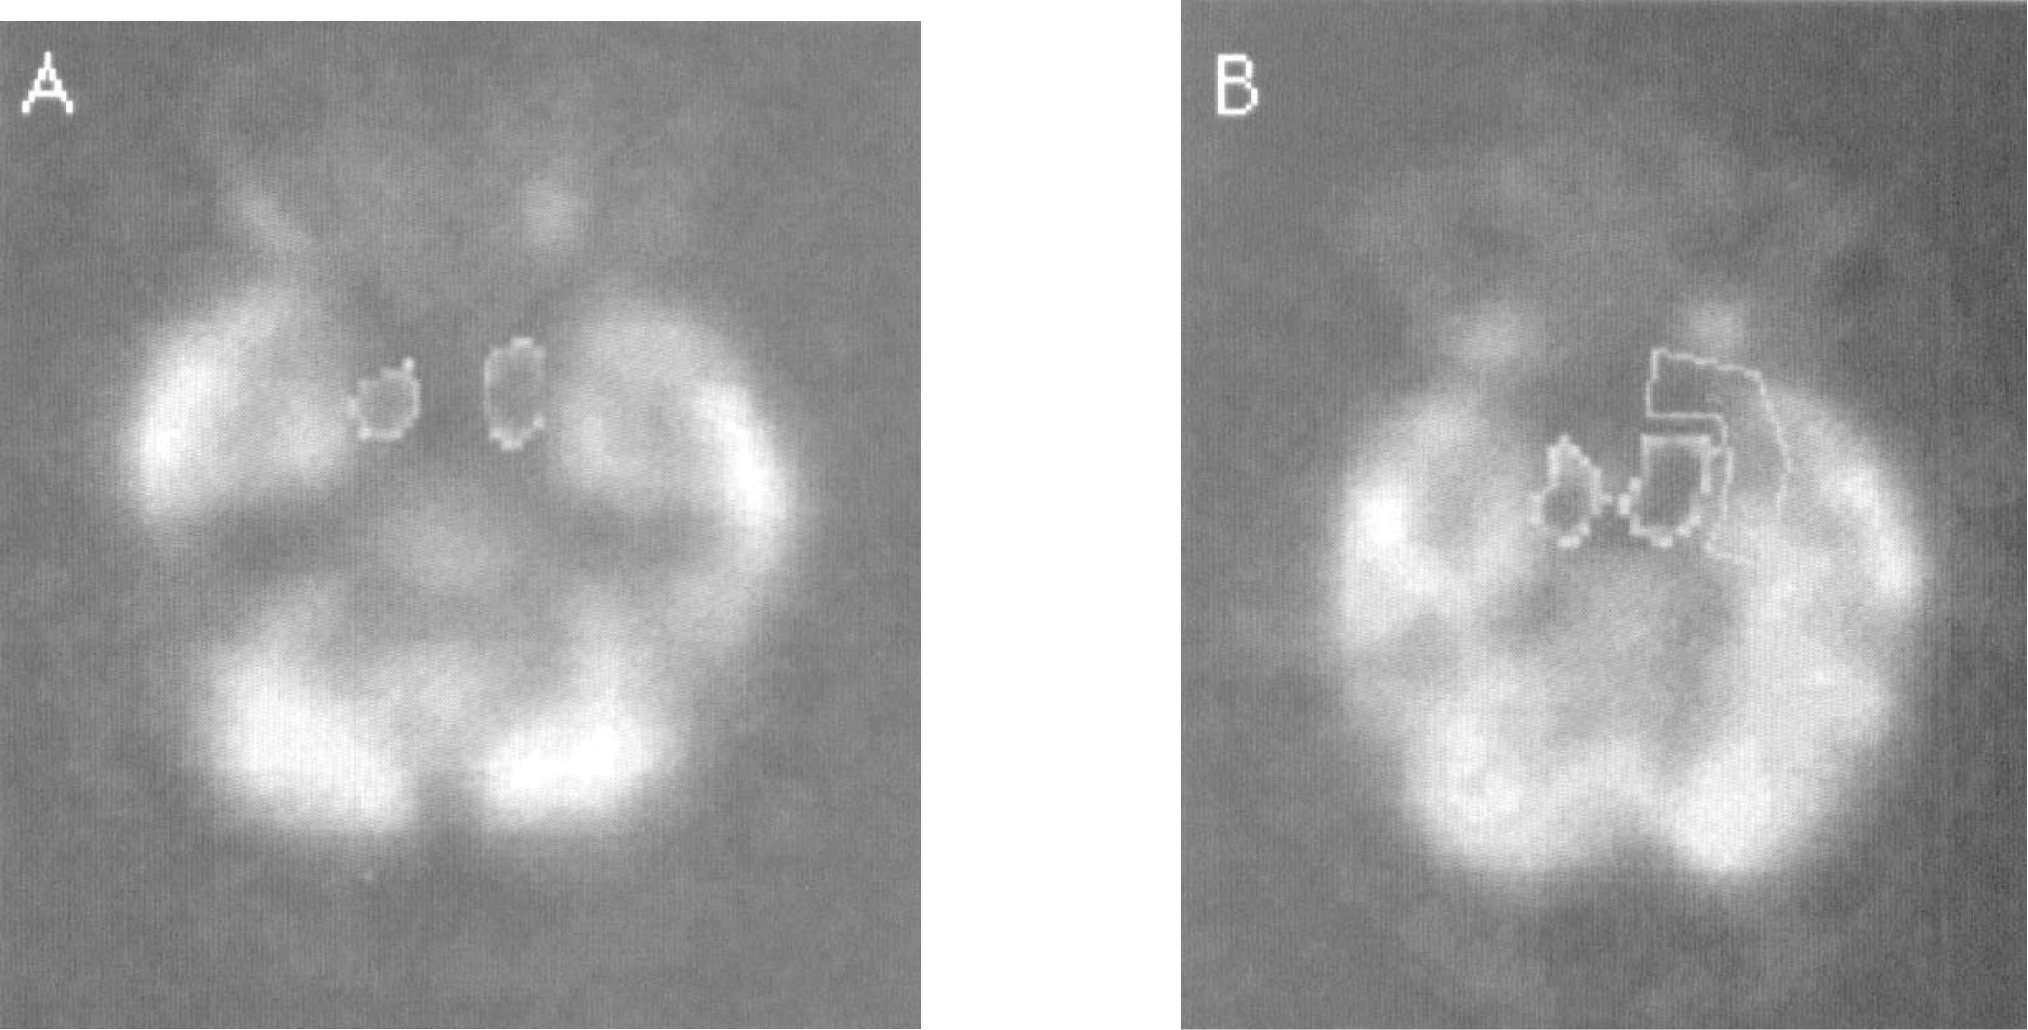
Examples of carotid arteries identified in the early summed image superimposed onto the last postitron emission tomographic frame. The vascular structure in panel
The image shown in Figure 1B is an example of a tissue ROI defined manually and used for the purpose of spillover correction. Compare the brain image displayed in Figure 1A to the one in Figure 1B, there are noticeable variations regarding the distance and size of the adjacent brain tissue to the carotid artery. Consequently, the spillover coefficients would vary.
The use of venous radioactivity to approximate the arterial radioactivity was validated by comparing the venous data with the arterial blood sampled TAC, as shown in Fig. 2. In this specific study, all of the venous data points, except the first, were in good agreement with the arterial measurement. The mean percentage difference between the arterial and the venous curve was only 5.6% for the five points. When the first batch of data were excluded, however, the mean percentage difference was only 2.25%. Only the last three data points were used for the estimation of the recovery coefficient and the spillover correction. The good agreement of the venous data with the arterial measurement was observed for all subjects.
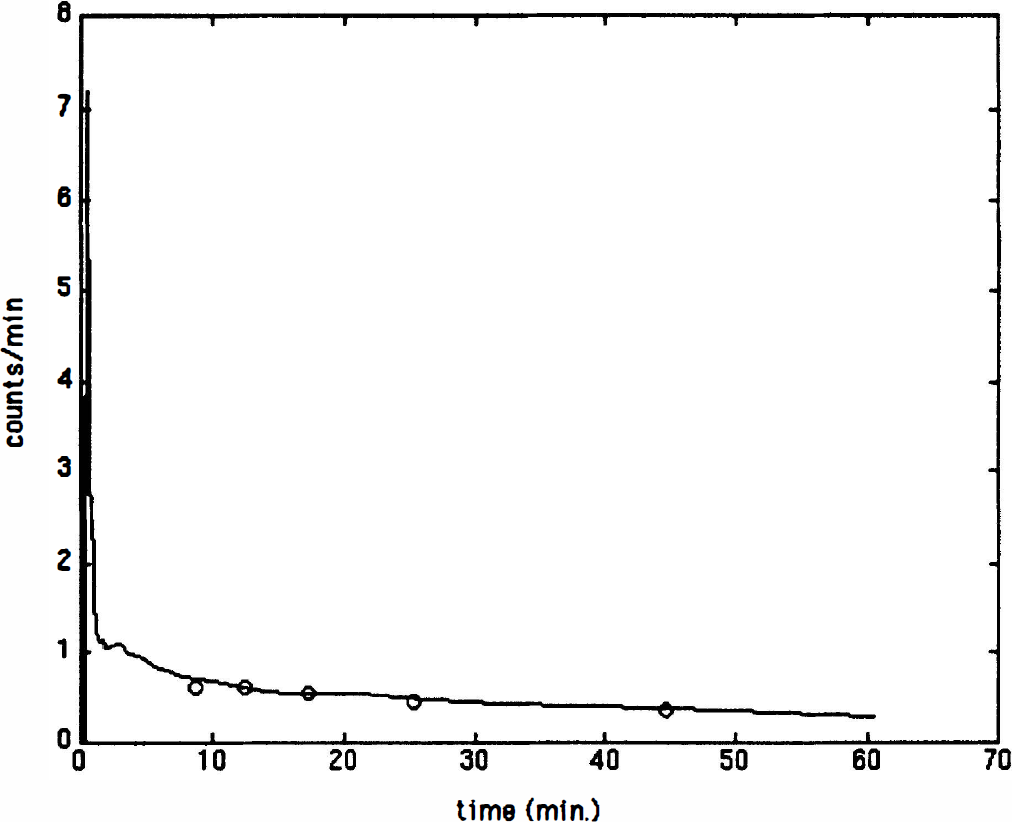
Comparision of the later five venous measurements (open circle) with the arterially sampled 18F-fluoro-2-deoxyglucose dynamics (solid line) for one subject. The horizontal axis is time in minutes. The vertical axis is the radioactivity in unit of counts per minute. The consistency of the venous samples with the arterial samples was observed for all subjects for whom the venous blood samples were drawn.
The image-derived input function was generated by averaging several carotid artery ROI-TACs. It was found that variation existed among the carotid artery ROI-TACs. In general, the coefficient of variation was much smaller at later times. For a typical subject studied, for example, the peak variation was 30%, whereas the mean variation for the last three time points was only 9% among eight carotid artery ROI-TACs.
The image-derived input function was compared with the arterial blood sampled input function. Figure 3 is such an example. The difference between the two curves at the peak was 2.5%. Furthermore, the tail part of the two curves coincided very well.
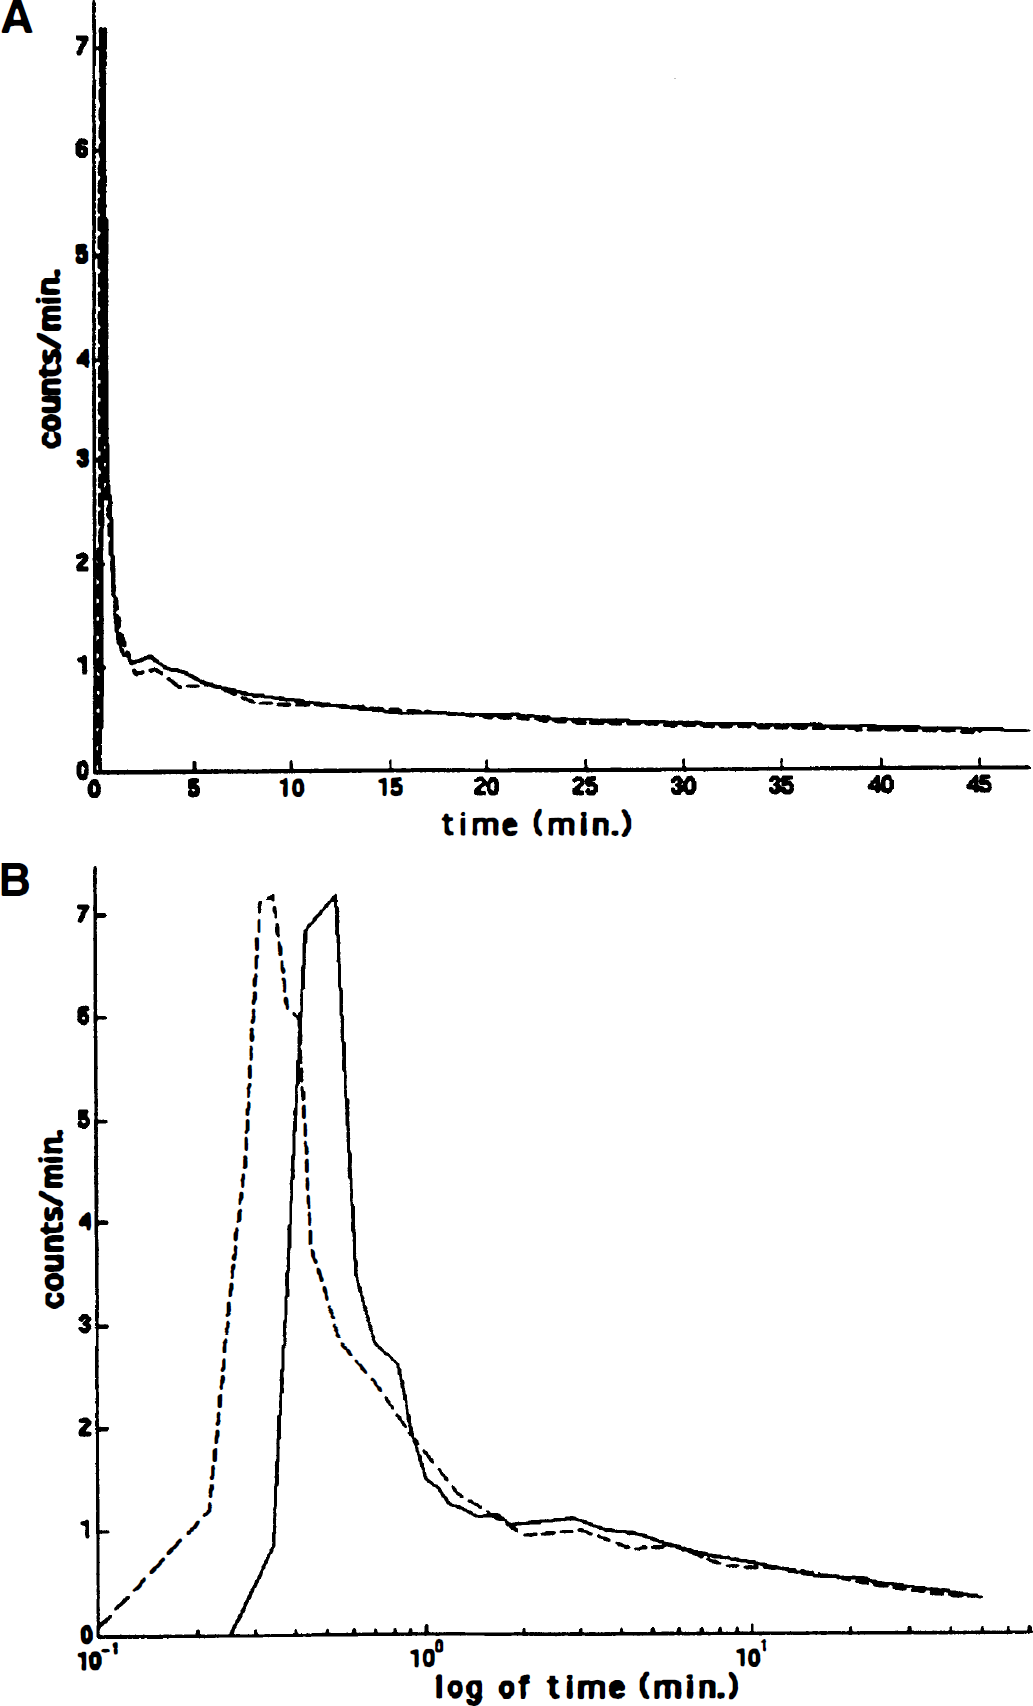
Comparision of the arterial sampled input function (solid line) with the image-derived input function (dashed line) for one subject. The horizontal axes in panels
Notice that there was some time difference between the two curves. This time difference might be caused by different tracer transit times to the carotid and the radial arteries. However, this time difference was insignificant in real time compared with the whole study duration (Fig. 3A).
For all 26 subjects studied, it was found that the width of the peak for the two input functions was approximately the same, and the two curves coincided well for the portion after the early peak. However, there were some variations on the peak heights of the two curves. Figure 4 is such an example. The difference between these two peaks was 23.3%. The cause of the peak height discrepancy is discussed in the Discussion section. A computer simulation was performed to study the effects of the peak height on the estimated CMRglc using the Patlak method. The well-known, two-compartment model with parameter k1, …, k4 equal to (0.1889 0.4298 0.3228 0.0043) and the arterial sampled TAC from this subject were used to generate the output function. The Patlak graphical method was applied to this input—output pair first. Then the input function was modified by discounting the original peak value by 23.3%. The Patlak analysis then was performed on the modified input function and the original output function. It was found that the 23.3% peak height difference only caused less than 0.1% variation on the estimated CMRglc.
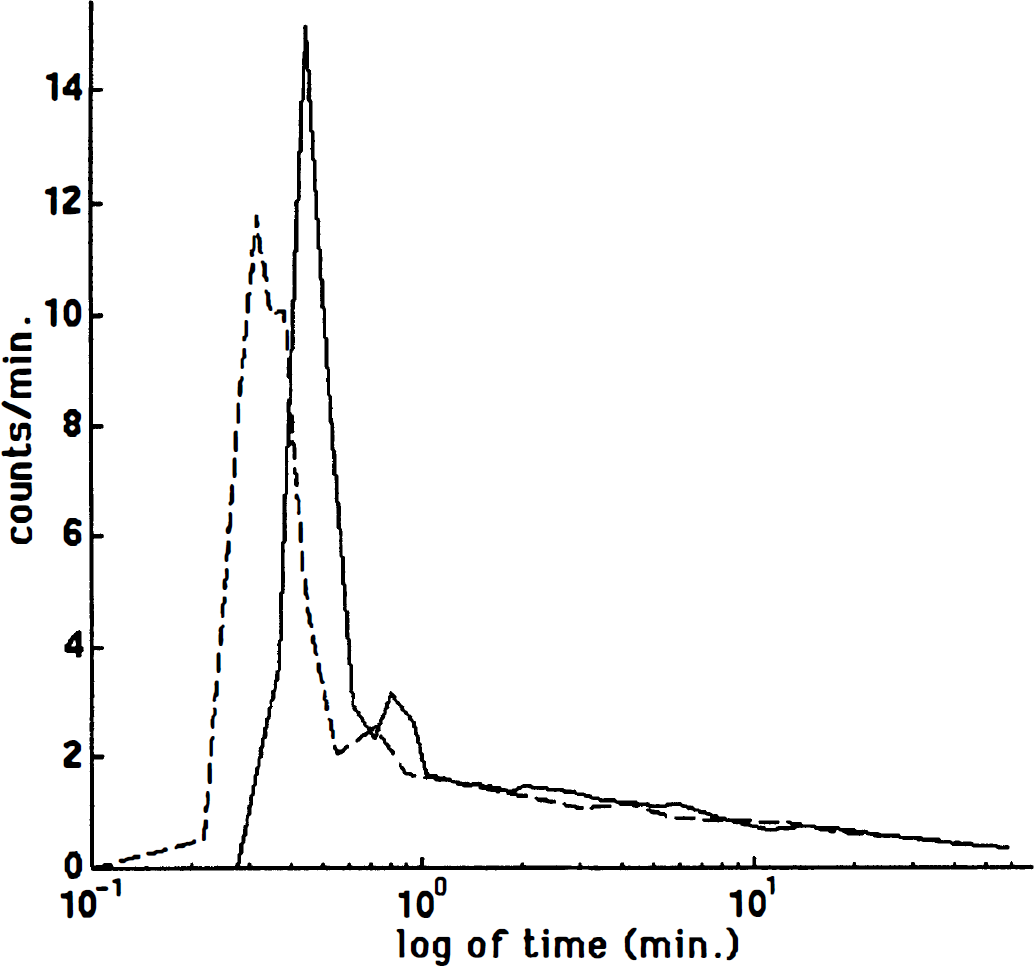
Comparision of the image-derived input function (dashed line) with the one obtained from arterial blood samples (solid line) for another subject studied. The horizontal axis is logarithm of time (in minutes). The vertical axis is the radioactivity in unit of counts per minute. For this subject, the image-derived input function has lower peak than the arterial curve.
Both the arterial blood sampled and the image-derived input functions were used in the subsequent generation of the CMRglc parametric images using the Patlak graphical approach. The two images qualitatively resembled each other very well. More importantly, the pixel-by-pixel comparison revealed that the two parametric images for each subject were compatible quantitatively. Figure 5 is such a comparison for one subject. Note the tightness of the data associated with the fitted regression line (R2 = 0.9997). More importantly, the slope of the fitted regression line was 1.0018, which was close to unity, and the intercept of −0.031 was close to 0. Thus, the fitted regression line was close to the identity line (45° straight line). Similar results were obtained for all subjects (Table 1).
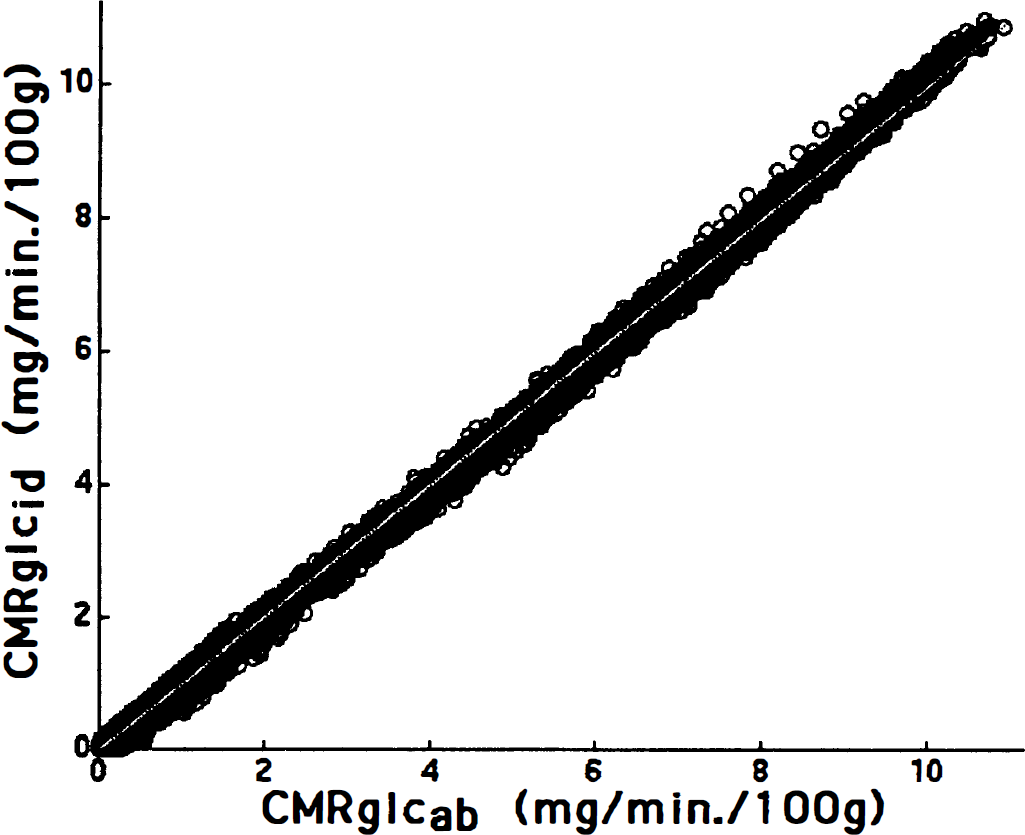
Correlation of the cerebral metabolic rate for glucose (CMRglc) estimated using the arterial blood sample data as the input function and the image derived time activity curve as the input function. Showing in this figure is for one subject. Similar results were obtained for all 26 subjects. The horizontal axis is the estimated glucose uptake rates with the use of the arterial blood samples as the input function (CMRglcab) while the vertical axis is the one with the image-derived input function (CMRglcid).
Comparison of the CMRglc estimate by the use of the arterial blood sample or the image-derived input function
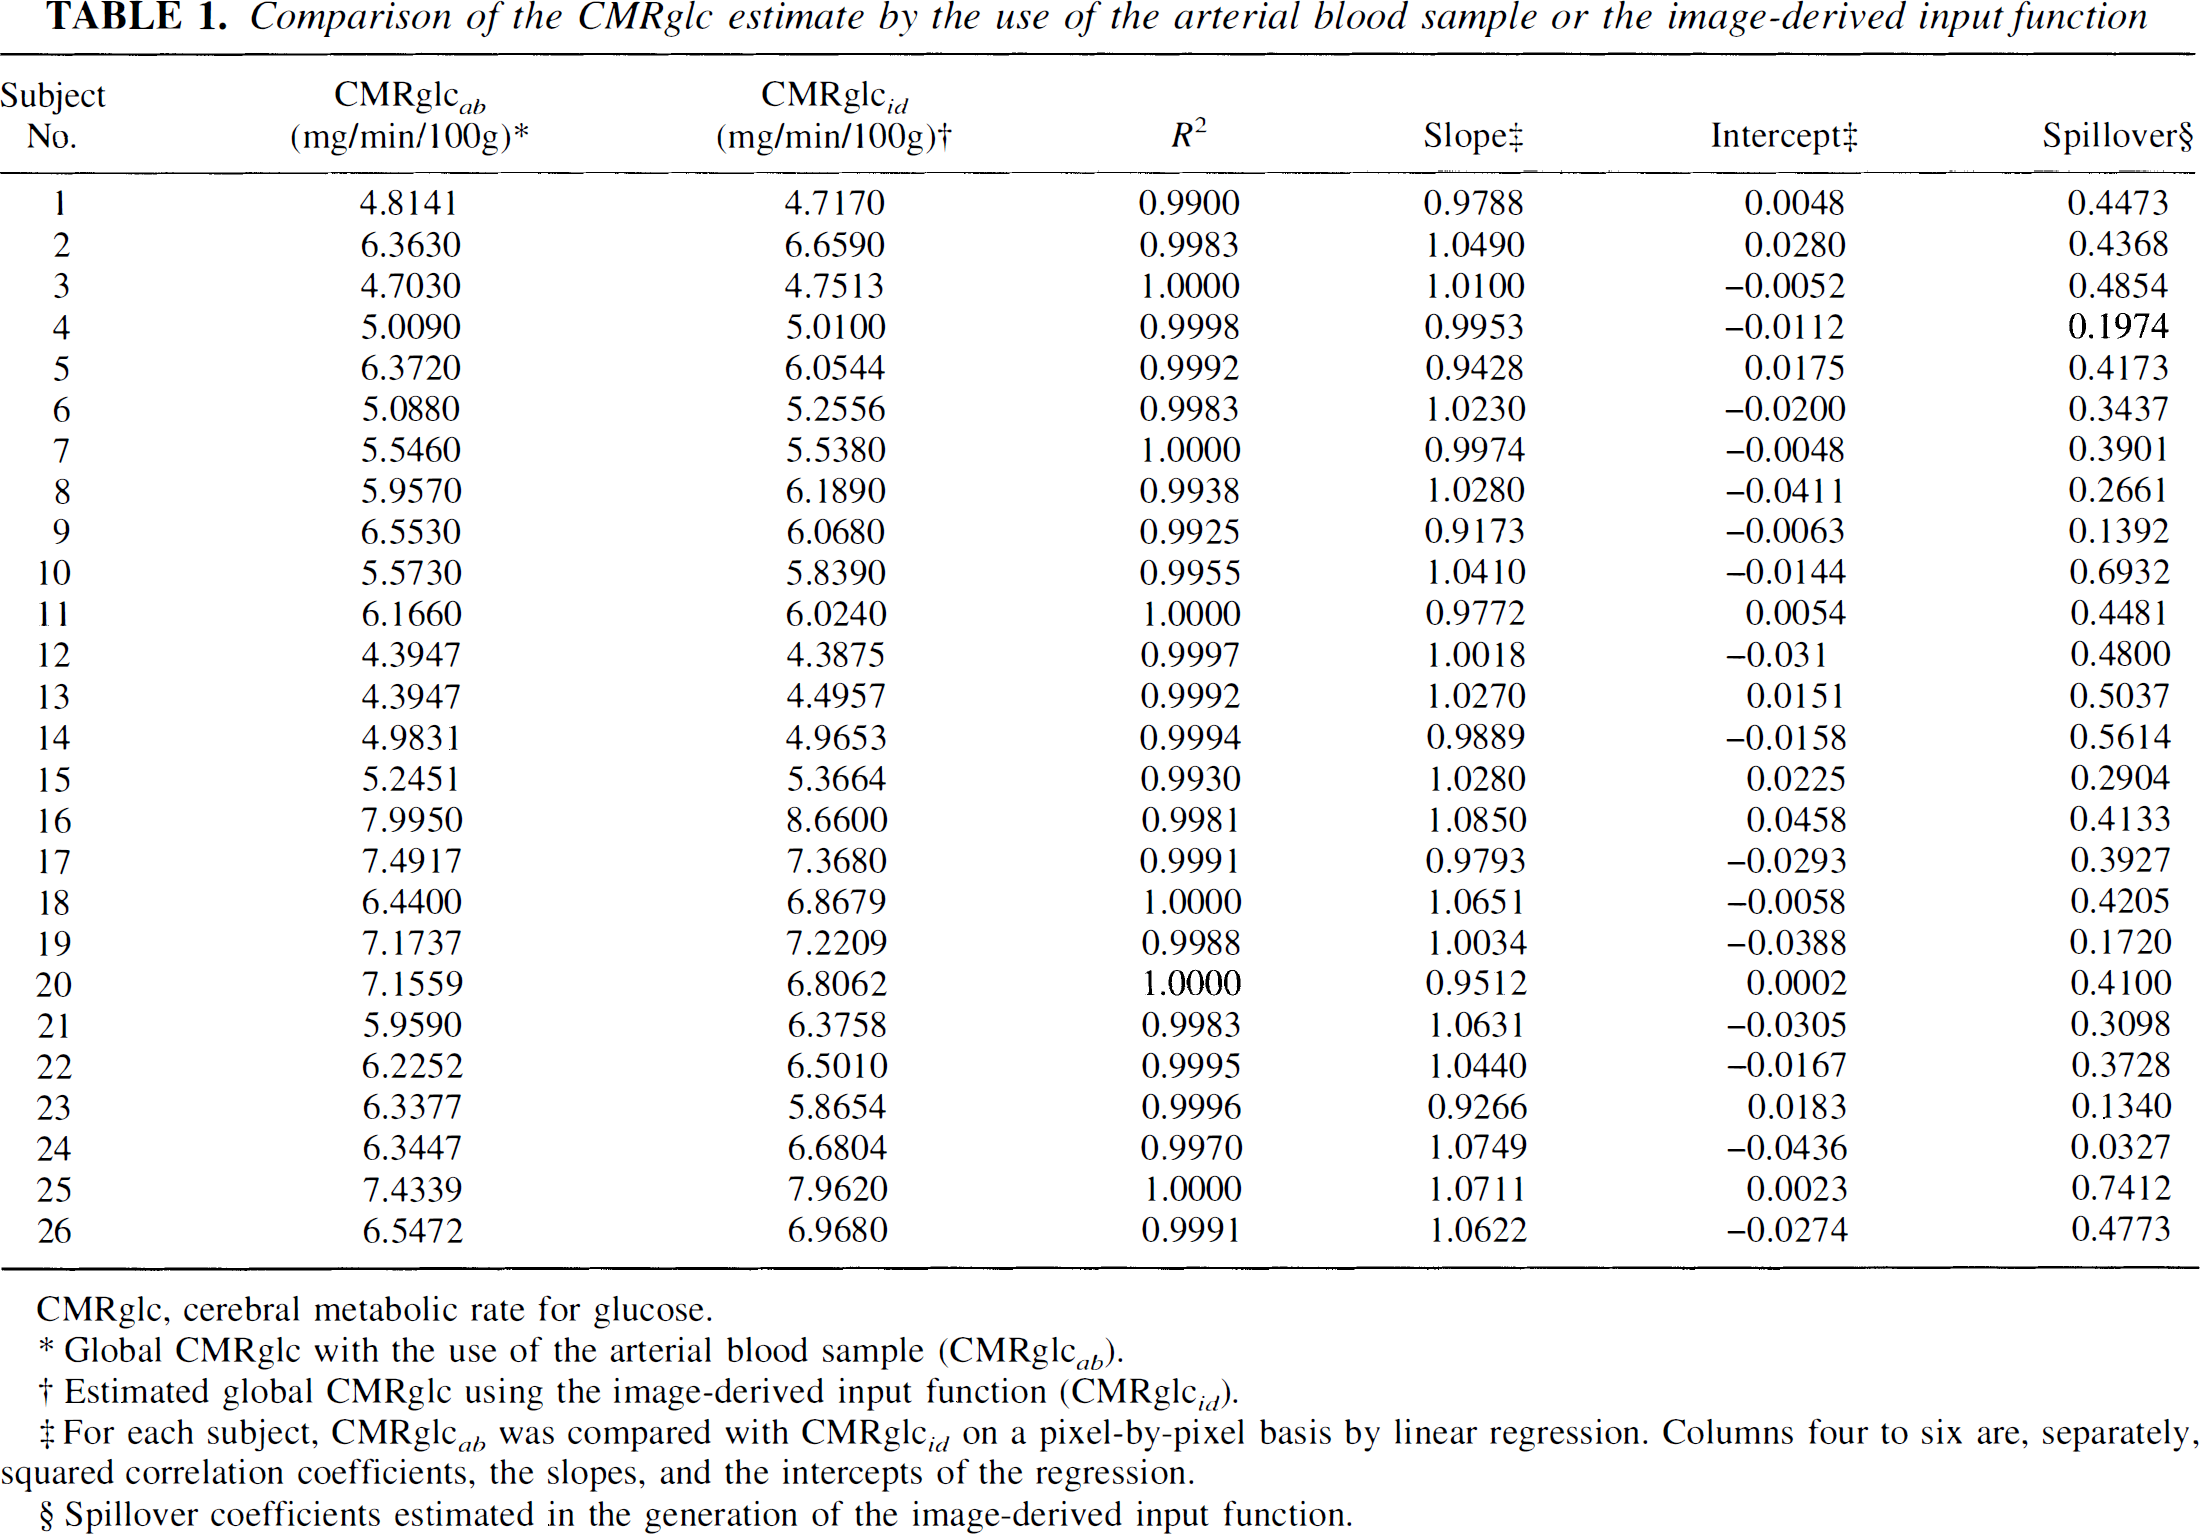
CMRglc, cerebral metabolic rate for glucose.
Global CMRglc with the use of the arterial blood sample (CMRglc ab ).
Estimated global CMRglc using the image-derived input function (CMRglc id ).
For each subject, CMRglc ab was compared with CMRglc id on a pixel-by-pixel basis by linear regression. Columns four to six are, separately, squared correlation coefficients, the slopes, and the intercepts of the regression.
Spillover coefficients estimated in the generation of the image-derived input function.
The compatibility between the two parametric images was further examined using the whole-brain CMRglc. A paired Student's t test cannot reject the hypothesis that the whole-brain CMRglc estimated by the use of the either input function was equal to each other (P = 0.14, two-tailed test).
As mentioned previously, the pixel-by-pixel comparison between the two CMRglc parametric images by the use of the two input functions was made by first regressing one against another and then checking closeness of the slope to 1 and the intercept to 0. The hypothesis that an average person had a unit slope and a zero intercept for the regression line was tested using the nonparametric Wilcoxon's signed rank test. It was found that the hypothesis could not be rejected (P = 0.18 for the slope and P = 0.23 for the intercept, columns 5 and 6 in Table 1).
The vascular ROI was defined by threshold method with the threshold values adjusted by visually inspecting the defined ROI superimposed over the carotid artery. Table 2 examines the effect of the threshold values used on the estimated CMRglc in terms of the changes of the regression line's slope and intercept. Table 2 was generated using the data from one of the subjects. For this subject, the image-derived input function was obtained from two carotid artery ROIs over two adjacent slices with a common threshold value. Table 2 shows that even for those ROIs that were unacceptable by visual inspection, the estimated CMRglc by the use of the corresponding image-derived input function was compatible with the estimates by the use of the arterial blood samples.
Effect of the threshold values used in defining the region of interest over vascular structure
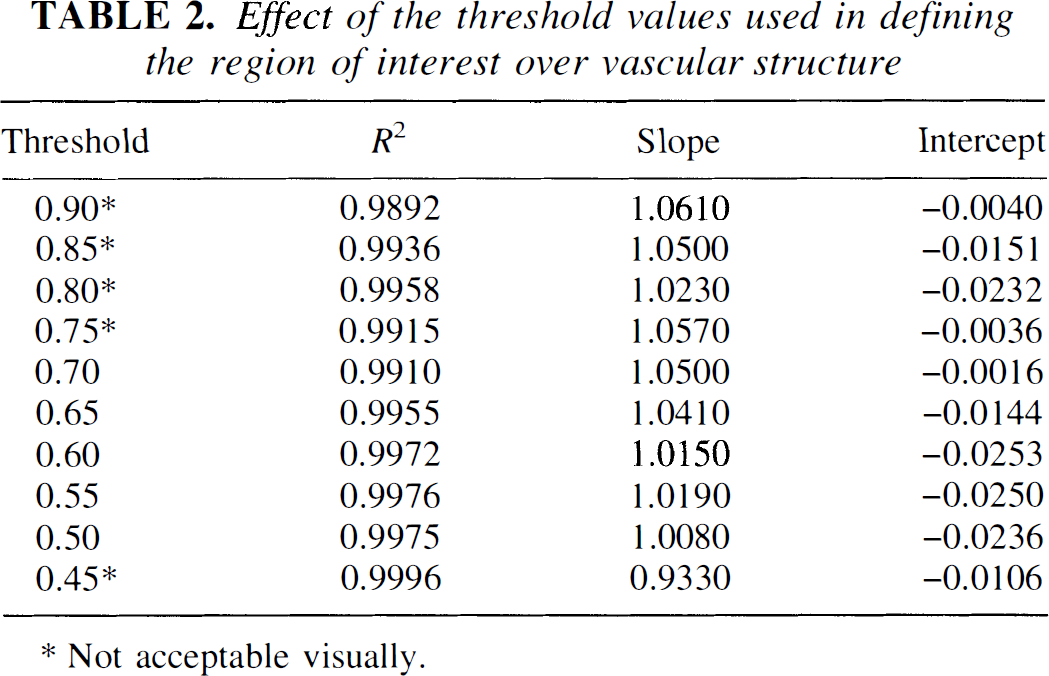
Not acceptable visually.
Carotid arteries on some slices were small in size and not very distinguishable from the background. The use of these ROI-TACs could result in bigger errors for the estimated glucose uptake rates. Using data from one subject, it was found that the slope of the regression line was changed from 1.041 to 0.8739. The intercept of the regression line was not affected significantly.
The spillover coefficient value (column 7, Table 1) for each subject was the mean of those spillover coefficients estimated at each vascular ROI. The mean of the 26 spillover coefficients, which ran from lowest 0.0327 to maximum 0.7412, was 0.3837 with standard deviation of 0.1634.
Despite the observed variation among the spillover coefficient, the use of a constant spillover coefficient in the generation of the image-derived input function was examined in the current study. Depending on the values of the spillover coefficient, the estimated CMRglc could differ significantly from the ones using the arterial sampled input function. For example, when the value 0.3837 was used for one subject, an error as high as 35% for the estimated CMRglc was obtained. Thus, the use of an average spillover coefficient across subjects does not appear to be acceptable.
DISCUSSION
This study demonstrates the feasibility of using the image-derived input function for the generation of the CMRglc parametric images. The procedure is simple, straightforward, and can be accomplished by a technician in less than 15 minutes.
There is one implicit assumption in the use of the image-derived input function: the difference between the plasma F-18 concentration and the one in whole blood can be ignored for human subjects. This assumption was validated in a previous study (Gambhir et al., 1989) for the 120-minute time period. Because our total scan duration is only 60 minutes, this assumption can be honored safely.
In the following sections, we discuss several issues related to the generation of the image-derived input function.
Alternatives for the derivation of the image-derived input function
Compared with previously described methods for noninvasive generation of the input function, the strategy described in this report has several advantages. Unlike the approach that analytically models the dynamics of the input function (Feng et al., 1993; Takikawa et al., 1993), the reliability of the image-derived input function should not be affected by individual physiologic states (i.e., changes in cardiac output) and procedural factors (e.g., the injection rate). In contrast to the method described by Wong et al. (1994), the image-derived input function has the potential to compute all individual rate constants in the FDG compartment model (e.g., using the model-fitting procedure).
There are several approaches for the estimation of the recovery and spillover coefficients without the venous blood samples or with reduced number of venous blood samples. In this study, the recovery coefficient and the spillover coefficient from the tissue to the vascular structure were corrected by the use of a three venous blood samples taken from the tracer injection site using several precautions to minimize cross-contamination. We found that data from the venous blood samples can be used to reconstruct the input function with adequate accuracy. When cross-contamination is possible, the venous blood might need to be sampled separately.
One blood-sampling—free approach is to have the partial volume effect corrected using phantom data (Chen et al., 1995) and use a fixed spillover coefficient. This approach was examined in this study. As shown in the Results section, the use of a constant spillover coefficient is problematic because the spillover varies greatly from one subject to another. This spillover-coefficient variation might be explained partially by the cross-subject difference in the brain tissue size, shape, and distance to the carotid artery (Fig. 1).
Finally, another method to estimate the recovery and spillover coefficients without any blood data currently is under investigation. The basic idea of this method is to incorporate the spillover correction and partial volume correction into a procedure called generalized linear least square method (Feng et al., 1995). This approach will require the measurements of the carotid artery TAC and several tissue ROI-TACs. For each tissue TAC and carotid TAC pair, the modified generalized linear least square method would estimate the model parameter for the location over which the tissue TAC is acquired, as well as the recovery coefficient and spillover coefficient. Consequently, an estimate of the input function is obtained for that given TAC pair. The average of all those estimated input functions over all the TAC pairs is taken as the image-derived input function.
Vascular region of interest and tissue region of interest definition
A review of the whole procedure for the generation of the image-derived input function reveals that there are two steps subjective in nature. One is the choice of the threshold value for defining the vascular ROI. As shown in the Results section, the image-derived input function is insensitive to the threshold values in a reasonable range. The other subjective step is the manual drawing of the tissue ROI. For the tissue ROI, it was found that as long as it is drawn around the carotid artery with a size three or four times larger than the vascular structure, the variation of the resulted input function is trivial.
Effect of choosing a poorly defined vascular structure
Because the size, shape, and contrast (against the background at the early tracer uptake phase) of carotid artery sections over different PET slices can be judged and compared easily, choosing slices and arterial vascular structures over those selected slices is fairly straightforward. Thus, the vascular ROI selection should not be regarded as subjective and erroneous. As shown in the Results section, an approximately 13% difference of the slope was observed for one subject when those carotid artery sections with small sizes and/or blurred boundaries were used. Therefore, avoidance of the use of carotid arteries with small size is suggested.
Although caution should be exercised in choosing the vascular structures, it is recommended to have as many carotid artery ROIs defined as possible because of the variation among individual carotid artery ROI-TACs. That variation is most likely attributable to the combined effects of partial volume averaging and the variation in the size, shape, and orientation of the carotid artery. It also could be attributable to differences in tracer arrival time.
The heights of the early peak of the input function
The inconsistency of the input-function peak heights on some of the subjects studied was found to have no significant effects on the estimated CMRglc. Because the lower peak of the image-derived input function is not universal across all subjects, one can reasonably rule out the dead-time as a potential error source. In fact, it was found that the counts collected with a 1-second frame rate were only 1.5% lower than those collected with 10-second frame rate when a phantom containing 11 mCi radioactive tracer was placed on the center of the field of view. One potential cause of the lower peak of the image-derived input function might be the combination of the relatively slow framing rate and the timing of the peak.
A quick computer simulation was performed to show that the slow framing rate combined with unknown peak timing might be the cause for the peak inconsistency. The arterial sampled input function from one of the subjects was used as the “true” input function. The input function is sampled at different sampling rates and with various starting points relative to time zero from which the “true” input function starts. In general, the higher the sampling rate, the smaller the difference between the “true” curve and the sampled one. However, the peak location relative to the sampling start points played an important role as well. For example, only a 7.9% error was observed for the sampling rate of 5 seconds with a start time that causes a sampling time point very close to the peak location. Conversely, the 3-second sampling rate introduced 24.4% error when the sampling started at another time point.
CONCLUSION
The image-derived input function is compatible with the arterial blood samples and can be used to noninvasively quantify CMRglc in brain FDG PET studies.
Footnotes
Abbreviations used
Acknowledgments
The authors thank Sandy Goodwin, Leslie Mullen, Pat Raso, Sharon Koleske, Robin Holmgren, and Jennifer Telford for their technical assistance and Tricia Giurlani and David Stith for the radiopharmaceutical production. They also thank two anonymous reviewers for their helpful and constructive suggestions.