
Abstract
Immunogold electron microscopy was used to analyze and quantify the Glut1 glucose transporter in brain tissue from five patients undergoing surgery for treatment of seizures. Samples were prepared from two different regions of each resection: (1) the most actively spiking epileptogenic site, and (2) the least actively spiking region, as indicated by intraoperative EEG monitoring. Two configurations of endothelial cell Glut1 were observed. About one half of the capillary profiles examined displayed abundant Glut1 immunoreactivity on both luminal and abluminal endothelial membranes. In the remainder of the profiles, reduced Glut1 labeling was seen, but adjacent erythrocyte membranes remained highly Glut1 immunoreactive, suggesting that reduced endothelial Glut1 reactivity was not attributable to method artifacts. Immunogold studies using antisera to human glial fibrillary acidic protein and human serum albumin demonstrated increased quantities of these two epitopes in the extravascular regions in which more EEG spiking activity had been demonstrated. These observations were consistent with the hypotheses that capillary integrity was more compromised, and gliosis was quantitatively increased, in the more actively spiking region of the resection. Altered glucose transporter activity in the blood–brain barrier was characterized by a bimodal Glut1 distribution in which the smaller (type B) endothelial cells displayed low Glut1 immunoreactivity, whereas adjacent (and even contiguous) larger (type A) endothelial cells showed 5- to 10-fold greater expression of membrane Glut1 transporter protein. Because this transporter facilitates glucose entry to the brain, small pericapillary volumes of brain tissue may have quite different concentrations of glucose. We hypothesize that in complex partial seizures and other forms of brain insult, an alteration of blood–brain barrier Glut1 glucose transporter activity is indicated by the appearance of these two subpopulations of endothelial cells. In comparison with previous studies of human brain capillaries in hemangioblastoma and brain injury, endothelial Glut1 density was apparently reduced (interictally) in affected temporal lobes of patients with complex partial seizures.
Keywords
Studies of seizure-induced animals suggest that blood–brain barrier (BBB) glucose transport is ictally upregulated as a result of the seizure activity. This conclusion is supported by observations that in vivo measurements of cerebral glucose utilization rates (in animal seizure models) exceed the BBB glucose transporter maximal velocity in normally fed rats (Pardridge, 1983). Presumably after seizure activity has subsided, and glucose utilization rates normalize (Duncan, 1992), glucose transporter activity undergoes a postictal downregulation. As the Glut1 isoform is the principal glucose transporter in the BBB (Boado and Pardridge, 1990; Pardridge et al., 1990), intracellular localization of transporter in brain capillaries can be both visualized and quantitatively measured using electron microscopic immunogold methods (Cornford et al., 1994, 1995, 1996).
To complement dynamic positron emission tomographic scan analyses (Cornford et al., in preparation), additional information about the BBB glucose transporter was sought through examination of tissues resected from patients undergoing surgical treatment for their seizure disorders. Antisera have been prepared that can specifically immunolocalize the Glut1 glucose transporter protein. The Glut1 transporter protein represents 5% of the total human erythrocyte membrane protein, by far the highest concentration density for any glucose transporter (Mueckler, 1994), affording an excellent internal control for antigen localization methods in brain tissue. However, recent electron microscopic immunogold analyses of Glut1 immunoreactivity in human brain resections from a variety of clinical situations have consistently demonstrated greater Glut1 densities on the brain capillary endothelial membranes than on the erythrocyte membranes seen within the capillary lumens (Cornford et al., 1994, 1995, 1996). Therefore, the greatest concentration density for any glucose transporter may now be reassigned to the so-called gatekeeper of the brain (Pardridge 1987), the BBB endothelial cell membranes.
Given this abundance of Glut1 activity in human brain endothelial cells, it seemed likely that physiologic alterations of transporter activity in conditions such as seizures should be both detectable and quantifiable. In the present study, we examined BBB Glut1 distribution patterns to test the hypothesis that altered immunoreactive Glut1 transporter density could be demonstrated interictally in temporal lobe resections, including the seizure focus from patients with complex partial seizures.
METHODS
Prior approval for this investigation was obtained from the appropriate institutional human studies review boards. Brain tissue specimens from the affected temporal lobe were obtained from five hospitalized patients with a history of complex partial seizures, unresponsive to conventional anticonvulsant drug treatments, who underwent surgical treatment. In addition, intraoperative EEG monitoring was performed, and the identities of the regions of highest spiking activity and of the resected area with least active spiking activity were sampled for comparative analytical purposes. In our experience, freshly fixed material is of paramount importance for studies of human BBB electron microscopy and Glut1-immunogold localization (Cornford et al., 1995).
Resected samples designated case 1 came from a 42-year-old man with idiopathic onset of progressively escalating seizures 3 years before resection, who was subsequently diagnosed with Herpes II encephalitis. Case 2 was a 29-year-old man with a history of childhood spinal meningitis and seizure onset at age 21. A left temporal lobectomy had been performed 4 months earlier, and the tissues examined came from a second surgery in which a left inferior frontal resection was performed to treat recurring seizures. Case 3 tissues came from a 41-year-old man with a history of seizures beginning at age 2; anticonvulsant drug treatments controlled his seizures until he suffered a traumatic injury with loss of consciousness in an automobile accident 6 years before surgical intervention. Case 4 was a 35-year-old man with a history of unprovoked seizures beginning at 9 years of age; a left anterior temporal lobectomy had been performed 9 months before this second resection of the region close to the left inferior frontal gyrus. Case 5 was a 38-year-old man with a 13-year history of seizures subsequent to a traumatic head injury who underwent a right temporal lobe resection.
Small blocks of resected brain tissue from regions identified as having the most and least active spiking activity were obtained as soon as possible from the operating room and were fixed by immersion as described by Farrell and Pardridge (1991) for Glut1 immunogold electron microscopy. As described below, the concomitant demonstration (in the same sections) of erythrocyte Glut1 transporter was used as an indicator of appropriate tissue preparation.
The ice-cold fixative contained 2% paraformaldehyde in 0.05% glutaraldehyde, 0.9% NaCl, and 0.15 mg/mL CaCl2 in 0.01 mol/L sodium phosphate buffer, pH 7.4. The tissues were further dissected into small (1 mm3) cubes and were allowed to fix for a total of 0.5 to 1.5 hours, after which the fixative was removed and replaced with Sorensen's buffer (0.1 mol/L phosphate buffer, pH 7.4) and left overnight at 4°C. They were then dehydrated and embedded in LR-white resin (Farrell and Pardridge, 1991). Because of the variable time periods of interruption in the circulation to the resected tissue, and delays in immersing these tissues in fixative, tissue samples were routinely subjected to a preliminary examination of Glut1 epitope viability. Only brain tissue samples in which intravascular erythrocyte membranes were Glut1 positive were selected for further quantitative examination (five cases). If Glut1 immunoreactivity was reduced on erythrocyte membranes in either of the paired samples, tissues were judged to be inadequate or improperly fixed for Glut1-immunogold electron microscopy, and excluded (about 10 other samples) from further examination.
Antiserum preparation
A rabbit polyclonal antiserum to the purified human erythrocyte Glut1 glucose transporter (hGT), a 492-amino acid peptide (Meuckler, 1990), was prepared as described previously (Pardridge et al., 1990). For immunogold staining, the anti-hGT antiserum and the preimmune serum were both used at a dilution of 1:800. The antigen used to prepare this antisera was hGT, purified from freshly isolated human red cells using the method of Baldwin and Lienhard (1989). The immunoreactivity of the antiserum has been confirmed in both Western blot analyses of isolated brain capillaries and immunocytochemical procedures. Absorption of the antiserum with hGT eliminated antiserum reactivity with brain microvessels (Pardridge et al., 1990). The human gene encoding the transporter is referred to as GLUT1, and throughout this manuscript is distinguished from the corresponding protein using lower case type, Glut1, as proposed by Meuckler (1990).
Immunogold staining
The antisera against hGT (polyclonal), glial fibrillary acidic protein (GFAP, polyclonal bovine and monoclonal human; DAKO Corp., Carpenteria, CA, U.S.A.), and human serum albumin (HSA) (polyclonal, DAKO Corp.) were used at concentrations of 1:800, 1:1,000, 1:400, and 1:2,000, respectively (overnight at 4°C). The secondary gold-labeled goat anti–rabbit or anti–mouse sera were used at 1:60 to 1:100 for 2 hours at room temperature (22°C). For double staining, sections were simultaneously exposed to polyclonal anti-hGT and mouse monoclonal GFAP antisera overnight (at 4°C). After completing the wash procedure, these grids were exposed to a mixture of 10-nm-gold-conjugated goat anti–rabbit (Amersham, Arlington Heights, IL, U.S.A.) and 20-nm-gold-conjugated goat anti–mouse serum (Ted Pella Inc., Redding, CA, U.S.A.). They were then fixed and stained as described previously (Farrell and Pardridge, 1991). Blocks of the plastic-embedded resected tissue were sectioned and stained for electron microscopic examination, and separate ultrathin sections were stained in parallel with control preimmune, normal rabbit and mouse IgG1 sera. Electron micrographs were taken with a JEOL electron microscope at 80 kV.
Gold particles were counted on an average of 15 or more capillary profiles from each of the two brain tissue regions, and membrane density of immunoreactive Glut1 epitopes was determined using a Sigma Scan image analysis system (Jandel Corp., Corte Madera, CA, U.S.A.). As in prior studies (Cornford et al., 1995, 1996), every available circular profile on each stained grid was imaged for analysis to obtain a fully representative sample of capillary Glut1 density patterns. A description of the digital analyses and quantification of capillary profiles appears elsewhere (Cornford et al., 1993).
All data are presented in the form of a mean ± SD. Capillary profiles containing approximately 360 or greater total Glut1 immunogold particles and more than 10 Glut1 immunogold particles per micrometer on the luminal membrane circumference were categorized as type A profiles; all uniformly stained profiles with fewer gold particles were type B profiles. Repeated measures analysis was used to assess the association of each capillary morphometric variable with two factors: capillary Glut1 immunoreactivity (profile type A versus type B) and resection seizure activity (more active versus less active EEG site). This was done by computing a contrast of mean values within each patient for each factor and a third contrast for their interaction, and then testing each contrast by a paired Student's t test. Probability values are reported without adjustment for the number of tests performed.
RESULTS
In the human brain resections examined in the present study, capillary profiles were observed to be variably immunoreactive to the Glut1 glucose transporter. A bimodal distribution of glucose transporter immunoreactivity was observed in endothelia; individual cells were either highly immunoreactive (type A, 10 to 50 gold particles per micrometer of membrane) or weakly Glut1 positive (type B, less than five particles per micrometer of membrane). The circular capillary profiles examined from interictal seizure resections exhibited one of three specific Glut1 distribution patterns, differentiated by the following characteristics:
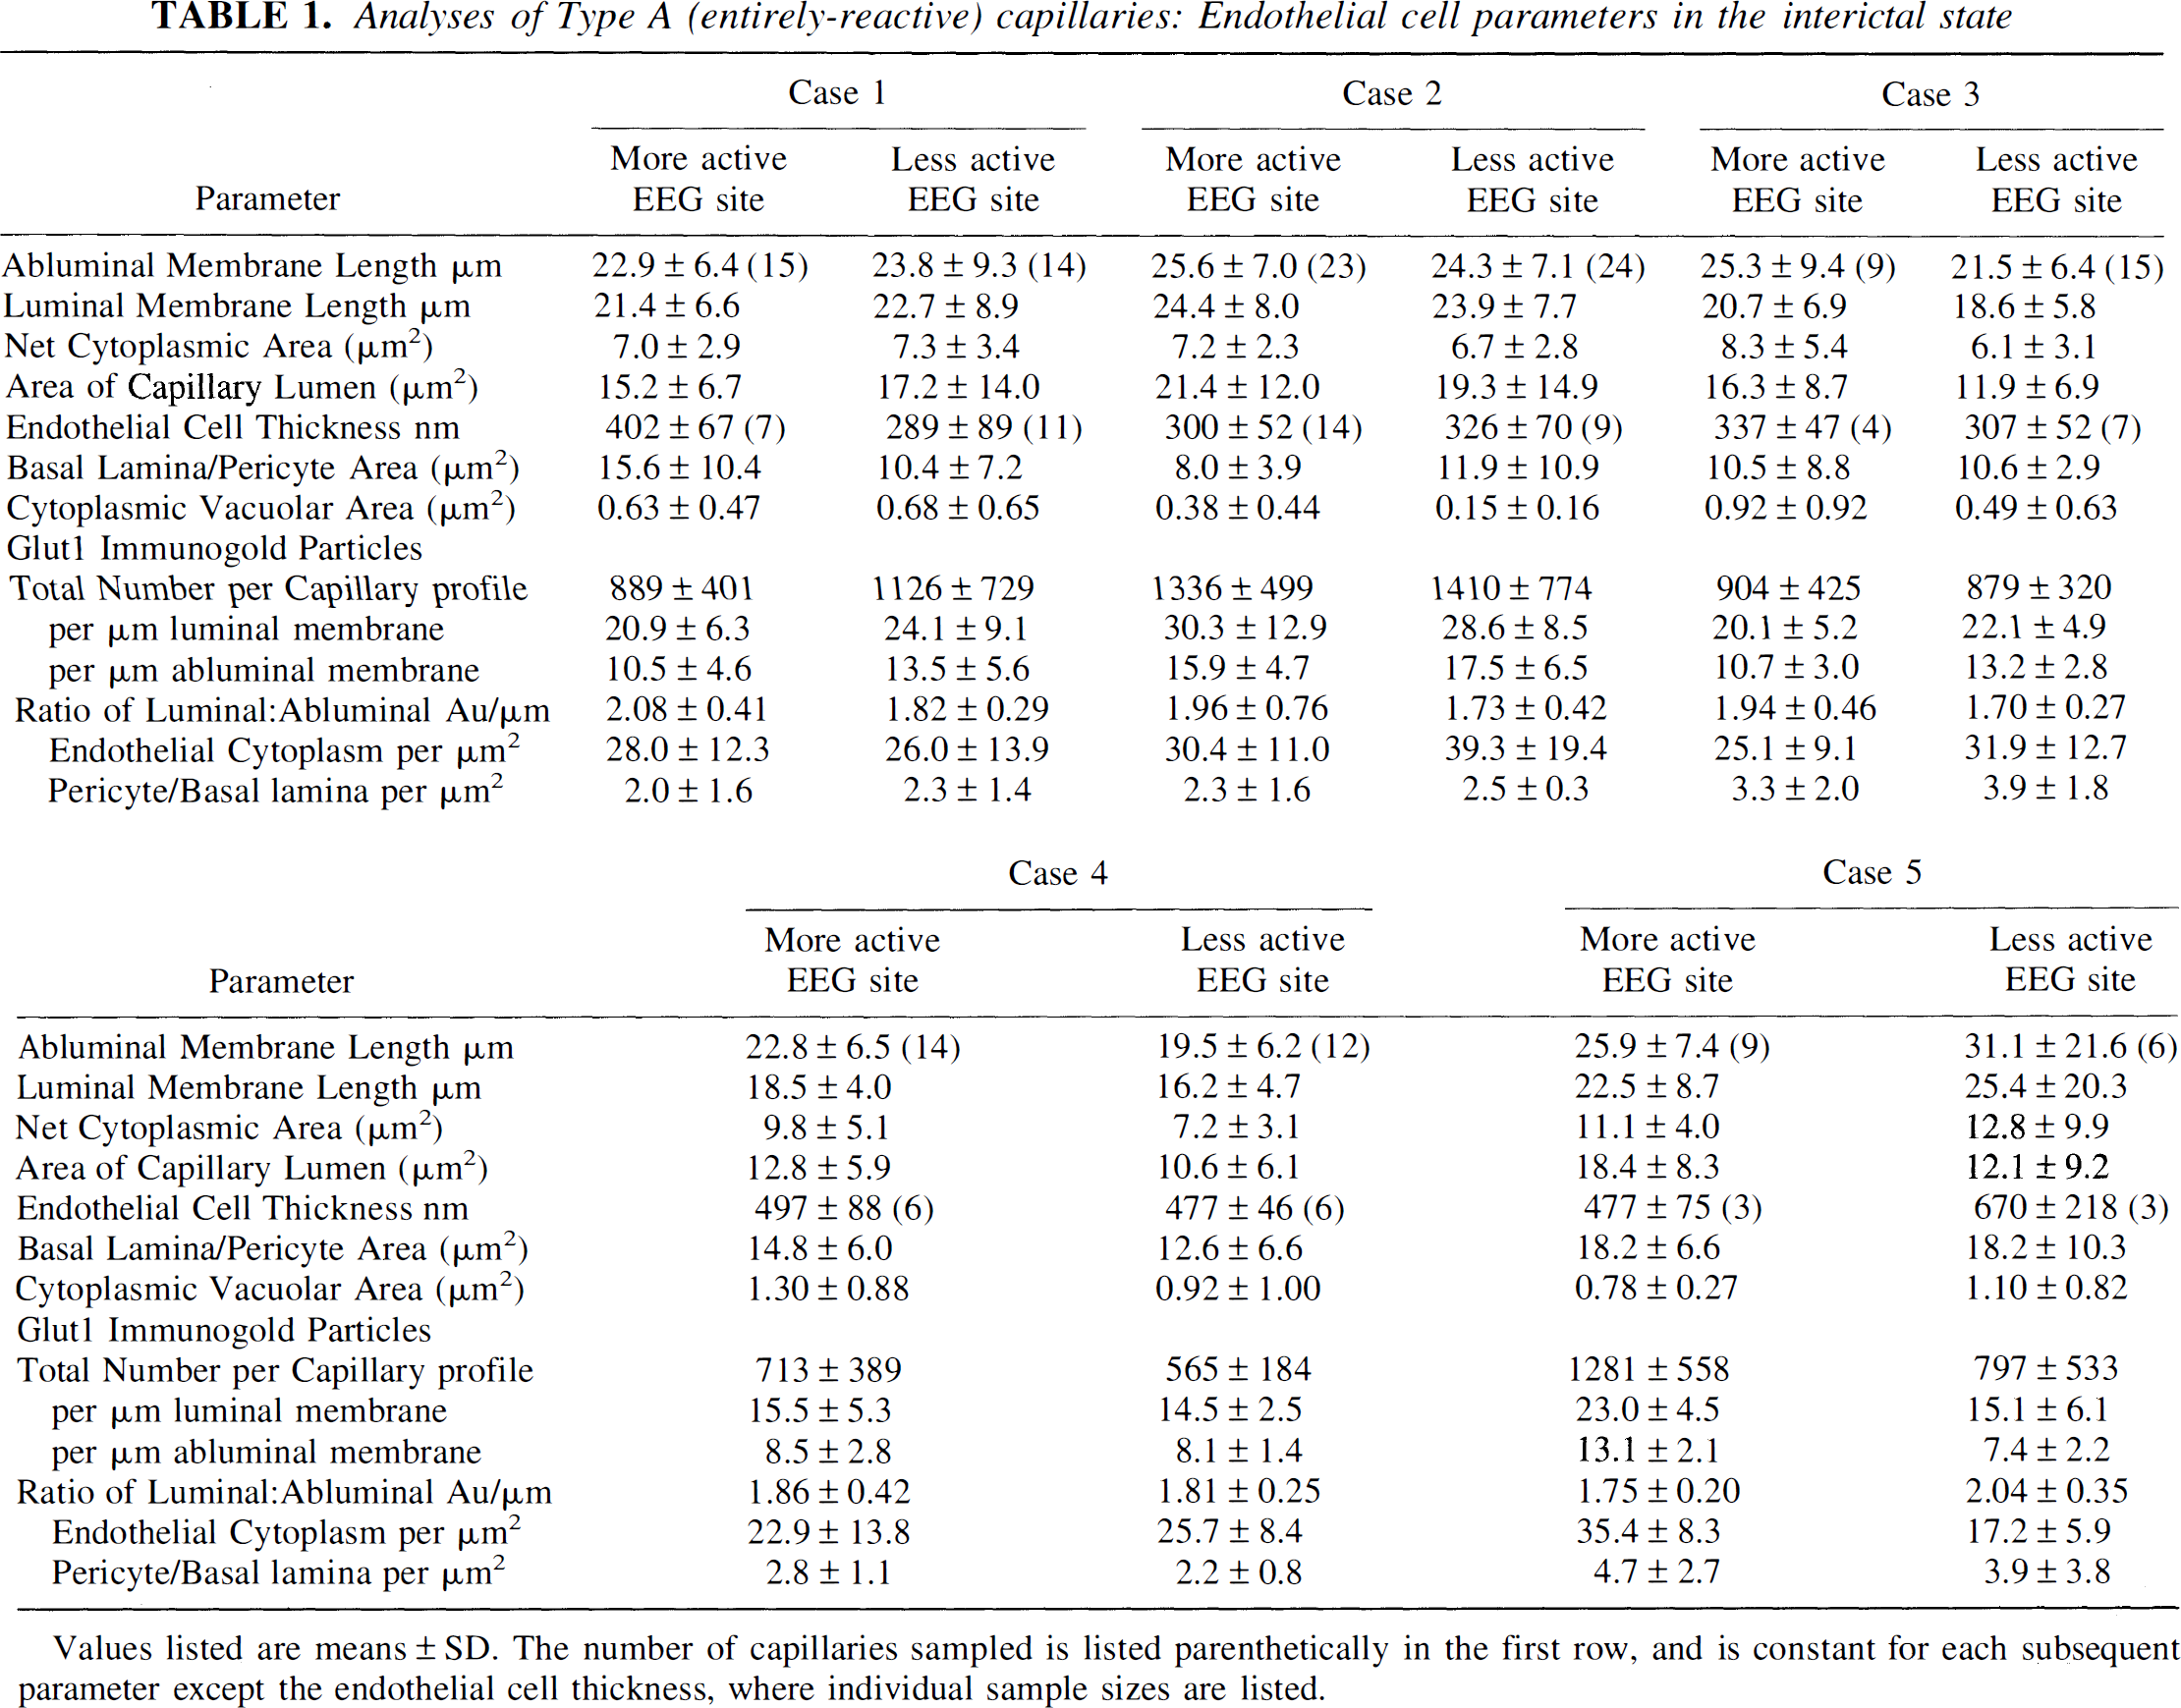
A Profiles: Entirely reactive endothelial capillaries (Fig. 1). This capillary profile displays abundant Glut1 glucose transporter immunoreactivity throughout the entire capillary circumferences on both luminal and abluminal membranes. Although the number of immunoreactive Glut1 epitopes per micrometer of capillary membrane was abundantly similar on both luminal and abluminal membranes, digital analyses (Table 1) indicated a nearly twofold greater mean density on the luminal membrane. Circular capillary profiles typically had 0 to 2 interendothelial junctions (1 or 2 type A endothelial cells).
The typical appearance of an entirely reactive type A capillary profile double stained with 10-nm-immunogold-Glut1 and 20-nm-immunogold-labeled GFAP (glial fibrillary acidic protein) from the less actively spiking area of a temporal lobe seizure resection. Note that the Glut1 glucose transporter immunogold epitopes can be seen around the entire capillary circumference. The Glut1 glucose transporter protein is abundant on both luminal and abluminal endothelial membranes, and also at the interendothelial cleft. Only a few GFAP epitopes (20-nm gold particles) are apparent. Scale bar = 0.5 μm. Analyses of Type A (entirely-reactive) capillaries: Endothelial cell parameters in the interictal state Values listed are means ± SD. The number of capillaries sampled is listed parenthetically in the first row, and is constant for each subsequent parameter except the endothelial cell thickness, where individual sample sizes are listed.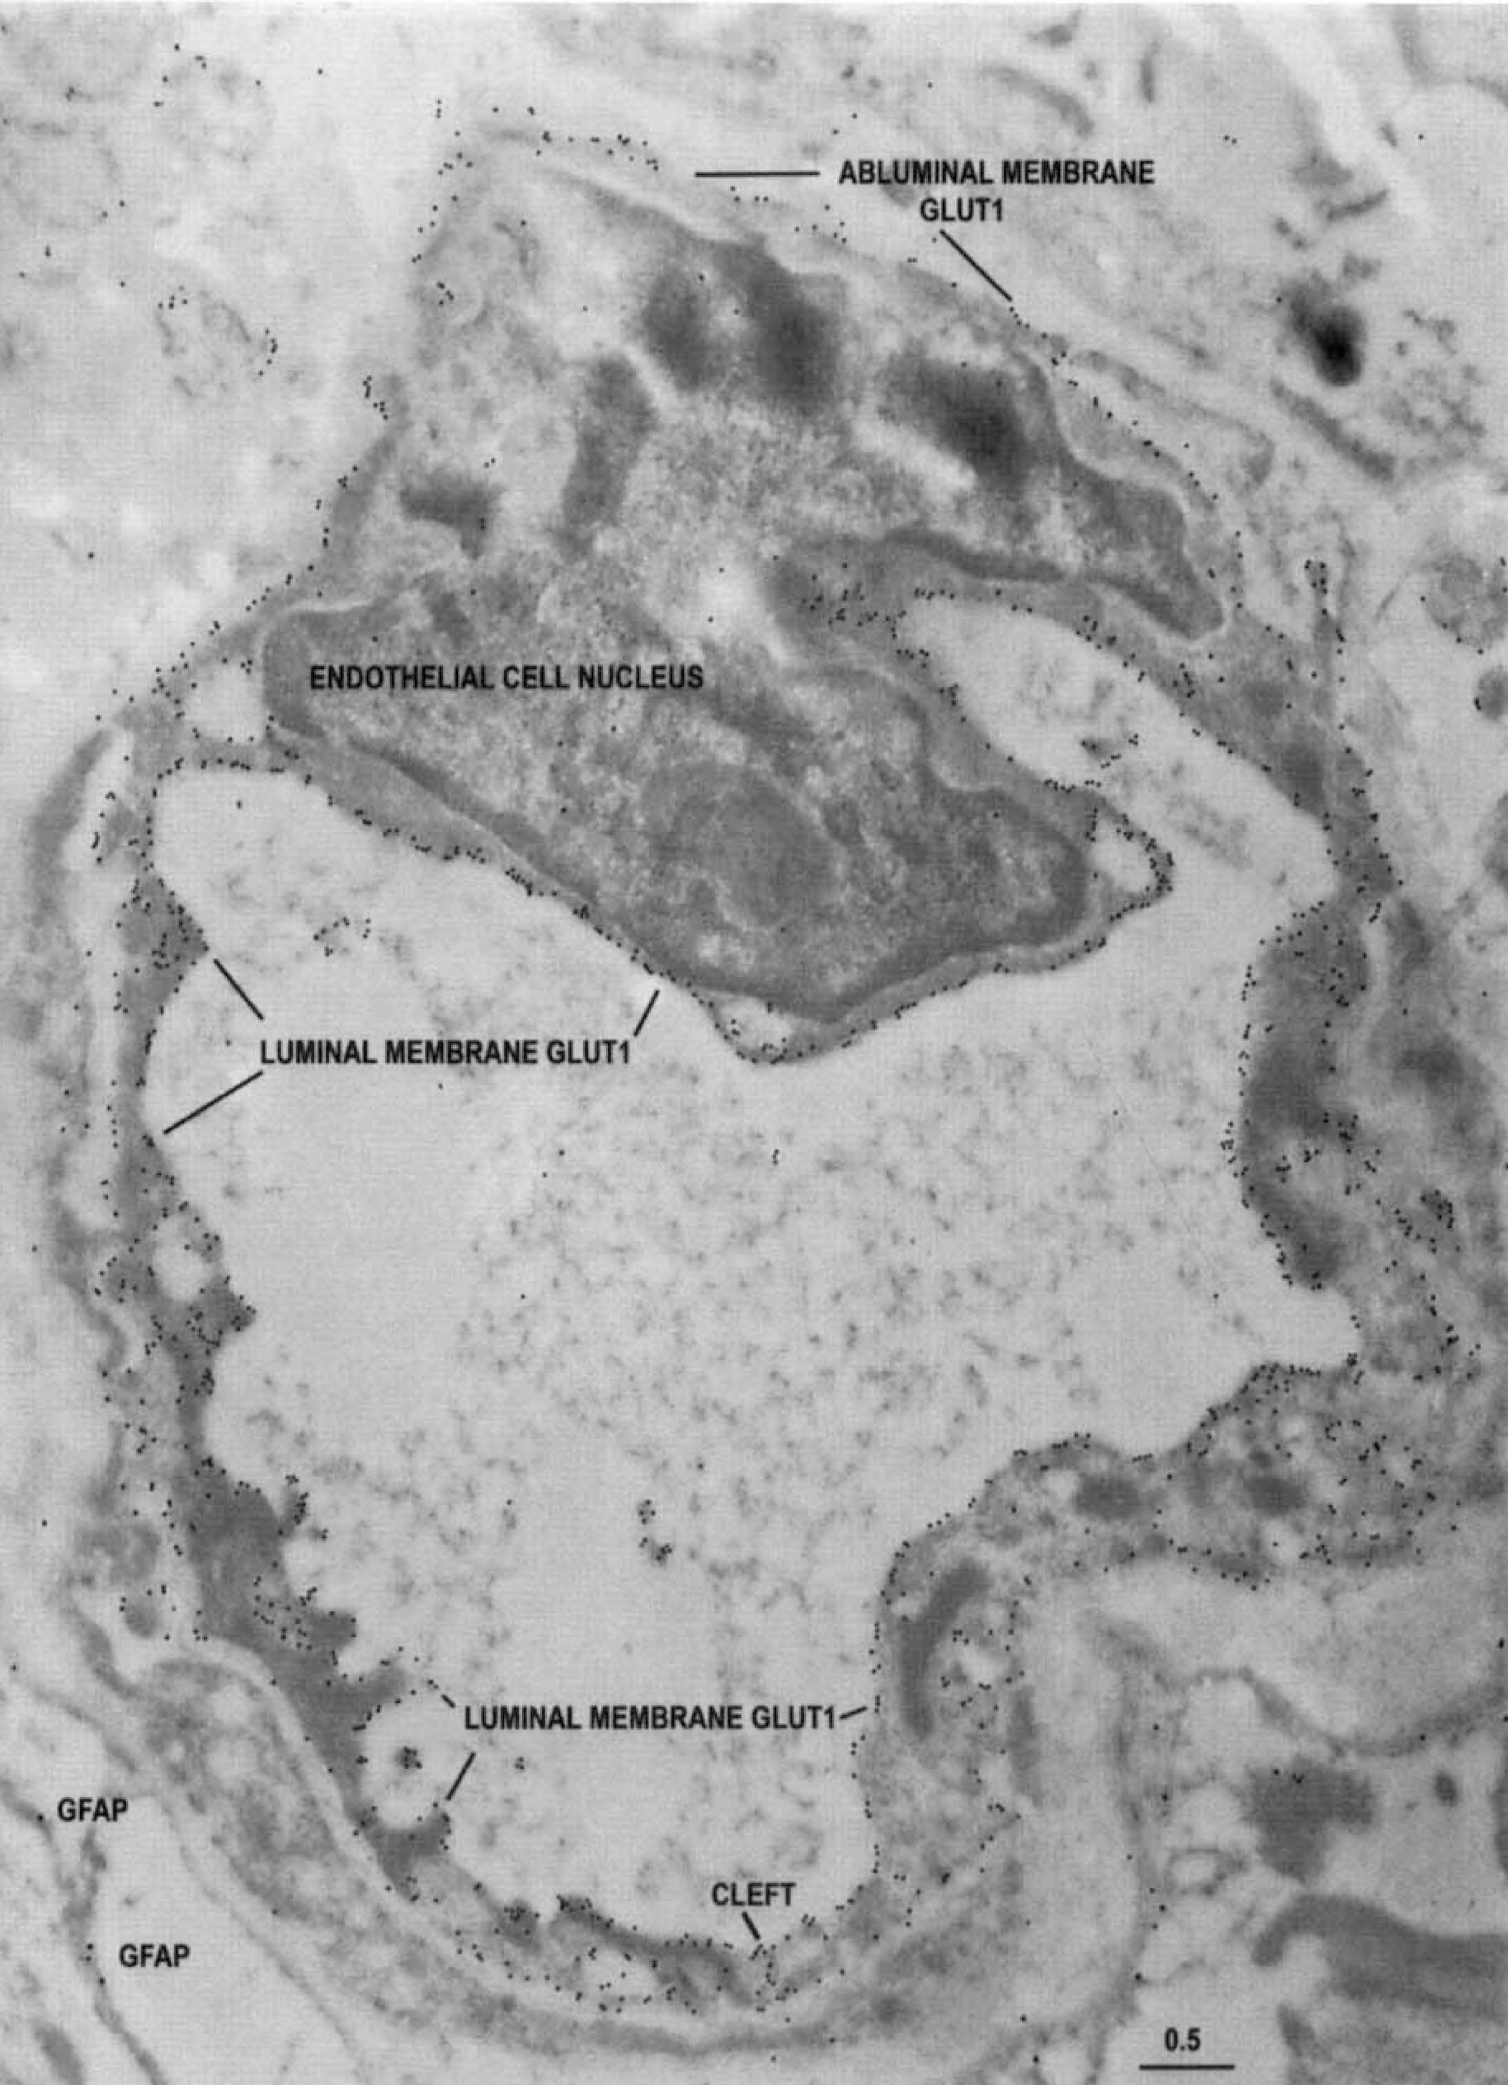
AB Profiles: Mixed-reactivity capillaries (Fig. 2), displaying both type A and type B endothelial cells. This type of capillary profile displayed abundant Glut1 transporter activity on luminal and abluminal membranes, restricted to a sector of the profile and adjacent to a uniformly low-reactivity sector. Thus these capillary profiles comprised two (or more) contiguous endothelial cells, one of which is highly immunoreactive type A and another that is type B, with low Glut1 reactivity. The bimodal distribution of endothelial Glut1 reactivity is readily apparent in these profiles. In the highly reactive sector (Fig. 2, left side), the type A endothelial cell displays the characteristic slightly higher Glut1 density on the luminal membrane. In contrast, the type B endothelial cell making up the low-reactive sector (Fig. 2, right side) is further distinguished by lower Glut1 immunoreactivity on the luminal than abluminal membrane.
The characteristic appearance of a type AB capillary profile double stained with 10-nm-immunogold-Glut1 and 20-nm-immunogold-labeled GFAP from the more actively spiking region of a temporal lobe resection. This capillary profile demonstrates that in contiguous endothelial cells (separated by an intercellular cleft), Glut1 glucose transporter immunoreactivity can vary between two extremes; abundant and minimal. Note that the Glut1 glucose transporter epitopes are abundant on only a sector of the capillary circumference, comprising the type A endothelial cell on the left side of the profile (and the interendothelial clefts at the 6- and 12-o'clock positions). The remainder of the sector (formed from an adjacent, contiguous type B endothelial cell) shows only a very few Glut1 glucose transporter epitopes, and relatively more on the abluminal than luminal membrane. Scale bar = 0.5 μm.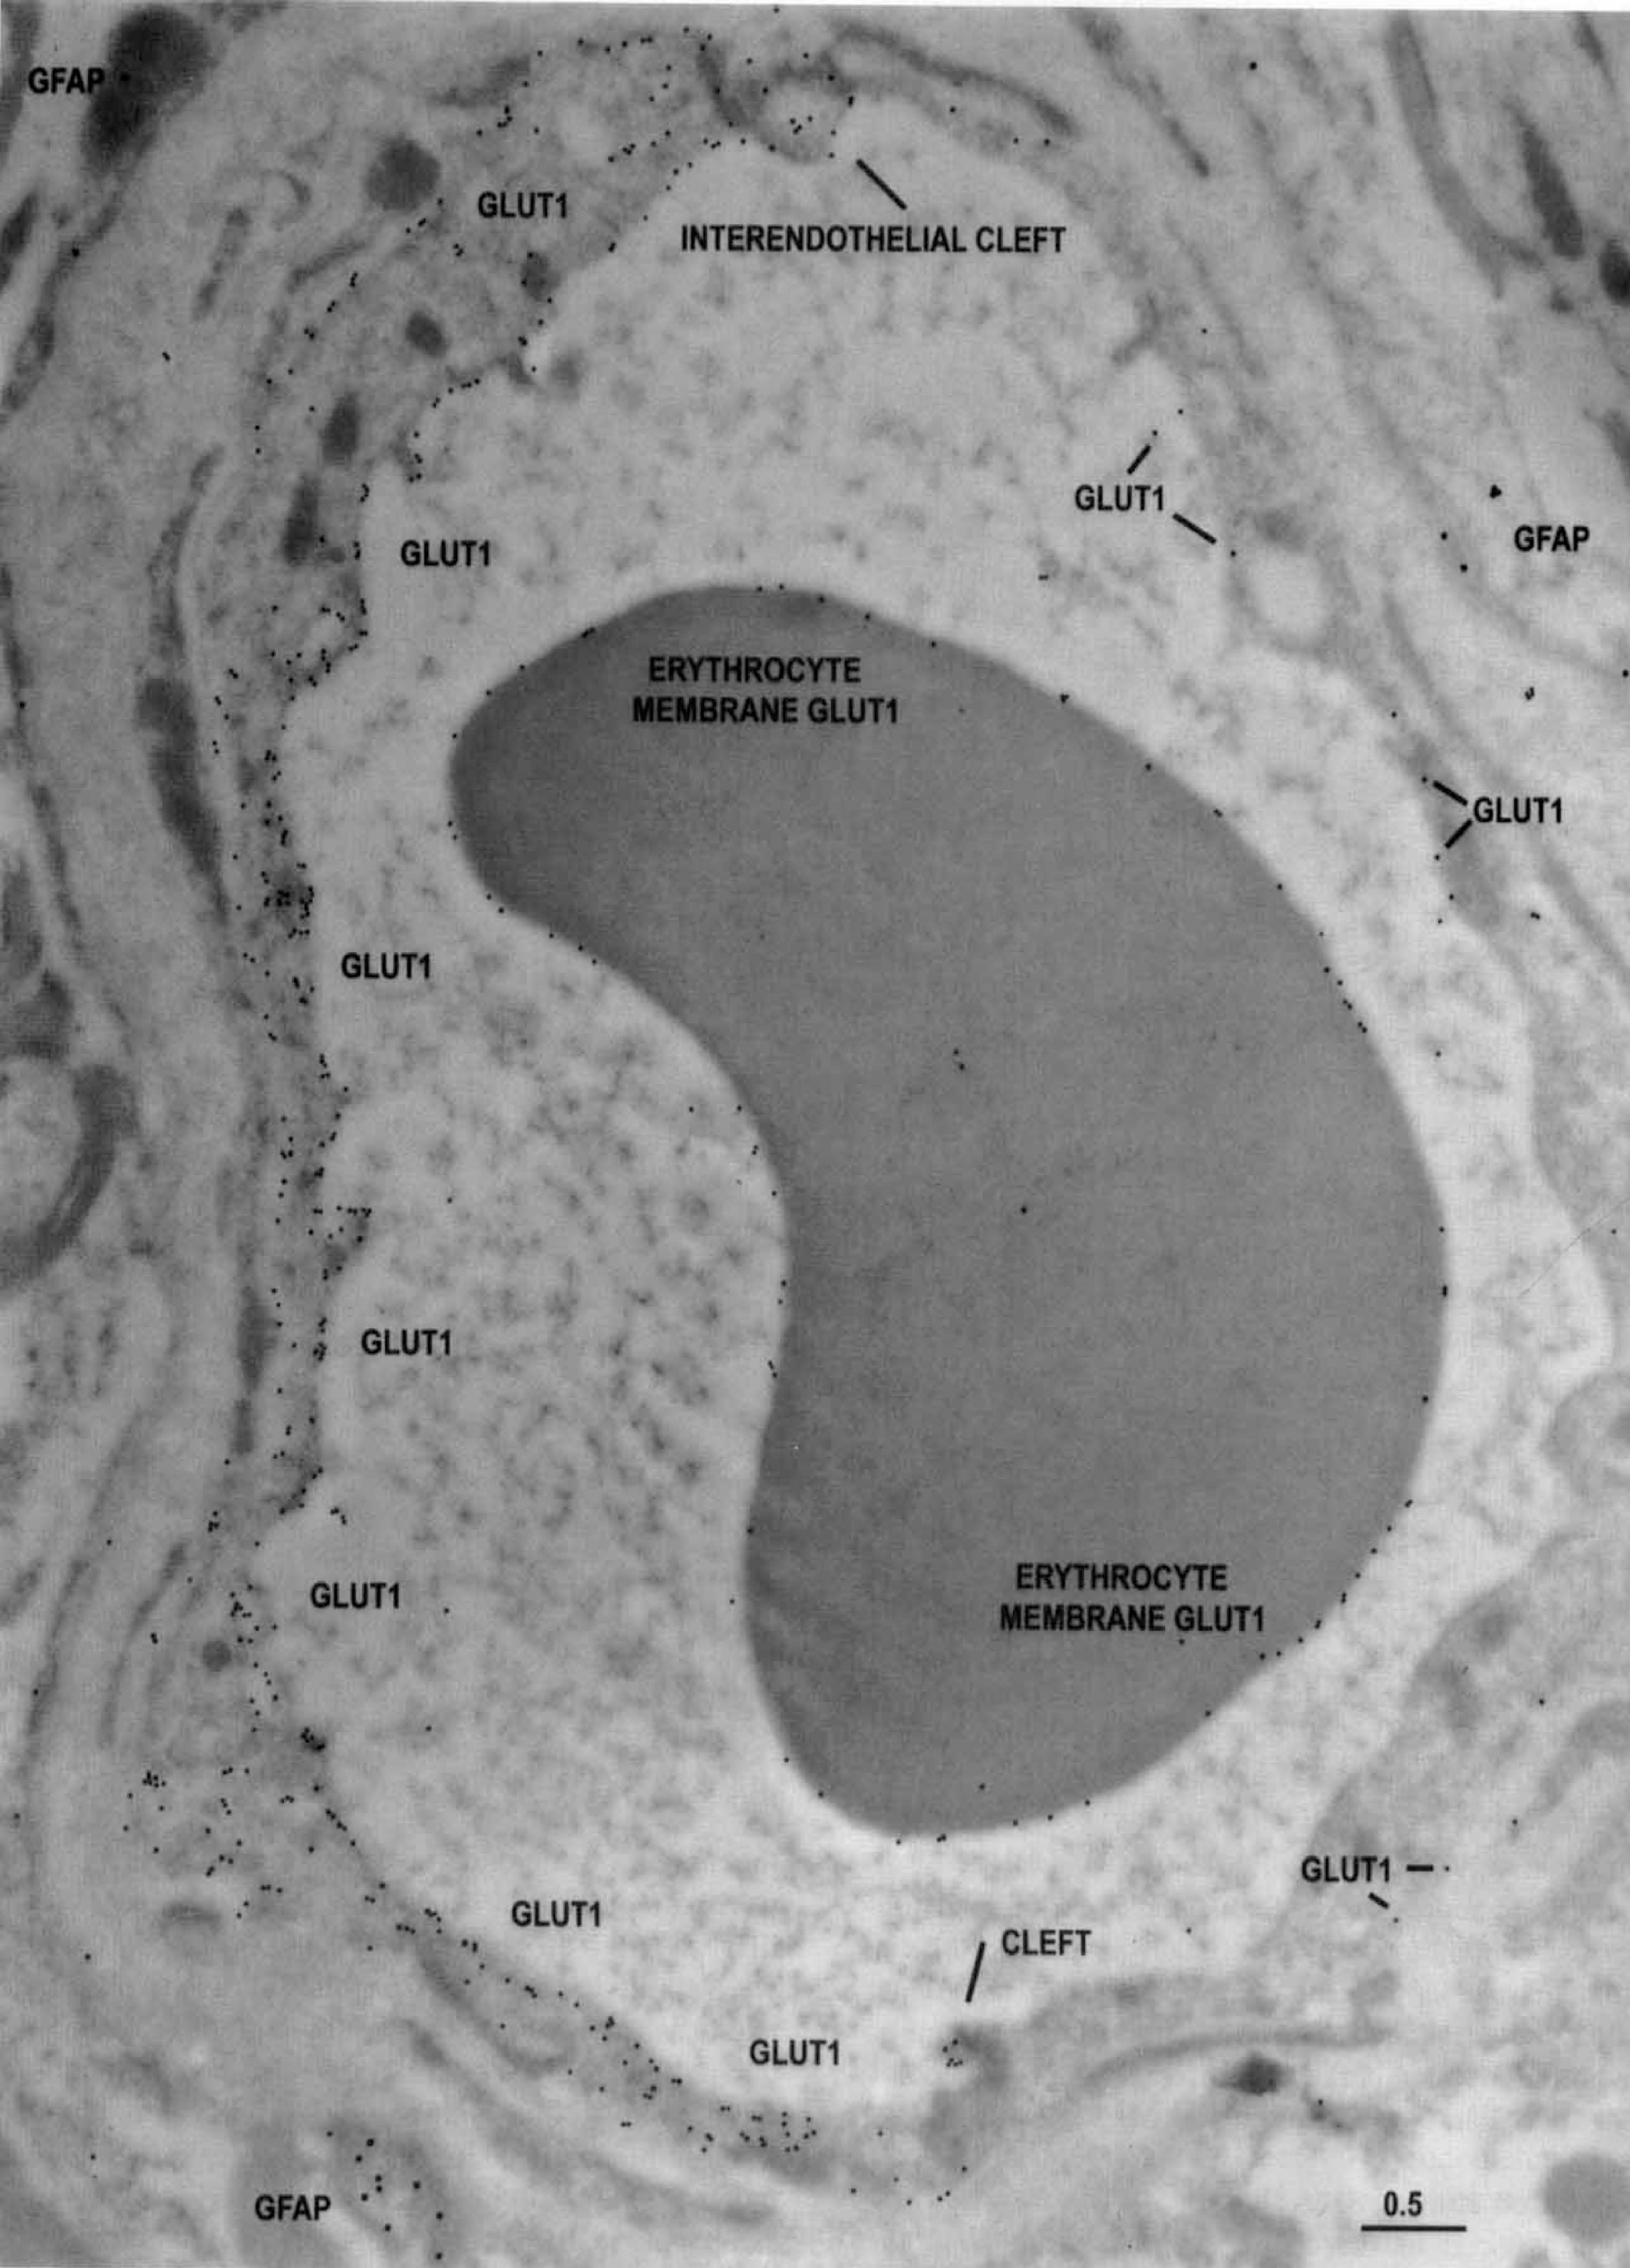
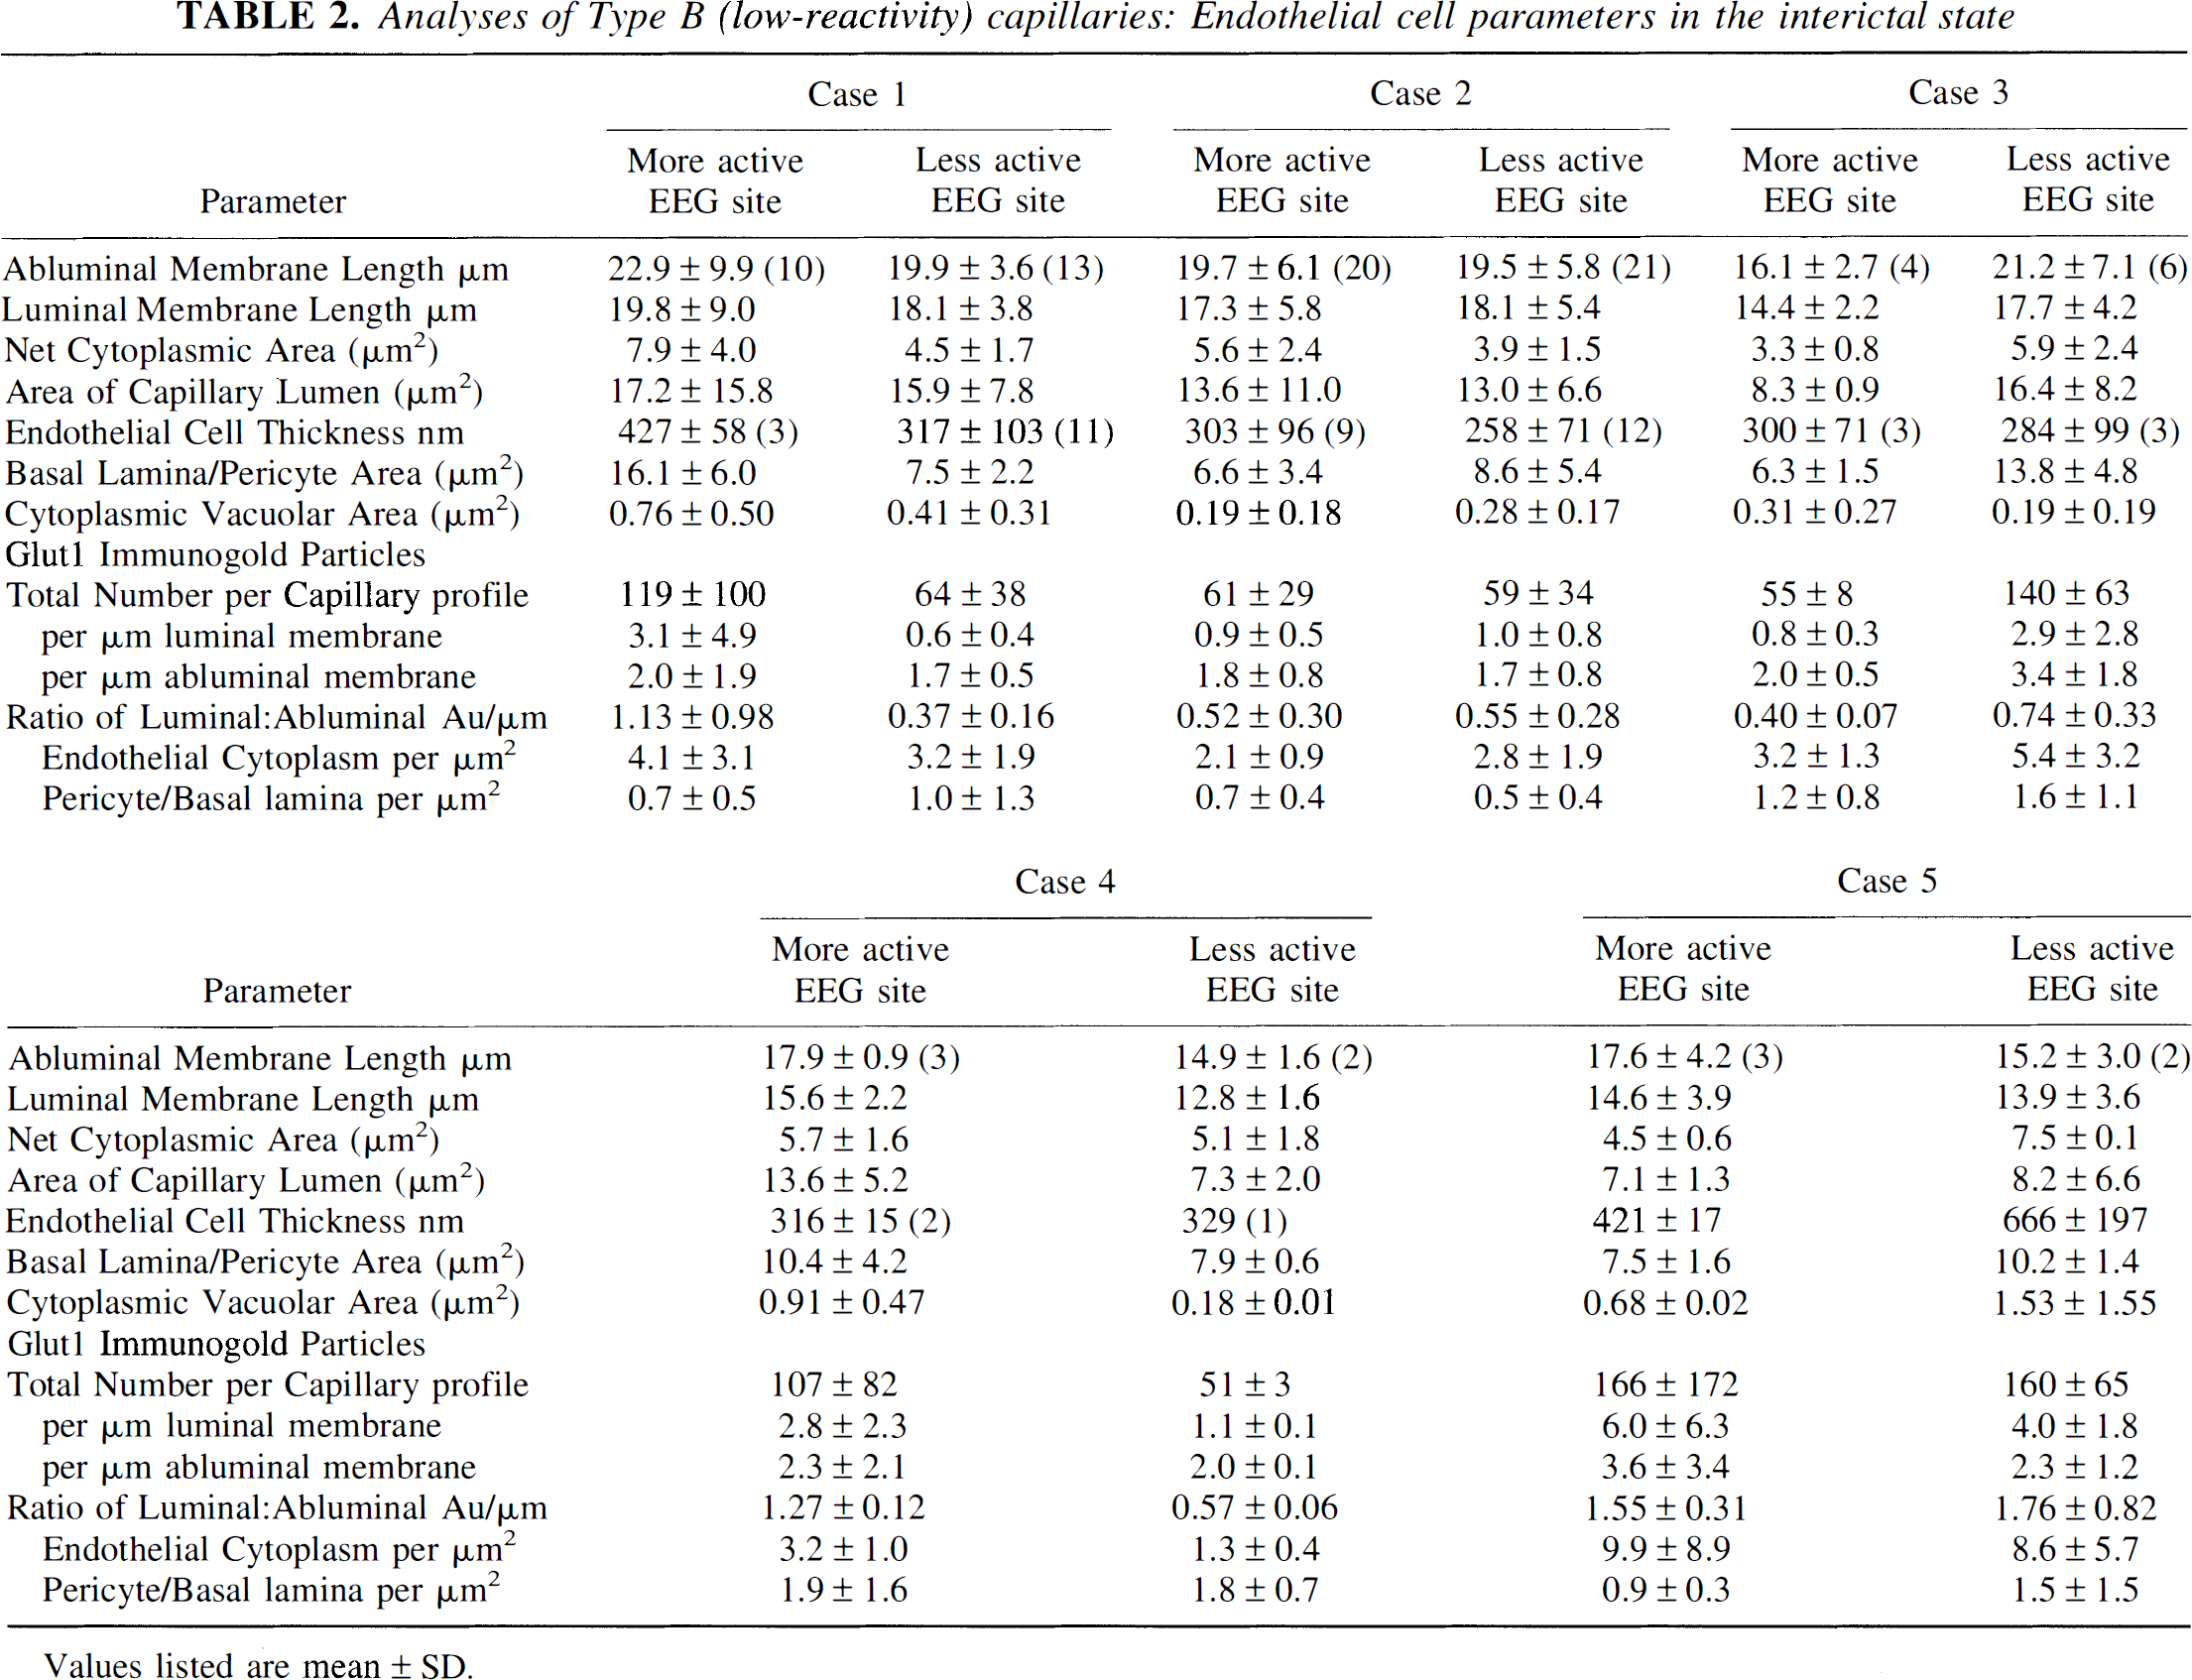
B Profiles: Low-reactivity endothelial capillaries (Fig. 3), with all type B endothelial cells. The third type of capillary profile observed is remarkable for the low number of Glut1 epitopes (Fig. 3, arrows), averaging less than five gold particles per micrometer of membrane, demonstrable over all endothelial cells contributing to the entire capillary circumferences. Digital analyses (Table 2) typically indicate fewer Glut1 epitopes on the luminal than abluminal membrane (i.e., a luminal to abluminal ratio of approximately 1.0). The fact that erythrocytes seen in the lumen of this type of capillary show a normal level of Glut1 immunoreactivity on the red cell membrane indicates that the lack of endothelial labeling is not an artifact of poor tissue preservation or improper fixation.
The typical appearance of a type B, minimally reactive capillary profile, double stained with 10-nm-immunogold-Glut1 and 20-nm-immunogold-labeled GFAP. This capillary is from the more actively spiking region of the resection, and many GFAP-positive fibrils can be seen outside the capillary basal lamina. Note the low Glut1-immunogold density (arrows) throughout the capillary profile, suggesting downregulation of Glut1 glucose transporter activity in all of the endothelial cells that contribute to this profile. Within the capillary lumen, high Glut1 immunoreactivity is seen on the erythrocyte membrane; this serves as a positive control and suggests that the loss of Glut1 from endothelial membranes is a biologically induced phenomenon, and not an artifact of tissue preparation or staining. Scale bar = 0.5 μm. Analyses of Type B (low-reactivity) capillaries: Endothelial cell parameters in the interictal state Values listed are mean ± SD.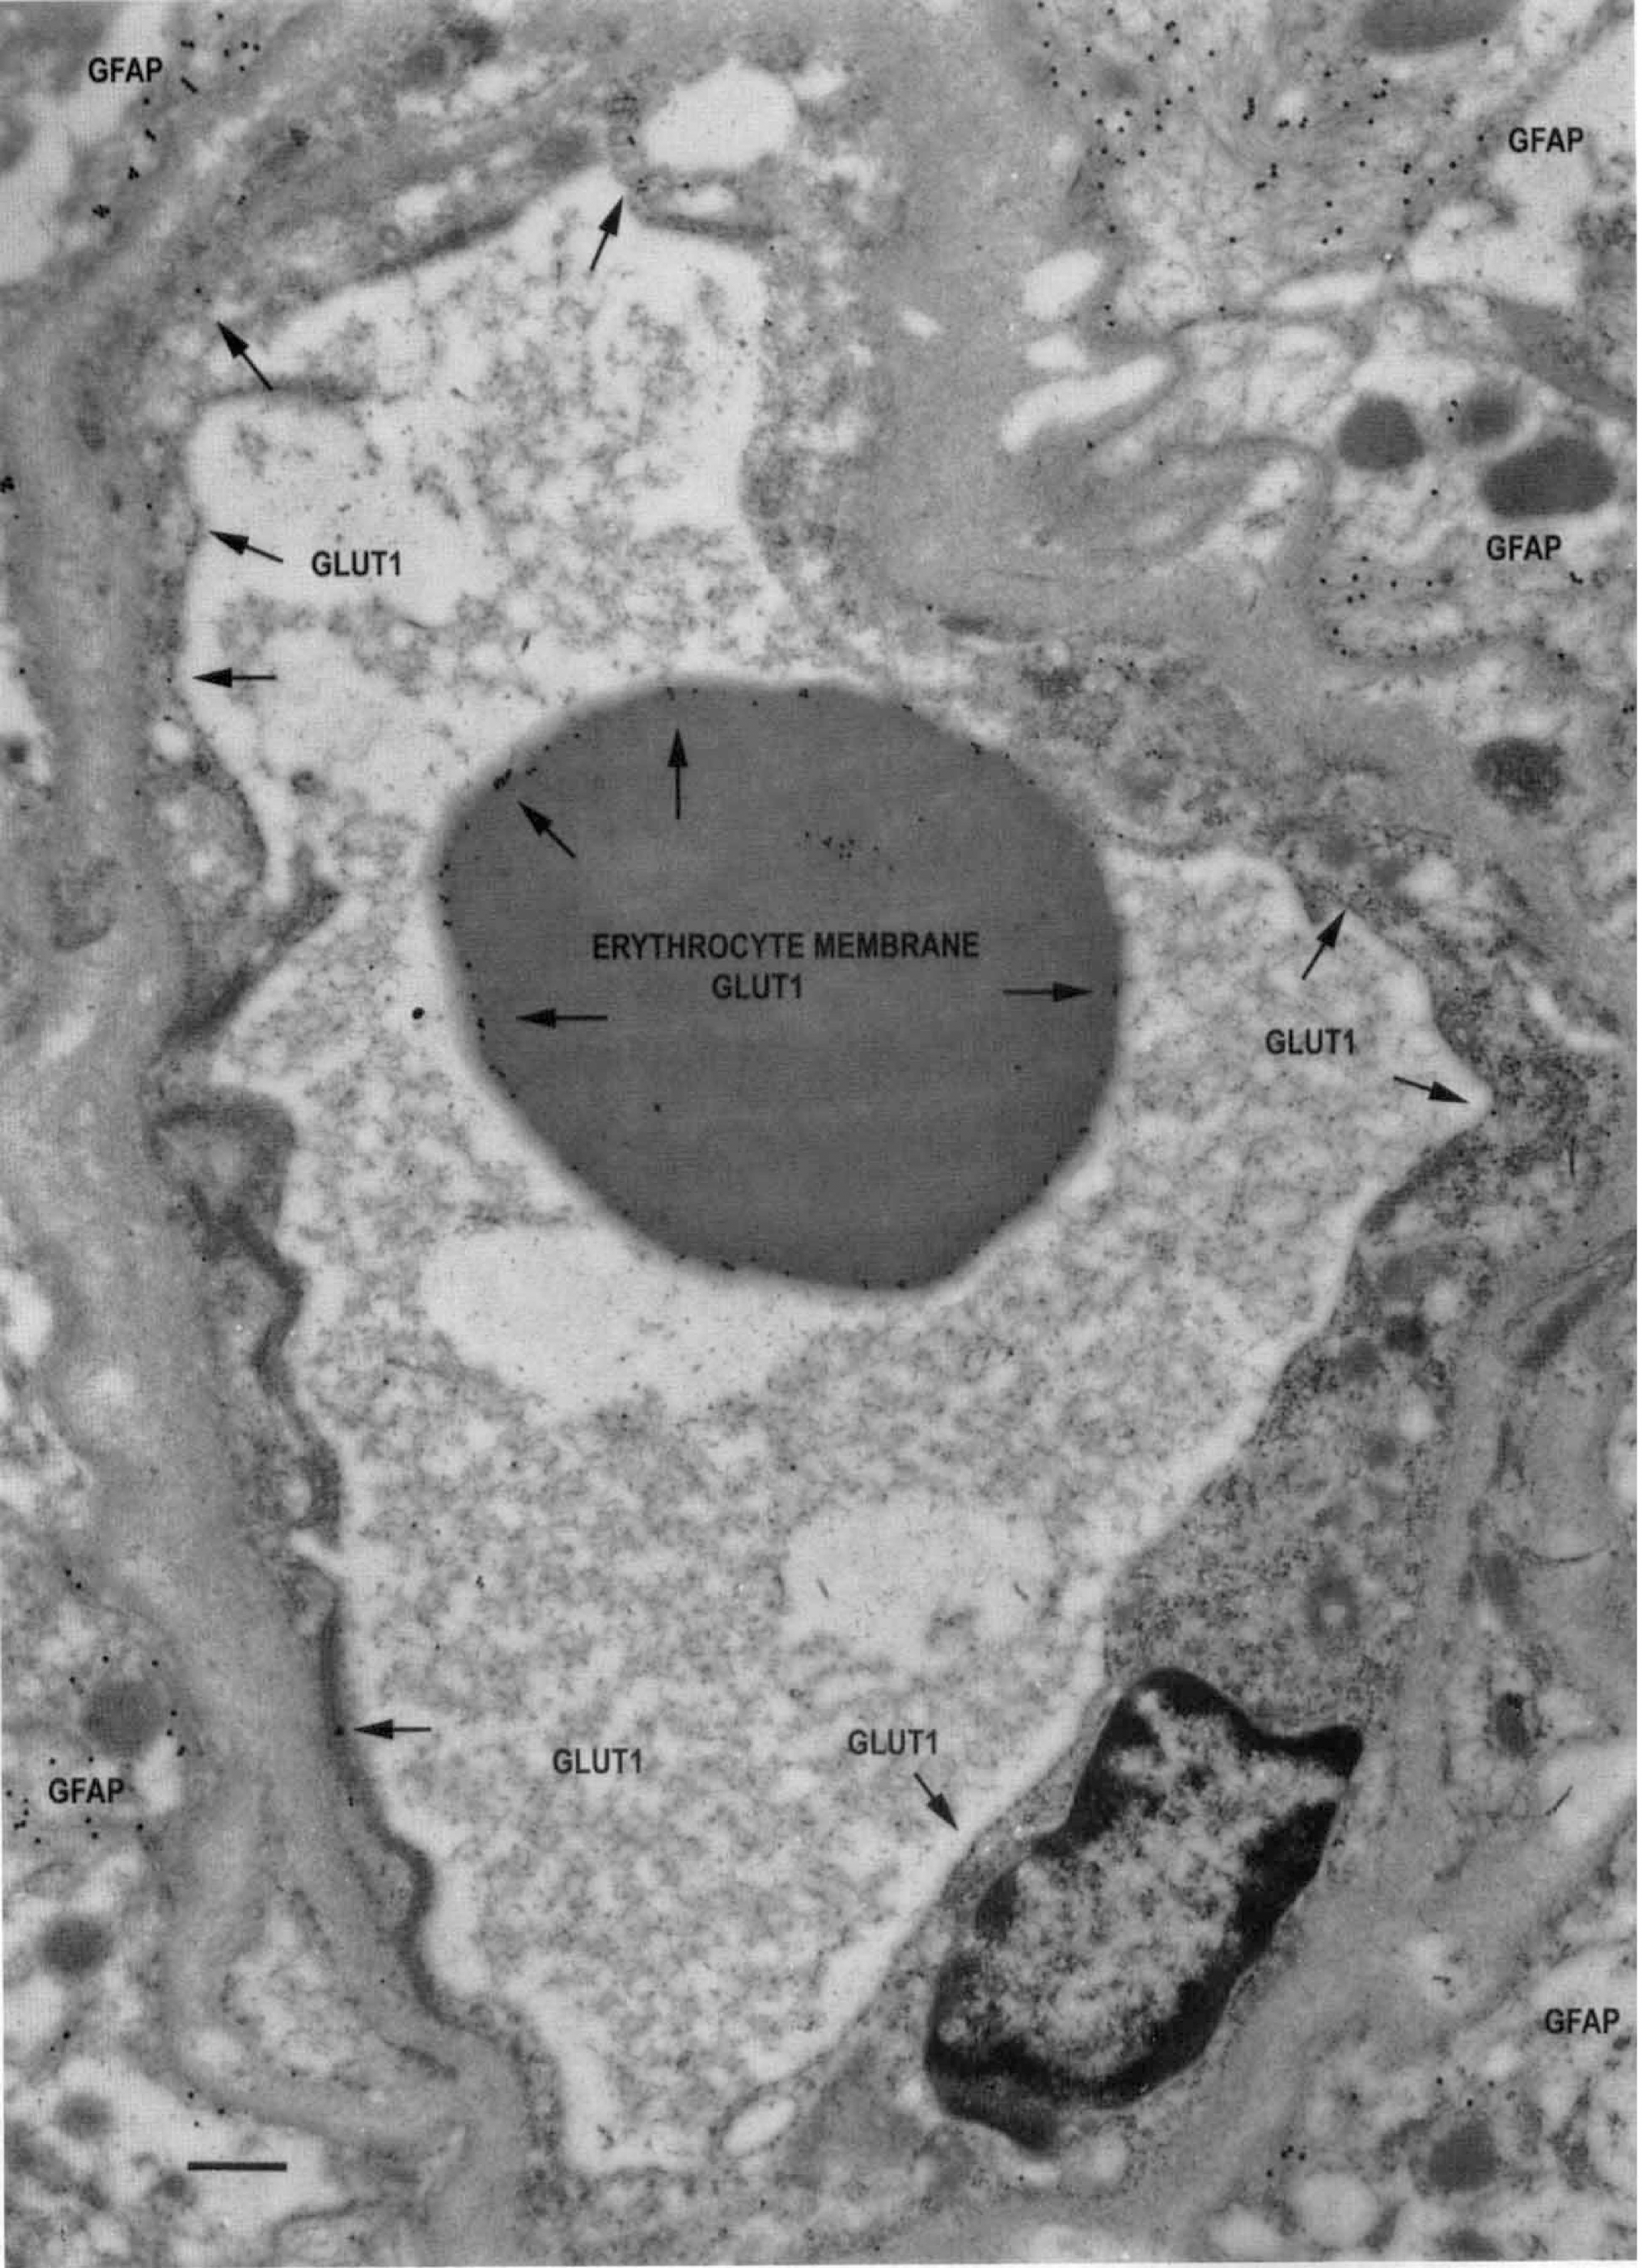
As indicated in Fig. 4, in the five different seizure resections examined, only about one half of the capillary profiles were type A (entirely Glut1 reactive), and 10% to 35% were type B, displaying little Glut1 reactivity. In contrast, previous immunogold examinations of Glut1 reactivity in human brain capillary profiles indicated 88% (in brain injury) to 100% (in hemangioblastoma capillaries) were the uniformly high-reactivity, type A capillary profiles, and no type B profiles were sampled from the tissues examined in the two prior studies (Cornford et al., 1994, 1995).
A comparison of the percentages of the type A, type AB, and type B capillary profiles in the five seizure patients examined in the present study. In each case, tissue samples from the more actively and less actively spiking regions of the resection are compared, but differences are unremarkable. The data indicate only about one half of the capillaries from the epileptogenic lesion are entirely reactive type A, one quarter are mixed reactivity (type AB), and the remainder are type B. We hypothesize that changes in the Glut1 reactivity of subpopulations of capillary profiles represent a mechanism whereby glucose transporter activity is altered in the epileptogenic lesion.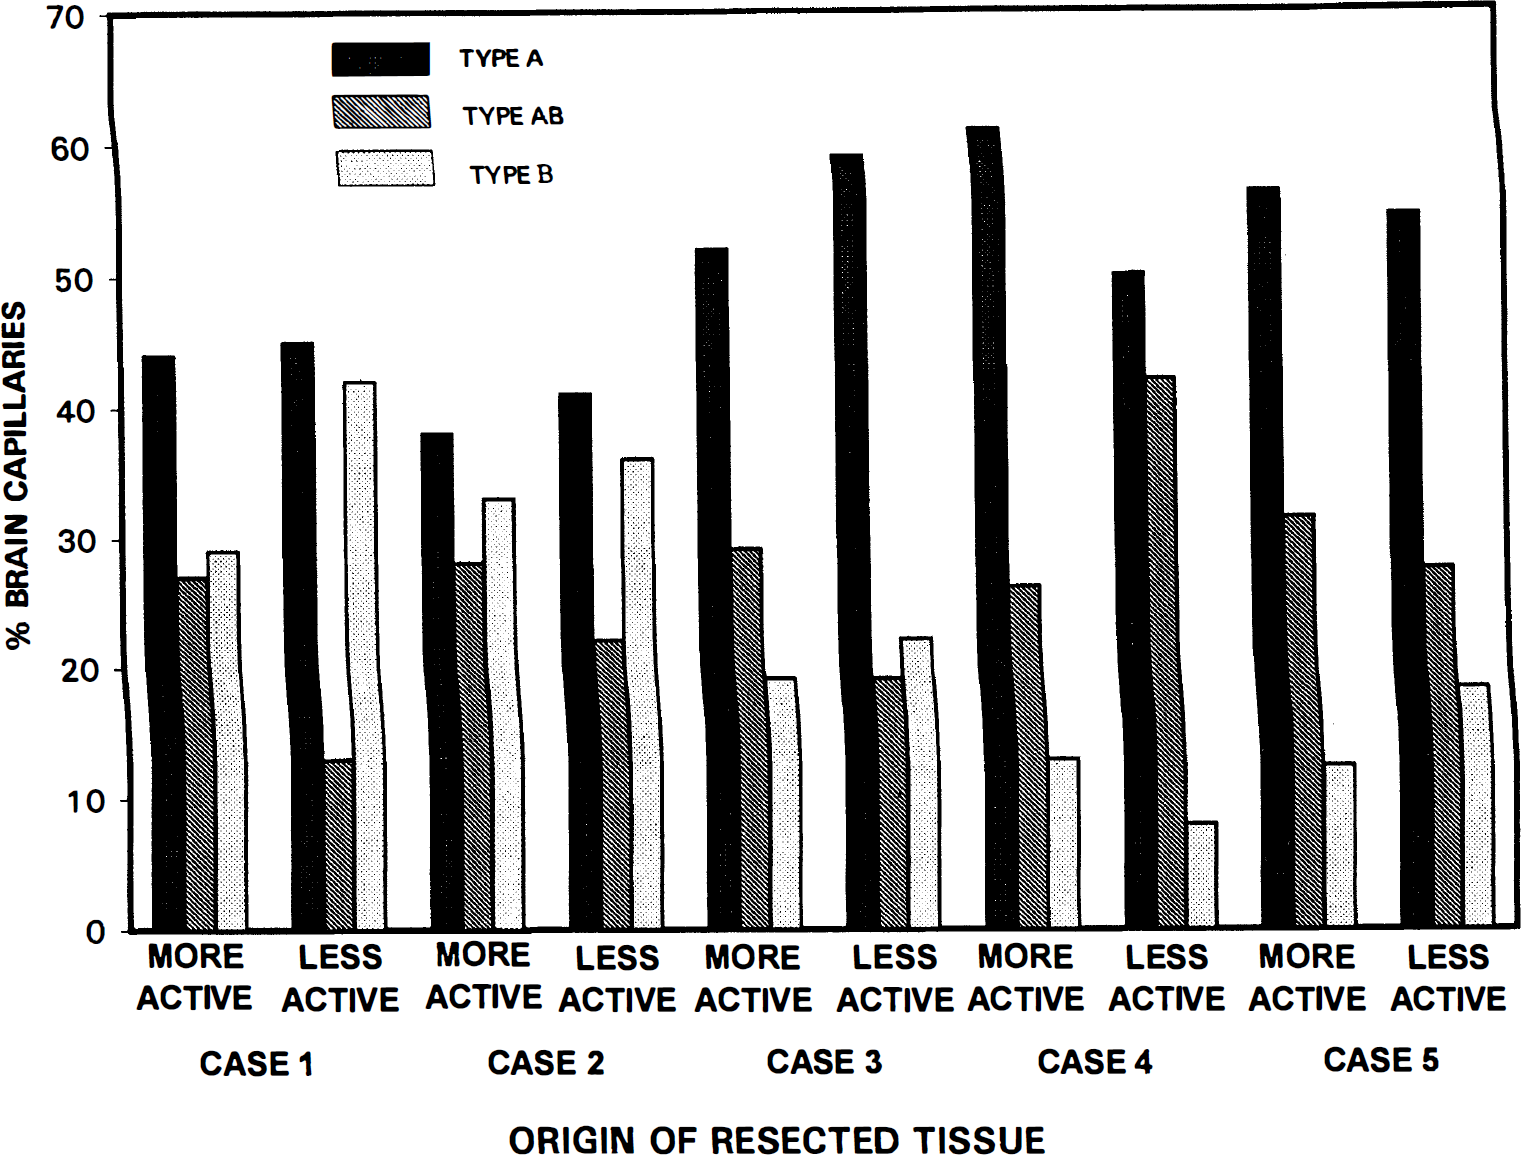
Digital analyses of type A reactive endothelial profiles (Table 1) from the seizure resections quantified the dramatic reduction in Glut1 epitopes characterizing type B-reactive endothelial cells (Table 2). In nominally reactive type B endothelial cells we observed an average of one to three Glut1 epitopes per micrometer of endothelial membrane, whereas 10 to 30 Glut1 epitopes per micrometer of endothelial membrane were seen in (highly reactive) type A endothelial cells (Fig. 5).
Digital analyses of endothelial cells that were either entirely reactive (type A) or nominally reactive (type B), in four of the seizure patients examined. Note the dramatic disparity in Glut1 immunoreactivity typical of these different endothelial cell types. Note also in the nominally reactive type B profiles, there is a trend that abluminal membrane Glut1 density is greater than or equal to that of the luminal membrane. In contrast, in all of the entirely reactive type A capillary profiles luminal membrane Glut1 density is significantly greater than that of the abluminal membrane. Vertical bars = ± 1 SD.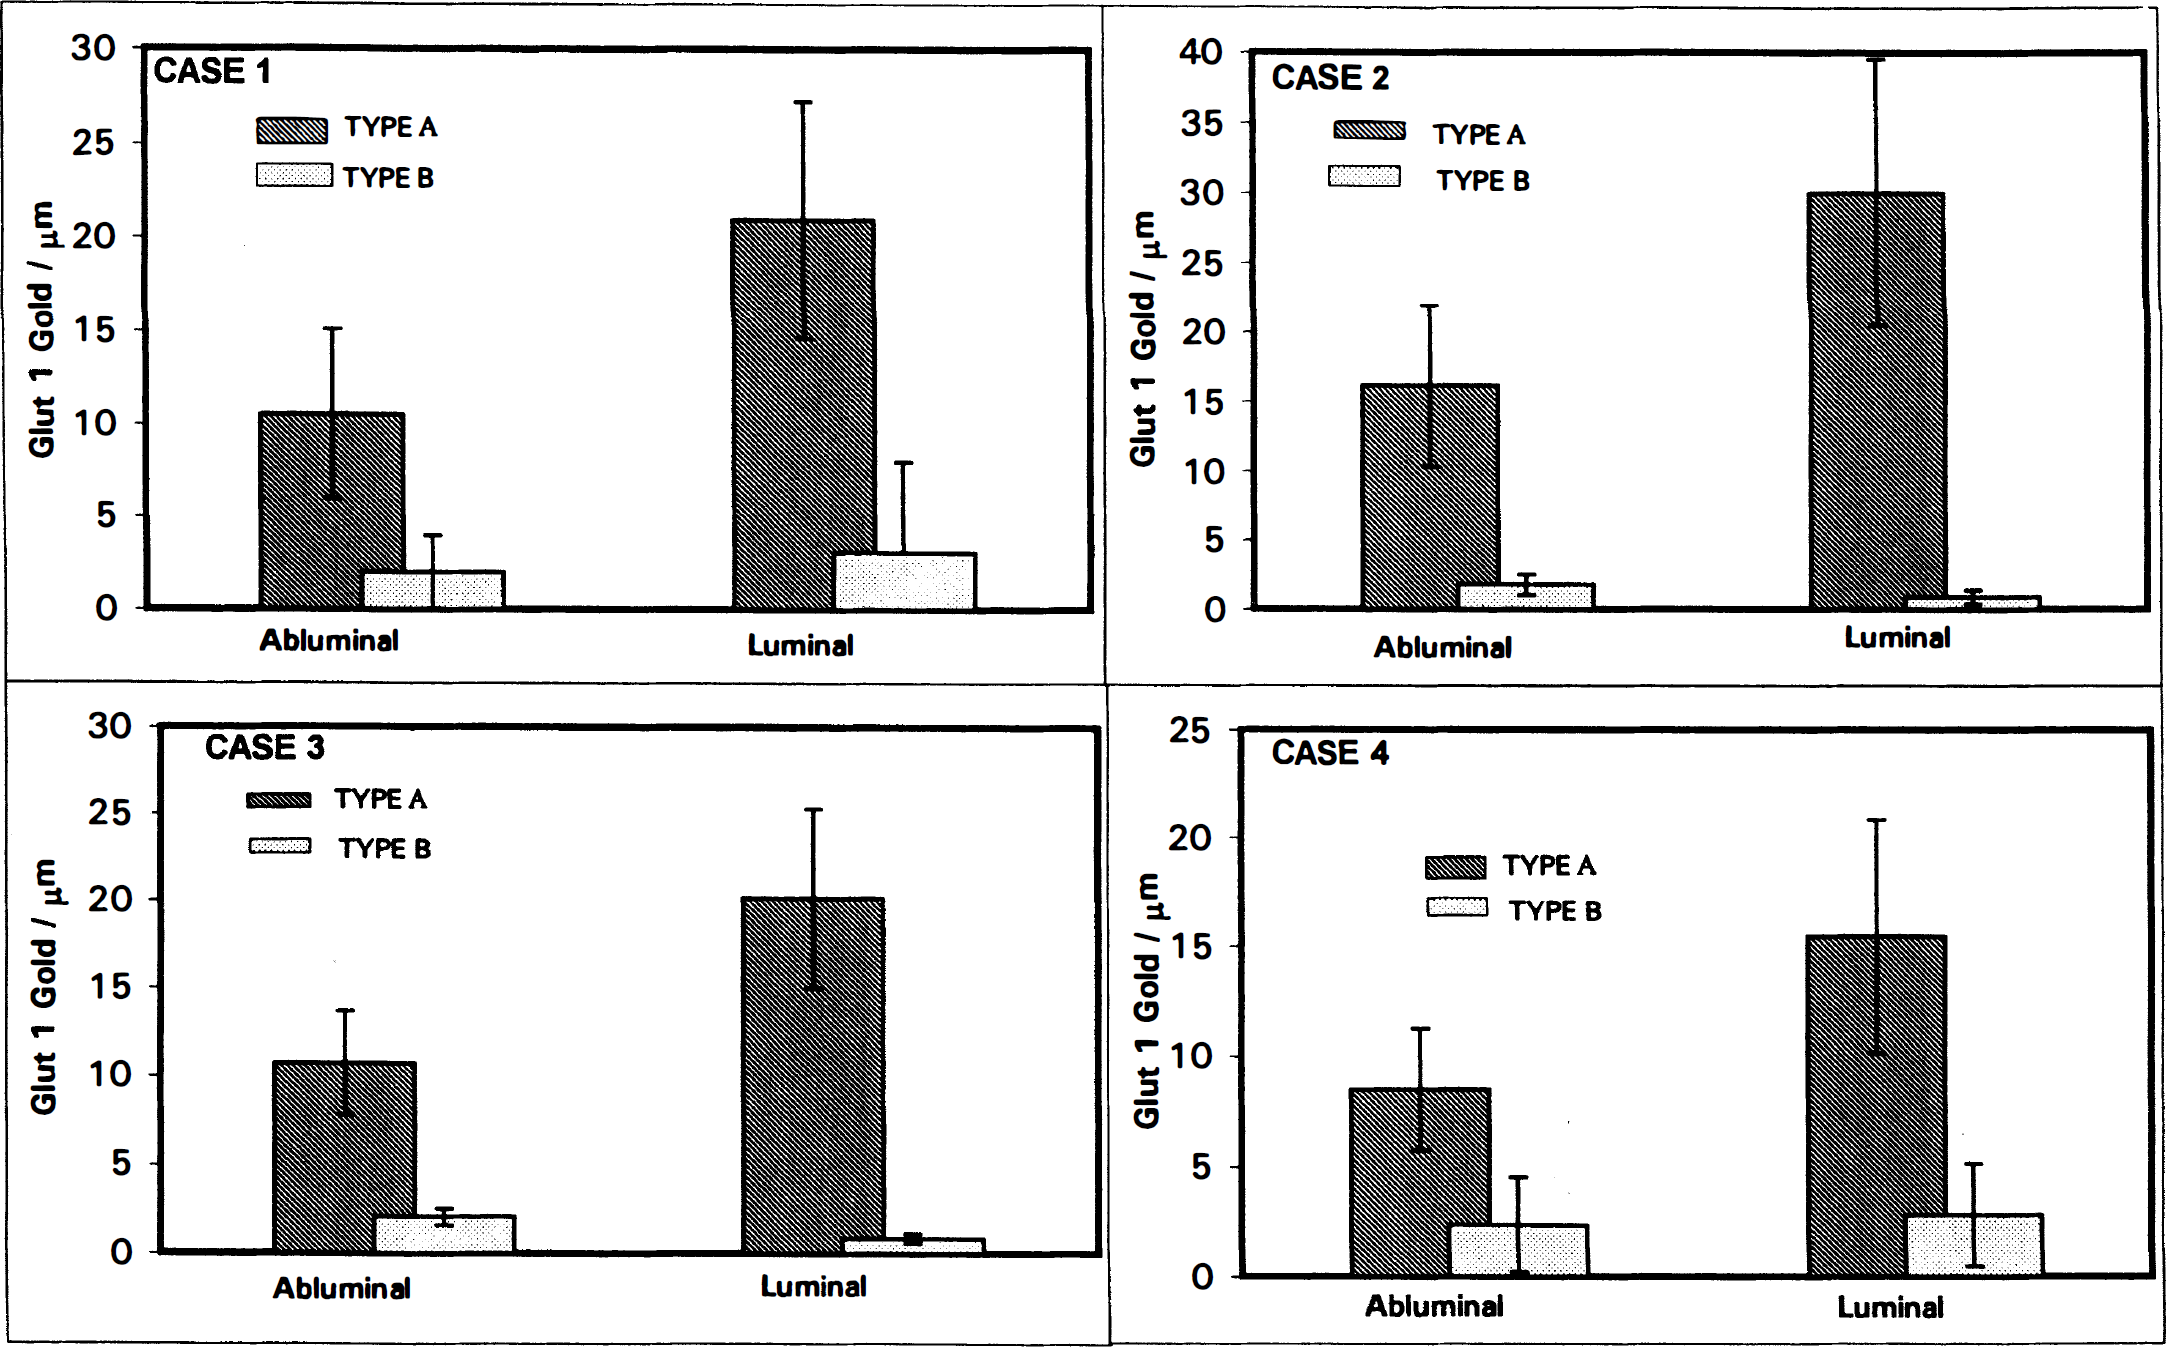
Comparison of Glut1 glucose transporter density and morphometric parameters in capillaries from seizure resections, as compared to brain injury and hemangioblastoma endothelia
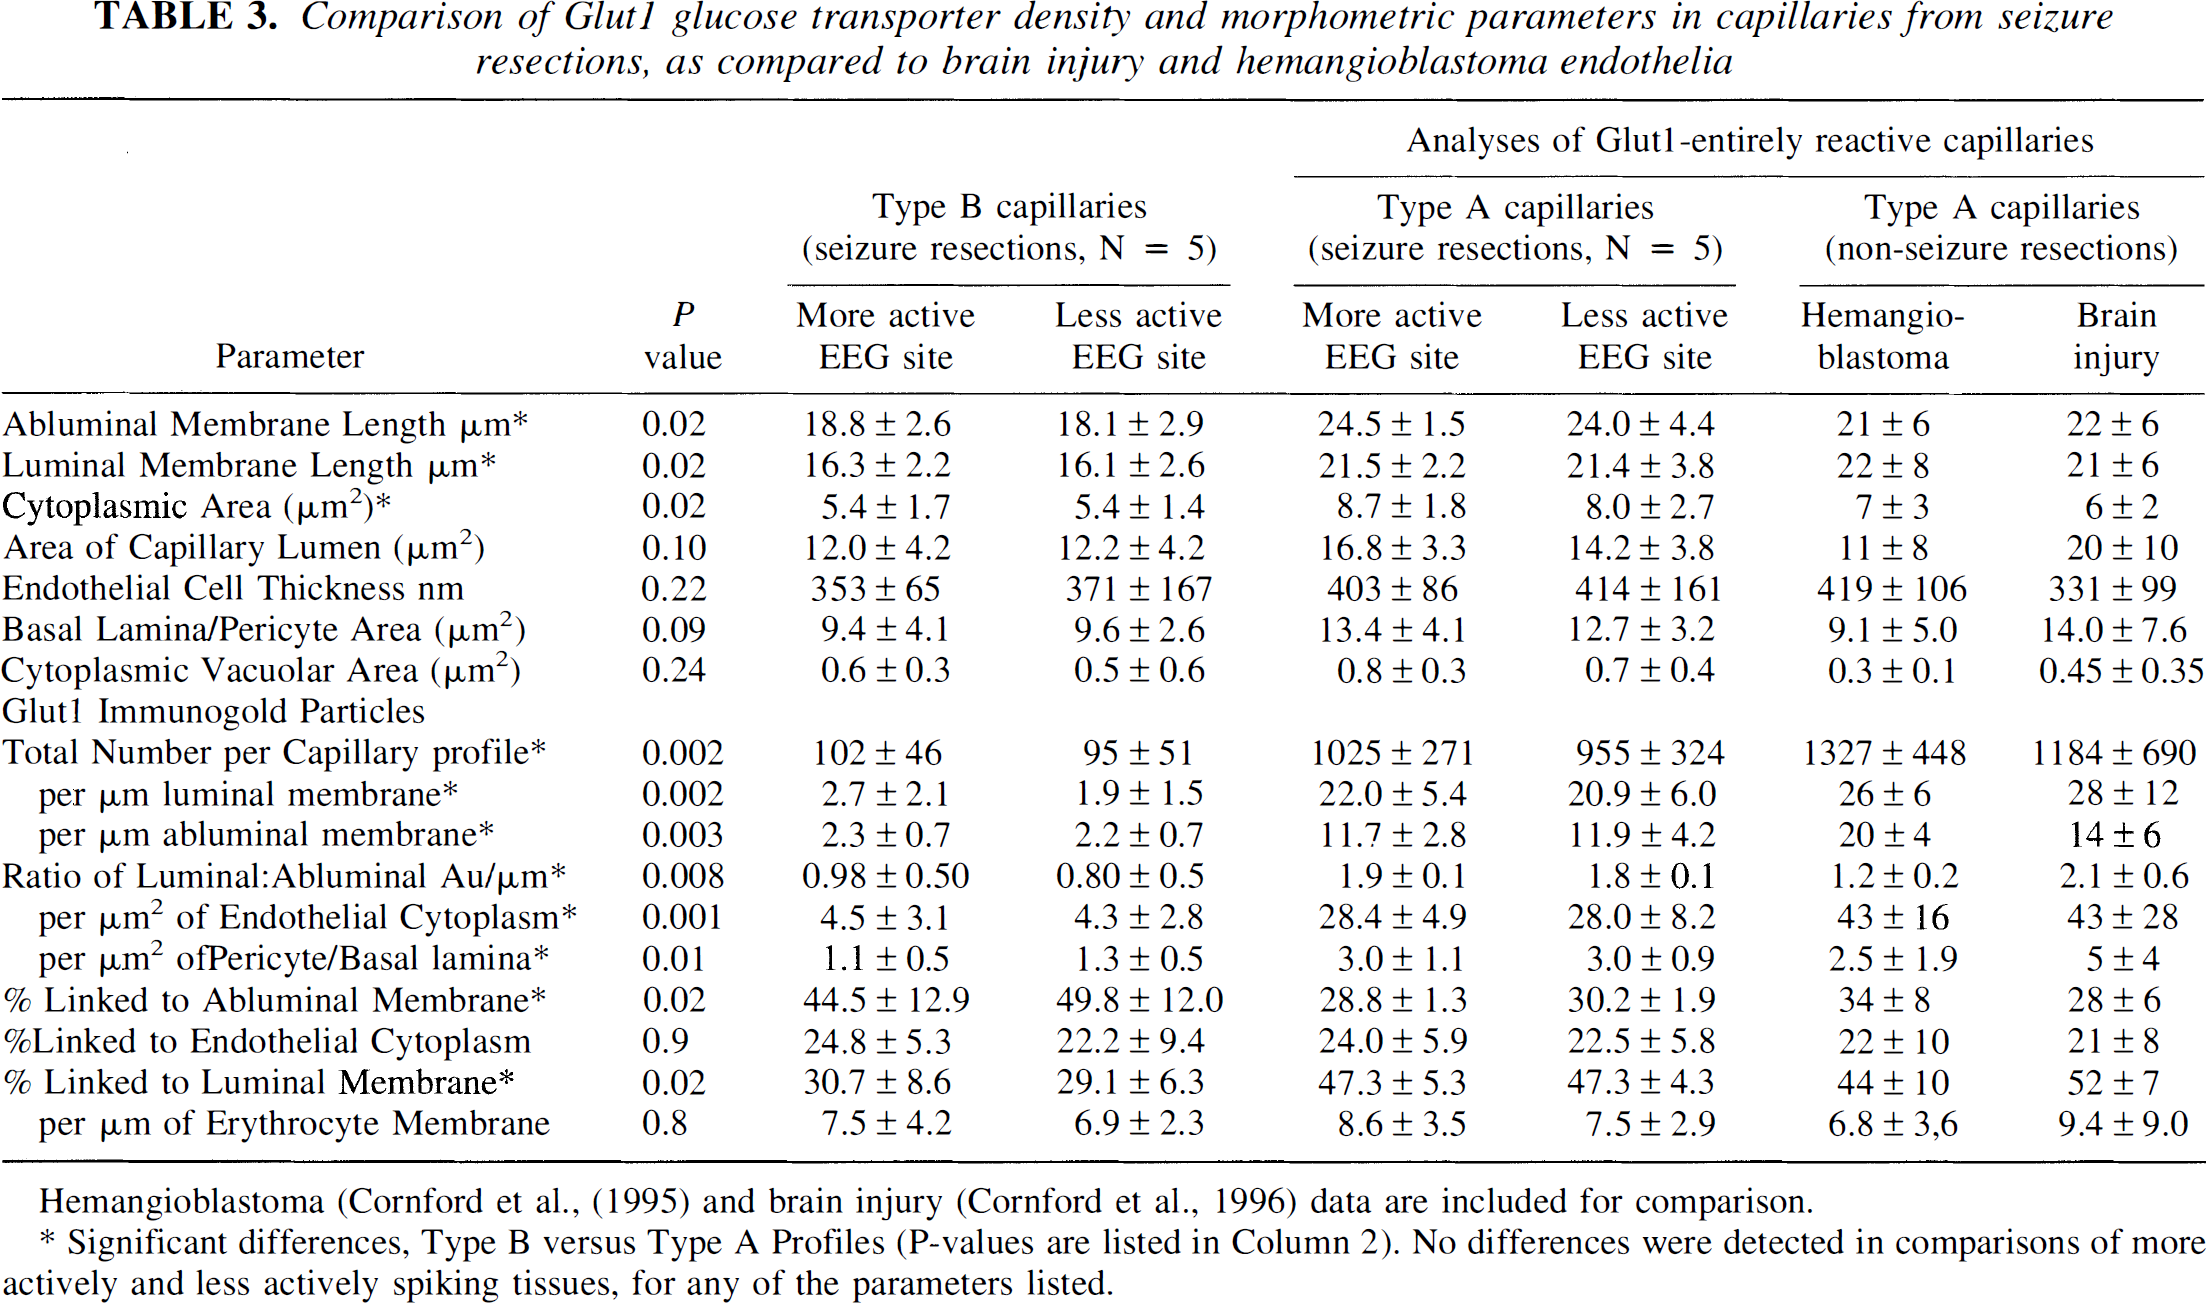
Hemangioblastoma (Cornford et al., (1995) and brain injury (Cornford et al., 1996) data are included for comparison.
Significant differences, Type B versus Type A Profiles (P-values are listed in Column 2). No differences were detected in comparisons of more actively and less actively spiking tissues, for any of the parameters listed.
EEG-based comparisons
Comparisons of the tissue samples taken from the more actively spiking and less actively spiking regions of the resection were undertaken to determine whether there were any detectable seizure-induced differences in capillary types. The percentages of A, AB, and B profiles were similar in samples from the more actively spiking and less actively spiking resected regions (Fig. 5). Digital analyses (Tables 1 and 2) revealed no significant differences in capillary morphology or Glut1 immunoreactivity in comparisons of the electroencephalographically more actively spiking and less actively spiking tissue samples. Mean luminal and abluminal membrane circumferences, cytoplasmic volumes (areas), and vacuolar areas were all larger in the more actively spiking tissues (Table 3). In one patient, both gray and white matter from more and less actively spiking regions were sampled: proportions of type A and type B capillaries were similar (data not shown).
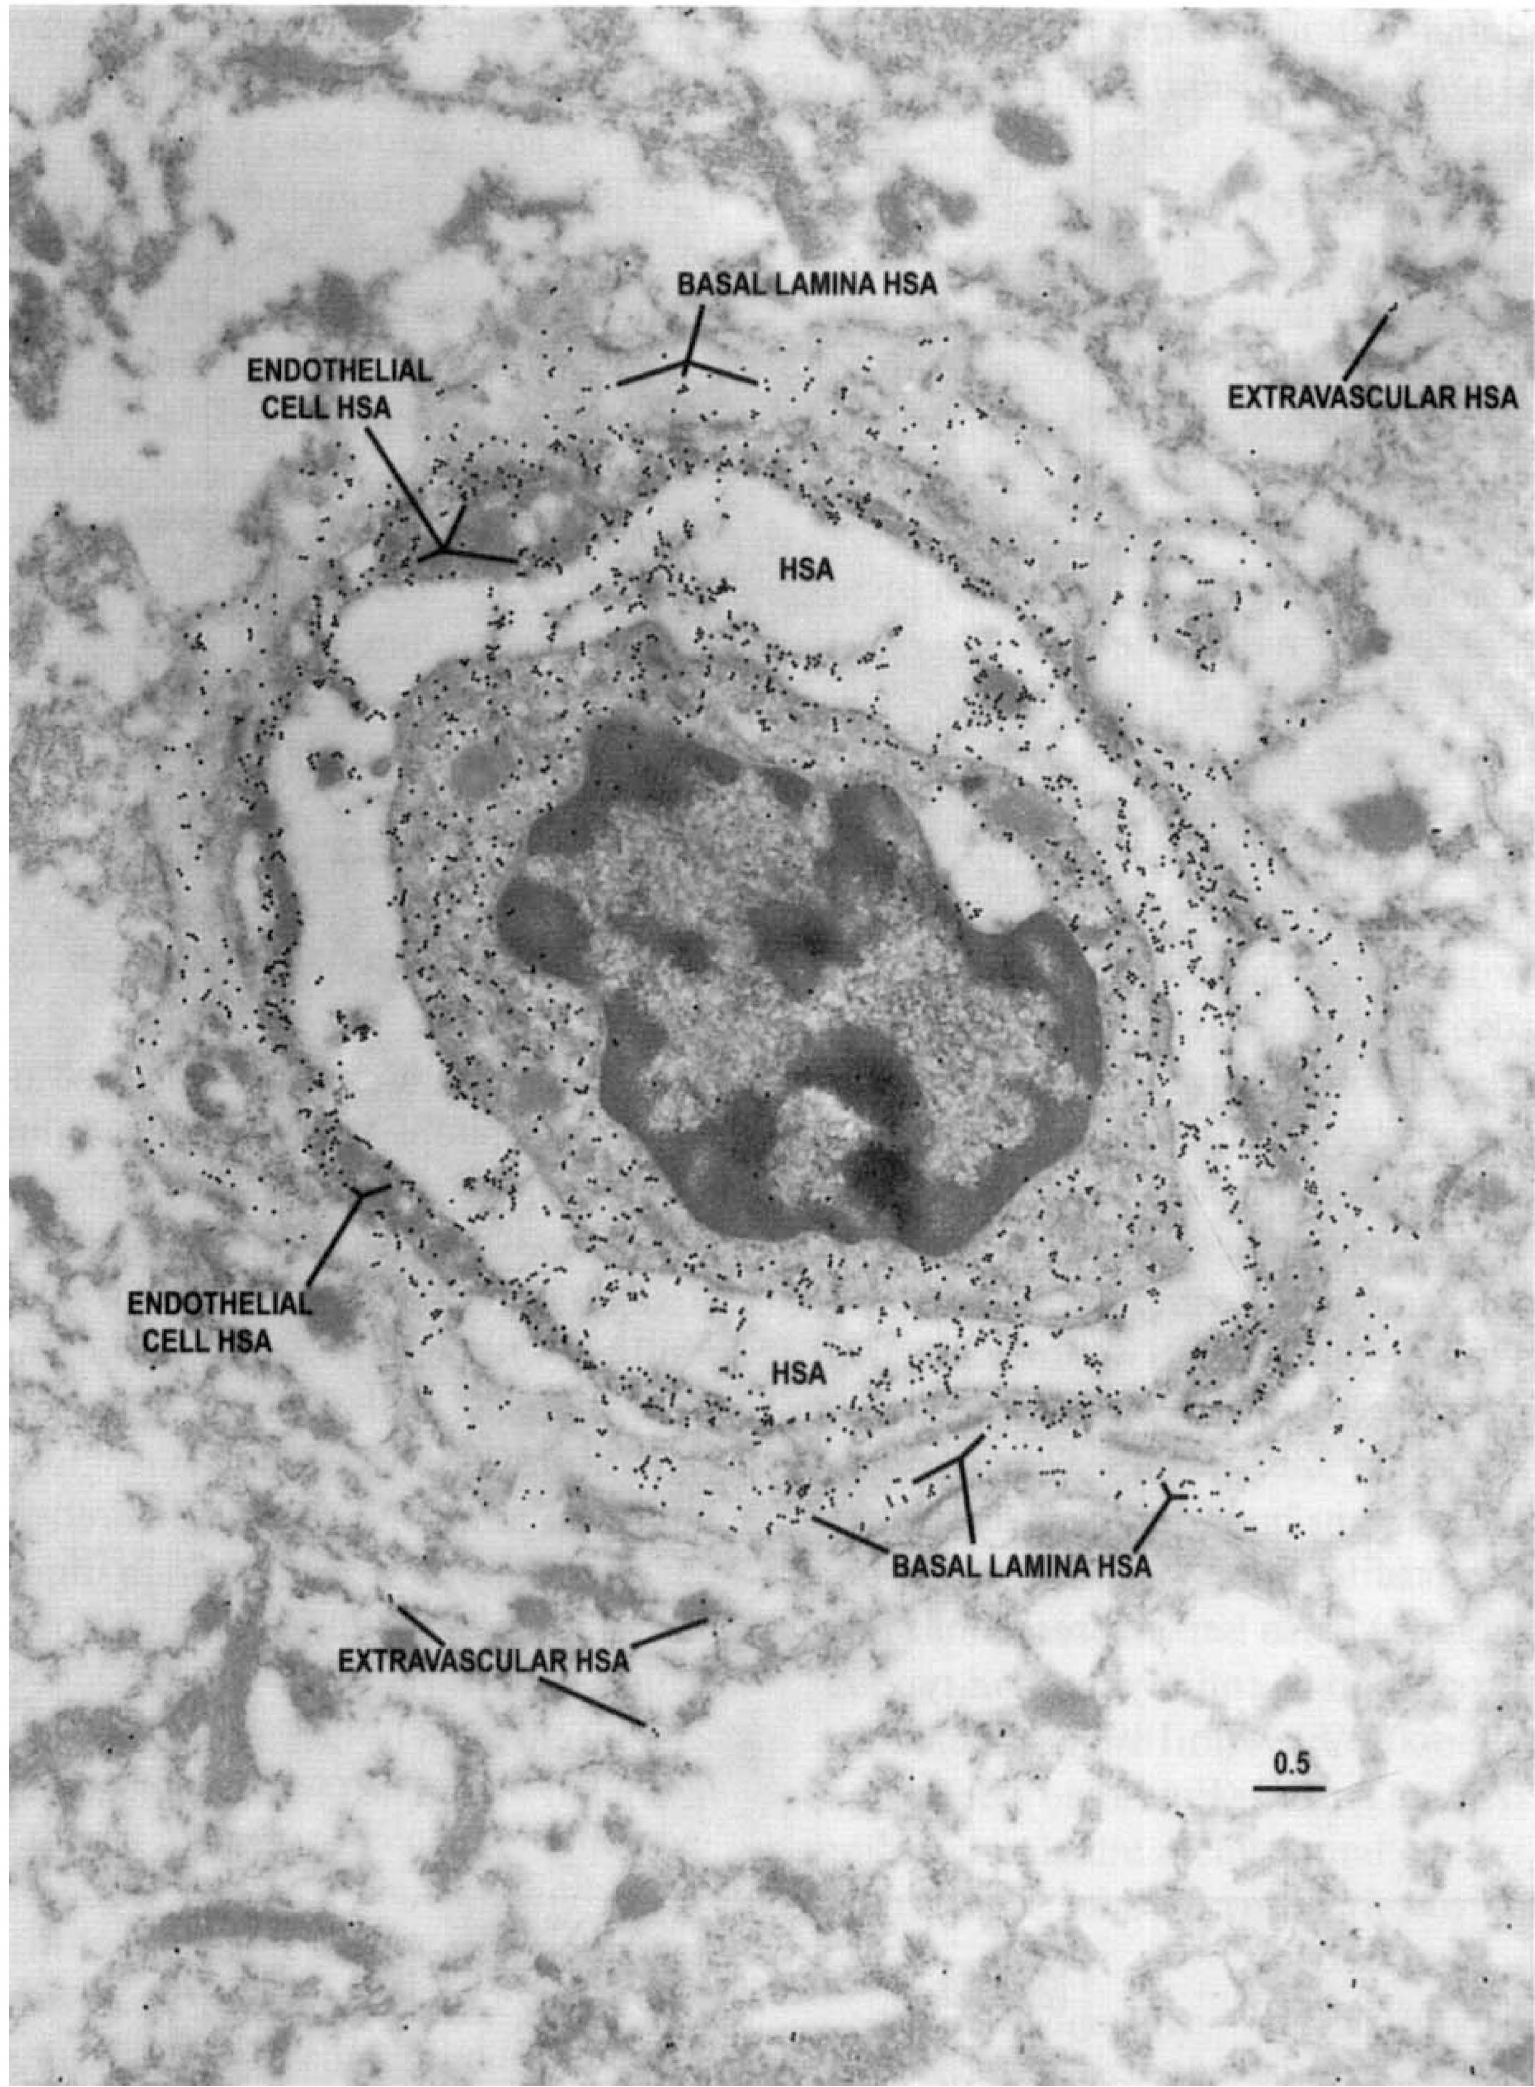
Distributions of HSA epitopes were examined as an indicator of in vivo BBB integrity in the resected tissues. Capillary profiles in which HSA was retained only inside the vascular lumen, with minimal penetration into the extravascular regions (Fig. 6), were presumed to represent the normal condition. When BBB integrity was compromised, the basal lamina appeared to retain some of the immunoreactive HSA in moderate extravasation (Fig. 7). In more severe loss of barrier function, extravasation of HSA into the capillary endothelial cell, basal lamina, and neuropil was observed (Fig. 8). In one resection in which digitally analyzed comparisons of the density of HSA (gold particles per μm2) in the capillary cell, the pericyte–basal lamina, and neuropil were performed, we observed proportionally more extravasation in the more actively spiking regions of the resection than in the less actively spiking areas (Fig. 9). Thus, as anticipated, BBB integrity was compromised to a greater degree in the region characterized from intraoperative EEG as more actively spiking.
Electron microscopic identification of human serum albumin (HSA) epitopes are used here as an indicator of blood–brain barrier integrity in resected tissue. Note that in this capillary profile from the region of the resection judged from intraoperative EEG to be least actively spiking, the majority of the HSA epitopes are localized within the capillary lumen, with only a few epitopes in the capillary and neuropil. Scale bar = 0.5 μm.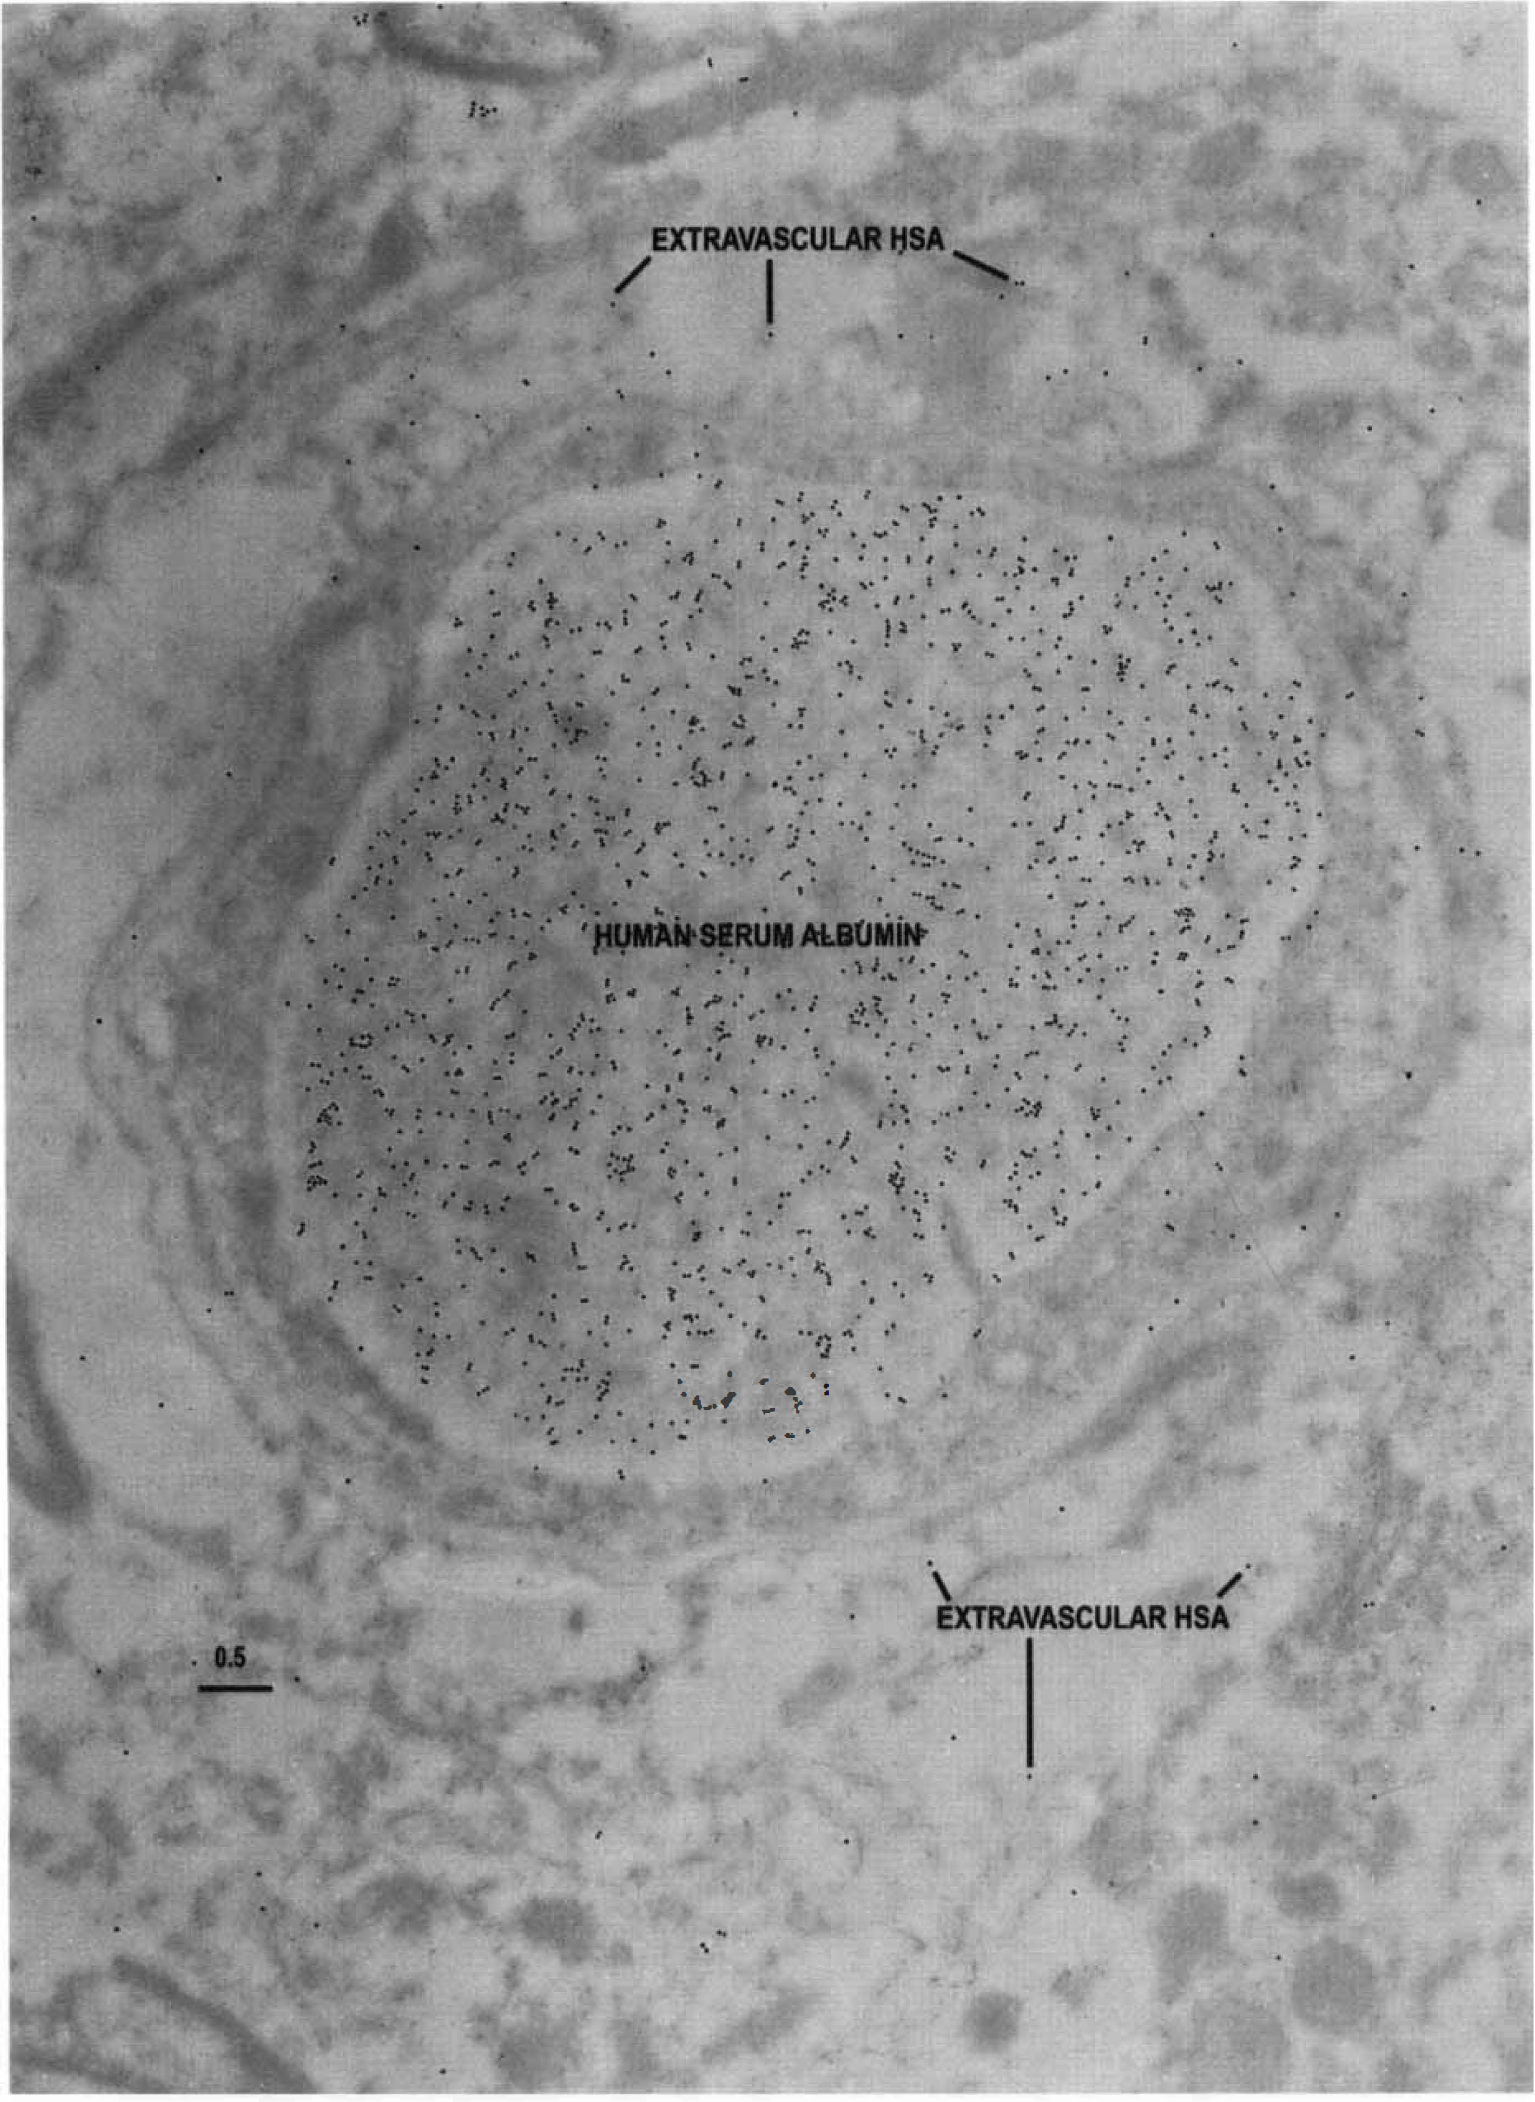
The capillary glucose transporter variability may be analogous to capillary intermittence, which occurs in peripheral tissues, such as muscle, in which proportions of the capillaries are closed during periods of low activity, but open in response to strenuous exertion. Intermittent opening and closing of brain capillaries (capillary recruitment) would be typically measured as changes in permeability–surface area; however, changes in permeability–surface area are attributable to alterations in permeability, and experimental evidence supporting a selective change in surface area is not known for the brain (Pardridge, 1983). It is interesting to speculate that the bimodal transporter distribution could be analogous; glucose, the metabolic substrate, would be restricted instead of blood flow and oxygen supply.
Electron microscopic identification of HSA epitopes in a capillary profile taken from the more actively spiking region as indicated by intraoperative EEG analyses. Note that there is some extravasation of HSA into the neuropil. Also, there are HSA epitopes within the basal lamina, suggesting that extravasation of the albumin may be impeded (perhaps by a sievelike mechanism). Scale bar = 0.5 μm. Electron microscopic identification of HSA epitopes in a capillary profile from the more actively spiking region of the seizure resection. Note the extensive extravasation of HSA into the endothelial cell and pericyte–basal lamina, as well as the surrounding neuropil, suggesting that the barrier function is compromised in this region of the brain. Scale bar = 0.5 μm. Digital analysis of glial fibrillary acidic protein (GFAP) epitopes compared in the less actively spiking and more actively spiking regions of a seizure resection. Note the greater abundance of GFAP epitopes within the neuropil of the more actively spiking region, consistent with the expectation of increased gliosis in the more pathologically affected site. Vertical bars = ± 1 SD.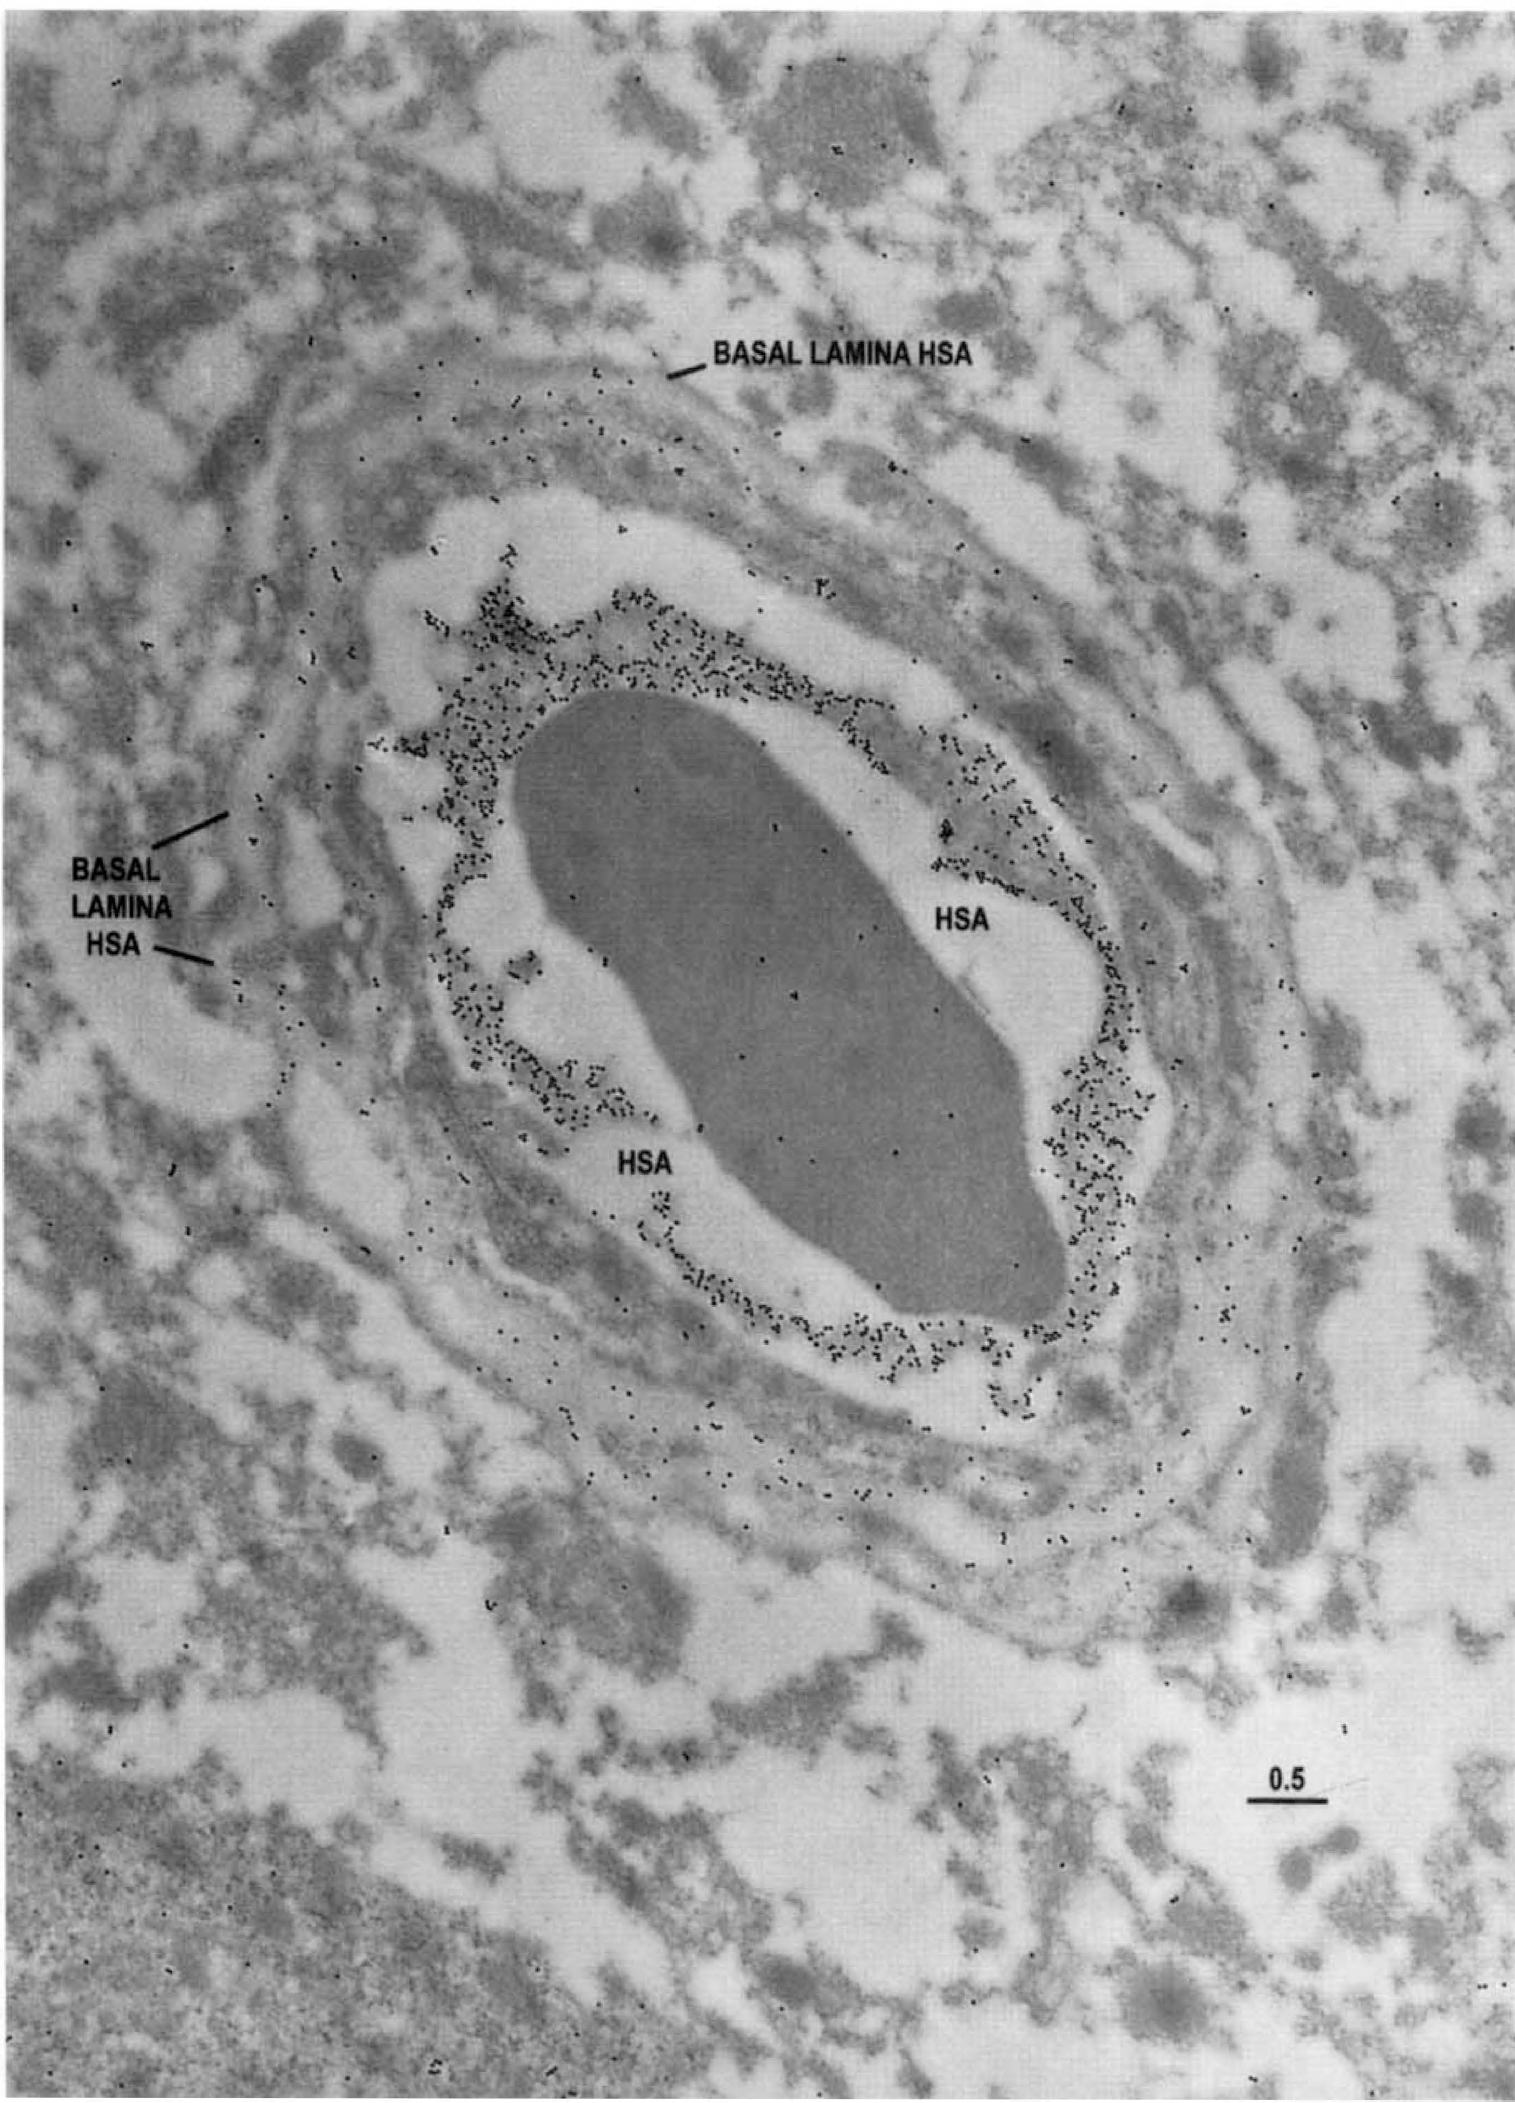
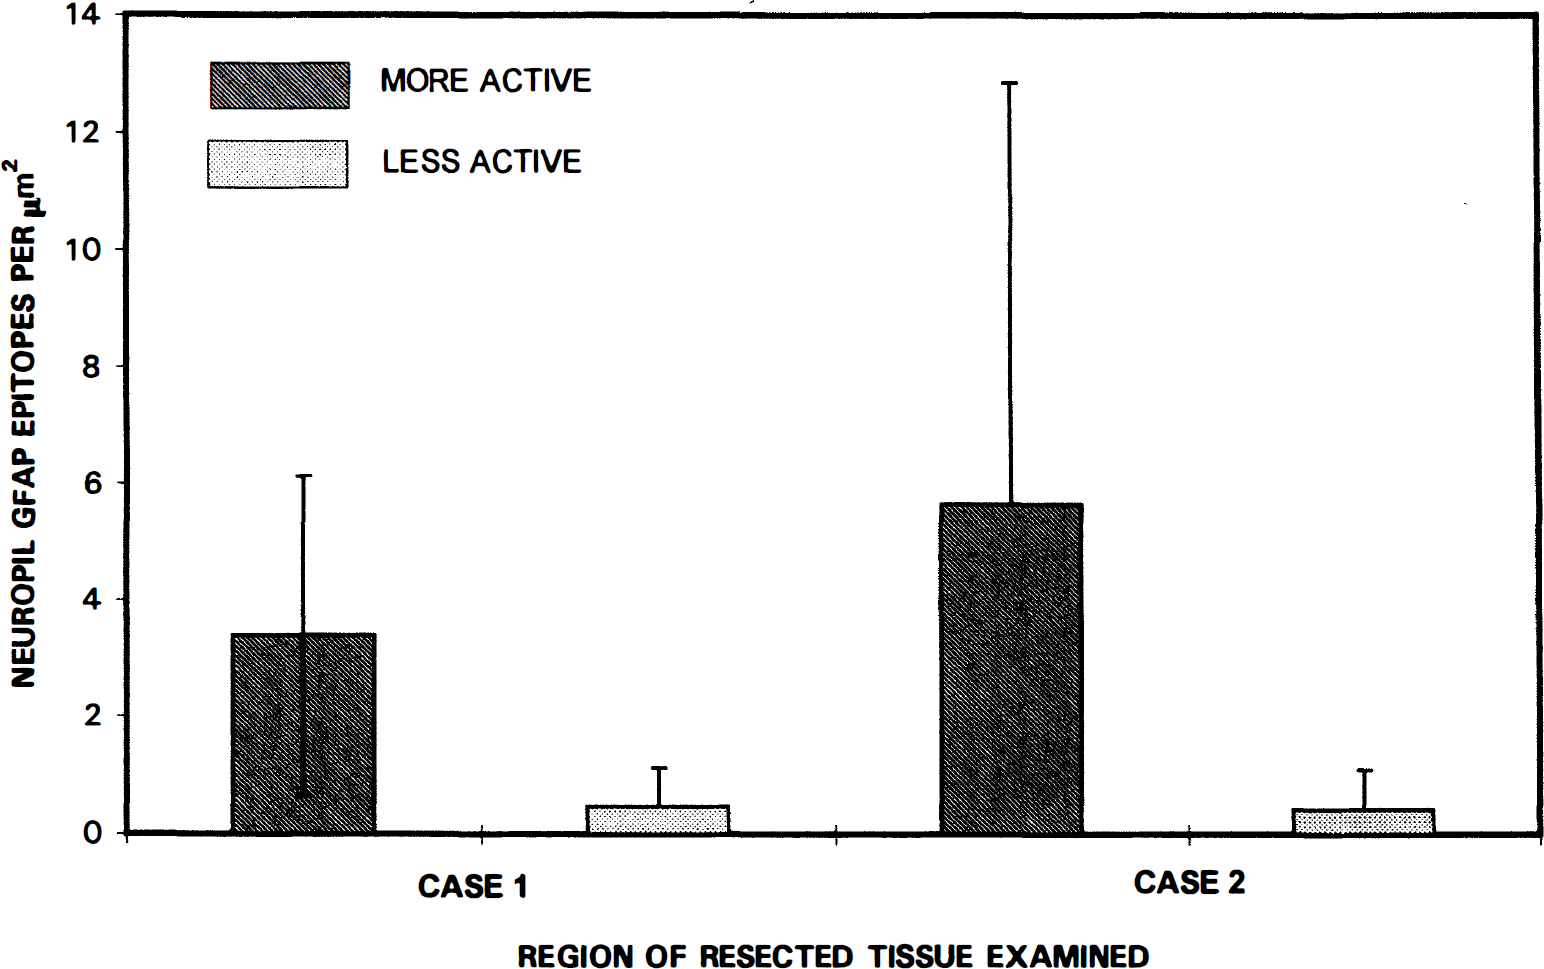
Analyses of GFAP density in the neuropil surrounding the capillaries provided an index of the relative degree of gliosis. Figure 10 shows that in two digitally quantified specimens, GFAP-immunogold densities were higher in the neuropil from the more actively spiking regions of the resections than in the less actively spiking areas.
Digital analyses of HSA epitopes and their extravasation from the capillary lumen into the endothelial cell, pericyte–basement membrane, and neuropil compared in more actively spiking and less actively spiking regions of the resected tissue. Note that greater HSA extravasation is observed in the more actively spiking region, consistent with the expectation that barrier integrity is compromised to a greater degree in the more actively spiking regions. Horizontal bars = ± 1 SD.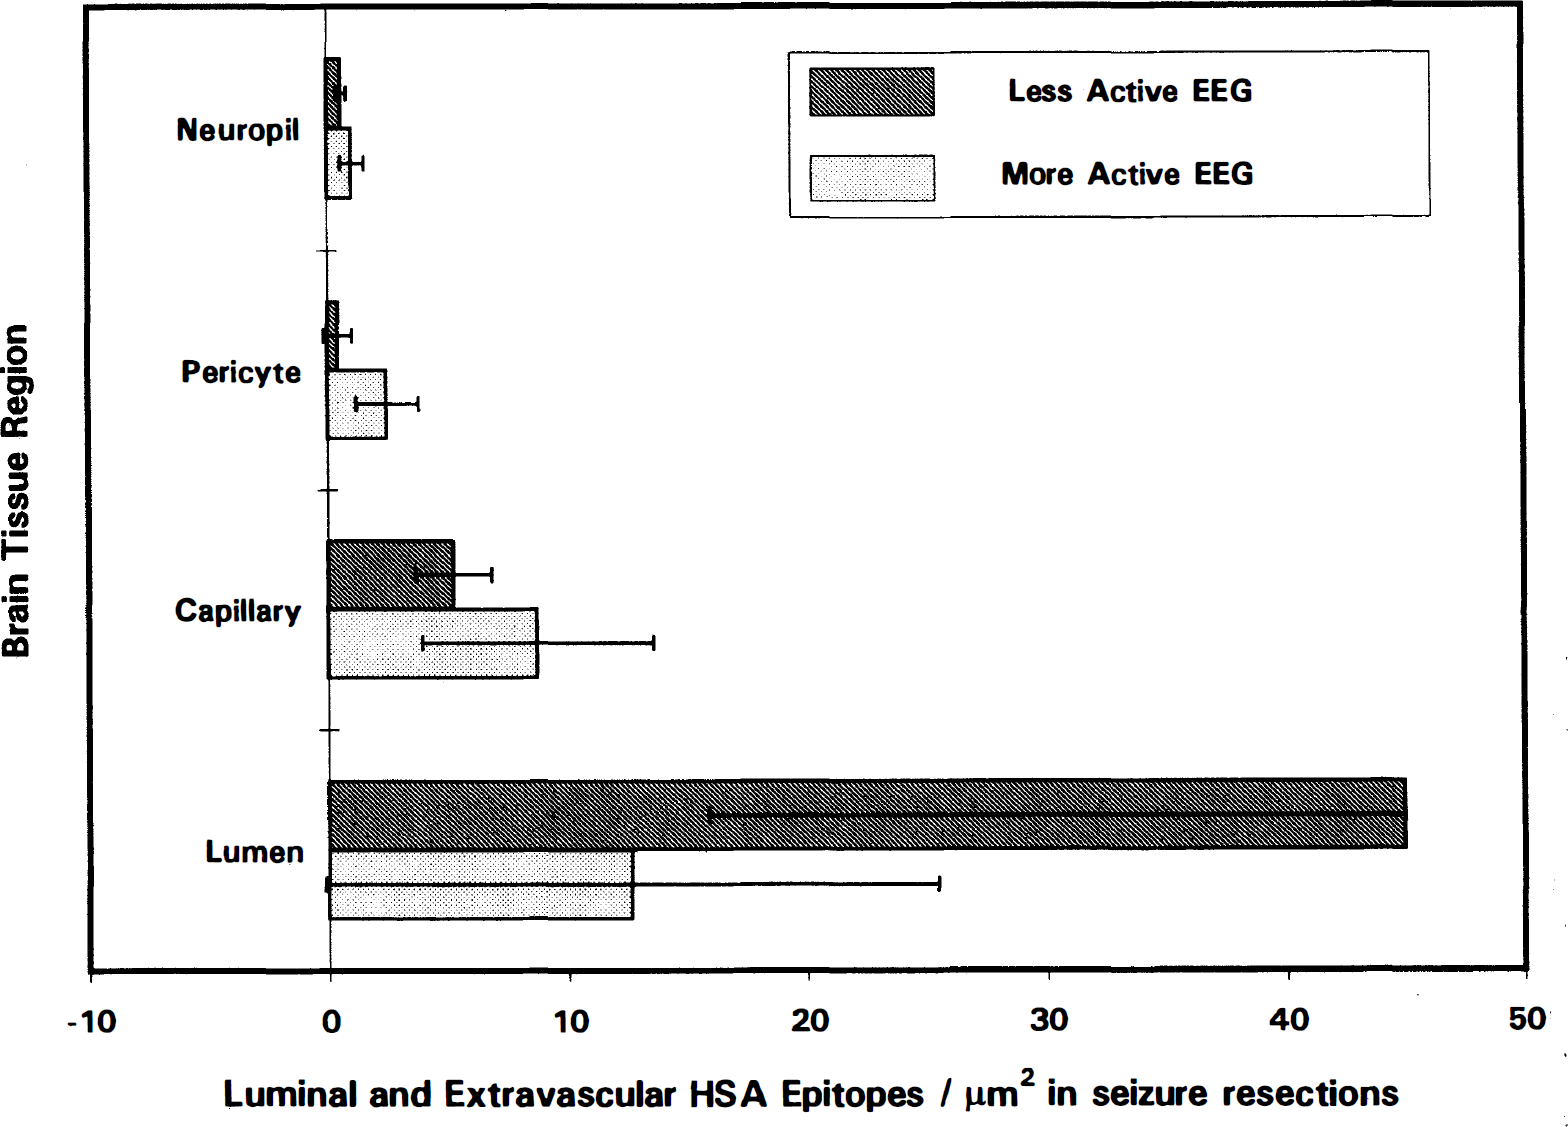
DISCUSSION
Glut1 glucose transporter activity in normal brain
It is noteworthy that lower total capillary Glut1 and the lowest number of cytoplasmic and membrane-associated Glut1 epitopes were seen in case 4, and the highest in case 2. Because these tissues came from the inferior frontal lobe, and other tissues were from the temporal lobes, it seems possible that regional differences in capillary Glut1 density may be found in thehuman brain. There has been no measurement of Glut1 immunogold density in normal human brain capillaries; postmortem or routine formalin-fixed surgical pathology tissue is not satisfactory for immunogold analyses, and although surgical resections would be most informative, normal brain tissue is not available. One line of evidence from cytochalasin B–binding studies suggests that the type B endothelial cells (Fig. 3) represent the normal condition. Such a conclusion is supported by the following three observations. (1) The density of immunogold seen on these human BBB membranes (one to two gold particles per micrometer of membrane) is similar to that seen in the normal rat (Farrell and Pardridge, 1991) and normal rabbit (Cornford et al., 1993) brain capillaries. (2) Cytochalasin B–binding studies of isolated brain microvessels indicate that glucose transporter density is similar (60 to 110 pmol/mg protein) in the rat (Dick et al., 1984), rabbit (Dwyer and Pardridge, 1993), and human (Dick and Harik, 1986) BBB. (3) Cytochalasin B–binding studies suggest glucose transporter density is 10-fold greater in human erythrocytes (Sogin and Hinkle, 1980) than in human BBB microvessels (Dick and Harik, 1986). In the present study the density of Glut1 transporter epitopes on erythrocyte membranes is three- to fivefold greater than on the luminal and abluminal membranes of type B capillaries (Table 3), approximating the expected “normal” distribution, but it is two- to threefold less than on the type A capillaries; therefore, there is a comparative 10-fold increase in BBB Glut1 transporter on type A capillaries over “normal type B capillaries” within the seizure focus.
Other observations, however, suggest that the type B nominally reactive endothelial cells (Fig. 3) represent a downregulated state of human Glut1 glucose transporter activity in the BBB. For example, the epileptogenic focus in 70% to 80% of complex partial seizure patients is coincidentally identified interictally as a zone of hypometabolism in fluorodeoxyglucose positron emission tomographic studies (Theodore et al., 1983; Abou-Khalil et al., 1987); consequently, elevated glucose transporter activity, especially approximately 10-fold increases, would be somewhat paradoxical in temporal lobe epilepsy resections.
Averaged from samples from the more actively and less actively spiking regions in the five cases examined, 50% ± 7% of the total capillary profiles are comprised wholly of type A endothelia, 26% ± 8% are type AB, and 23% ± 11% are type B (Fig. 4); in all five patients this pattern was similar. If Glut1 density in type A endothelia are representative of the normal glucose transport and metabolic rate (designated as 100%), then profiles made of type B endothelia would represent 10% of the normal rate based on luminal membrane Glut1 density, or a 90% reduction. Thus averaged over the epileptogenic focus, and based on the relative frequencies of type B endothelia in AB profiles (26%) and B profiles (23%), the predicted reduction in metabolic rate would be approximately 30%. This value is not inconsistent with an observed 26% ± 10% reduction in glucose utilization rates in the anatomic lesion (in localization-related epilepsy), as compared with the homologous contralateral brain region.
In brain injury, light microscope Glut1 immunocytochemistry on formalin-fixed, paraffin-embedded tissue from surgical debridement shows capillary profiles of alternating high and low reactivity, surrounding areas of red blood cell extravasation. The capillaries that correspond to highly reactive type A endothelial cells in electron microscopic study appear as Glut1-positive capillaries with immunocytochemistry, whereas Glut1-negative microvessels are composed of apparently type B endothelial cells (Cornford et al., 1996). Also, in tumors such as glioblastoma multiforme (GBM), there is a loss of immunoreactive Glut1 transporter (Guerin et al., 1990; Harik and Roessmann 1991; Nagamatsu et al., 1993), and immunocytochemistry indicates up to 80% of the capillary Glut1 is lost (Guerin et al., 1992). It would be interesting to determine whether, in GBM cases, the predominant type of capillary profile is of low Glut1 reactivity, or type B.
Bimodal capillary Glut1 density
The present study confirms that in the human brain two configurations of endothelial cells, exhibiting dramatically different Glut1 glucose transporter densities, may characterize certain disease conditions. This bimodal Glut1 distribution is seen interictally, in the epileptogenic focus of patients with complex partial seizures (Figs. 1–3). Although a slightly different bimodal Glut1 distribution has been observed in the retinal vasculature of the diabetic eye (Kumagai et al., 1996), the same two configurations of Glut1-reactive endothelia have been reported in debrided fragments from human brain injury (Cornford et al., 1996). Thus, the appearance of two endothelial cell configurations may represent a response pathway common to different forms of brain insult. Recent studies also provide evidence that the Glut1 glucose transporter belongs to the glucose-regulated protein family of stress-inducible proteins (Wertheimer et al., 1991), so it is not unexpected that pathophysiologic modulations in BBB Glut1 activity are seen. The unexplained (at present) aspect of this observation focuses on why two adjacent and contiguous endothelial cells, presumably exposed to the same stresses and signal transduction inputs, should exhibit divergent (mosaic) expression of the Glut1 protein.
With respect to BBB capillary biology, it is noteworthy that the observed functional changes in capillaries, as suggested by the Glut1 densities of type A and type B endothelia, are accompanied by concomitant changes in capillary morphology (Table 3). Type A capillaries are significantly larger and more robust than the low-Glut1-reactive type B vessels, an observation that is not inconsistent with a previous report that proposed that changes in capillary circumference and cross-sectional areas occurred in temporal lobe epilepsy brain microvasculature (Liwnicz et al., 1990). Digital analyses of capillaries (averaged for the five patients examined) surprisingly indicated that morphometric factors (luminal and abluminal membrane circumferences and cytoplasmic areas) were increased in type A endothelia as compared with type B capillaries. Type A capillaries would seem to be more important in transport phenomena, and perhaps are subjected to greater pressures, more stretching, and greater stress than the smaller type B endothelia. In addition, our brain sampling was assisted with intraoperative electroencephalography to identify the most abnormal and least abnormal tissues resected. No differences in the distribution of type A and type B endothelial cells, nor their respective morphometric variables, were seen in regions characterized by a greater or lesser temporal spiking activity. Consequently, we presume that the two configurations of Glut1 distribution observed characterize the entire epileptogenic resection. This is consistent with fluorodeoxyglucose positron emission tomographic findings, which show that areas of altered metabolism in focal epilepsies include and extend beyond the anatomic lesion. (Because no en bloc temporal lobe resections were performed in this study, no near-normal surround tissue was examined.)
Significance of the two different Glut1-distribution-related capillary configurations
The observation of bimodal Glut1 densities has significant implications for brain function, suggesting that some cylindrical pericapillary brain tissue regions in the human temporal lobe are supplied with approximately 10-fold more glucose than pericapillary brain tissues in an immediately adjacent region. Thus partial volumes of brain tissue, on the order of a few cubic micrometers in size, apparently have vastly different glucose supply in these stress conditions. The use of lumped constants in estimating CMRglucose with hexose analogs, assumes that brain glucose is uniformly distributed in intra- and extracellular spaces in the brain (Pardridge, 1983), an assumption that is in apparent conflict with the demonstration of CNS type A and type B capillary profiles. Because the evidence for regions of altered partial volumes of brain glucose has been observed in five different seizure patients, it seems crucial to determine whether this also occurs in normal brain, or whether the appearance of type AB and type B endothelial profiles is restricted to pathophysiologic situations. It would also be important to know whether glucose transporter expression in the BBB endothelial cells is permanent, or whether cells are able to interconvert from type A to type B and back again, and if possible, the time frame of such a change. Glucose transporter regulation in the normal brain is believed to be posttranscriptional (Boado and Pardridge, 1993), but in situ hybridization analyses of GLUT1 mRNA signal are needed to confirm this in type A and type B endothelia.
Elevated Glut1 transporter content type A endothelia might be speculatively associated in proximity to epileptogenic-prone neuron sets, which require capillaries with an ability to translocate increased glucose for the neurons to function through the course of a seizure. Because of the increased (diameter ≈1.3×) and cross-sectional area lumens of type A profiles, relatively greater perfusion of these capillaries can be expected with the anticipated ictal increases in cerebral blood flow rates. (In a laminar flow situation, for example, the mass flow rate through tubes with a 1.3-fold difference in diameter would be increased by a factor of 2.9.) Conversely, the low-Glut1 type B endothelia may be a mechanism for keeping nonessential parenchymal cells hypometabolic, and by maintaining this reduced activity, lessen the probability of interictal spiking activity turning into an ictal event.
Differences in tissue samples based on EEG activity
Tissue samples from the more actively spiking regions of the resections exhibited proportionally more HSA extravasation (Fig. 9), indicating that BBB integrity was compromised to a greater degree in this region. Additionally, in the two patients studied, relatively more gliosis was demonstrated in this focal area (Fig. 10), based on the observation of higher densities of GFAP epitopes in the more actively spiking regions of the resections, than in the less actively spiking areas.
As discussed above, capillary morphometric variables, such as luminal and abluminal membrane circumferences and cytoplasmic areas, were increased in type A endothelia as compared with type B capillaries. A more subtle morphometric difference may characterize the cytoplasmic vacuolar areas, which were numerically (but not significantly) larger in more actively spiking areas. This is consistent with the work of Petito et al. (1977), who demonstrated increased pinocytosis of peroxidase (after intravenous administration) in brain endothelia (in animal electrostimulation models) and suggested a cyclic AMP-mediated event. Furthermore, the increased pinocytosis was proportional to the duration and number of electroshocks (Petito et al., 1976). Kasantikul et al. (1983) have previously demonstrated thickening of the capillary basal lamina in temporal lobe epilepsy, consisent with our observations (see Figs. 1–3). Although significant differences in this measurement as a function of spiking activity were not seen, seizure-induced differences are assumed in the absence of measured pericyte–basal lamina areas for normal human brain.
The quantity of endothelial cell cytoplasmic HSA seen in Fig. 8 is remarkable. A receptor for cationized albumin has been identified on BBB microvessels, and basic albumin (unlike native albumin) rapidly enters the cerebrospinal fluid from blood (Kumagai et al., 1987). Autoradiography using 125I-labeled cationized albumin (Kumagai et al., 1987) also suggests a similar distribution to that seen in Fig. 8. The possibility that cationization could contribute to the increases in capillary endothelial cytoplasmic albumin (in capillaries from seizure resections) may be worthy of further study.
Comparison of Glut1 in seizure resections and other CNS resections
We have previously examined Glut1 transporter activity in resected material from hemangioblastoma (Cornford et al., 1995) and brain injury cases (Cornford et al., 1996). (A study of tissue obtained from a seizure resection in which the patient had a GBM [Cornford et al., 1994] is not included in this comparison because of tissue sampling differences; no attempt was made to examine all capillary profiles, or to locate any type AB or type B capillary profiles with reduced Glut1 immunoreactivity.) In capillaries of the hemangioblastoma resections, we observed that 100% of the profiles were type A (Cornford et al., 1995), and in brain injury (Cornford et al., 1996) 88% of the profiles were type A and the remaining 12% were type AB. In seizure resections we observed a smaller proportion of entirely reactive type A capillary profiles (54% to 82%), with 18% to 46% of the profiles being type AB or type B (Fig. 4).
It also appears that there may be fewer immunoreactive Glut1 epitopes in the profiles from seizure resections than observed previously in studies of brain injury and hemangioblastoma (Table 3). In the entirely reactive type A capillaries, the total number of Glut1 epitopes (1) per profile, (2) per unit length of luminal membrane, and (3) within the endothelial cytoplasm appears to be increased 15% to 30% in hemangioblastoma and brain injury in comparison with seizure resections (Table 3), but the sample sizes (in brain injury and hemangioblastoma) are not large enough to permit significance testing.
A mechanism by which glucose transporter activity is interictally regulated in the human epileptogenic focus is suggested by the present study. Some, but not all, of the brain capillary endothelial cells exhibit dramatically reduced Glut1 glucose transporter densities. The effect is seen on both luminal and abluminal endothelial cell membranes; however, in these endothelial cells, the abluminal membrane has proportionally greater Glut1 density. (This latter observation may suggest that alterations in luminal membrane Glut1 density are more dynamic than in the abluminal membrane.) The bimodal distribution of Glut1 transporter in endothelial cells may be a quantifiable indicator of regulatory activity. Interictal control of the transport of glucose within an epileptogenic focus, may be adjusted up or down by the proportion of type A endothelial cells displaying abundant Glut1 glucose transporter epitopes, as compared with the proportion of type B endothelia (in which the transporter density is markedly less).
Possible mechanisms of BBB Glut1 modulation
Transporter recruitment in insulin-stimulated glucose transport (in fat, skeletal muscle, and heart) occurs through a redistribution of the Glut4 glucose transporter isoform from intracellular sites to the cell surface (Mueckler, 1990). In other studies of upregulated Glut4 activity, glucose transporter proteins also relocated from cytoplasmic to the surface membranes in the anoxic heart (Wheeler, 1988). Suggested possible mechanisms for the regulation of human BBB endothelial glucose transport (Cornford et al., 1994) include (1) redistribution of Glut1 between membrane and cytoplasmic sites, or (2) alteration in the total number of glucose transporter proteins. To evaluate these two possible alternatives, we examined the possibility that altered membrane density of endothelial cell Glut1 transporters occurred concomitantly with an inverse change in cytoplasmic Glut1 epitopes. Such analyses test the transporter recruitment (or cytoplasmic redistribution) hypothesis, and we could find no evidence for this phenomenon in human BBB endothelial cells. In both type A and type B capillaries, cytoplasmic Glut1 remained a remarkably constant fraction (21% to 25%) of the total Glut1 (Table 3), and 75% to 80% localized to the (luminal and abluminal) membranes. Modulation in BBB Glut1 thus appears to involve a mechanism whereby a change in the total number of immunoreactive Glut1 epitopes is seen in the endothelial cell membranes.
Given the possible absence of an intracellular pool of Glut1 proteins available for recycling to capillary membranes, alternative mechanisms can be considered. If the type A endothelial cells (with their larger lumens) are the major supply source of glucose during a seizure, the possibility exists that ictal upregulation of transporter activity may be accomplished in part by increased Glut1 carrier mobility; i.e., the intrinsic rate at which glucose is shuttled across BBB membranes increases, perhaps without an ictal increase in the number of membrane-associated Glut1 transporter proteins.
CONCLUSION
Until such time as the Glut1 glucose transporter activity is defined in normal human brain, the relationship of these two configurations of high-Glut1 endothelia and smaller low-Glut1 endothelia to pathologic conditions will remain speculative. We conclude that these observations of surgically resected, seizure-damaged brain material (1) provide evidence for selective alteration of Glut1 transporter activity in certain endothelial cells within and around the anatomical lesion; (2) suggest that with the different sizes of type A and type B capillaries, blood flow and perfusion of adjacent small regions may vary significantly; and (3) demonstrate the occurrence of a bimodal distribution of transporter (in which 10-fold alterations in Glut1 transporter activity may be seen in type A versus type B endothelial cells). Our observation that discrete regions of brain parenchyma (on the order of cubic micrometers) can show marked changes in glucose transporter activity implies that dramatically different substrate concentrations and glucose utilization rates may also characterize these small regions. Clearly, further examination of the biologic and physiologic significance of the two configurations of endothelial cell glucose transporter activity are needed, along with analyses of Glut1 transporter regulatory mechanisms. We believe our study contributes important information about discrete (microscopic and submicroscopic) changes that occur in the brain in response to insult; the alterations in glucose transport imply functional metabolic changes, and effects on brain perfusion and CBF are suggested by microvasculature architectural changes, emphasizing the significance of BBB capillaries to brain homeostasis.