
Abstract
The nonproportional relationship between instantaneous arterial blood pressure (BP) and cerebral blood flow velocity (CBFv) is well explained by the concept of critical closing pressure (CCP). We aimed to determine the frequency response of the neonatal cerebrovascular system, and to establish the exact mathematical relationship between cerebrovascular impedance and CCP under physiologic conditions. In 10 preterm neonates (gestational age, 25–32 weeks; birth weight, 685–1,730 g; age 1–7 days) we Doppler-traced CBFv of the internal carotid artery. Blood pressure was traced simultaneously. Critical closing pressure was graphically determined. Cerebrovascular impedance was calculated as the square root of the ratio of the corresponding peaks in the power spectra of BP and CBFv at zero frequency, and at heart rate (H) and harmonics (xH). Uniformly, the impedance between H and 3H (2 to 6 Hz) was reduced about fivefold, compared with the impedance at zero frequency. The cerebrovascular system behaves like a high-pass filter, leading to a reduction of the DC (direct current) component of CBFv (analogous to current) relative to that of the driving force BP (analogous to voltage). The frequency response of cerebrovascular impedance reflects the ratio of CCP and DC BP. A mathematical derivation of this relationship is given matching the observed results. Thus, both the CCP and the impedance approach are valid.
An understanding of the fundamentals of cerebral autoregulation (AR) physiology is regarded as essential when attempting to avoid intraventricular or periventricular hemorrhage in the preterm neonate. We recently presented a comprehensive physiologic model of AR (Michel et al., 1995) that integrates anatomy and metabolic and neuronal pathways with physiologic findings, including the low-frequency cycling of cerebral blood flow velocity (CBFv), attributed to an assumed nonlinear control system (Zernikow et al., 1994). The model is based on the concept of critical closing pressure (CCP) (Aaslid, 1992, Burton, 1951).
According to Burton (1951) and Aaslid (1992), CCP is the sum of intracranial pressure and cerebrovascular tone. There is no cerebral blood flow until the instantaneous blood pressure (BP) exceeds CCP, resulting in a nonproportional relationship between instantaneous arterial BP and cerebral blood flow (CBF) (Burton, 1951) or CBFv (Aaslid, 1992). Thus, CCP is defined as the instantaneous BP at zero CBF (Burton, 1951) or zero CBFv (Aaslid, 1992). In cases where CBFv never reaches zero, CCP is the intercept of the regression line of CBFv on BP with the abscissa (Aaslid, 1992).
We aimed to determine the frequency response of the impedance of the neonatal cerebrovascular system, and to establish the exact mathematical relationship between cerebrovascular impedance and CCP under physiologic conditions.
MATERIALS AND METHODS
Patients
We conducted an observational study on artificially ventilated preterm neonates, all born by cesarean section. Inclusion criteria were a gestational age of less than 33 weeks, the presence of an indwelling arterial catheter, and transcutaneous monitoring of Pa
Doppler sonography and arterial BP
We traced CBFv with the sample volume placed in one a. carotis interna at the basis of the clivus, using a pulsed 5-MHz duplex Doppler (HP SONOS 500, Hewlett Packard, Andover, MA, U.S.A.) linked to a 386-compatible personal computer (Zernikow et al., 1994). We traced systemic BP electronically in the a. radialis, or a. umbilicalis, or a. temporalis, using a single-use transducer (DPT-2000, Peter van Berg, Kirchseeon, Germany), and recorded it digitally. The sample frequency was 70 Hz (Michel and Zernikow, 1994).
Data processing
The spectral edge of the Doppler signal was calculated using proprietary software, giving the CBFv wave form. Critical closing pressure was calculated as described in our recent paper (Michel et al., 1995). This method is independent of angle of insonation, compensates for phase shifts between the pulse waves of BP and CBFv caused by the different sampling sites, and is equivalent to a graphical determination of CCP (Aaslid, 1992; Michel et al., 1995). During resampling at 50 Hz (custom software) of both the CBFv (originally sampled at 236 Hz) and BP tracing, the median of each 20-millisecond period was regarded a data point. Particularly the resampling of the CBFv tracing resulted both in low-pass filtering (Oppenheim and Willsky, 1992) for the purpose of anti-aliasing (Oppenheim and Willsky, 1992; Press et al., 1986) during the ensuing transformation step and in effective artifact suppression. Using custom software displaying both tracings simultaneously, under visual control the CBFv tracing was time-shifted relative to the BP tracing for a fraction of a cardiac cycle to compensate for any phase shift of the basic period. The first 512 data points of the time series of instantaneous (shifted) CBFv and BP—equivalent to a tracing length of 10.24 seconds—were subjected to Fast Fourier Transform (Statgraphics 5.0, STSC Inc, Rockville, MD, U.S.A.) (Oppenheim and Willsky, 1992; Press et al., 1986). Spectral peaks corresponding to the individual heart rate and harmonics were identified. The sum of the spectral power at each peak ± 0.17 Hz (7 consecutive spectral data points) was calculated, and the appropriate amount attributed to noise removed (Excel 4.0, Microsoft, Redmond, WA, U.S.A.). Peaks with a signal-to-noise ratio worse than 5 dB were rejected. Cerebrovascular impedance was calculated as the square root of the ratio of the corresponding peaks in the power spectra of BP and CBFv at zero frequency, and at heart rate (H) and harmonics (xH) (Czosnyka et al., 1994). Impedance was normalized to impedance at zero frequency (Io) (Czosnyka et al., 1994).
RESULTS
All study patients showed an end-diastolic CBFv greater than zero. The parameters of mechanical ventilation were kept constant, and blood gases were in the normal range, showing no significant fluctuations.
Tracings of BP and CBFv were of high quality (Fig. 1). Spectral peaks could be distinguished up to at least 3 H, and in some patients up to 11H (Fig. 2). The impedance between H and 3H (about 2 to 6 Hz) was uniformly reduced threefold to sixfold compared with Io (Fig. 3). Critical closing pressure ranged between 28 and 16 mm Hg (Table 1).
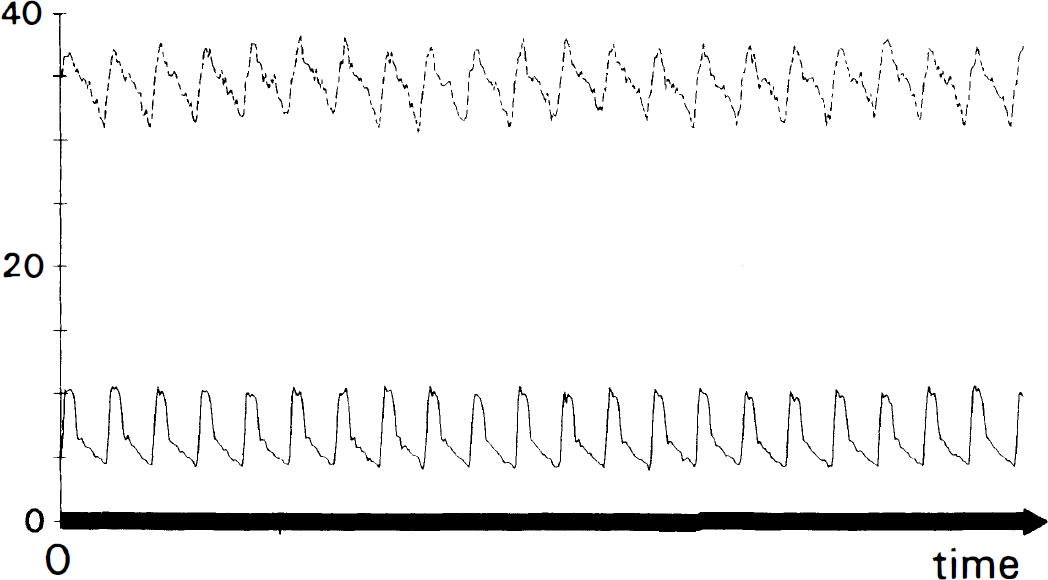
Simultaneous tracing of blood pressure (BP) (dashed line, top) and cerebral blood flow velocity (CBFv) (solid line, bottom) of a sample patient (No. 1). BP is given in mm Hg as indicated; CBFv is scaled to match the amplitude of the AC components of BP and CBFv to enhance the comparability of wave forms. Note the zero baseline common to both variables.
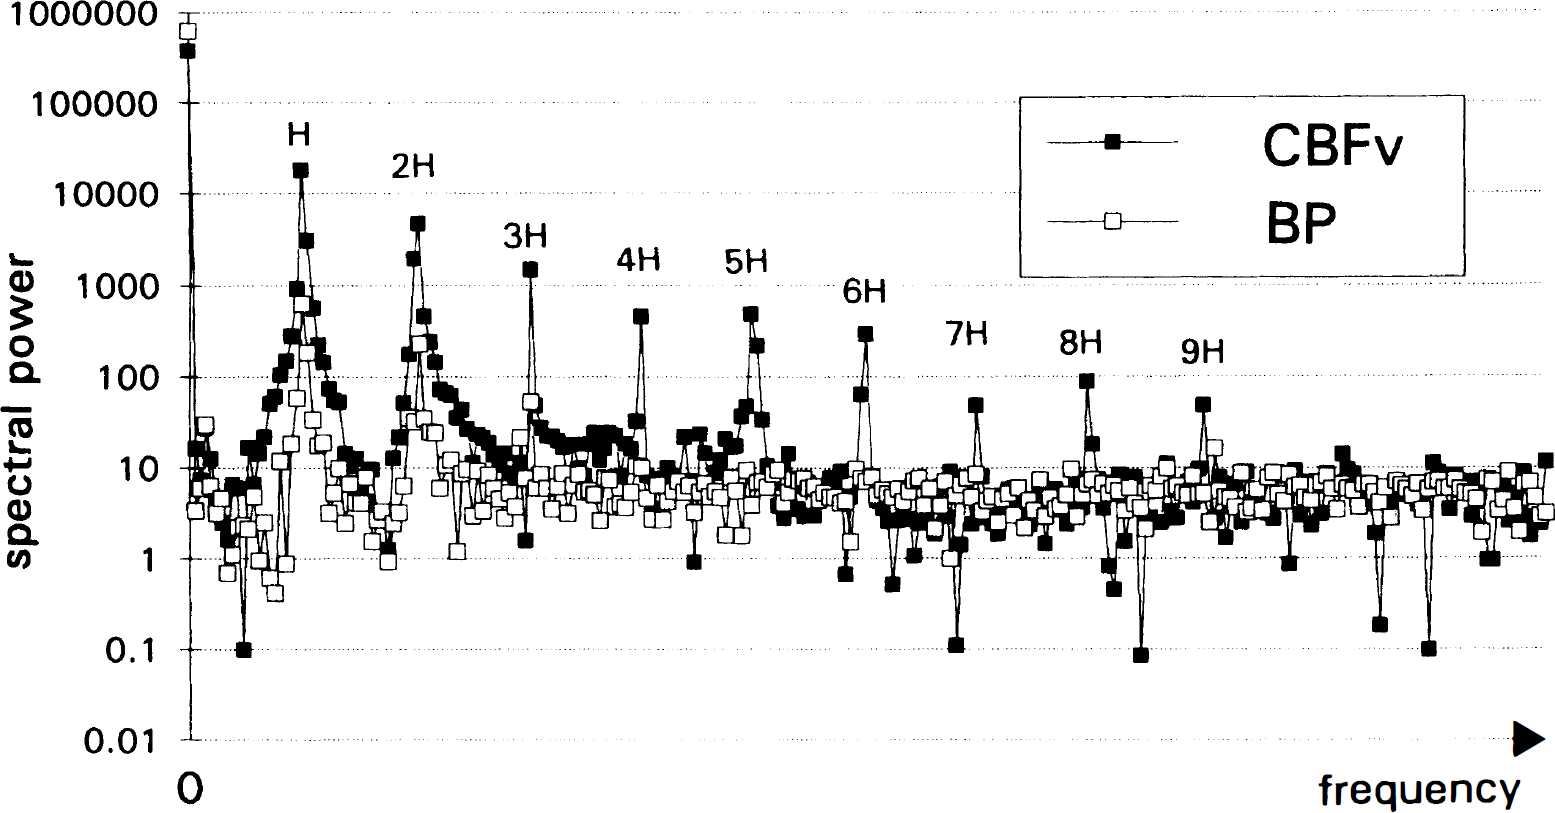
Spectrograms of blood pressure (BP) (solid circles) and cerebral blood flow velocity (CBFv) (squares) of the sample patient. Frequency is scaled in units of heart rate (H). Note the log-scale of the ordinate, arbitrary units. Even by eyeballing, nine harmonics are detectable.
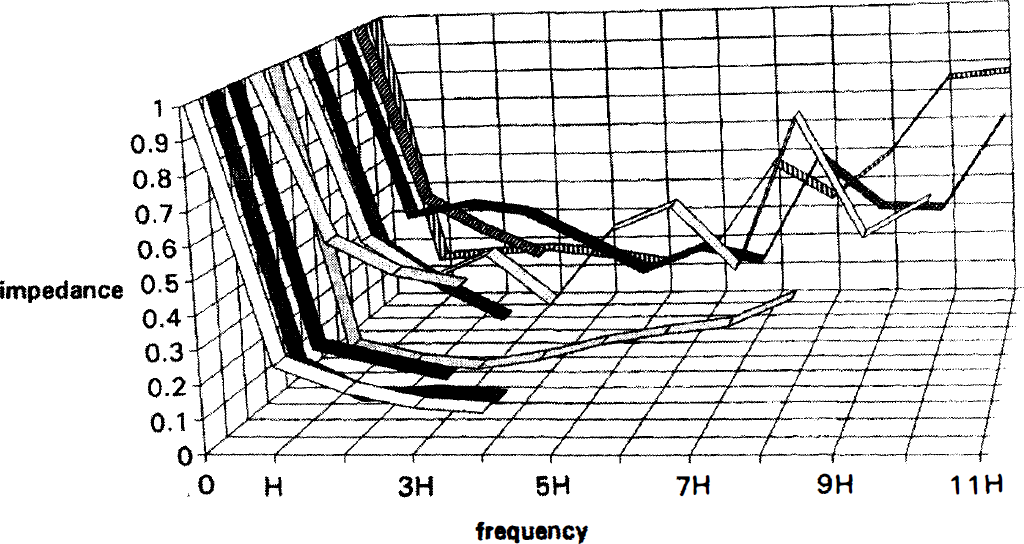
Frequency response of the cerebrovascular impedance in 10 preterm neonates. Patient #1 to #10 from background to foreground. Frequency is in units of heart rate (H). Impedance is normalized to individual impedance at zero frequency (Io); thus it is identical to the ratio of IH and Io. The frequency response shows band-pass behavior between H and 3H.
Mean blood pressure, graphically determined critical closing pressure, AC/DC impedance ratio, and impedance-based critical closing pressure calculated according to Equation 6
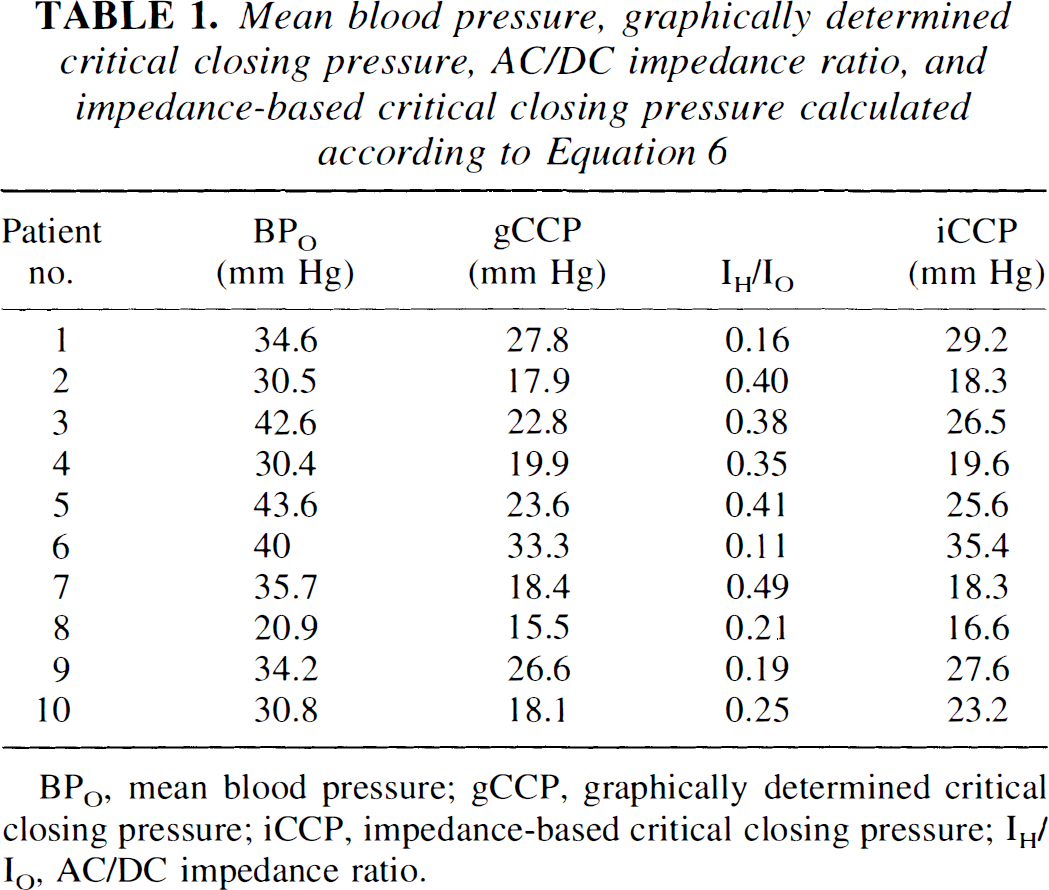
BPO, mean blood pressure; gCCP, graphically determined critical closing pressure; iCCP, impedance-based critical closing pressure; IH/IO, AC/DC impedance ratio.
DISCUSSION
Autoregulation
It is common practice to regard the autoregulated cerebral circulation as an electrical circuit, in which resistance arterioles change their resistance to match BP and the needs of the brain (Garcia-Roldan and Bevan, 1990; Kuschinsky and Wahl, 1978; Portnoy and Chopp, 1994; van der Bor and Walter, 1991). Unfortunately, a closer view reveals that cerebral circulation does not behave in a purely resistive manner. Instead, it exhibits high-pass filter characteristics, leading to a reduction of the DC (direct current) component of CBFv (analogous to current) compared with that of the driving force BP (analogous to voltage). The AC component is left largely unaffected (Fig. 1).
CCP theory
Critical closing pressure theory is more sophisticated in that the resistive element resembles more closely a Zener diode (Hutchinson and Kleinman, 1992) that subtracts a certain absolute amount from the driving force BP than a resistor subtracting a proportion thereof. The exact amount is controlled by AR (Aaslid, 1992; Burton, 1951; Michel et al., 1995). For instance, CCP theory would attribute a fivefold reduction in DC CBFv to a CCP of 80% the DC component of BP. This effectively leaves as driving force 20% of the DC component of BP because there is no CBFv until instantaneous BP reaches CCP (Fig. 1) (Aaslid, 1992; Burton, 1951).
Impedance theory
In a formal analogy to physics, the DC component of BP (or CBFv, or impedance) is BP (CBFv, impedance) at zero frequency, called BP0 (CBFv0, I0). With respect to BP and CBFv, the DC component equals the temporal mean of the corresponding variable. The AC components at the heart rate (H) or harmonics (xH) are indexed the same way (BPH, CBFvH, IH). Provided that there is no phase shift between voltage and current, impedance at frequency /is defined as the ratio of voltage to current at frequency /. The power spectrum delivers the squared amplitudes related to the various frequency components of the input signal (Oppenheim and Willsky, 1992). Hence, the square root of the ratio of corresponding peaks in the spectra of BP and CBFv delivers an impedance, and the algorithm from the Methods section is valid (Czosnyka et al., 1994; Oppenheim and Willsky, 1992). Because of the similarity in the AC wave forms of BP and CBFv and the linear relationship between both variables even if BP was measured at the calf as demonstrated by Aaslid (1992), the assumption of zero phase shift at the Doppler sample site and thus identical corresponding phase coefficients that cancel out (Oppenheim and Willsky, 1992; Press et al., 1986) is reasonable (Fig. 1). The means of the time series of BP and CBFv were not removed before spectral analysis. Hence, the spectral values at zero frequency represent the DC components of the original signals (Fig. 2).
The frequency response of cerebrovascular impedance (Fig. 3) reflects the ratio of CCP and BP0. Low I0 indicates high CBFv0 relative to BP0, as is seen with low CCP. Hence, at first approximation CCP is directly related to I0, and inversely related to IH (Table 1: Note that IH in Fig. 3 and Table 1 is normalized to I0).
Mathematical model
In a simplified approach we can deduce the exact mathematical relationship between CCP, BP, and impedance. To simplify we confine (1) to a situation in which diastolic CBFv never reaches zero flow velocity, i.e., BP being in the working range of AR, and (2) to the AC component at H.
CCP theory says The DC component of CBFv is proportional to the DC component of BP exceeding CCP

where k could be regarded as (fictive frequency-independent cerebrovascular resistance)−1.
The AC component of CBFv is proportional to the AC component of BP

Impedance theory says According to Ohm's law, the following applies:

and

From the above, equation [1a] = [1b]:

and equation [2a] = [2b]:

Then:

Substituting equation [5] for k in equation [3]:

and after transformation:

Critical closing pressure is independent of the angle of insonation (α), since cosine a affects CBFv0 and CBFvH to the same degree (eq. [1b] and [2b]) thus canceling out in the ratio IH/I0 (eq. [6]).
What is the significance of equation [6]? As long as AR is operating within its working range, the ratio of IH and I0 determines the relationship between mean BP (= BP0) and CCP. If IH/I0 approaches 1, CCP approaches zero. There is no reserve CCP left to regulate CBFv (Aaslid, 1992; Michel et al., 1995), and AR has reached its lower limit. If IH/I0 is small, CCP approaches BP0, and AR reaches its upper limit. In the latter case, the CBFv waveform becomes distorted (Aaslid, 1992). The mathematical resolution is then complicated by the sudden change in the harmonic composition of the CBFv signal. (This topic will be discussed in a separate paper). In fact, impedance model-based CCP and the graphically determined CCP are significantly correlated (r = 0.957, P < 0.00001; Table 1, Fig. 4).
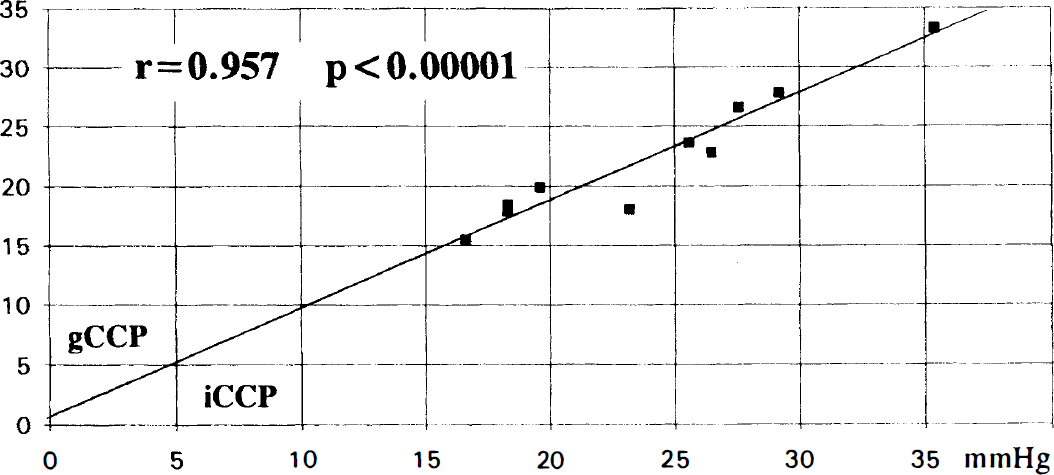
Correlation of graphically determined critical closing pressure (gCCP) and impedance-based CCP (iCCP), in mm Hg (r = coefficient of correlation; P = level of significance, Student's t statistics). For raw data see Table 1.
Limitations
We are well aware that CBFv in the internal carotid artery does not represent total CBF. The impedance model is not validated except for a part of the brain. Furthermore, in its present form the model is limited to a state of circulation within the limits of AR (see above). The model may be regarded as a prototype equation of autoregulation. Its universal correctness has yet to be proven.
Clinical implications
There is no obvious reason why in respect to impedance theory the normal adult cerebral circulation should behave fundamentally different from that of a neonate. Having developed a model of AR, we believe simulations and experimental validations are warranted to study the frequency response of the cerebrovascular system under various conditions (BP, Pa
SUMMARY
We could show that the impedance of the preterm infant's cerebrovascular system is frequency dependent, exhibiting a sharp decline from DC to heart rate and harmonics. The cerebrovascular system behaves like a high-pass (or more precisely, band-pass) filter promoting pulsatile blood flow. The different IH/I0 ratios determine CCP in relation to BP0 and reflect the state of the AR. A simple relationship exists within the working range of AR between the frequency-dependent impedance and CCP. Thus, both the CCP and the impedance approach to AR are valid. Since cerebrovascular “resistance” actually is impedance, Doppler-derived “resistance” indices need to be reevaluated.
APPENDIX
“Graphical” determination of CCP
The original concept of CCP describes the relationship between instantaneous CBF and BP (Burton, 1951). At first approximation, at the sample site CBFv is proportional to CBF. It could be shown that the concept of CCP is equally valid with regard to the dependency of CBFv on BP (Aaslid, 1992). Because of the remarkably linear relationship (Aaslid, 1992), the regression line can be defined by two points, namely (systolic BP/systolic velocity) and (diastolic BP/end-diastolic velocity). According to Michel et al. (1995), CCP is calculated as

where BPd, BPs = diastolic and systolic BP, and Vd, Vs = end-diastolic and systolic CBFv. This calculation is equivalent to the graphical determination of the intercept of the BP/CBFv regression line with the abscissa, and independent of the angle of insonation.