
Abstract
Using magnetic resonance (MR) echo–planar imaging (EPI), we recently demonstrated the presence of low-frequency fluctuations (<0.1 Hz) in MR signal intensity from the resting human brain that have a high degree of temporal correlation (p < 10–3) within and across associated regions of the sensorimotor cortex. These fluctuations in MR signal intensity are believed to arise from fluctuations in capillary blood flow and oxygenation. A substantial overlap between the activation map generated by bilateral finger tapping and temporally-correlated voxels from the sensorimotor cortex obtained during rest was observed. In the work reported here, we investigated whether respiratory hypercapnia, which is known to suspend spontaneous oscillations in regional cerebral blood flow, influences these low-frequency fluctuations. The magnitude of low-frequency fluctuations was reversibly diminished during hypercapnia, resulting in a substantial decrease of the temporal correlation both within and across contralateral hemispheres of the sensorimotor cortex. After the breathing mixture was returned to ambient air, the magnitude and spatial extent of the temporal correlation of low-frequency fluctuations returned to normal. Results of this study support the hypothesis that low-frequency physiological fluctuations observed by MR in the human cortex and spontaneous flow oscillations observed in early studies by laser–Doppler flowmetry (LDF) in the cortex of the rat are identical and are secondary to fluctuations in neuronal activity.
Magnetic resonance (MR) echo–planar imaging (EPI) techniques permit acquisition of a time course of images. Such a time course may consist, for example, of 280 images each acquired in a time duration of ∼50 ms with one acquisition per second. A pixel time course is defined as the signal intensity in a particular pixel as a function of time. Frequency bands corresponding to respiration and cardiac rates have been observed in pixel time courses (Biswal et al., 1993; Jezzard et al., 1993; Weisskoff et al., 1993). Additional fluctuations at very low frequencies (<0.1 Hz) have also been observed (Biswal et al., 1994). The origin and characteristics of these low-frequency fluctuations are not completely understood. After filtering higher-frequency components, namely respiration and cardiac rates, we recently demonstrated that low-frequency fluctuations from regions of the primary sensorimotor cortex are significantly correlated both within and across contralateral hemispheres during the resting state (Biswal et al., 1995a, b ; Hyde et al., 1995). Few (<3%) pixels from regions outside the sensorimotor cortex had a temporal correlation coefficient that passed the threshold. We demonstrated functional connectivity, as defined by Gerstein et al. (1989) and Friston et al. (1993), in the resting brain under normal physiological conditions. This method permits construction of functional-connectivity maps. Substantial overlap of these maps with functional magnetic resonance imaging (fMRI) maps produced by bilateral finger tapping was observed. Similar results have been obtained in works-in-progress when studying the visual and auditory cortices, and it is hypothesized that this phenomenon is present in other functionally-related regions of the brain.
Low-frequency spontaneous oscillations of regional cerebral blood flow and oxygenation have been observed by several investigators in animal models using a variety of measurement techniques, including laser–Doppler flowmetry (LDF) (Golanov et al., 1994; Hudetz et al., 1992, 1995), fluororeflectometry (Dora and Kovach, 1980; Vern et al. 1988), and polarographic measurement of brain tissue P
Functional task activation (Fox and Raichle, 1986; McKee et al., 1976; Nakai et al., 1983; Underwood et al., 1992) is also accompanied by cerebral vasodilation, although its effect on low-frequency fluctuations in cerebral blood flow is unknown.
Ogawa and Lee (1990) and Ogawa et al. (1990) first demonstrated the dependence of magnetic resonance (MR) signal intensity on a physiological variable (anoxia versus room air) in live mice using a gradient-recalled pulse sequence. Turner et al. (1991) demonstrated the difference in temporal characteristics of signal intensity between grey and white matter during various respiratory challenges. Respiratory challenges resulting in vasodilation have also been used to study changes in signal intensity during rest (Kwong et al., 1995; Rostrup et al., 1994) and task activation (Bandettini et al., 1994) in a context of fMRI (Bandettini et al., 1992; Belliveau et al., 1991; Kwong et al., 1992). It was demonstrated that hypercapnia induces vasodilation, which leads to an increase in the oxyhemoglobin content in the blood and results in an increase in magnitude of the MR signal. In these studies, however, no frequency analysis of the MR signal was performed. In the present study, we investigated the effect of hypercapnia on the temporal correlation of low-frequency fluctuations in the sensorimotor and associated cortices of the human brain during rest.
MATERIALS AND METHODS
All data used in this paper were obtained using a 1.5 T Signa scanner (General Electric Medical Systems, Milwaukee, WI) fitted with a home-made three-axis balanced-torque head gradient coil, a shielded endcapped quadrature transmit/receive birdcage radio-frequency (RF) coil (Wong and Hyde, 1991), and a gradient-recalled T2*-weighted echo–planar imaging pulse sequence described in detail by Wong et al. (1992a,b). In all experiments performed for this study, the RF power deposition and magnetic field switching rates were kept below levels specified by the U.S. Food and Drug Administration.
Human Subjects
Six healthy human volunteers (five men and one woman, aged 24–32 years) with no current use of medication were scanned. All protocols received Institutional Review Board approval. Written consent was obtained from all subjects. Subjects other than graduate students were paid on an hourly basis. Volunteers were positioned supine on the gantry of the scanner with the head in a midline location in the coil. To limit head movement, foam padding was placed between the forehead and coil. Two axial slices across the motor cortex (Rumeau et al., 1994) were obtained in each EPI scan.
Imaging parameters
Each scanning session began with the acquisition of high-resolution axial anatomic images using a gradient-recalled at steady state (GRASS) pulse sequence, with repetition time (TR) = 600 ms, echo time (TE) = 10 ms, field-of-view (FOV) = 24 × 24 cm, and matrix size = 256 × 256. For functional imaging, several time series of 280 images (280 s) were obtained from multiple axial slices with a gradient-echo EPI sequence, FOV = 24 × 24 cm, matrix size = 64 × 64, slice thickness = 10 mm (corresponding to a spatial resolution of 3.75 mm × 3.75 mm × 10 mm), TE = 40 ms, and TR = 1,000 ms with flip angle = 81°. An additional study was carried out in one of the subjects at TR = 250 ms to control for possible effects from aliasing of the heart rate to low frequencies.
Data acquisition
During resting-state acquisitions, subjects were instructed to refrain from any cognitive, sensory, or motor tasks as much as possible. To minimize the possibility of imagining finger tapping, subjects were falsely told that the experiment involved the auditory cortex and such an experiment was actually performed. For the auditory task-activation paradigm, subjects listened to four cycles of common English words. Each cycle consisted of 30 s of rest followed by 30 s of the auditory task. The paradigm concluded with an additional 40 s of rest. Although the task was auditory, a time course of axial images was, in fact, obtained along the motor cortex. Finally, although subjects had not been informed in advance, they were asked to perform a motor task (bilateral finger tapping). For bilateral finger tapping, subjects were instructed to touch each finger with the thumb sequentially in a self-paced manner without moving their arms. The finger-tapping rate varied between 2 and 0.5 tappings per second. The sequence of the finger-tapping paradigm was the same as for the auditory paradigm, four 60-s cycles followed by 40 s of rest.
Hypercapnia was induced by inhalation of 5% CO2, 20% O2, and 75% N2. This breathing gas mixture was chosen since it has been demonstrated to cause substantial vasodilation without injury (Kwong et al., 1995; Rostrup et al., 1994). Inhalation of 5% CO2 in artifically ventilated experimental animals increases the arterial CO2 pressure to ∼70 mm Hg (Lee et al., 1995) and also abolishes low-frequency fluctuations (Hudetz et al., 1992). All subjects practiced breathing 5% CO2 a few times outside the scanner prior to scanning. A pulse oximeter with infrared sensor on the finger of the subject (Model 504, Criticare Systems, Inc., Waukesha, WI, U.S.A.) was used to monitor the cardiac rate and blood oxygenation throughout the scanning session. The sampling rate of the MR scan at one image per second provided a frequency bandwidth large enough to estimate respiratory frequency without any external monitoring techniques (Biswal et al., 1994).
Each experiment consisted of the following scans: (1) rest while breathing room air, (2) rest during hypercapnia, (3) rest after resuming breathing of room air, (4) auditory task-activation paradigm, and (5) bilateral finger tapping paradigm. For the hypercapnia study, the scan was started 10 s after addition of 5% CO2 to the breathing gas mixture. Each scan lasted 4 min 40 s and was followed by ∼5 min of rest, during which the subjects breathed room air.
Data analysis
Change of the breathing gas causes change in capillary hemodynamics that, in turn, cause change in MR signal intensity. The approach to physiological equilibrium can be monitored by observing the approach of MR signal intensity to equilibrium. The time dependence of the increase in the signal intensity in grey matter after onset of 5% CO2 in the breathing gas mixture was fitted to an equation of the form
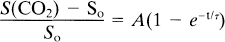
where So is the signal intensity in grey matter at the initiation of CO2 inhalation and S(CO2) is the signal intensity after several minutes of CO2 inhalation. The prefactor A is the fractional increase in signal intensity after equilibrium has been reached, and the time constant τ is a measure of the temporal approach to equilibrium. Equation 1 was introduced empirically as a convenient means to characterize the data. Nevertheless, it may give insight into the underlying physiology.
A few pixels in each data set were identified by inspection of the anatomic images as lying in grey matter, and average values of A and τ determined from the corresponding pixel time courses. These values were inserted into Eq. 1, and the resulting waveform was cross-correlated with every pixel time course. All time courses with correlation coefficients >0.7 (corresponding to a significance value p < 10–7) were selected for further analysis. Visual inspection of the anatomic images confirmed that these selected pixels were, almost without exception, in grey matter. In addition, very few pixels apparently lying in grey matter, failed to pass the 0.7 threshold. The choice of 0.7 as a threshold was based on the close correspondence of selected pixels with anatomically defined grey matter. Analysis of physiological fluctuations was performed on data from these pixels after the signal had approached 90% equilibrium, corresponding to a time equal of about ∼2τ.
A Gaussian low-pass filter at 0.08 Hz (Hamming, 1983) was applied to all pixel time courses in the EPI data sets of resting brain (both room air and 5% CO2 scans). Although this eliminates fluctuations at respiration and cardiac rates along with the first harmonic of the cardiac rate for data obtained with a TR of 250 ms, only the respiration rate is reliably eliminated for a TR of 1,000 ms. For this longer TR value, fluctuations at the heart rate would be aliased into lower-frequency components and appear as a low-frequency signal if the heart rate of the individual lay in the range of 57–63 cycles/min. Heart rates outside this range would be aliased into frequency components that would not pass the 0.08 Hz cutoff of the low-pass filter. For each individual, heart rate variability exists that further blurs the aliased frequencies and could, in principle, mimic low-frequency fluctuations. Aliasing problems were a concern in the study presented here, and we are confident that the data were not contaminated by aliasing.
The task-activation data acquired in scan 5 of the protocol was used to determine the borders of the sensorimotor cortex in each of the other four scans. Data from scan 5 were not otherwise used. In all pixel time courses, the first and last three data points from each 30-s period during transition from one state to the other were neglected. All pixel time courses in scan 5 were normalized and cross-correlated with the box-car waveform on a pixel-by-pixel basis (Bandettini et al., 1993). From a total of ∼1,000 pixels from the brain (of the possible 4,096 pixels), ∼60 pixels passed a correlation-coefficient threshold value of 0.35. After a Bonferroni correlation, a threshold of 0.35 corresponds to a statistical significance of p < 10–3. This threshold was used in our earlier study (Biswal et al., 1995b). All pixels that passed this threshold were identified as lying in the sensorimotor and associated cortices. Pixels from the sensorimotor cortex were further categorized into left and right motor cortices along with the supplementary motor areas (Roland et al., 1980).
For each pixel in scan 1 (resting state) that had been determined from the task-activation data (scan 5 of the protocol) to be within the borders of the motor cortices, the corresponding pixel time course was used as a reference waveform and correlated with all other pixel time courses of the scan. A threshold of 0.35 was used, and ∼60 correlation-coefficient images (Bandettini et al., 1993) which are called functional-connectivity maps in the following, were produced. The procedure was repeated for scans 2 and 3, as well as scan 4 (mock scan).
Pixels from the task-activation data (scan 5) with correlation coefficients with respect to the box-car waveform >0.35 were classified into three regions: left motor cortex, L, right motor cortex, R, and other brain tissue, O. The number of pixels in each region was designated nL, nR, and nO, respectively. There were (nL + nR) functional-connectivity maps produced for each of the three resting-state scans (scans 1, 2, or 3) and also for the mock scan (scan 4). Consider the subset of functional-connectivity maps produced from a given resting-state scan using pixel time courses only in the right motor cortex. There were nR such maps. The quantity n̅LR is defined as the average number of pixels in region L (left motor cortex) in those nR maps. Similarly, n̅RR is the average number in region R. Using the remaining nL functional-connectivity maps, quantities n̅RL and n̅LL were determined. This procedure was repeated for each resting-state scan as well as for the mock scan. A measure of correlations within a region is given by n̅RR/nR, n̅LL/nL, and between regions by n̅LR/nL, which is necessarily identical to n̅RL/nR. The quantity (n̅OL + n̅OR)/nO serves as a control. This is the average number of pixels in O (other brain tissues) that passes the threshold when using a motor cortex pixel time course as a reference. This methodology is discussed in more detail in Biswal et al. (1995b).
RESULTS
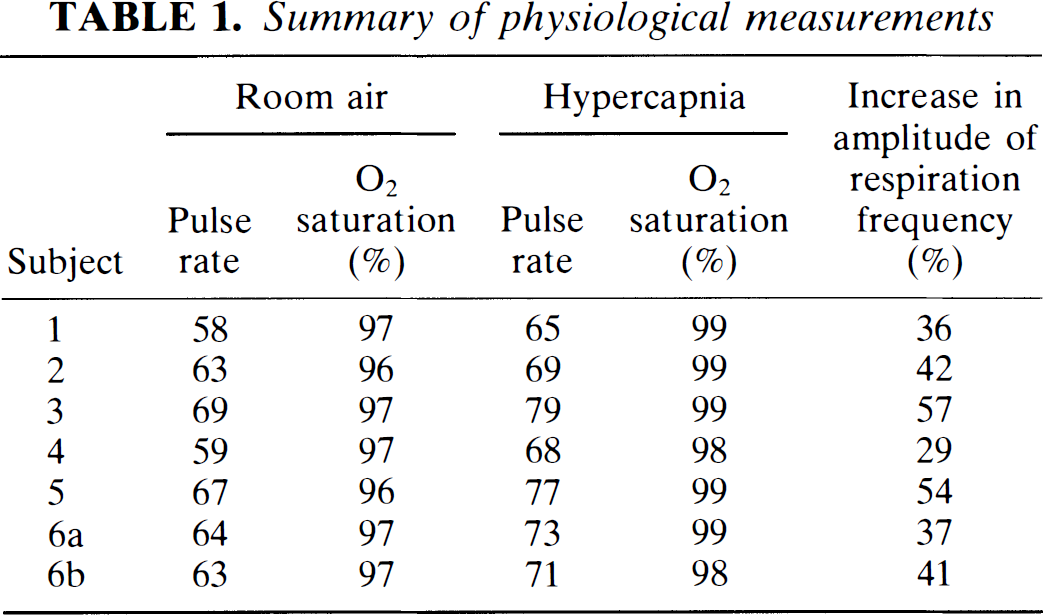
The average cardiac pulse rate in the resting state was 63.3 ± 3.9 (mean ± SD). During 5% CO2 inhalation, the pulse rate increased to 71.7 ± 4.9 and oxygen saturation increased from about 96.7 ± 0.5 to 98.7 ± 0.5%. Results from each subject are shown in Table 1.
Summary of physiological measurements
Fitting each pixel time course signal intensity from all subjects during inhalation of 5% CO2 to Eq. 1 resulted in A = 0.087 ± 0.029 and τ = 37 ± 11s. The values of A and τ obtained from each subject are shown in Table 2.
Values of A, τ (Eq. 1) obtained from each subject during scan 2 of the protocol
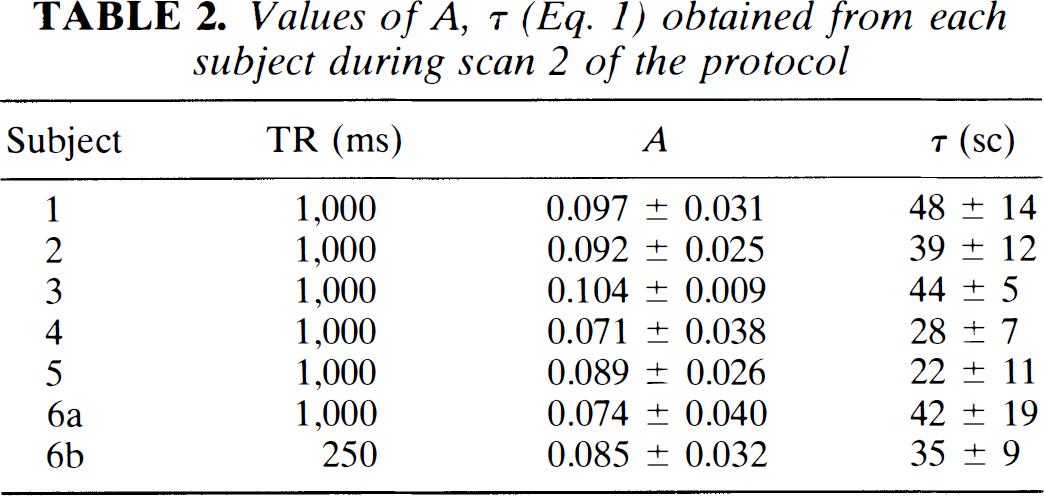
Figure 1 shows a representative time course from a pixel in the motor cortex obtained during rest (scan 1) and hypercapnia (scan 2). The standard deviation of signal intensity values within a time course increased from 2.41 ± 0.54% before hypercapnia to 3.76 ± 0.89 at equilibrium. Frequency analysis performed on the MR signal intensity using a low-pass filter cutting off at 0.24 Hz demonstrated that the magnitude at the respiratory frequency was considerably higher during hypercapnia (42 ± 10%) and the magnitude of the low-frequency fluctuations was greatly diminished (53 ± 11%), averaged across all subjects and all motors cortex pixels. The frequency spectrum of a representative time course appears in Fig. 2.
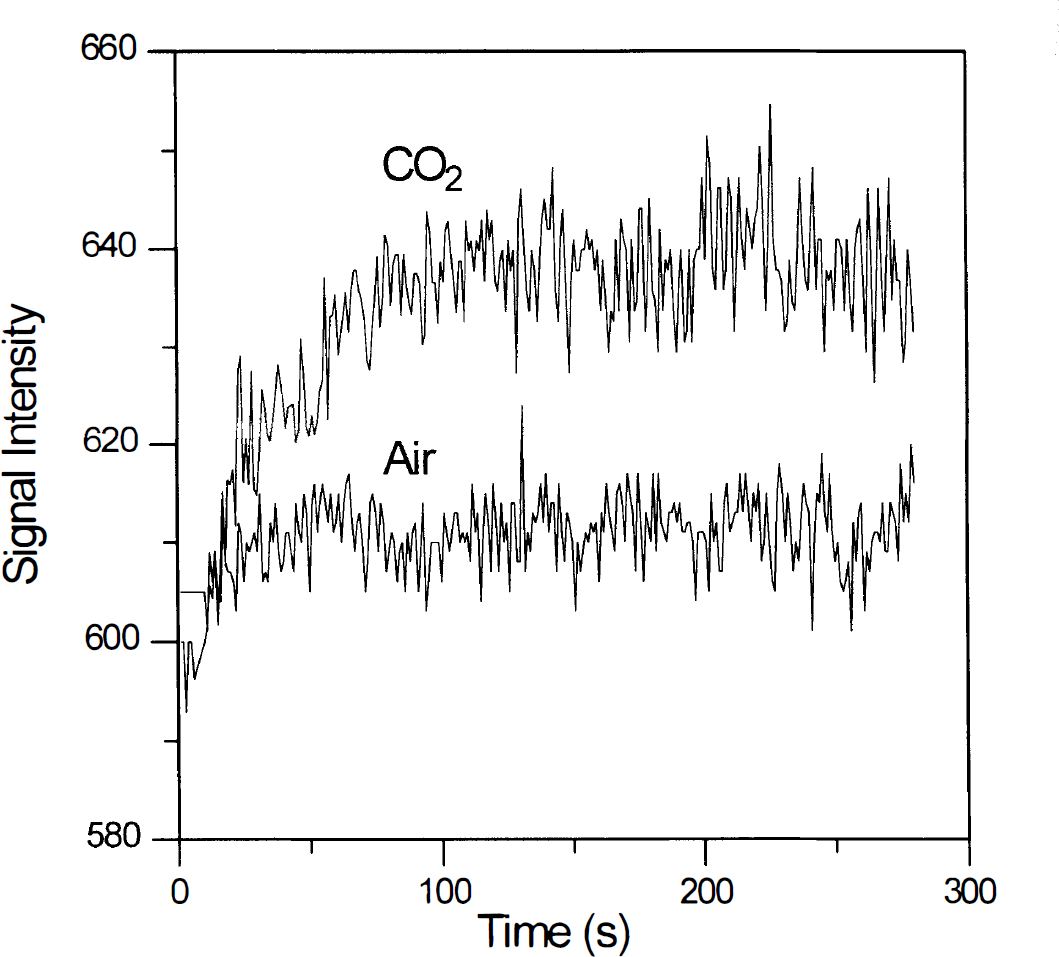
Time course of physiological fluctuations of a representative pixel in the motor cortex obtained during rest while breathing air (low trace) and 5% CO2 (upper trace) mixture.
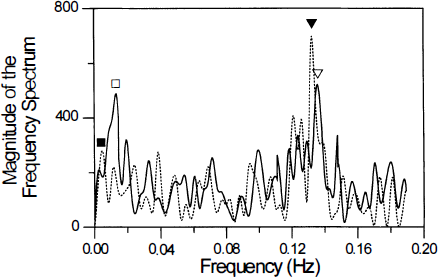
Fourier transform of a single representative filtered pixel time course from the motor cortex during rest while breathing air (solid line) and a gas mixture containing 5% CO2 (dashed line). A low-pass filter, cutting off at 0.24 Hz, high enough to include the respiration frequency, was used. During hypercapnia, there was a substantial increase in the magnitude of the signal at the respiration frequency (triangles), but a decrease at lower frequencies (squares).
Figure 3A shows an fMRI response from bilateral finger movement (subject no. 1) overlaid on an anatomic image. A pixel from the left motor cortex (region b) was chosen and a functional-connectivity map made for each of the three resting brain data sets (see materials and methods section), as shown in Figs. 3B (scan 1), 3
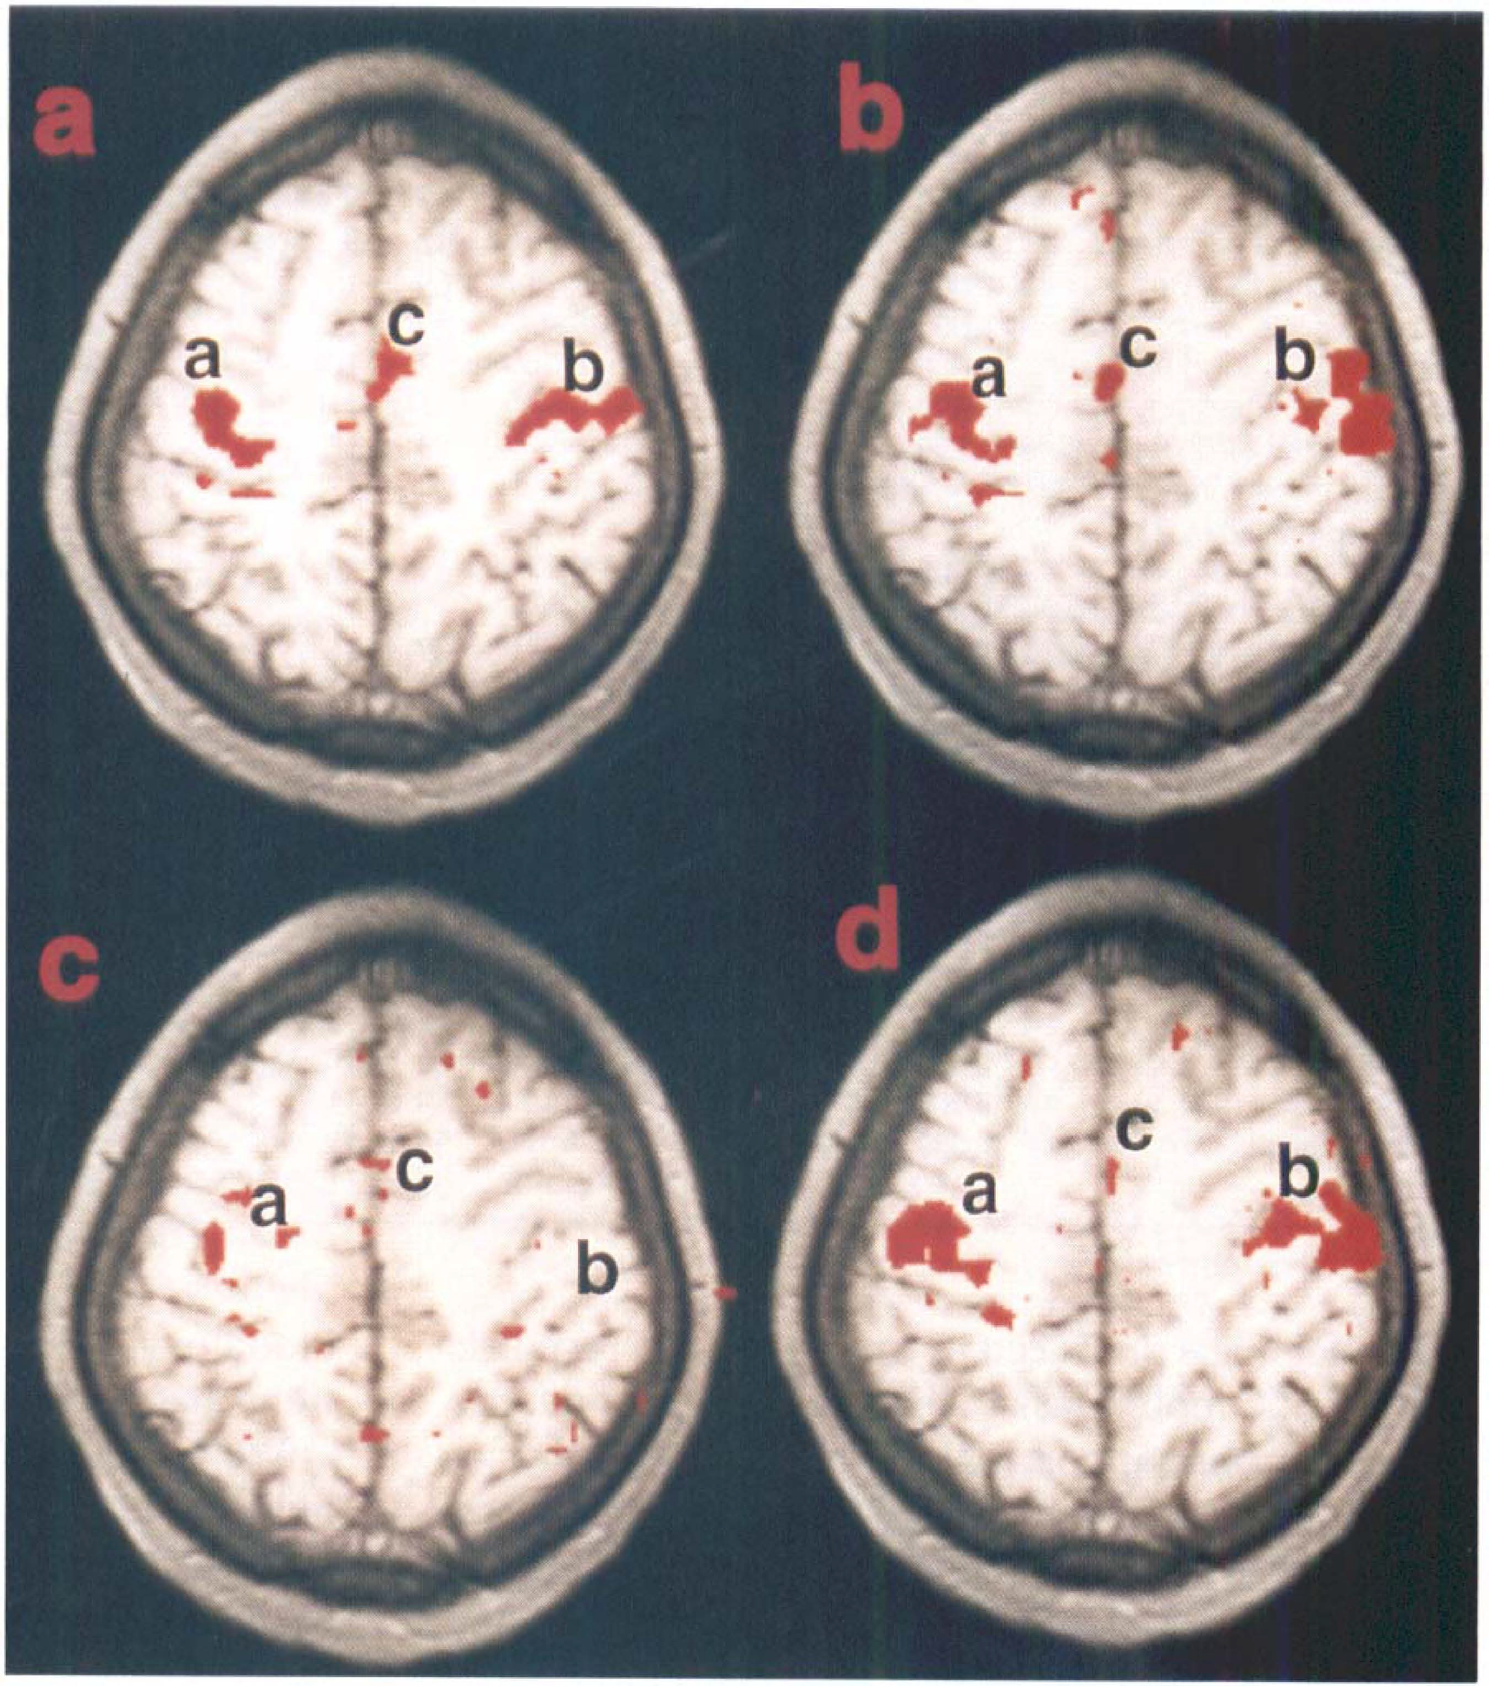
Similar amounts of overlap of the task-activation and functional-connectivity maps were obtained in all studies, not only in left and right primary motor cortices, but also in the SMA (Table 3). Statistics across subjects are displayed in Fig. 4. The difference in overlap during hypercapnia in all studies when compared with the scans at rest (scans 1 and 3) was found to be statistically significant, p < 10–4, whereas the difference in overlap between the two scans while breathing air (scans 1 and 3) was not statistically significant, p > 0.27.
Correlation coefficient data from resting brain
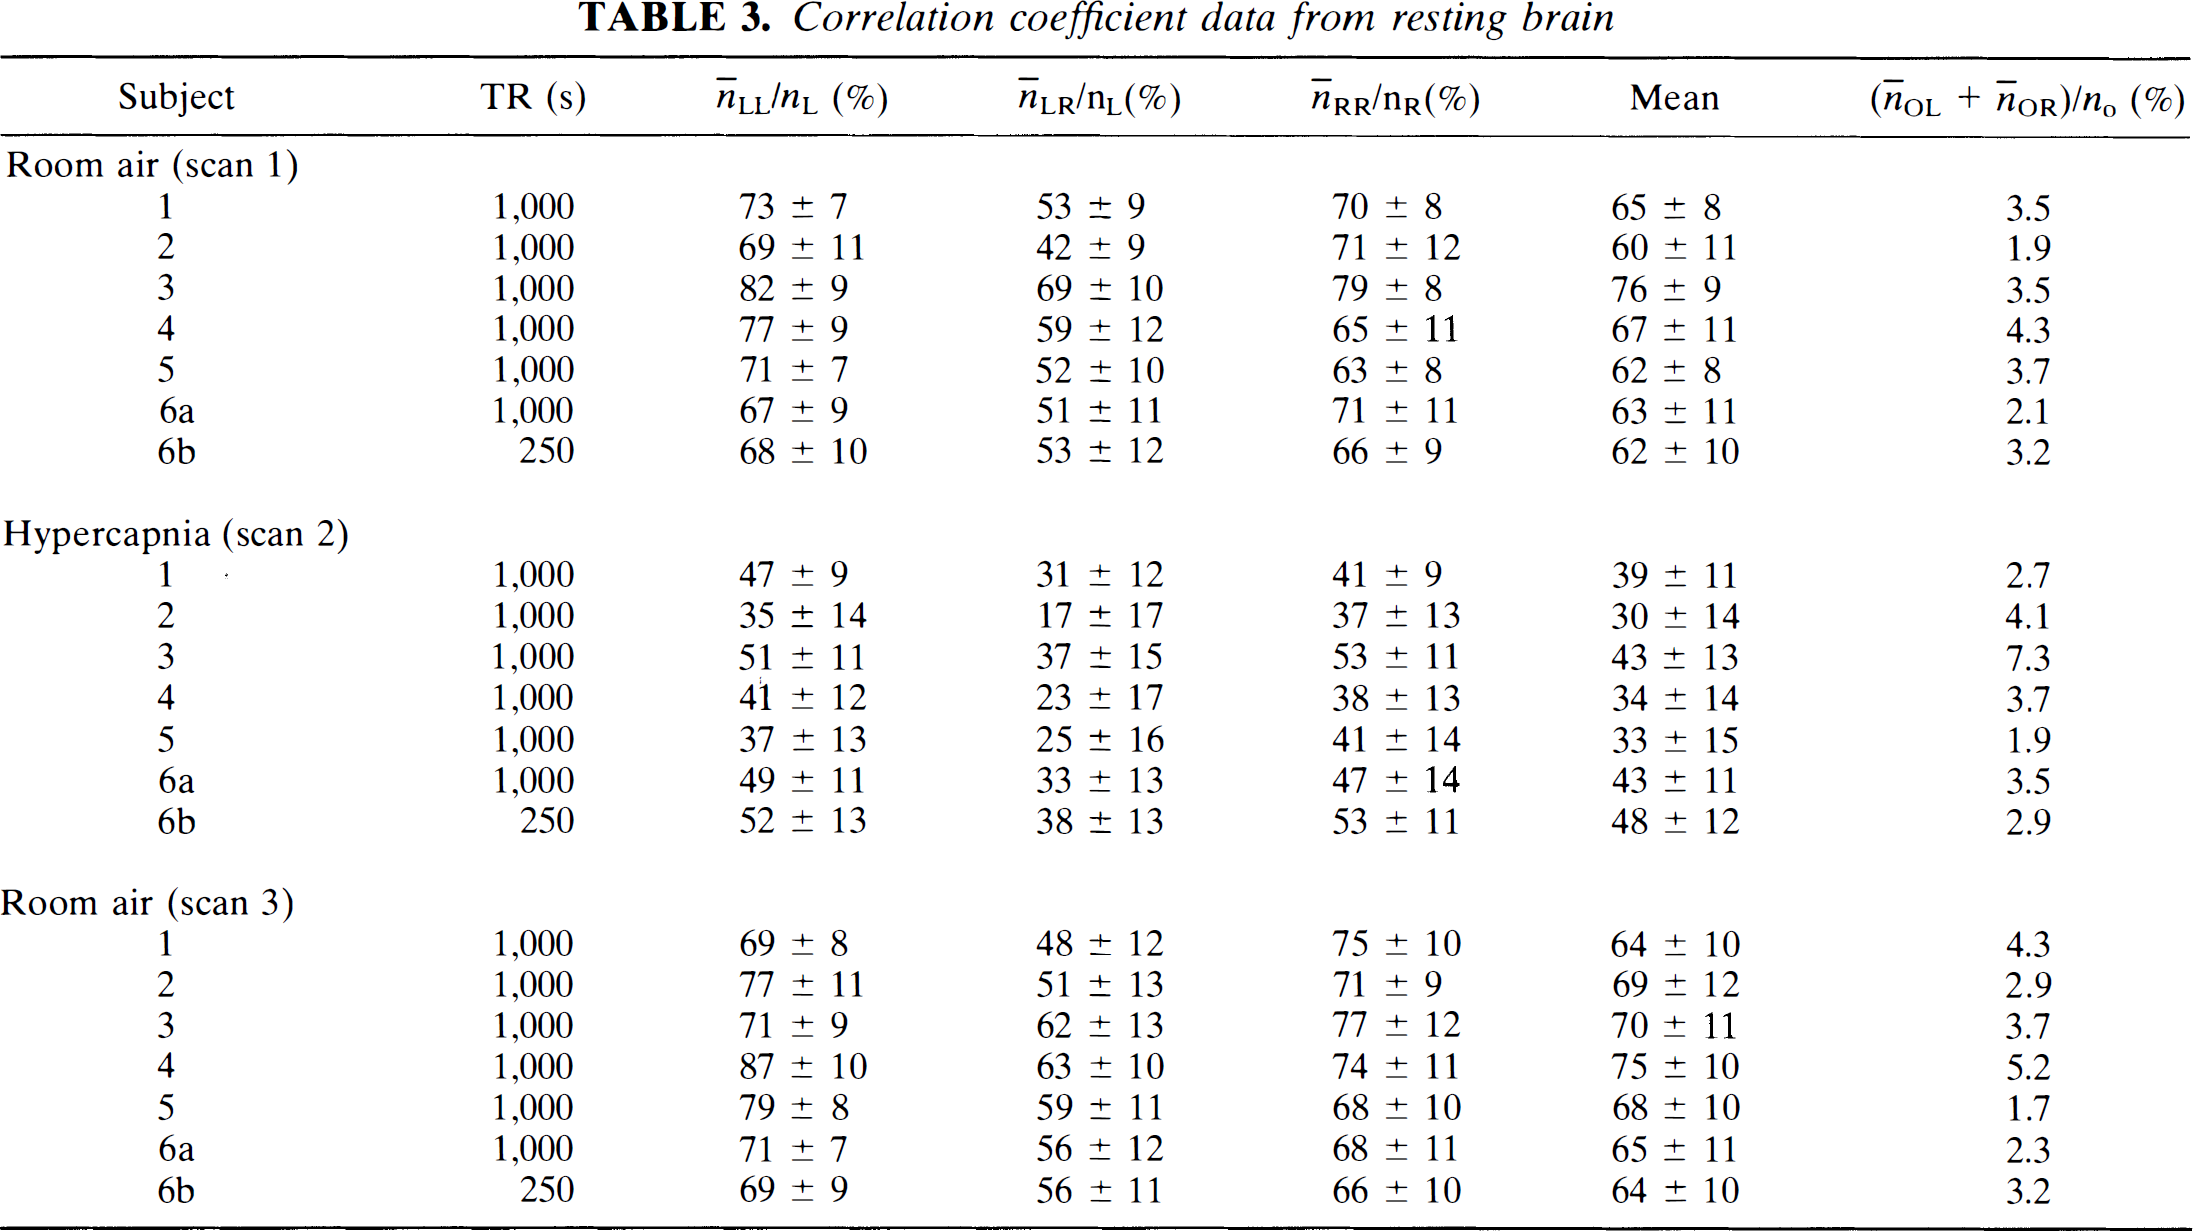
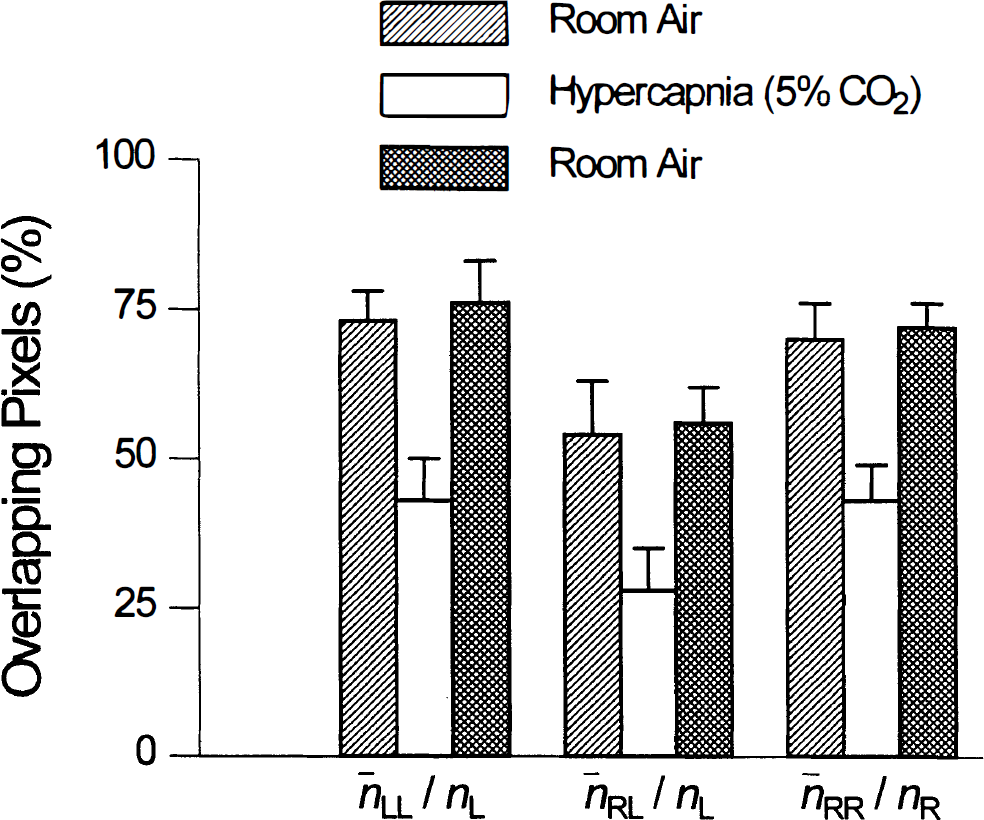
Comparison across subjects. A very high degree of consistency was found. A decrease in temporal correlation was found in all subjects. The percent overlap during hypercapnia and the two rest scans was statistically significant p < 10–4. However, no statistical differences (p > 0.27) was found between results obtained during the two rest scans (scans 1 and 3).
No statistically significant difference was observed between the results obtained at TRs of 250 and 1,000 ms, indicating that aliasing of the cardiac frequency to a frequency <0.08 Hz did not occur. It would be possible to set the TR for each subject, if necessary, to avoid this potential problem. Task-activation data obtained in the sensorimotor cortex during the mock auditory-task-activation experiment were indistinguishable from resting-state data. They were not used in the data analysis presented here.
DISCUSSION AND CONCLUSIONS
Biswal et al. (1995a, b ) and Hyde et al. (1995) demonstrated a close correspondence between functional-connectivity maps produced by analysis of low-frequency physiological fluctuations in the motor cortex of the resting human brain as detected by EPI and fMRI maps produced by analysis of the response to a specific motor task. This close correspondence provides strong support to the hypothesis that physiological fluctuations as detected by MR methods are, at least in part, a consequence of fluctuations in neuronal activity. Fundamentally, water molecules in and near blood vessels are being observed, and the fluctuations in MR signal intensity are from fluctuations in the magnetic environment due to fluctuations in blood oxygenation, volume, and flow. These fluctuations are secondary to neuronal activity.
We believe that functional connectivity observed in this study was not due to “imagined” motor tasks. All subjects used in this study were completely naive to the objective of the fMRI experiment. By misleading the subjects by instructing them that the study would involve an auditory task, the chances of imagined finger tapping are believed to be remote. Previous studies on imagined motor tasks by Rao et al. (1993) and Roland et al. (1980) reported activation in the SMA and not in the primary motor cortex, in contrast to our results.
Physiological fluctuations in the MR signal closely resemble the pattern of spontaneous flow oscillations in rat cerebral cortex as assessed by LDF (Hudetz et al., 1992). Similar oscillations in cerebrocortical oxygen availability were observed by Cooper et al. (1966), Halsey and McFarland (1974), and Moskalenko (1980), and were attributed to metabolic autoregulation of CBF involving tissue CO2. Vern et al. (1988) demonstrated similar low-frequency oscillations in cortical oxidative metabolism and suggested that the parallel oscillations in cerebral blood volume were secondary to those in neuronal activity and metabolism. Recently, Golanov et al. (1994) suggested that the flow oscillations were associated with periodic bursts in cortical EEG. Thus, on the basis of previous work, we are led to the hypothesis that spontaneous flow oscillations observed earlier in the cerebral cortex of the rat and physiological fluctuations observed using MRI methods in the cerebral cortex of the human are identical and secondary to neuronal activity. The present study lends further support to this hypothesis. The main finding is that hypercapnia reversibility diminishes the low-frequency fluctuations observed in the sensorimotor cortex using a time course of EPIs. This observation is consistent with similar effects on CBF (Hudetz et al., 1992) and brain tissue P
Both inter- and intrasubject variability of task-induced fMRI signals are substantial. Results of this paper may provide a basis for understanding this variability. The hypothesis would be that variations of Pa
Not only were fluctuations suppressed by hypercapnia in a similar manner in the present study and previous animal studies, but also the time course of the MRI response to hypercapnia was quite similar to that seen in regional CBF to the same stimulus (Lee et al., 1995). The gradient recalled T2*-weighted EPI pulse sequence is sensitive to both blood oxygenation and blood flow. The relative weighting of oxygenation and flow can be varied by changing TE and TR in the pulse sequence. The spatial resolution of MRI is sufficient to distinguish between grey and white matter in EPI pulse sequences. It would be possible, using equations of the form of Eq. 1, to investigate both blood flow and blood oxygenation in grey and white matter as a function of the level of hypercapnia and to compare results with those from classical methods (Greenberg et al., 1978).
Footnotes
Acknowledgment:
The work was supported by grants MH51358 and CA41464 from the National Institutes of Health.