
Abstract
The Kety-Schmidt technique can be regarded as the reference method for the measurement of cerebral blood flow (CBF). However, the method is somewhat cumbersome for routine use in the intensive care unit (ICU) at the bedside. The continuous thermodilution technique developed many years ago for the measurement of coronary sinus blood flow can be applied for the measurement of jugular blood flow (JBF). However, the measurement of JBF by thermodilution has never been validated using the Kety-Schmidt reference method. We first validate the continuous thermodilution in vitro by comparison with a volumetric flow. The thermodilution method is accurate for flows between 50 and 900 ml min−1 with a mean difference volumetric-thermodilution flow of −1 ± 18 ml min−1 (mean ± SD), and precise with a coefficient of variability ranging between 1.21% and 2.50%. In vivo accuracy was assessed by comparing in 15 comatose patients CBF measured using the Kety-Schmidt (CBFKS) method and estimated from JBF measured by thermodilution (CBFTH) at four levels of arterial PaCO2 (25, 30, 35, and 40 mm Hg). The mean difference CBFKS — CBFTH is −0.9 ± 3.6 ml min−1 100 g−1. In vivo precision of the method was good, with a coefficient of variability of 4.1% in mean. We conclude that jugular continuous thermodilution technique is a reliable method for estimating CBF at the bedside. This technique allows repeated measurements jugular bulb blood sampling for brain metabolic studies.
Keywords
Although many critically ill patients suffer from neurological problems, their management does not routinely require monitoring of cerebral blood flow (CBF). Nevertheless, assessment of cerebral hemodynamics can be of great interest for diagnostic and therapeutic purposes in patients in coma resulting from head injury, subarachnoid hemorrhage, anoxia, or metabolic encephalopathy. In these clinical situations CBF is a key variable for better understanding the pathological process responsible for cerebral ischemia.
In 1945, Kety and Schmidt (1945) described a quantitative method for measurement of CBF, based on the classical Fick's principle following the administration of nitrous oxide (N2O) as a tracer. Using this technique interesting and fundamental information has been obtained on the physiology and the metabolism of the cerebral circulation in normal man. Subsequent modifications of the technology have involved the use of radioisotopes such as krypton-85 or xenon-133 combined with compact scintillation detectors and microprocessors (Obrist et al., 1975; Edvinsson et al., 1993; Young and Ornstein, 1994). Even though these methods for CBF measurements have allowed a lot of investigations, particularly in patients with severe head injury (Obrist et al, 1984) and with cerebral ischemia after cardiac arrest (Cohan et al, 1989), a more widespread clinical application has been limited by several disadvantages, including elevated cost, exposure to radioisotopes, requirement for complicated analyses and calculations. Furthermore, these techniques cannot be performed easily at bedside in the intensive care unit (ICU) despite some recent attempts to simplify the original Kety-Schmidt method (Kozam et al, 1970).
More sophisticated techniques, such as single-photon emission computed tomography (SPECT), positron emission tomography (PET), angiography with magnetic resonance imaging (MRI), and stable xenon-enhanced computed tomography (sXe-CT), have been developed recently. These represent powerful research tools, but do ot yield bedside measurements (Edvinsson et al., 1993; Young and Ornstein, 1994).
The exploration of the cerebral circulation in the ICU requires fast, easy, and accurate bedside procedures with relatively low cost. The method must be reproducible, allowing repeated or continuous measurements. Recently, several techniques meeting these requirements have been developed: transcranial Doppler (TCD) (Aaslid et al., 1982), jugular bulb oximetry (SjO2) using optical fibers (Prough, 1991), and near-infrared cerebral spectroscopy (MRS) (Prough, 1991; Simonson and Piantadosi, 1995). These techniques, however, do not measure true flows but indices that can be related to flow changes. Therefore, we were interested in continuous thermodilution, described many years ago for the measurement of coronary sinus blood flow (Ganz et al., 1971). This method meets the above-mentioned requirements and has been occasionally used to measure jugular blood flow (JBF) (Van der Linden et al., 1991; Wilson and Halsey, 1970). However, this technique has neither been automated using a computer nor validated by comparison with the Kety-Schmidt reference method.
MATERIALS AND METHODS
Patients
Fifteen consecutive comatose patients, seven women and eight men, were studied according to a protocol that was approved by the Committee of Medical Ethics of our institution. The etiology of the coma, the Glasgow coma scale (Teasdale and Jennett, 1974), the Glasgow outcome scale (Jennett and Bond, 1975), and the anthropometric data are summarized in Table 1. All the patients were mechanically ventilated through an endotracheal tube, using a time-cycled 900 C servoventilator (Elema, Sölna, Sweden). The patients were sedated with midazolam or morphine sulfate and were given pancuronium bromide to optimize ventilatory control during the protocol. Drugs and fluids were determined by the attending physician and were not modified during the study.
Anthropometric data of 15 patients in coma
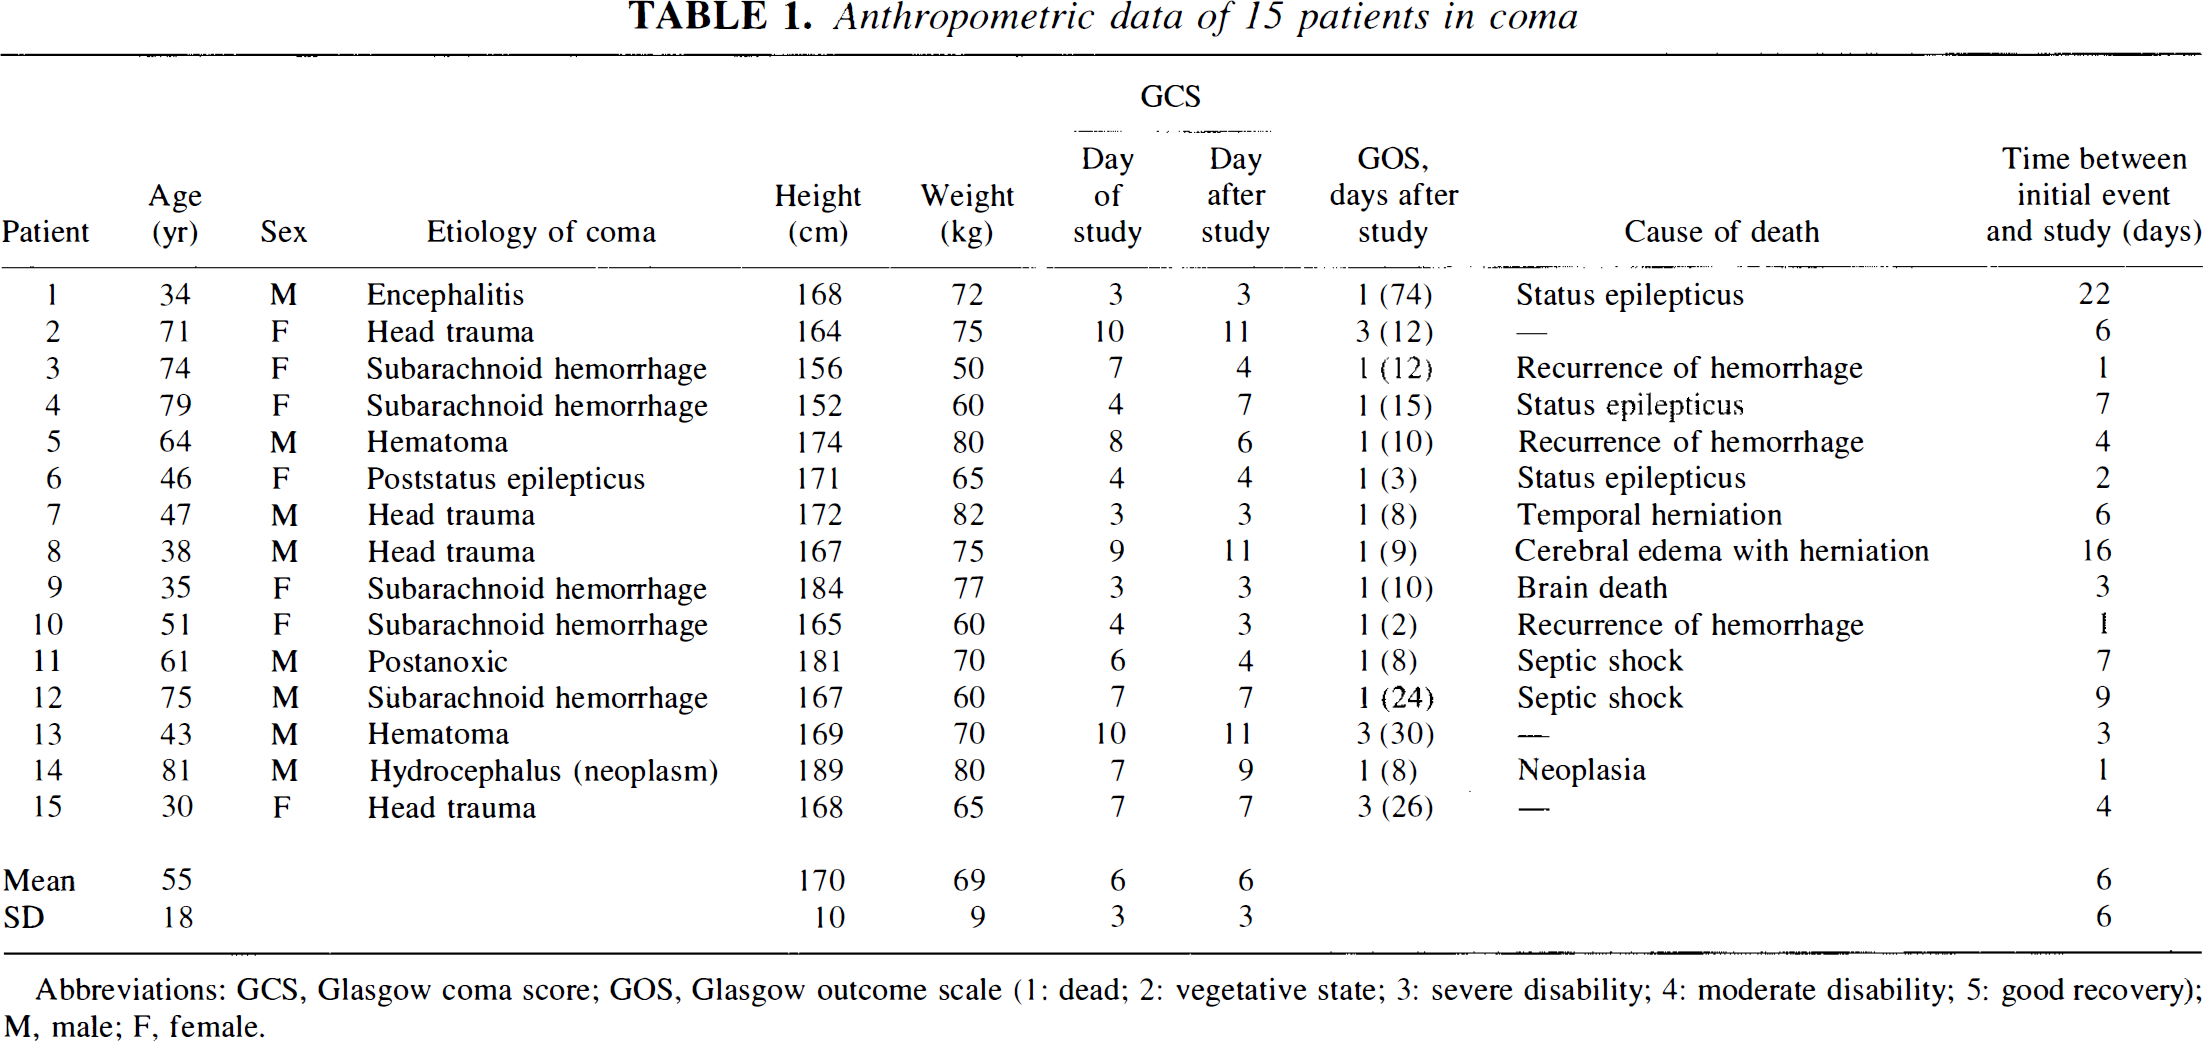
Abbreviations: GCS, Glasgow coma score; GOS, Glasgow outcome scale (1: dead; 2: vegetative state; 3: severe disability; 4: moderate disability; 5: good recovery); M, male; F, female.
Procedures
A small polyethylene catheter was inserted into a radial artery for therapeutic purposes.
Arterial and jugular bulb blood gases and hemoglobin saturations were measured using the ABL500 blood gas system and the OSM3 Hemoximeter (Radiometer, Copenhagen, Denmark).
The jugular blood flow was measured using continuous thermodilution (Fig. 1). Briefly, a fluid miscible with blood and at a lower temperature was in injected into the jugular bulb at a constant rate and the resulting change in temperature detected in a short distance downstream (25 mm). Conventionally this fluid has been referred to as the indicator, although from a rigorous scientific standpoint it is the cold (negative heat) that is the indicator, the injectate being only the vehicle for its introduction into the bloodstream. A continuous thermodilution catheter (CCS-7U-90B 7 Fr or Pepine Reiz 2.5 cm 8 Fr; Webster Laboratories, Baldwin Park, CA, U.S.A.) was inserted percutaneously in the jugular bulb of the patient using the technique of Jakobsen and Enevoldsen (1989). An introducer was inserted retrogradely into the internal jugular vein and the catheter was subsequently advanced until no further progression due to a palpable resistance was possible. With this procedure the tip was estimated to be located in the jugular bulb. The correct location of the tip was checked by x-ray examination in the first five patients. Thereafter, the major part of the introducer was removed from the vein and the catheter fixed by a bandage. The inclination of the head was set at +30°, and the position of the head was not changed throughout the study. We automated the technique of computation by connecting the temperature recorder box (Triple Channel Flowmeter CF-300, Webster Laboratories) of the thermodilution catheter to a computer through an analog/digital converter (RTI 800, Analog Device, Norwood, MA, U.S.A.). A program was written to compute instantaneously the blood flow when the temperature variation is recorded during the infusion of the indicator (Fig. 1). With the computerized procedure, a CBF measurement takes at most 40 s and the volume of indicator infused is 20 ml. The computation of flow is based on the assumption that the heat lost from the system between the site of injection and the site of detection is negligible and, therefore, that the heat loss by the blood equals the heat gained by the indicator.
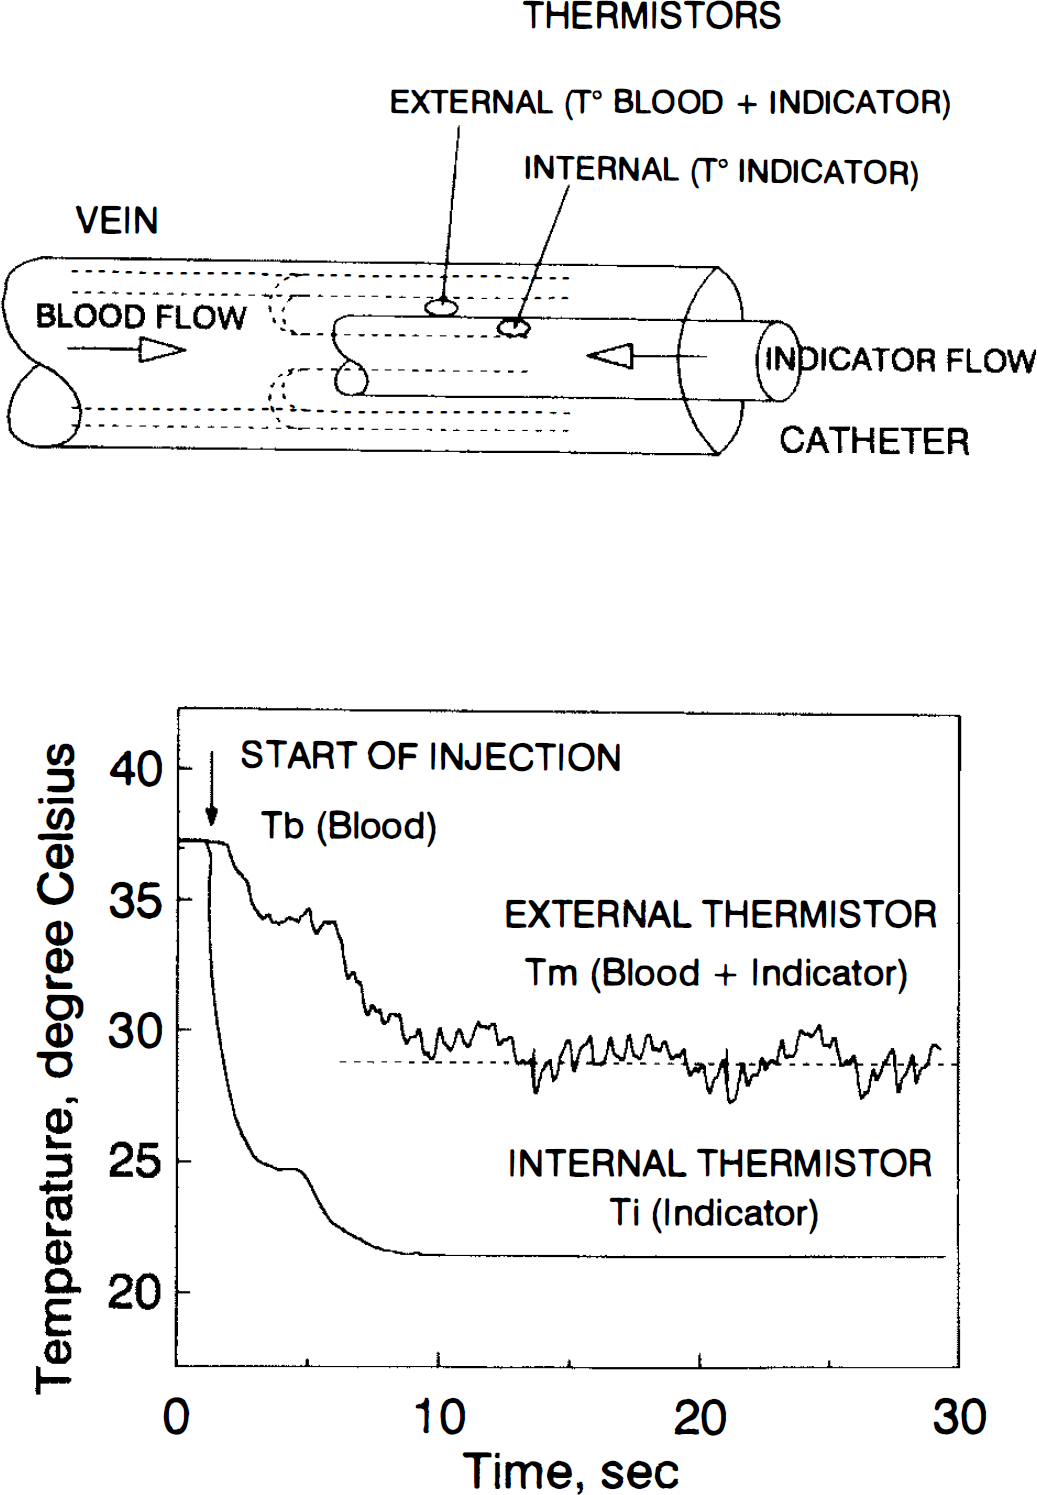
Principle of the continuous thermodilution. Upper diagram: the catheter inside the jugular vein with the two thermistors. Lower diagram: temperature curves recorded by the internal and external thermistors.
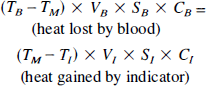
Let VB and VI, be the volumes (in milliliters) of blood and indicator, respectively, participating in the process of mixing and heat exchange during a finite period; TB, T1, and TM, the temperature of blood, indicator, and mixture of blood plus indicator, respectively, in degrees Celsius; SB and SI, the density of blood and indicator, respectively, in grams per cubic centimeter; and CB and CI, the specific heat of blood and indicator, respectively, in calories per gram per degree Celsius. The heat exchanged between the blood and indicator can then be expressed by the following equation:
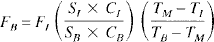
From Eq. 1, if time is taken into consideration, volumes VB and VI, in the formula can be transformed into flows FB and FI (in milliliters per minute) of blood and indicator respectively. FB can be computed as:
When saline is used as indicator:
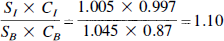
The product SB × CB is virtually constant over a range of hematocrit from 30% to 60% because the change in SB is balanced by a proportional change in CB in the opposite direction (Fronek and Ganz, 1960).
Since mixing of blood and indicator must be attained by the kinetic energy of the injectate, the rate of injection of indicator is of critical importance to the accuracy of measurements. The injection rate has been estimated to be at least 10% of the flow to be measured (i.e., 30 ml min−1 for a flow rate of 300 ml min−1) (Ganz et al., 1971). For JBF measurements, saline was used as indicator and was injected at a rate of 38 ml min−1 using a heavy duty infusion pump (model 940, Harvard Apparatus, South Natick, MA, U.S.A.).
The in vitro accuracy and precision of the thermodilution technique were first checked by comparing flow measured by thermodilution with volumetric flow in a circuit made of a Tygon tube (internal diameter of 8 mm) with saline at 37°C flowing through the tube, using a peristaltic pump (Juglabo U3 pump, Juglabo Labortechnik, Seelbach, Germany). Each measurement was repeated six times at eight preset volumetric flows ranging from 50 to 900 ml min−1. Saline at room temperature was used as indicator. The injection rate was 38 ml min−1 (50–4% of the flow).
Cerebral blood flow (CBF) was also measured using the Kety-Schmidt reference method (CBFKS) with nitrous oxide (N2O) as the indicator (Fig. 2). For the measurement of CBFKS, 10% of N2O was introduced into the patient's inspired gases and 10 timed samples of arterial and jugular bulb blood were collected during the first 12 min of N2O saturation. N2O was measured in arterial and jugular blood samples by gas chromatography (Ladron de Guevara et al., 1987). Briefly, blood samples were equilibrated during 45 min with pure nitrogen in the syringe used for blood sampling to allow diffusion of N2O in the gaseous phase. Thereafter, N2O concentration was measured in the gas phase by gas chromatography with an electron capture detector (HP gas Chromatograph 5890, Hewlett Packard, Palo Alto, CA, U.S.A.). Knowing the blood-gas partition coefficient for N2O (0.471) (Kety, 1951), the volume of blood sample (4 ml), and the volume of nitrogen (16 ml), we can compute the in vivo concentration of N2O, Measurements for arterial and jugular bulb concentrations were fitted using a best-fit double-exponential curve defined by least squares to allow computation of the area between the two curve [(A — V)dt] CBFKETY was computed in a customary manner:
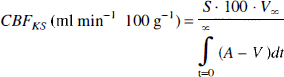
where S is the N2O blood-brain tissue partition coefficient (1.06) (Kety et al., 1948), V∞ the jugular venous blood N2O concentration when the concentrations reach a plateau (at most at the 20th min), and (A — V)dt the area between the arterial and venous N2O concentration curves. Figure 2 shows an example of CBF calculation.
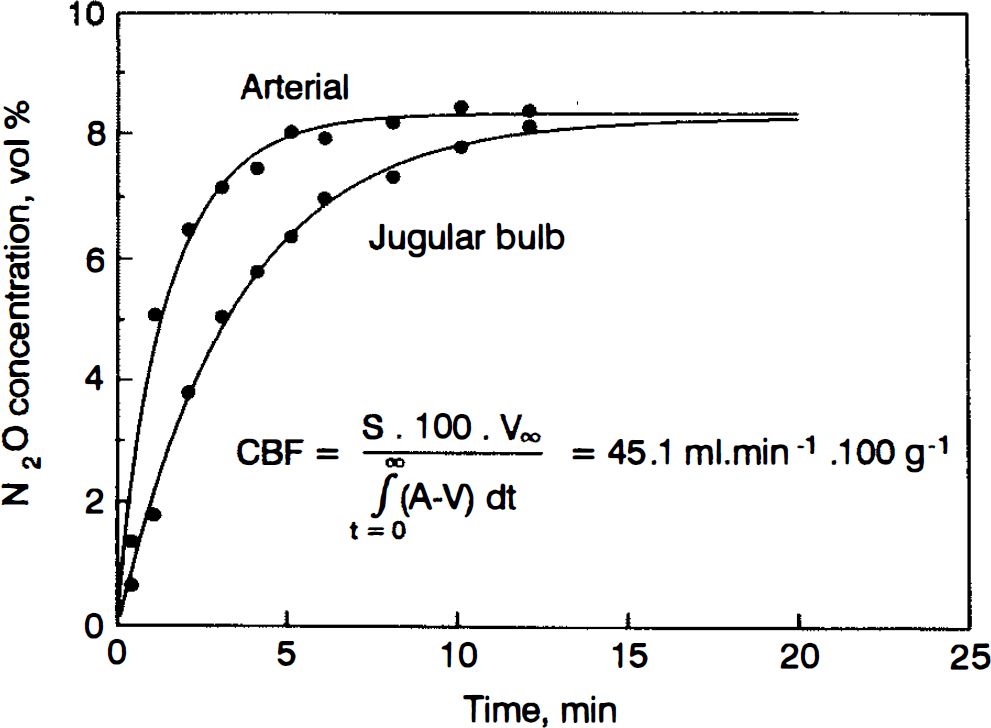
Arterial and jugular bulb blood concentrations of nitrous oxide in a patient during the inhalation of 10% nitrous oxide in air/oxygen. Each dot represents the actual concentration of nitrous oxide in blood. The solid lines represent the least-square best fit using a double-exponential curve extrapolated up to 20 min to obtain a plateau for the venous concentration.
To allow comparison with CBF expressed in milliliters per minute per 100 g, JBF measured by thermodilution, which reflects the venous outflow of one hemisphere, was doubled and divided by brain weight/100:
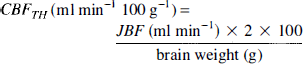
where the brain weight was estimated as k* height (centimeters) with k = 8.3 for male and k = 8.0 for female (Spann and Dustmann, 1965).
Protocol
When a unilateral hemispheric brain lesion was observed at the CT scan, the jugular catheter was placed on that side. If bilateral hemispheric brain lesions were observed, the catheter was placed on the right side. The catheter was placed on the left side in five patients, and on the right side in ten. CBF determined by the Kety-Schmidt method and CBF by the jugular thermodilution technique were measured in each patient at four levels of PaCO2 (25, 30, 35, and 40 mm Hg) by adding CO2 in the inspiratory circuit of the ventilator with ventilation kept constant. At each level of PaCO2, hemodynamic variables and blood gases were also measured.
Statistical analysis
The results are expressed as mean ± standard deviation (SD). Statistical analysis consisted of an analysis of variance for repeated measures. When the F ratio reached the significance level (p < 0.05), pairwise comparisons were performed using modified t tests (Winer, 1971). Correlation and least squares linear regression were calculated when indicated. Comparison of two methods measuring the same variable were also compared using the graphical method proposed by Bland and Altman (1986). To take into account that the measures were repeated four times in each patient, we used the method described by Poon (1988) to pool repeated measurements pertaining to several subjects.
RESULTS
Validation of technique
In vitro measurements showed that continuous thermodilution was an accurate and precise method to measure flow (coefficient of variability between 1.21 and 2.50%) (Fig. 3).
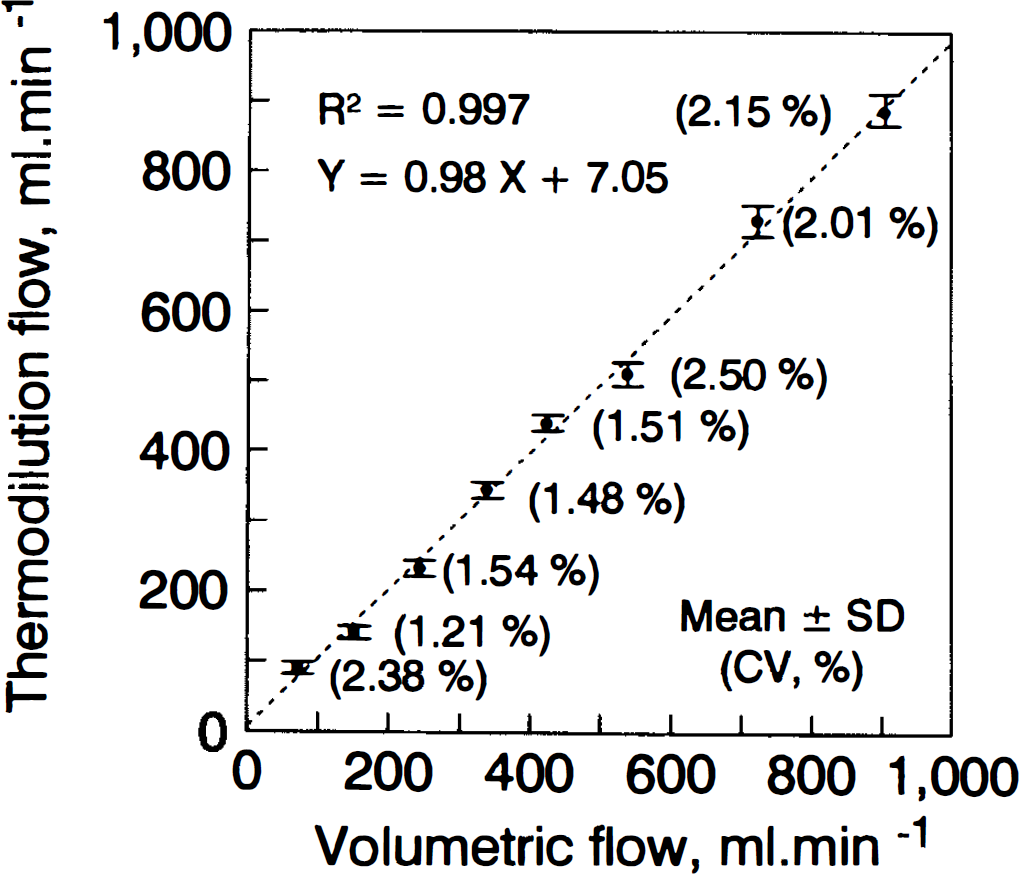
In vitro accuracy and precision of the measure of flow by thermodilution compared with volumetric flow.
The two methods were also compared using the graphical technique proposed by Bland and Altman (1986). Briefly, this technique is based on graphical methods using the plot of the difference between the two measures versus the mean of the two measures. The mean difference for the entire set of measurements reflects the agreement between the two methods and allows detection of bias of one method when compared with a gold standard. In addition, a 95% confidence interval can be computed as the mean difference ± 2 SD (see Figs. 4 and 6). The mean difference (i.e., the bias) for flow varying from 50 to 900 ml min−1 is −1 ± 18 ml min−1 (Fig. 4). These results confirm the good agreement between the two methods.
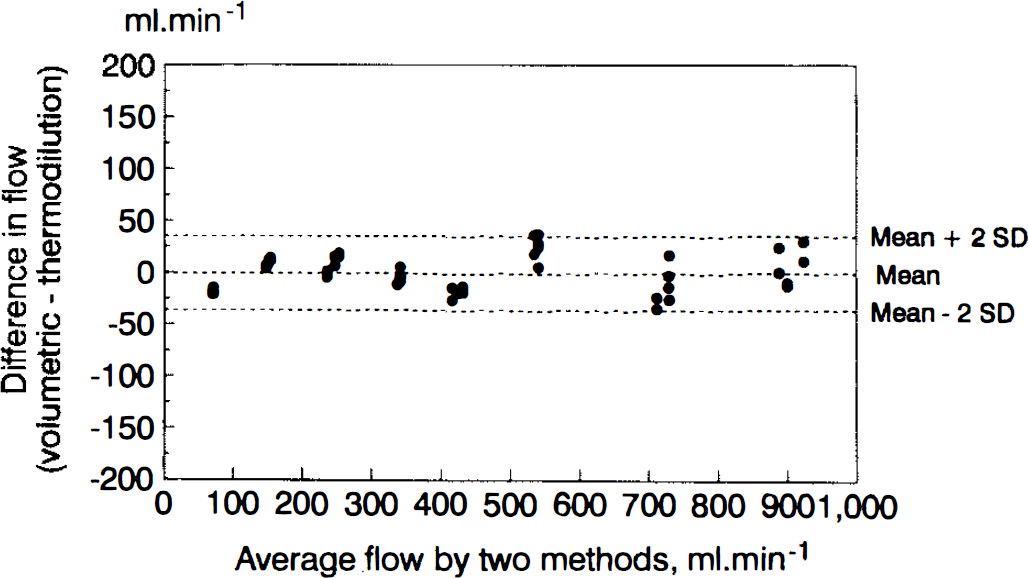
Agreement between flow measured by thermodilution and volumetric flow using Bland and Altman (1986) diagram. The mean difference is −1 ± 18 ml min−1 (mean ± SD).
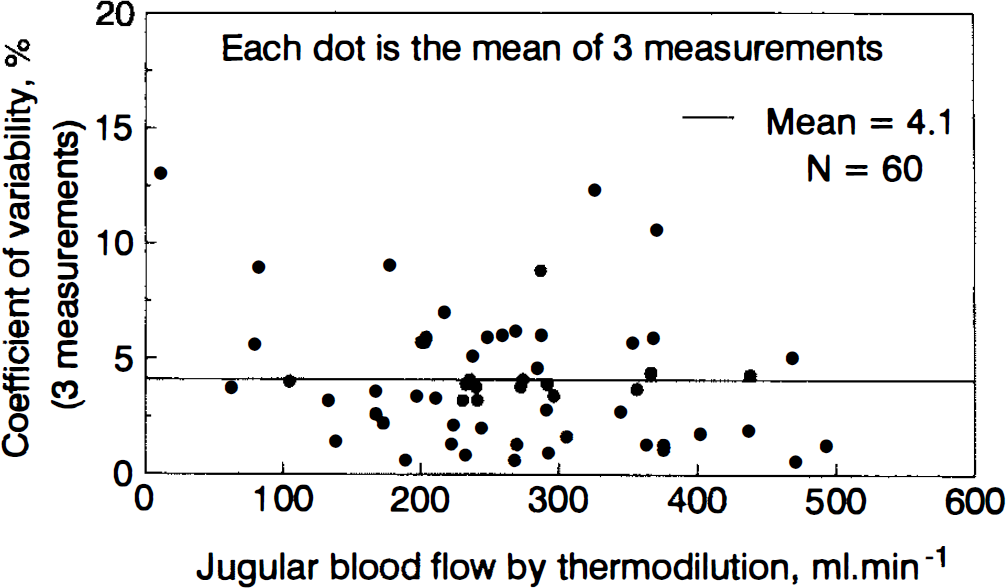
In vivo coefficient of variability for 60 triplicate measurements of jugular blood flow.
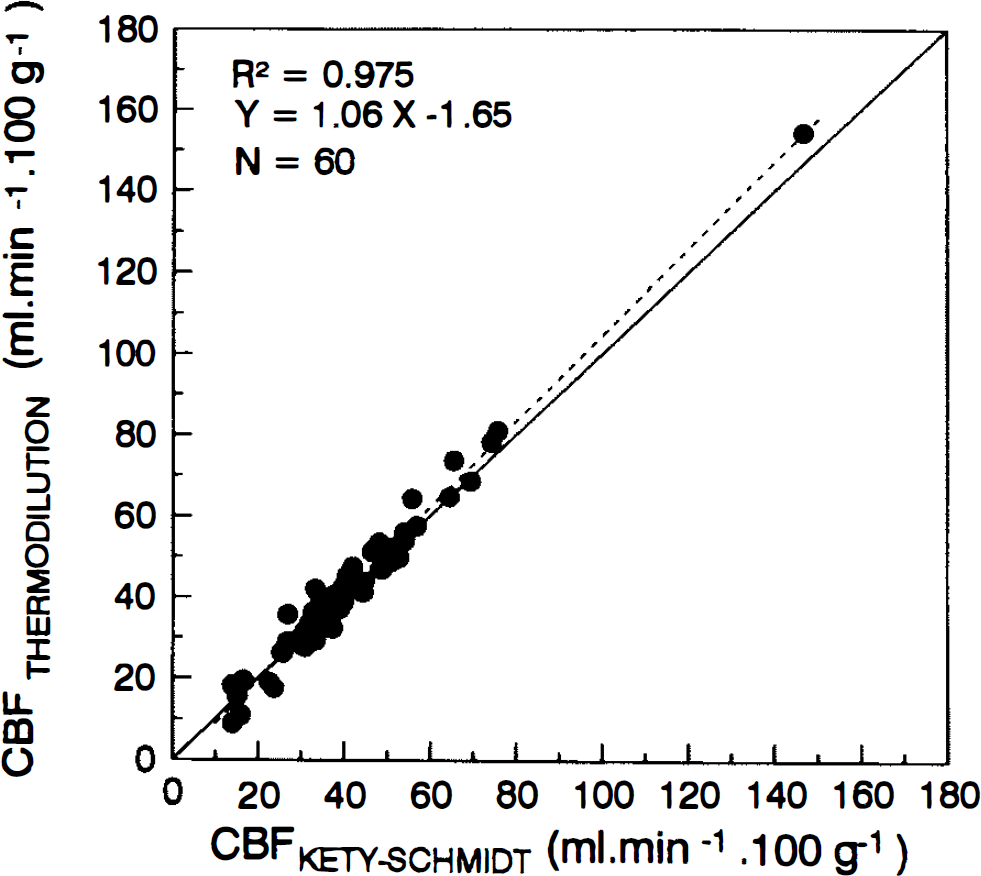
Comparison of CBF measured by Kety-Schmidt and thermodilution methods at PaCO2 25, 30, 35, and 40 mm Hg in 15 patients. The solid line is the line of identity and the dashed line is the regression line for the 60 measures.
In vivo precision was computed using the coefficient of variability (CV = 100 · SD/mean) for triplicate measurements performed at four levels of PaCO2 in the 15 patients (mean CV for 60 measures = 4.1%) (Fig. 5).
CBF measured at four levels of PaCO2 in each patient by the Kety-Schmidt and the thermodilution methods gave an excellent correlation with the regression line (dashed line) not different from the line of identity (solid line) (Fig. 6).
The two methods were also compared using the graphical technique proposed by Bland and Altman (1986). The mean difference (i.e., the bias) for CBF is −0.9 ± 3.6 ml min−1 100 g−1 (Fig. 7). These results confirm the good agreement between the two methods.
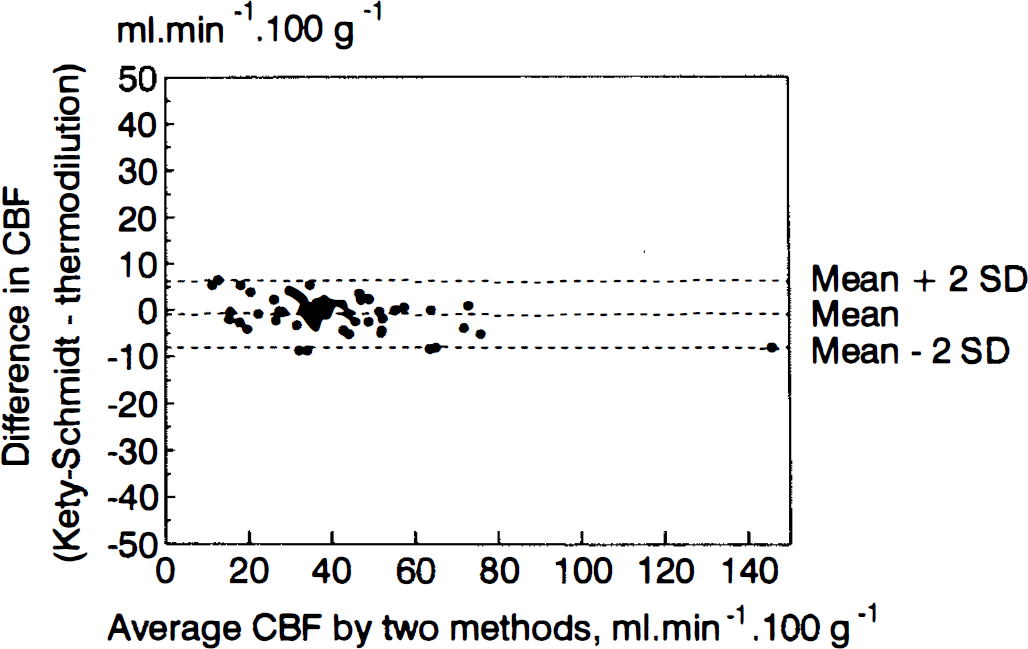
Agreement between cerebral blood flow measured by thermodilution and Kety-Schmidt methods using Bland and Altman (1986) diagram. The mean difference is −0.9 ± 3.6 ml min−1 100 g−1 (mean ± SD).
Cerebral metabolic changes in response to changes in CBF
CMRO2 in our patients (between 1.68 ± 0.98 and 1.87 ± 0.97 ml min−1 100 g−1) is lower than that measured in normal subjects (3.3 ± 0.2 ml min−1 100 g−1 for CBF 56.8 ± 5.6 ml min−1 100 g−1 in the awake state, and 2.46 ± 0.27 ml min−1 100 g−1 during anesthesia) (Van der Linden et al., 1991). The lower value in the present study is probably due to the severe brain damage of the patients as assessed by the GCS (Table 1).
Reduction in CBF induced by the decrease in PaCO2 leads to no change in CMRO2 due to an increased cerebral extraction for oxygen (Table 2). This increase in cerebral extraction for oxygen is reflected by the huge decrease in jugular bulb oxygen saturation from 75 ± 10 to 55 ± 13%.
Effects of PaCO2 on cerebral hemodynamics, and arterial and jugular blood gases in 15 comatose patients
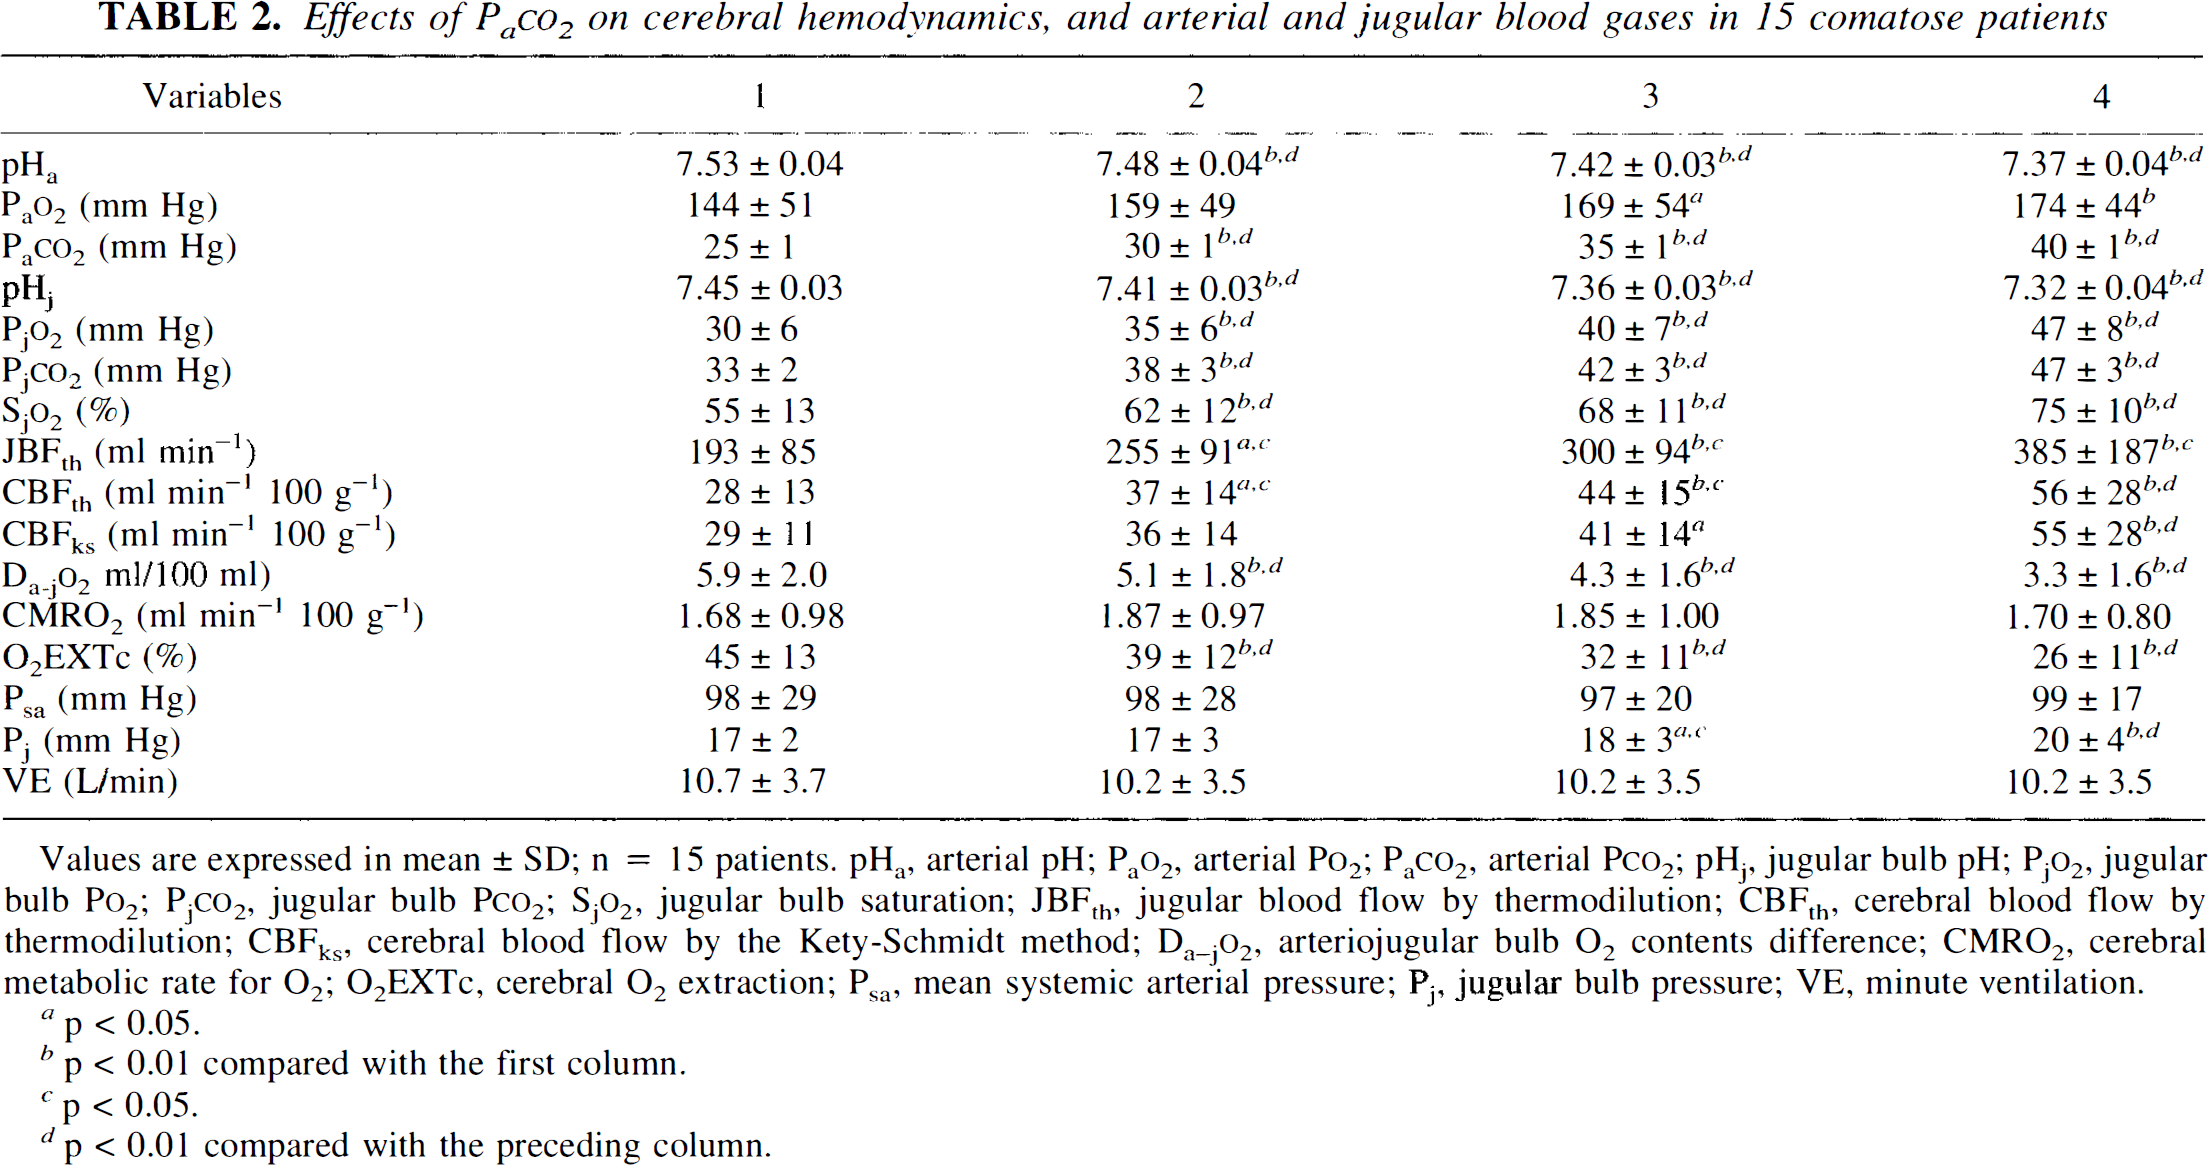
Values are expressed in mean ± SD; n = 15 patients. pHa, arterial pH; PaO2, arterial PO2; PaCO2, arterial PCO2; pHj, jugular bulb pH; PjO2, jugular bulb PO2; PjCO2, jugular bulb PCO2; SjO2, jugular bulb saturation; JBFth, jugular blood flow by thermodilution; CBFth, cerebral blood flow by thermodilution; CBFks, cerebral blood flow by the Kety-Schmidt method; Da-jO2, arteriojugular bulb O2 contents difference; CMRO2, cerebral metabolic rate for O2; O2EXTc, cerebral O2 extraction; Psa, mean systemic arterial pressure; Pj, jugular bulb pressure; VE, minute ventilation.
p < 0.05.
p < 0.01 compared with the first column.
p < 0.05.
p < 0.01 compared with the preceding column.
Effect of increased inspired PCO2 on arterial oxygenation
Arterial PO2 increases from 144 ± 51 to 174 ± 44 mm Hg when PaCO2 increases with no changes in minute ventilation nor in cardiac output. Inspired CO2 has been shown to improve arterial oxygenation mainly by reducing dead space ventilation and, to a smaller extent, the Bohr effect and improvement in ventilation-perfusion relationships (Domino et al., 1993; Swenson et al., 1994).
Cerebral CO2 vasoreactivity
In human cerebral circulation, an acute increase in PaCO2 leads to a 2–6% increase in CBF (Olesen et al., 1971; Tominaga et al., 1976) per millimeter of mercury change in PaCO2. The carbon dioxide reactivity usually is best described by an exponential curve in the physiological range of PaCO2 (Olesen et al., 1971; Tominaga et al., 1976). In the present study, a normal response of CBF to increase in PaCO2 was defined as a significant exponential In CBF:PaCO2 relationship (R > 0.900, p < 0.05 for four points, one-sided t test) with a slope above 0.02. This value was chosen as the lower bound of the 95% confidence interval for the normal values (0.06 ± 0.04, mean ± 2 SD) measured in 16 subjects (Tominaga et al., 1976). Among the 15 comatose patients, 11 had a significant exponential In CBF:PaCO2 relationship, among which 10 had a normal CO2 vasoreactivity.
DISCUSSION
The results of the present study suggest that the jugular blood flow measured by continuous thermodilution is a precise and accurate method to estimate cerebral blood flow. Moreover, this technique allows frequently repeatable measurements at the bedside.
The percutaneous retrograde cannulation using the Seldinger technique (Seldinger, 1953) and the anterior method described by Jakobsen and Enevoldsen (1989) is an easy procedure and allows an indwelling catheter to remain in situ for the duration of the study. We evaluated prospectively the complications due to the catheter in our patients. In one patient the internal carotid artery was punctured, creating a small hematoma without other complication. In two other patients the internal jugular vein was punctured at the second attempt. In one patient, at the removal of the catheter a small clot was observed at the tip of the catheter without jugular vein thrombosis. The high mortality rate observed in our series cannot be attributed to the procedure but to the severity of the brain damage. Moreover, the mean Glasgow coma score (GCS) was similar the day after the study, and death occurred at a mean of eleven days after the study (Table 1).
The Kety-Schmidt technique has been validated against the bubble flowmeter (Kety and Schmidt, 1948). Interestingly, if we apply the Bland and Altman method to the data comparing the bubble flowmeter and the Kety-Schmidt method in rhesus monkeys, we obtain a mean difference of 3.1 ± 5.4 ml min−1 100 g−1 (mean ± SD), indicating a slight underestimation of flow by the Kety-Schmidt procedure. If we assume a monkey brain weight of 90 g in mean (Dumke and Schmidt, 1943), these figures indicate that the thermodilution, when compared with a volumetric flow, is more precise and more accurate than the Kety-Schmidt method (Fig. 4).
The duration of administration of nitrous oxide to ensure blood-brain equilibrium has also been a source of controversy (Lassen and Klee, 1965; Sharples et al., 1991). It is clear from a theoretical standpoint that the period required is dependent upon the cerebral blood flow (Lassen and Klee, 1965; Sharples et al., 1991). In our patients we administered N2O for 12 min. If the cerebral venous concentration of N2O is found not to be equal to the arterial concentration at the end of the measurement period, the venous curve is extrapolated (Lassen and Klee, 1965; Sharples et al., 1991) to within 5% of the arterial value using a best-fit double-exponential curve defined by least squares. Nevertheless, the Kety and Schmidt method has been reported to be flawed for low CBF. On the other hand, if we refer to the in vitro calibration curve (Fig. 3), the continuous thermodilution is accurate even for very low flow.
Continuous thermodilution was first described for the measurement of coronary sinus blood flow (Ganz et al., 1971). Continuous infusion was chosen in preference to bolus injection because it facilitates the computation (measurement of temperature levels rather than an area under the thermodilution curve). The validity of equation 2 (see Methods) assumes: (a) that there is adequate mixing between the tip of the catheter where the indicator comes into bloodstream and the site of the measurement of the temperature of the blood-indicator mixture (external thermistor, Fig. 1), (b) that the blood temperature remains constant during the measure, (c) that the indicator temperature at entry into the bloodstream is known accurately, and (d) that there is negligible net heat exchange from blood mixture to vessel walls between the tip of the catheter and the site of the measurement of the temperature of the blood-indicator mixture. To obtain a good mixing with minimal heat loss through the vessel walls, the distance between the tip and the external thermistor must be adequate, i.e., sufficiently long to allow heat exchange between indicator (i.e., good mixing) and not too long to minimize heat loss through the vessel walls. The anatomical requirement of injection in the jugular bulb and the external thermistor above the junction with the common facial vein constrains the distance to about 3 or 4 cm maximum. In vitro experiments have shown that a distance of 25 mm (catheters used in the present study) is usually adequate when the injection rate is above 25 ml min−1 to minimize heat loss and to obtain an adequate mixing (Wilson and Hasley, 1970). Ideally the injection rate should be at least 10% of the flow to be measured (Ganz et al., 1971). However, in vitro experiments of the present study showed that injection rates between 50% and 4% of the flow to be measured gave accurate measurements of flow ranging between 50 and 900 ml min−1 (Fig. 3). These flows correspond to JBF equivalent to CBF between 7 and 140 ml min−1 100 g−1, the extreme values measured in our patients. The constant temperature of the blood is a reasonable assumption for the short period of time for one measurement. The temperature of the indicator is measured accurately owing to the location of the internal thermistor.
JBF measures hemispheric CBF, and because of the confluence of sinuses, it is really a global measure of CBF (Young and Ornstein, 1994). There is contamination from the contralateral hemisphere and each bulb represents roughly one third of the contralateral hemisphere drainage in normal subjects (Shenkin et al., 1948). An average of 2.7% (range 0–6.6%) of the blood in the jugular bulb is derived from extracerebral structures (Shenkin et al., 1948). Wilson et al. (1972) measured jugular blood flow on both sides by thermodilution and found a good agreement within 12–15% when compared with total cerebral blood flow measured by the dye dilution method. These results are in agreement with the study of Meyer et al. (1963), in which internal jugular flow measured with an electromagnetic flowmeter and extrapolated to flow per unit of mass was compared with predicted values from the nitrous oxide method. These results suggest that venous outflow via the emissaries and vertebral venous plexus was relatively small. This is at variance with the study of Epstein et al. (1970), who, by angiographic studies, demonstrated a substantial outflow in the vertebral venous plexus in upright rhesus monkeys. Eckenhoff (1966) and Shenkin et al. (1948) made similar observations in man. However, Epstein et al. (1970) and Eckenhoff (1966) pointed out that this outflow was reduced in the supine position. Therefore, it can be concluded that the venous jugular blood flow is slightly contaminated by extracerebral blood and can be considered as a reliable indicator of CBF.
CBF is normally tightly coupled to the rate of cerebral metabolism, a phenomenon commonly referred to as metabolic autoregulation (Bouma and Muizelaar, 1992). In our patients in steady-state conditions, once CMRO2 has been set to the metabolic demand, reduction in CBF induced by the decrease in PaCO2 leads to no change in CMRO2 with an increased cerebral extraction for oxygen. However, outside physiologic ranges of PaCO2, a change in CBF induced by CO2 vasoreactivity leads to changes in CMRO2 (Yang and Krasney, 1965; Cold, 1989).
Cerebral vasoreactivity to carbon dioxide is defined as the physiological increase of cerebral blood flow to increases in arterial PCO2. In human cerebral circulation, an acute increase in PaCO2 leads to a 2–6% increase in CBF (Olesen et al., 1971; Tominaga et al., 1976) or in the middle cerebral artery flow velocity (Markwalder et al., 1984) per millimeter of mercury change in PaCO2. The shape of the CBF:PaCO2 curve in animal experiments was found to be sigmoid when including rather extreme PaCO2 values (Reivich, 1964). Using only the interval 20–60 mm Hg, it has been found to fit a straight line with reasonable accuracy in normal man (Alexander et al., 1964). However, more recent data suggest that the carbon dioxide reactivity usually is best described by an exponential curve in the physiological range of PaCO2 in animals (Waltz, 1970) as well as in humans (Olesen et al., 1971; Tominaga et al., 1976; Markwalder et al., 1984). In severe head trauma, interesting information can be obtained from CO2 vasoreactivity tests (Fieschi et al., 1974; Messeter et al., 1986; Schalen et al., 1991; Nordstrom et al., 1988). The clinical impact of hypocapnic CO2 reactivity seems to be considerable, since the loss of cerebral CO2 vasoreactivity is associated with a poor outcome in head trauma (Schalen et al., 1991). Furthermore, knowledge of the integrity of the CO2 response is helpful in determining the potential effectiveness of hyperventilation and/or barbiturate therapy for control of raised intracranial pressure in individual patients (Nordstrom et al., 1988). In our patients, ten had normal CO2 vasoreactivity while five had an altered response of CBF to increase in PaCO2. Among the ten subjects with normal response, two are still alive and one patient with altered response survived. However, no definite conclusion can be drawn from this small number of patients.
In conclusion, the jugular continuous thermodilution technique is a reliable method for estimating CBF at the bedside in patients in coma. This technique allows repeated measurements and is easy to perform over a short period of time in the intensive care setting. In addition, the catheter in the jugular bulb allows for blood sampling and brain metabolic studies.
Footnotes
Abbreviations used
Acknowledgment:
The authors are grateful to Mrs. Pascale Jespers for her technical assistance. They are also indebted to the nurses and the technicians of the intensive care department.