
Abstract
In vitro and in vivo parameters of flumazenil (FMZ) binding were measured in spiking and nonspiking neocortex identified by intraoperative elcctrocorticography in epileptic patients who underwent cortical resection for seizure control. In vitro measures of receptor affinity (KD), number (Bmax) and laminar distribution for [3H]-FMZ binding in the epileptic focus (n = 38) were compared to nonspiking cortex from a subgroup of the patients (n = 12) and to tissue obtained from trauma patients (n = 5). The in vitro binding parameters were compared to in vivo [11C]-FMZ binding measured with positron emission tomography (PET) (n = 19). The Bmax was higher in the 38 spiking tissues as compared to the 12 nonspiking tissues (P = .012). Paired comparison of spiking versus nonspiking binding in the 12 patients from whom nonspiking tissue was available showed increases in both KD (P = .037) and Bmax (P = .0047) in spiking cortex. A positive correlation was found between KD and Bmax values for 38 patients (r = 0.55, P < .0001), the magnitude of the KD increase being twice that of the Bmax increase. In addition, there was a significant correlation between the asymmetry indices of the in vivo FMZ binding on PET and in vitro KD of spiking cortex (n = 19, r = 0.52, P = .02). The laminar distribution of [3H]-FMZ showed increased FMZ binding in cortical layers V-VI in spiking cortex compared to nonspiking and control cortex. The increased receptor number in spiking cortical layers V-VI may be a compensatory mechanism to decreased GABAergic input. The increased Bmax in spiking cortex was accompanied by a larger decrease in the affinity of FMZ for the receptor suggesting that decreased FMZ binding in the epileptic focus measured with PET is due to a decrease in the affinity of the tracer for the receptor.
Gamma-aminobutyric acid (GABA) is the major inhibitory neurotransmitter in the human brain, and its action is mediated in part by the GABAA-benzodiazepine receptor (BDZ-R) complex. Positron emission tomography (PET) studies using [11C]-flumazenil (FMZ), a BDZ-R antagonist (Frey et al., 1991), have shown reduced BDZ-R binding in epileptic foci of patients with partial epilepsy (Savic et al., 1988, 1995; Henry et al., 1993; Koepp et al., 1996, 1997; Szelies et al., 1996). In medial temporal lobe epilepsy, decreased hippocampal FMZ binding has been found consistently both in vivo with PET as well as in vitro (Koepp et al., 1996, 1997; Johnson et al., 1992; Olsen et al., 1992; Burdette et al., 1995; Hand et al., 1997). FMZ PET has proven also to be a sensitive method for visualizing neocortical epileptic foci (Savic et al., 1995; Richardson et al., 1996). In vitro studies of BDZ-R in surgically resected human epileptic neocortex have revealed inconsistent findings (Sherwin et al., 1986; Lloyd et al., 1990; Olsen et al., 1992; Burdette et al., 1995). For example, Olsen et al. (1992), using [3H]-FMZ quantitative autoradiography, found no significant difference in FMZ binding between epileptic neocortex and controls, whereas Burdette et al. (1995) reported a significant increase of BDZ-R binding in layer V-VI of epileptic temporal neocortex. This latter finding is consistent with those from some animal models showing increased GABA receptor density in epileptic cortex (Ross and Craig, 1981; Booker et al., 1986; Craig and Colasanti, 1986). However, Burdette et al. (1995) did not include receptor affinity measurements in their analysis of human tissue. Such measures would be important because in vivo studies have shown that reduced FMZ binding in the neocortex is not only able to localize epileptic foci, but the degree of binding asymmetries of homologous areas may be also a sensitive marker of the severity of epileptic dysfunction (Savic et al., 1996).
Previous in vitro BDZ-R binding studies reported the binding in homogenized cortex or in the entire thickness of the cortex, providing average values for cortical BDZ-R binding. However, BDZ-R binding shows a characteristic laminar distribution within the human cortex (Zezula et al., 1988). Because some cortical layers can have a prominent role in the generation and propagation of seizures (Connors, 1984; Telfeian and Connors, 1998), a change in the laminar distribution of BZD-R could have an impact on epileptogenesis. Olsen et al. (1992) have reported a patient with altered laminar pattern of the immunocytochemical distribution of GABAA receptors in the epileptic hippocampus, and suggested that synaptic rearrangement could have contributed to the epileptic circuitry. Mathern et al. (1997) have found increased staining of hippocampal GABAergic terminals and glutamic acid decarboxylase immunoreactivity (GAD; the synthesizing enzyme for GABA) in the kindling model of limbic status epilepticus suggesting that synaptic reorganization of inhibitory (and excitatory) systems probably contributes to or generates chronic limbic seizures. No such findings of receptor redistribution have been reported yet for the human epileptic neocortex.
The present study reports in vitro and in vivo analyses of BDZ-R in epileptic neocortex of a large group of medically refractory epileptic patients (N = 38) in comparison to control subjects. In addition, in a subset of the epileptic group (N = 12), in vitro BZD-R density, affinity and laminar distribution were measured in the spiking and nonspiking neocortical samples obtained from the same patient. Furthermore, we compared in vitro and in vivo parameters of cortical FMZ binding for patients in which both measures were available (N = 19).
METHODS
Subjects
Patient group
Thirty-eight patients (22 males and 16 females; mean age, 11.9 years, SD ± 12.4; age range, 1 month to 47 years) who underwent neocortical resection for treatment of medically refractory epilepsy were subjects in this study. This study was performed in compliance with the Human Investigation Committee at Wayne State University.
Control group
Control tissue samples were obtained from five men (mean age, 43.8 years; age range, 18 to 68 years) with traumatic brain injury who underwent cranial neurosurgery because of contusion (n = 4) or subdural hematoma (n = 1) 6 to 57 hours after the accident. None of them had seizures before or after the trauma and none of them was using medication before the accident. The resected brain tissue was carefully examined and only those samples that showed no macroscopic or microscopic abnormalities (e.g., signs of mechanical damage or hemorrhage) were used.
Intraoperative electrocorticography
All 38 epileptic patients underwent intraoperative electrocorticography (ECoG) recording under general anesthesia (using nitrous oxide and isoflurane). The subdural electrode placements were guided by scalp ictal EEG, magnetic resonance imaging, and 2-deoxy-2[18F]-fluoro-D-glucose (n = 38) as well as FMZ (n = 19) PET data. At least 10 minutes of ECoG recording was performed in each case. Use of anesthesia was decreased when background EEG activity was attenuated and/or epileptiform activity was scanty. The position of the subdural electrodes, and the location of the active spiking and nonspiking electrodes were recorded. When epileptiform activity was detected at the edges of the electrode plates, additional coverage was applied. The spiking area was defined as neocortex showing at least 10 spikes/min during the ECoG. Nonspiking areas were defined as cortical areas under the electrodes showing no epileptiform activity, separated by at least 2 cm from a spiking region.
In vitro FMZ binding studies
All tissue samples were obtained from the lobe containing the epileptic focus (26 temporal, 6 frontal, 4 parietal, 2 occipital), resected according to standard clinical criteria. In 12 of 38 patients, the resection contained nonspiking cortex (8 temporal, 2 occipital, 1 parietal. 1 frontal) in addition to spiking cortex, allowing the paired comparison of in vitro FMZ binding in these cases. Resected tissue was marked with clips immediately after the resection to identify the spiking tissue based on the recorded electrode positions and ECoG data. Tissue from the control subjects was prepared and studied using the same protocol as tissues from epilepsy surgery but no ECoG was performed.
Tissue blocks were thawed to - 16°C, and sections were cut at 20 μm in a Leica cryostat (Meyer Instruments, Inc., Houston, TX). Quantitative autoradiography of [3H]-PMZ was performed essentially as described by Houser et al. (1988). Tissue sections were preincubated for 1 hour at 4°C in assay buffer (0.17 mol/L Tris-HCI, pH 7.4). Tissue was then incubated for 1 hour at 4°C in buffer containing [3H]-FMZ (New England Nuclear/Dupont, 70 Ci/mmol) at six different concentrations between 0.25 nmol/L and 10 nmol/L (three sections for each concentration). Nonspecific binding was measured in parallel assays containing 1 mmol/L clonazepam. Slides were washed, dried, and apposed to tritium-sensitive film (Kodak BIOMAX MR, Eastman Kodak Co., Rochester, NY, U.S.A.) in radiographic cassettes, together with tritium- embedded plastic standards (Amersham, Cleveland, OH, U.S.A.) calibrated against brain tissue containing varying concentrations of tritium for 2 to 4 weeks. Autoradiographic films were scanned with a Hewlett Packard ScanJet IICX/T (Palo Alto, CA, U.S.A.). Optical densities were measured for the standards and cortical regions of interest (ROI) using the ExplorerTest software package developed at the University of California at Los Angeles. The mean optical density of the values for at least three tissue sections for each ROI for each ligand concentration was obtained and converted to fmol/mg tissue using the standard curve. ROIs were drawn to include all cortical layers, and KD (receptor affinity; nmol/L) and Bmax (receptor density; fmol/mg tissue) values were calculated. The binding parameters were determined by linear regression of the Scatchard plot. The slope of the fitted line is equal to affinity or -1/KD, and the x-intercept is equal to the Bmax. In those 12 cases where spiking and nonspiking specimens were available, all steps of the in vitro binding protocol were performed in parallel for the sections from the same patient to minimize experimental variability.
Cortical laminar distribution of BDZ-R density
Optical density histograms for 12 spiking and corresponding nonspiking cortical samples were displayed from the scanned autoradiographic films using the ExplorerTest software package. The “start” and “end” points of the histograms were indicated on the surface on the cortex and the border of the grey and white matter (Fig. 1). For a better identification of these points, cortical slices from a high [3H]-FMZ concentration (5 nmol/L) were used. After calibration of the optical densities according to the standard curve, histograms showed the FMZ binding values (fmol/mg) from the left (surface) to the right (layer VI) across the entire cortex. To compare the histograms of the spiking and nonspiking cortex from the same patient, the corresponding two curves were displayed in the same plot. Mean histograms for trauma control (n = 5), spiking (n = 12), and nonspiking cortices (n = 12) were generated by calculating the mean value for each pixel in the histograms.
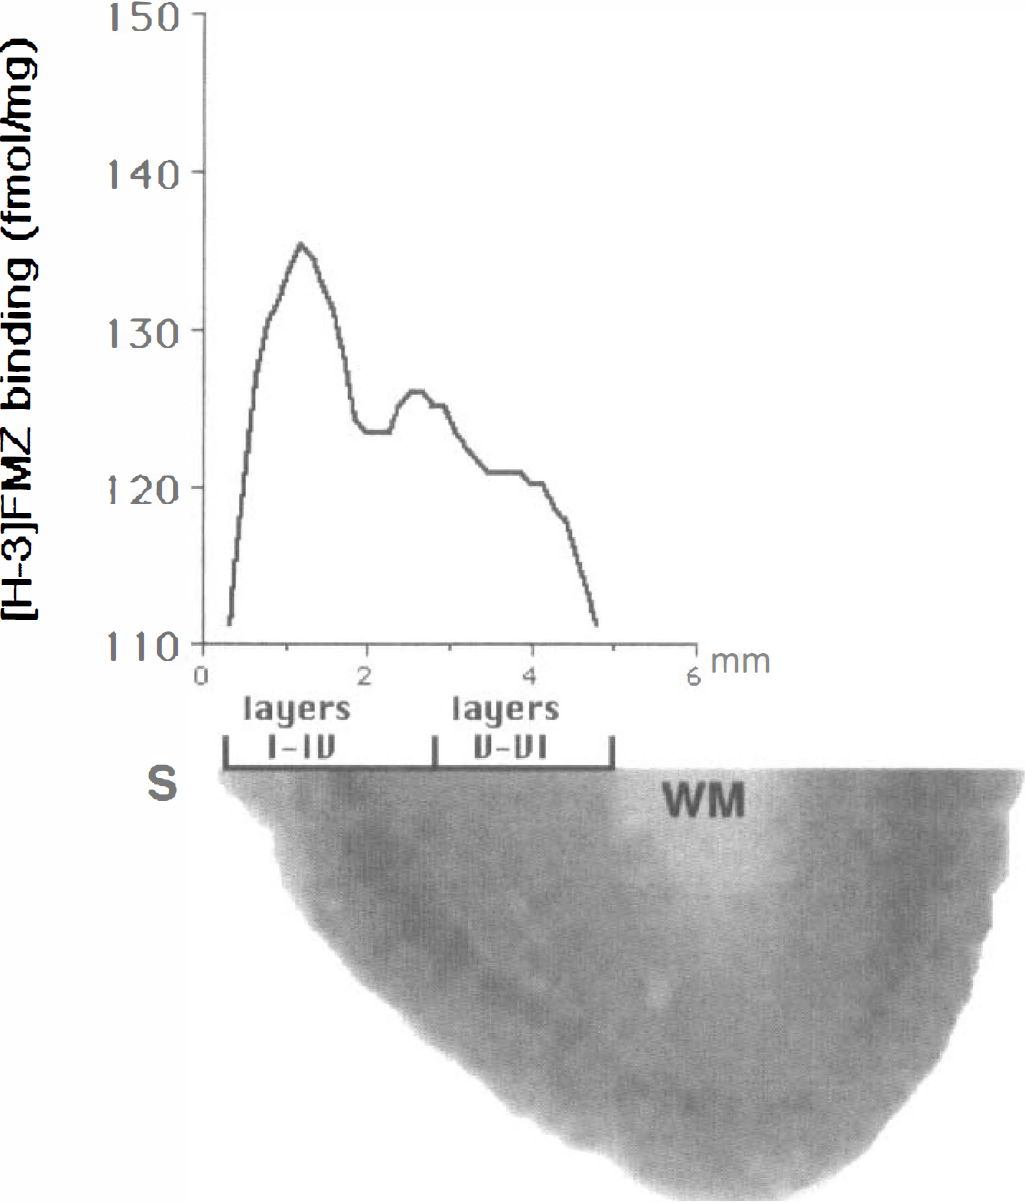
[3H]-flumazenil (FMZ) autoradiogram of a histologically normal human temporal cortex and optical density histogram of the cortical layers. The cortical surface (S) and the white matter (WM) were designated as the “start” (0 mm on the × scale) and “end” points (~6 mm) of the histogram. Cresyl-violet staining of the tissue was used to identify the border between layers IV-V. The largest peak of FMZ binding is observed in layers III-IV, and a smaller peak is apparent between layers IV-V.
Histology
Cortical tissue blocks from the same location as tissue blocks used for the in vitro FMZ binding study were fixed in 10% buffered formalin for 24 to 48 hours. The sections were stained with hematoxilin and eosin, cresyl-violet, Luxol fast-blue, and glial fibrillary acidic protein antibody. The cortical layers were identified by light microscopy using cresyl-violet staining. Neuronal cell density in the cortex was graded by a modification of the scale described by Watson et al.(1996) for hippocampus (Table 1).
MRI and pathological findings in 38 patients
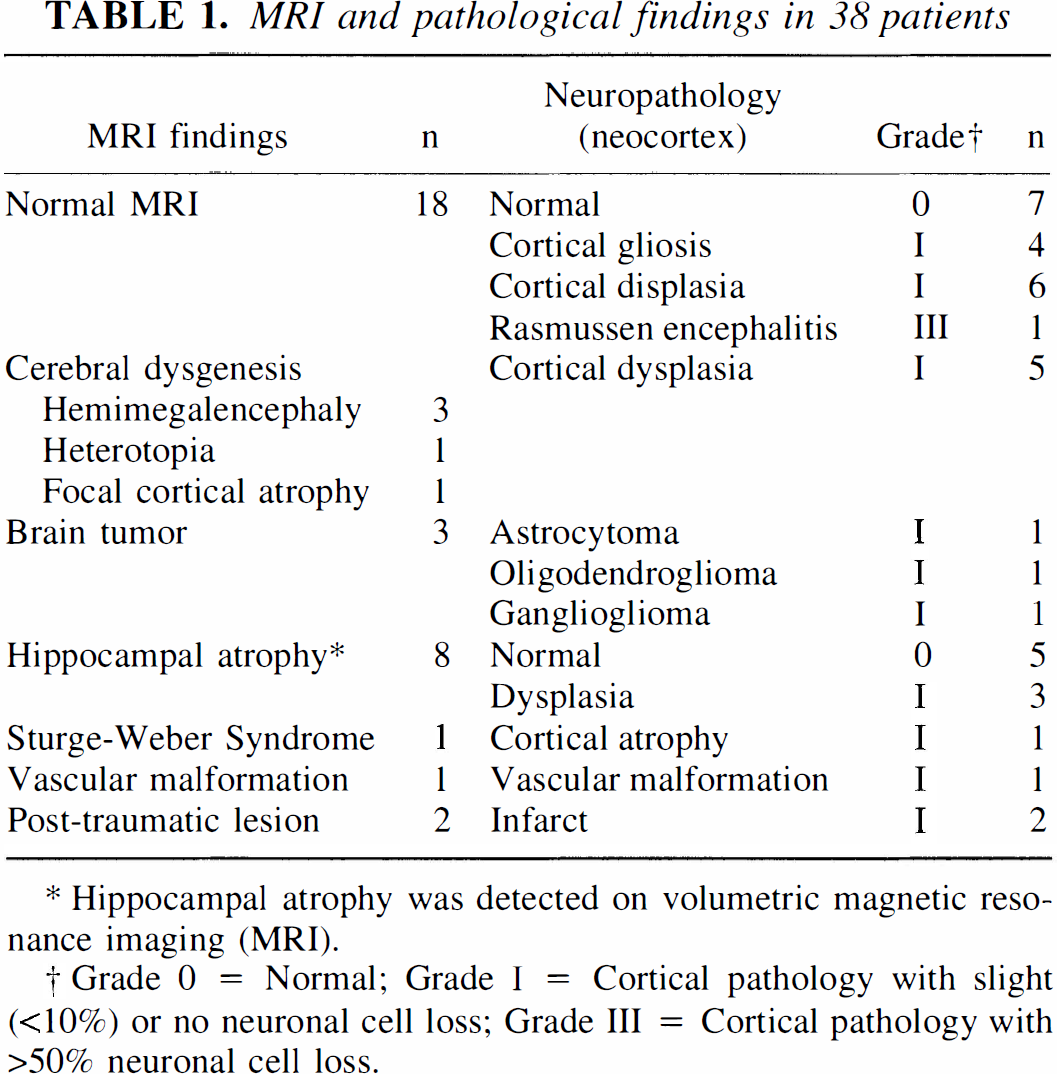
Hippocampal atrophy was detected on volumetric magnetic resonance imaging (MRI).
Grade 0 = Normal; Grade I = Cortical pathology with slight (<10%) or no neuronal cell loss; Grade III = Cortical pathology with>50% neuronal cell loss.
In vivo FMZ binding studies
Nineteen of 38 patients (10 of 12 patients with both spiking and nonspiking tissue) had FMZ PET before the epilepsy surgery. PET studies with the tracer FMZ were performed using the Siemens/Cn EXACTIHR whole body positron emission tomograph located at Children's Hospital of Michigan, Detroit. This scanner has a 15-cm field of view and generates 47 image planes with a slice thickness of 3.125 mm. The reconstructed image in-plane resolution obtained is 6.5 ± 0.35 mm at full-width-at-half-maximum and 7.0 ± 0.53 mm in the axial direction (reconstruction parameters: Hanning filter with 0.20 cycles/pixel cutoff frequency). Attenuation correction was performed on all images by applying the SIEMENS/Cn reconstruction software using data from a 15-minute transmission scan of the head.
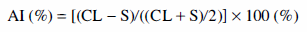
A complete drug history of all patients was obtained before the examination, and none of the patients received benzodiazepines within 6 weeks before PET scan. A venous line was established for tracer injection. Children not able to remain still during the scanning phase were sedated with chloral hydrate (50 to 100 mg/kg by mouth) or nembutal (3 mg/kg intravenously). Children who needed sedation were fasted for 4 hours before the PET procedure. Beginning at the time of injection, a 60-minute dynamic PET scan of the brain was performed (sequence: 4 × 30s, 3 × 60s, 2 × 150s, 2 × 300s, 4 × 600s). Summed images representing activity concentration between 10 and 20 minutes were used to display BDZ-R binding in the brain. Activity values were calculated for cortical ROI corresponding to spiking and the contralateral homotopic region determined by ECoG (Fig. 2). For the assessment of cortical asymmetries in FMZ binding, we calculated an asymmetry index (AI) as follows:
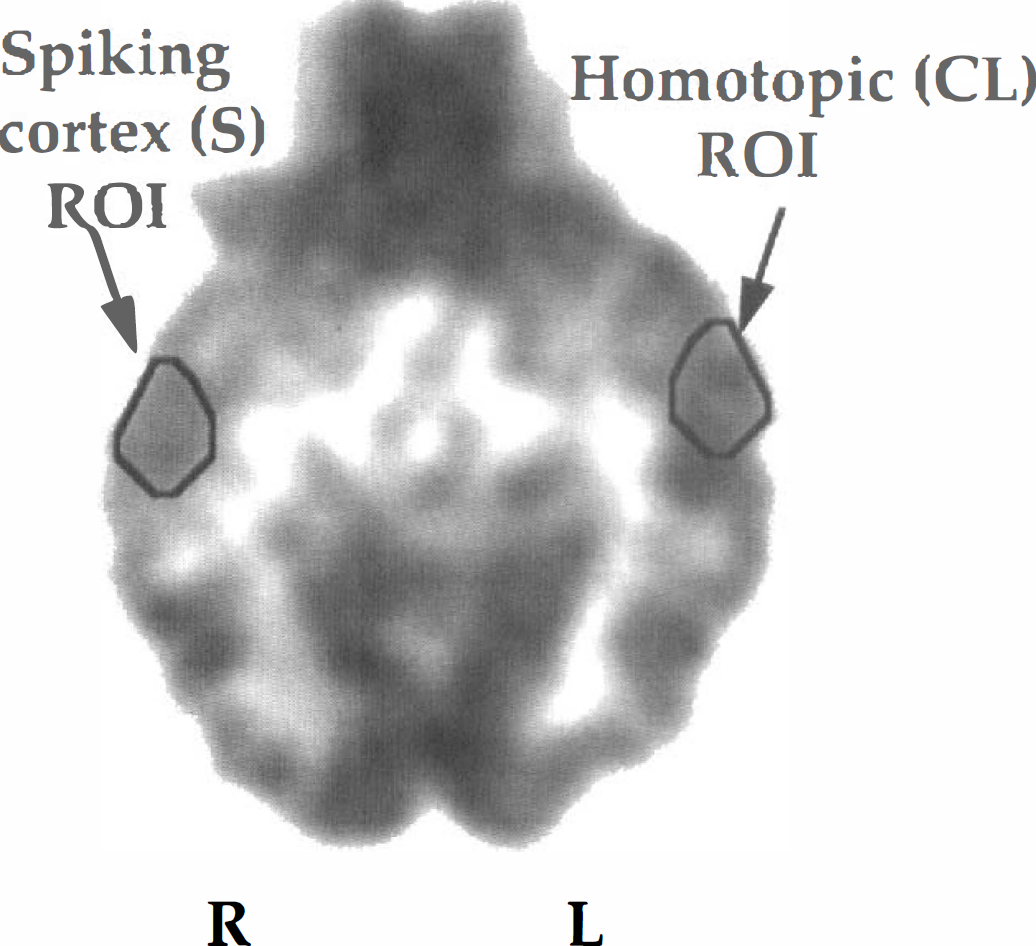
Flumazenil (FMZ) PET image of a patient with right temporal lobe epilepsy. Regions of interest were drawn on axial sections of FMZ PET images for cortical areas showing at least 10 spikes/min during intraoperative electrocorticography (S) and for homotopic areas, contralateral to the spiking cortex (CL). ROI, region of interest.
For statistical analysis, paired t-test, one-way analysis of variance, and Pearson's correlation tests were used, where indicated, using SPSS software (SPSS Inc. Chicago, IL, U.S.A.), P < .05 was considered as significant.
RESULTS
Histology
The histology findings of the 38 spiking cortical samples are detailed in Table 1. Of 12 patients, in whom spiking and nonspiking cortices were obtained for comparison, none showed cell loss in the spiking cortex as compared to nonspiking cortex (Table 2). The histology of these 12 paired neocortices was normal in four spiking and in seven nonspiking cortices, the abnormalities were restricted to the spiking cortex in three cases (two dysgenesis, one tumor). In the other five patients both spiking and nonspiking cortex was histologically abnormal (four dysgenesis, one white matter gliosis).
MRI and pathological findings in 12 patients with spiking and nonspiking tissue specimens
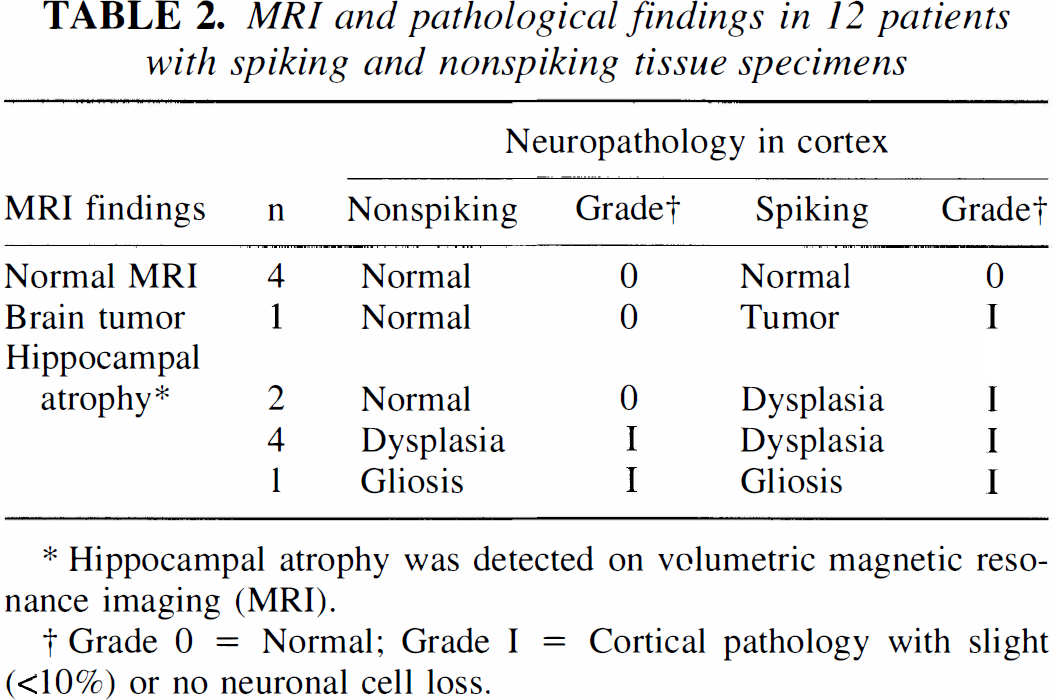
Hippocampal atrophy was detected on volumetric magnetic resonance imaging (MRI).
Grade 0 = Normal; Grade I = Cortical pathology with slight (<10%) or no neuronal cell loss.
Eleven of 12 patients had no neocortical magnetic resonance imaging abnormality. However, 7 of 12 patients had hippocampal atrophy on volumetric magnetic resonance imaging measurements, and 1 had tumor.
In vitro BDZ-R studies
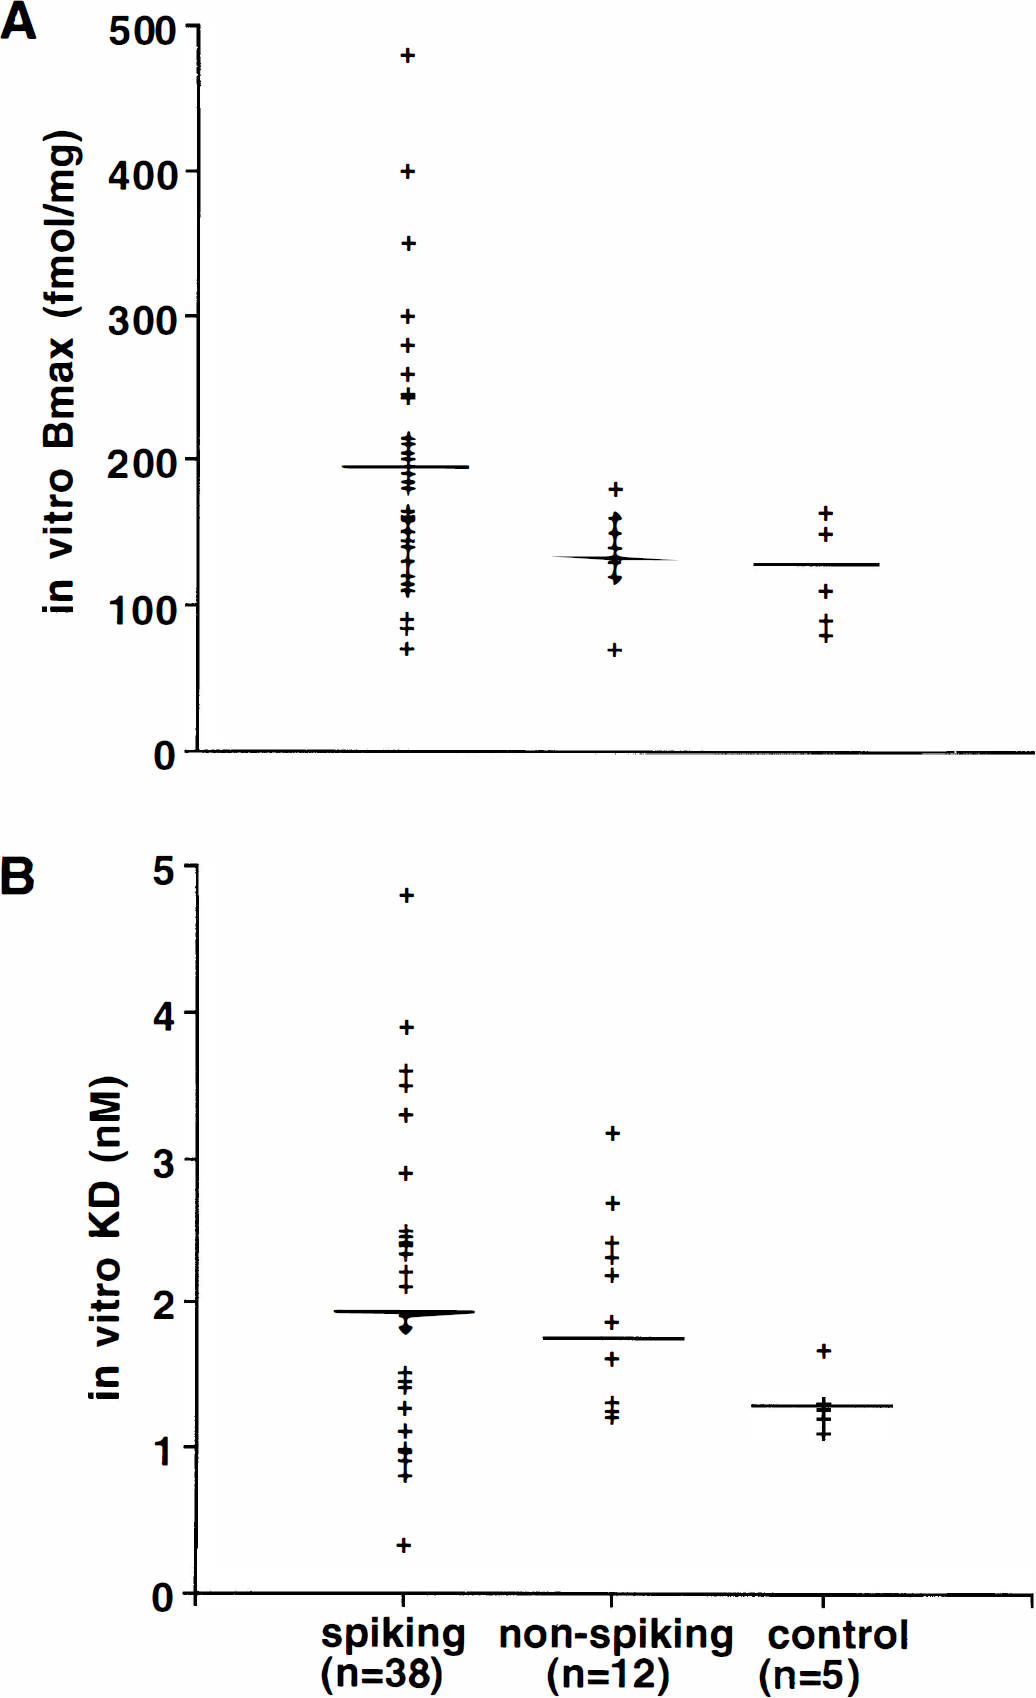
The mean Bmax was significantly higher in the 38 spiking tissue samples as compared to the 12 nonspiking samples (P = .012). However, the difference between the spiking and trauma control tissue did not reach statistical significance due to the small number of control specimens (n = 5; P = .06; Fig. 3A). No statistically significant differences were found in values of KD between the spiking, nonspiking, and control tissues (P = .35; Fig. 3B). However, the paired comparison of the spiking and nonspiking samples for 12 subjects, in whom both were available, showed significantly higher Bmax and KD values in the spiking tissue (P = .0047 and P = .037, respectively).
Correlation between KD and Bmax values and clinical variables
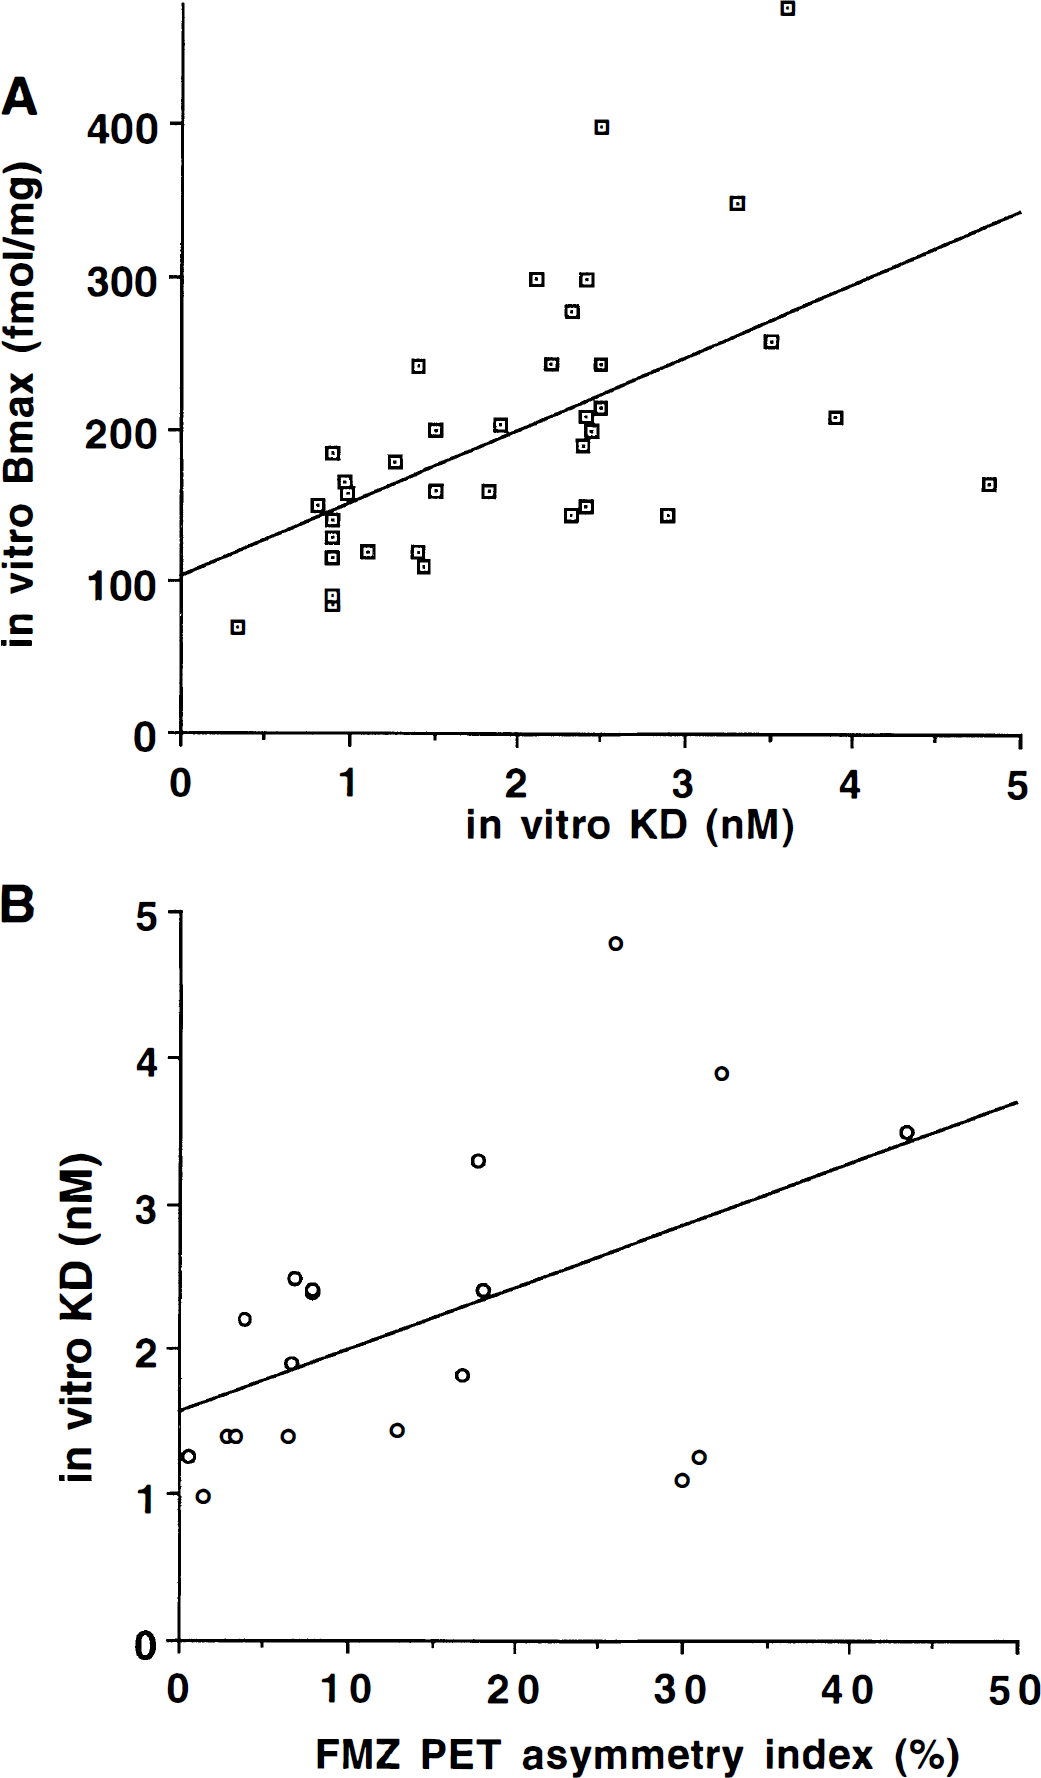
A significant positive correlation was found between KD and Bmax values of the spiking tissue (n = 38, r = 0.55; P < .0001) (Fig. 4A). In other words, tissues with higher receptor number had lower affinity for FMZ. Furthermore, the slope of the regression line (slope = 0.44) indicates that the KD increases approximately twofold for a onefold increase in Bmax. There was no significant correlation between KD and Bmax values of the nonspiking tissue (n = 12, r = 0.139, P = .675).
A small positive correlation was found between the duration of epilepsy and the KD values of the spiking cortex (n = 38, r = 0.34; P = .034; not shown). No correlation was found between the duration of epilepsy and Bmax, (r = 0.005 P = .97; not shown) as well as between the seizure frequency and KD (r = -0.02; P = .88) or Bmax (r = 0.15; P = .40) values.
Comparison of in vivo versus in vitro FMZ binding data
Fifteen of 19 patients who had FMZ PET studies showed decreased binding by visual analysis in the region of the resected spiking tissue. A significant linear correlation was found between the AI of the in vivo FMZ binding and in vitro KD of spiking cortex (r = 0.52, P = .02)(Fig. 4B). No correlation was found between the AI of FMZ binding and the corresponding in vitro Bmax values of the spiking areas (r = 0.03; P = .89).
Laminar distribution of BDZ-R density in the human neocortex
The histograms for each of the five control cortices showed a similar laminar pattern of BDZ-R distribution which is shown in the averaged histogram for the group (Fig. 5A). The highest receptor density found in the first peak on the histogram was located in the pyramidal layer III and in the superficial part of layer IV as identified by cresyl-violet staining. The second peak on the histogram represented relatively high BDZ-R binding located in the cortical pyramidal layer V.
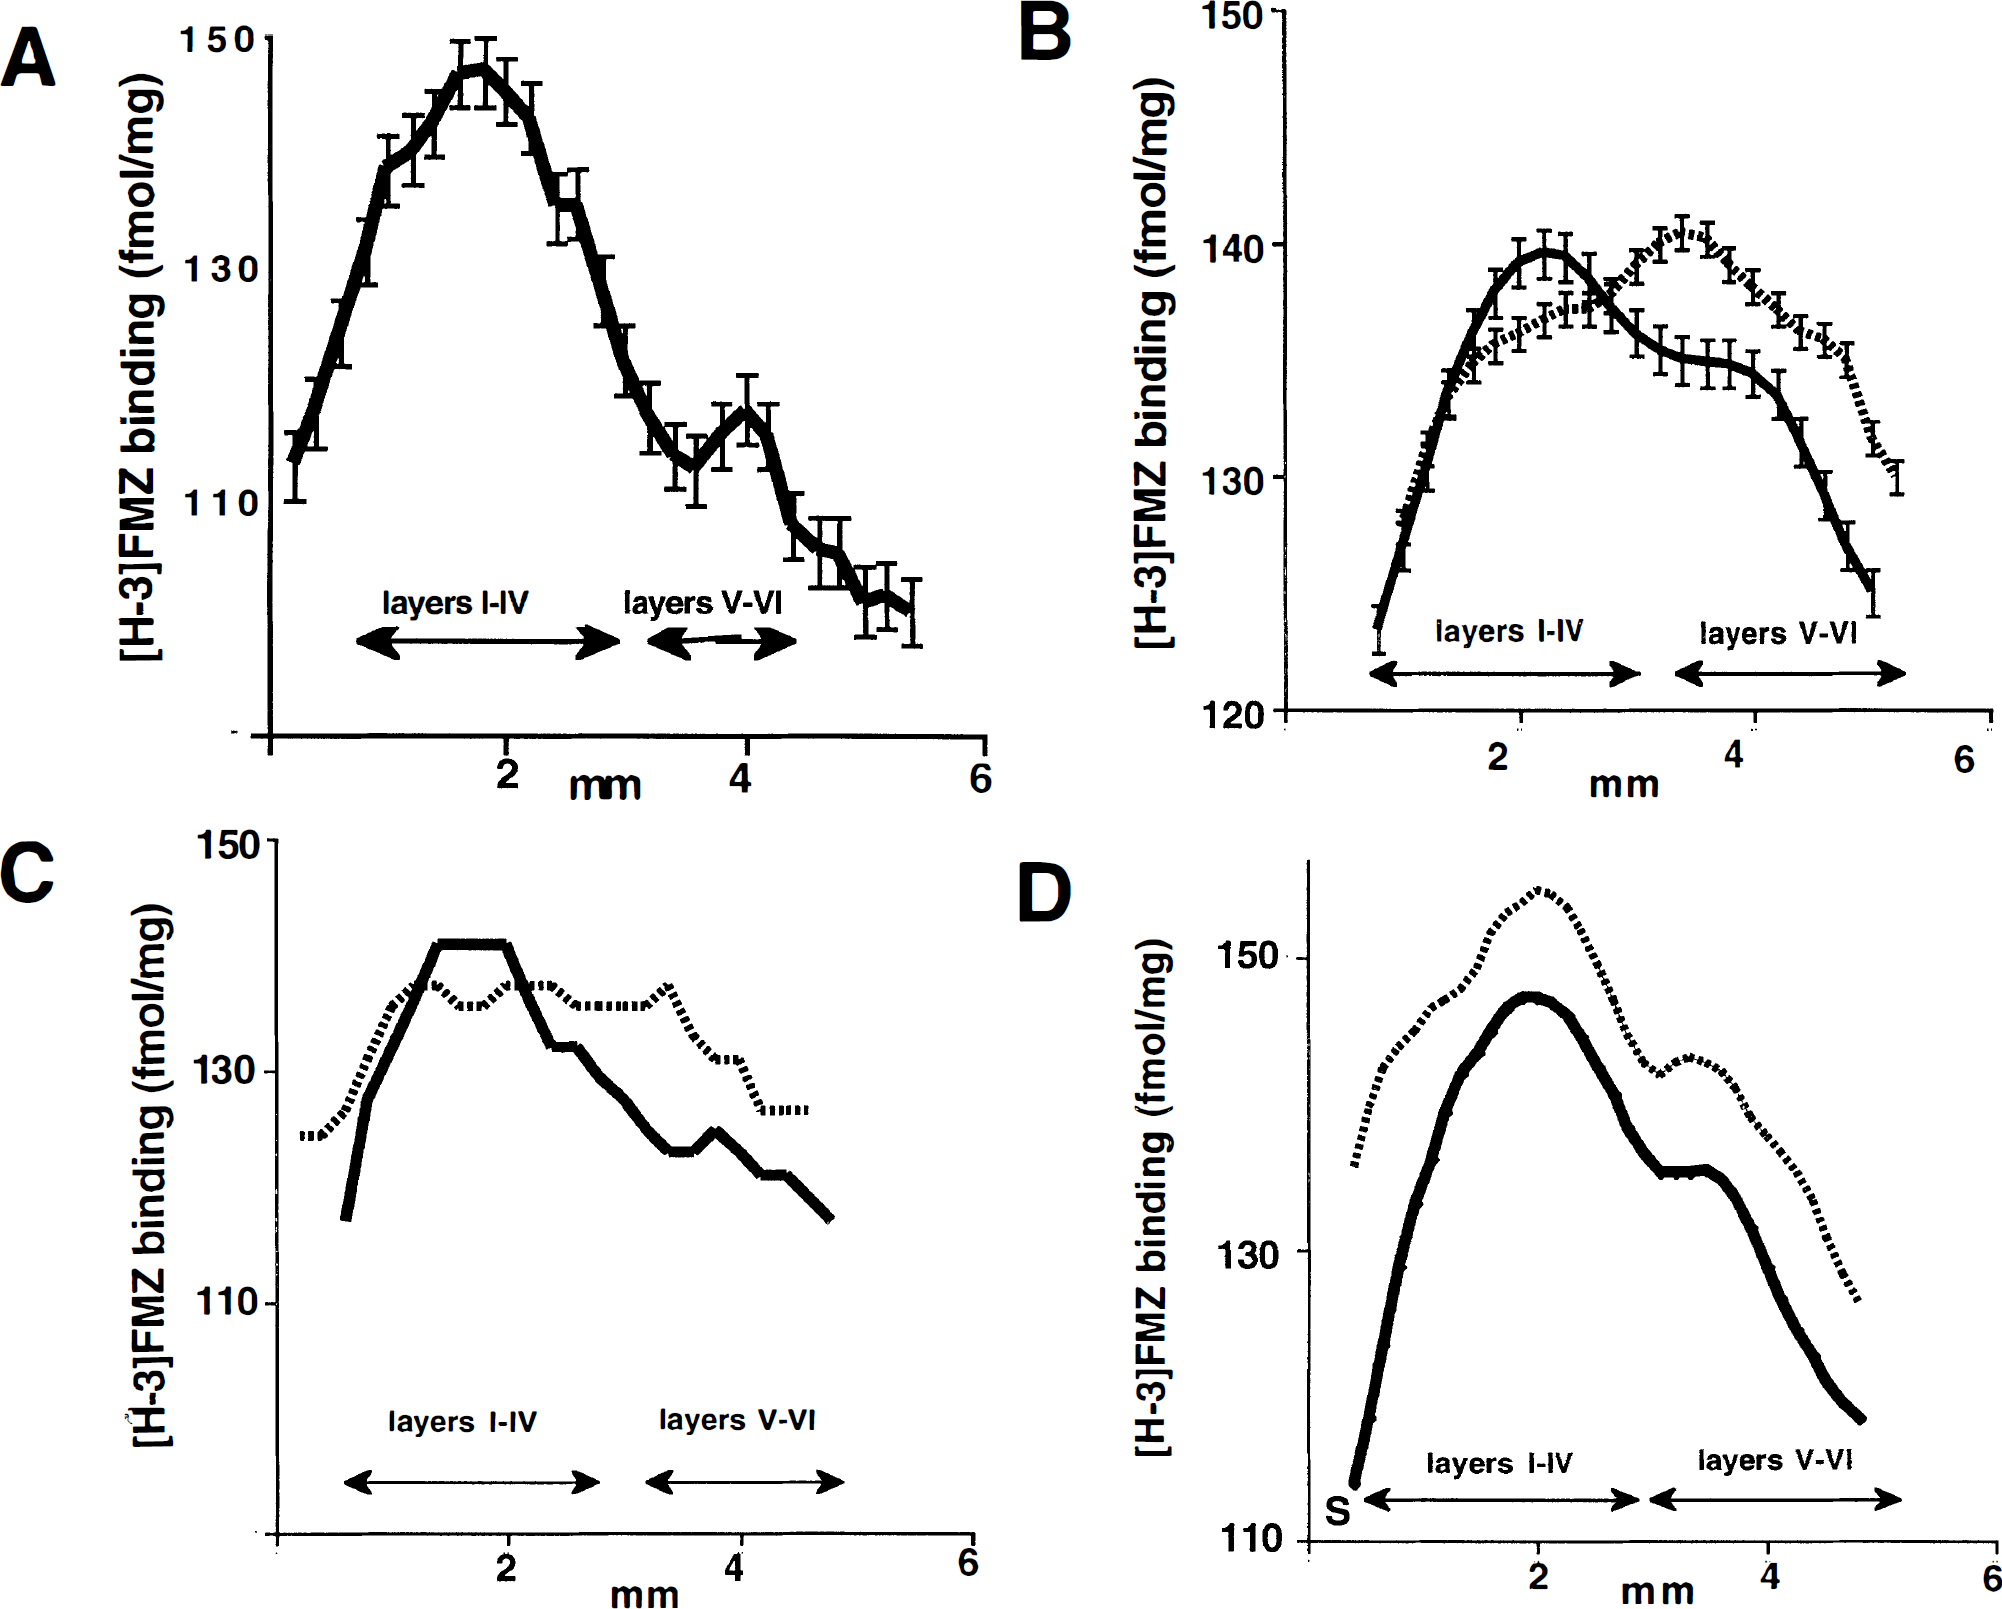
Cortical laminar distribution of in vitro [3H]-flumazenil (FMZ) binding. A histogram of the optical density through the cortical layers (from brain surface to white matter) of the FMZ autoradiogram (5 nmol/L concentration) for each subject was obtained. Mean histograms were generated for each group by taking the mean for each pixel, and error bars designate the standard deviation. Cresyl-violet staining of the tissue was used to identify cortical layers.
A similar laminar pattern of FMZ binding was found in all 12 nonspiking cortices as found on the averaged histogram (Fig. 5B), although this curve appears to be smoother than the averaged histogram of the controls because of the higher number of cases used for averaging. In contrast, the binding distribution of the spiking cortex was distinctly different from the distribution of corresponding nonspiking or control cortex in all 12 patients. The averaged histogram of 12 spiking cortices showed a lower FMZ binding in layers I-IV and a higher binding in layers V-VI (Fig. 5B). The receptor binding in layers V-VI was higher in the spiking tissue than in the nonspiking tissue in all individual cases.
In addition, the laminar distribution of FMZ binding showed two different patterns in spiking cortex. In 6 of 12 patients, the FMZ binding histograms showed lower binding in the I-IV and higher in the V-VI cortical layers compared to nonspiking cortex (Fig. 5C). In contrast, in the remaining 6 patients the distribution of receptor binding showed the same pattern found in the nonspiking and control cortices (Fig. 5D). However, the histograms of spiking cortices were shifted upwards compared to nonspiking cortex, indicating higher receptor binding in all layers. Moreover, there was no relationship between the pattern of laminar distribution and histologic findings. In both groups, histology showed pathologic changes in four subjects and was normal in two.
DISCUSSION
Methodological considerations
In this study we accepted ECoG as the gold standard to study the relationship between the electrophysiologic assessment of epileptogenesis and in vitro or in vivo receptor binding. It has been shown that removal of the most frequently spiking areas defined either by scalp-recorded interictal EEG or by intraoperative ECoG results in a good postoperative outcome in most cases (Sammaritano et al., 1987; McBride et al., 1991). Thus, although the sensitivity and specificity of ECoG is inferior to invasive ictal EEG for defining the epileptogenic region, ECoG was shown to be feasible for the differentiation between epileptogenic and nonepileptogenic cortex.
Consistent with previous studies (Sherwin et al., 1986, Olsen et al., 1992), there was no significant difference between the mean KD of the epileptogenic neocortices and control tissue. This group comparison showed considerable interindividual variation of the cortex affinity and thus was insensitive to possible changes in the KD parameter. However, our paired comparison of spiking and nonspiking cortex from the same patients was more sensitive than previous studies that used nonspiking tissue from different subjects. In the intrasubject comparison, differences arising from the preparation methods, different anatomical locations, underlying mechanisms of epilepsy, age, duration of epilepsy, seizure frequency, and medication are minimized. This approach of detecting focal cortical binding abnormalities is also more comparable to the in vivo methods of analysis of FMZ binding where abnormal binding is based on the comparison of surrounding and contralateral homotopic cortical regions instead of using interindividual comparison.
Laminar distribution of FMZ binding
The spiking cortex showed a higher receptor density in the cortical layers V-VI in all patients compared to nonspiking cortex. Cortical layer V contains neurons with appropriate membrane properties, intralaminar connections, neurotransmitter systems, and axonal outputs to generate highly synchronized activity (Gutnick et al., 1982; Connors, 1984, 1998; White et al., 1994; Castro-Alamancos et al., 1996). This layer initiates synchronized bursting when GAB A-mediated inhibition is suppressed (Chagnac-Amitai and Connors, 1989). In addition, a localized selective loss of GABAergic innervation in layer V of motor cortex in alumina gel-induced model of focal epilepsy was reported in monkeys suggesting that this process can have a causal role in the development of seizure activity (Ribak et al., 1979; Houser et al., 1986). Thus, the present finding of increased Bmax in layers V-VI suggests there may be impaired GABAergic innervation (Spreafico et al., 1998) resulting in a compensatory increase of BZD-R in the human epileptogenic neocortex.
In addition to the increase of BDZ-R in the layers V-VI (Fig. 5B to Fig. 5D), there was a significant increase in Bmax for all layers of spiking neocortex compared to the nonspiking cortex (Fig. 3A and Fig. 5D). This finding is consistent with in vitro data from animal models of partial epilepsy(Ross and Craig, 1981; Booker et al., 1986; Craig and Colasanti, 1986; Ben Attia et al., 1992) as well as from human neocortex (Burdette et al., 1995) showing increased Bmax in epileptic foci. This finding, however, was only statistically significant in the cortical layers V-VI (Burdette et al., 1995). It was suggested previously by several investigators that the increase of GABAA receptor density in the epileptic focus might be the result of postsynaptic receptor upregulation due to denervation (Ross and Craig, 1981; Ben Attia, 1992). This could be a primary decrease of cortical GABA level, as suggested in studies showing a reduction of GAD activity of the epileptic cortex (Ribak et al., 1979,1989; Houser et al., 1986; Esclapez et al., 1989). This notion is supported further by the finding of increased Bmax and simultaneous decreased GAD activity in epileptic cortex of cobalt induced focal epilepsy in rat (Craig and Colasanti, 1986).
Possible mechanism of a decreased in vivo FMZ binding
The finding of higher Bmax values in epileptogenic cortex compared to nonspiking appears to be a paradoxical finding because in vivo FMZ binding studies show a decrease in the epileptic focus(Savic et al., 1988). One would expect that a higher Bmax would result in higher FMZ binding in vivo. However, we have shown that there is a significant correlation between the Bmax and KD values (Fig 4A), while there is no such correlation in nonspiking tissue (data not shown). Furthermore, examination of the slope of the regression line reveals that for a onefold higher Bmax value, the KD is approximately twofold higher. In other words, higher Bmax values in spiking tissue are associated with greater decreases in the affinity of FMZ for the receptor. Therefore, the observed decrease of in vivo FMZ binding may result from reduced affinity of FMZ for the receptor. This would suggest that the affinity of FMZ for the receptor, rather than the number of binding sites in the tissue, is the determining factor causing decreased FMZ binding in the epileptogenic cortex observed with PET in vivo.
In addition, our in vitro results are in contrast with PET findings of decreased in vivo Bmax in epileptogenic regions (Savic et al., 1988,1998). However, several differences between the in vitro and in vivo approach of Bmax and KD estimation must be considered when comparing these findings. Using PET imaging, Bmax and KD values are estimated from Scatchard analysis using only two points. Because of the paucity of the data, the standard deviation of both parameters, especially that of KD, increases. Very large coefficients of variation for KD were reported, indicating the limited reliability of estimation of KD (Abadie et al., 1992). Furthermore, based on some previous in vivo studies (Savic et al., 1988; Delforge et al., 1995), it was assumed that KD is a constant parameter in epilepsy, and the observed binding alteration is the consequence of the altered receptor density.
The correlation between the KD and Bmax of the epileptic cortex in our study indicates that these parameters are not independent. A similar correlation was previously found between in vivo measured Bmax and KD in normal cortex (Millet et al., 1995; Delforge et al., 1995), but no in vitro correlation has been reported. Although the cause of this correlation in normal conditions is uncertain, in epileptic cortex the increased Bmax can be considered as a result of a compensatory mechanism induced by decreased GAB A-mediated inhibition (e.g., due to decreased affinity). The value of the regression coefficient for this correlation suggests that this compensation is disproportionate with the affinity decrease. Thus, it can be concluded from our in vitro findings that decreased receptor affinity is an alteration that can lead to reduced BZD-R binding in vivo even when a compensatory Bmax increase occurs. The correlation between in vitro KD of the spiking cortex and the degree of decreased in vivo FMZ binding of the corresponding spiking area compared to the contralateral homotopic region supports this assumption. Considering the multifactorial nature of epileptogenesis, several other, still unknown factors are likely to contribute to altered GABAA-BDZ-R function (McDonald et al., 1991). Furthermore, the positive correlation between the duration of the epilepsy and the KD values suggests that repeated seizures can be associated with a progressive decrease of receptor affinity.
Our findings suggest that the observed changes in BZD-R binding in epileptogenic neocortex cannot be explained simply by cell loss (Babb et al., 1984 a;b) or by other histopathologic changes because alterations of binding parameters and receptor redistribution occurred with the same frequency in epileptic cortices with normal as well as with abnormal histology. Therefore, functional receptor changes can occur even without apparent morphologic alteration of the cerebral cortex. This is supported by recent in vivo BZD-R binding studies showing the occasional reversibility of altered BZD-R binding after either drug treatment (Staedt et al., 1995) or epilepsy surgery (Savic et al., 1998).
Footnotes
Abbreviations used
Acknowledgments
The authors thank Galina Rabkin, CNMT, Teresa Jones, CNMT, Ben Lathrop, CNMT, and Mei-li Lee, MS, for their expert technical assistance in performing these studies.